

Translate this page into:
Electrochemical evaluation of cephalothin as corrosion inhibitor for API 5L X52 steel immersed in an acid medium
⁎Corresponding author at: Departamento de Materiales, Área Ingeniería de Materiales, Universidad Autónoma Metropolitana-Azcapotzalco, Apartado Postal 02200, México D.F., Mexico. Tel.: +52 (55) 53 18 94 72; fax: +52 (55) 53 18 90 87. mepp@correo.azc.uam.mx (Manuel Palomar-Pardavé)
-
Received: ,
Accepted: ,
This article was originally published by Elsevier and was migrated to Scientific Scholar after the change of Publisher.
Peer review under responsibility of King Saud University.
Abstract
The corrosion inhibition efficiency, η, of sodium (6R,7R)-3-[(acetoxy)methyl]-8-oxo-7-[(2-thienylacetyl)amino]-5-thia-1-azabicyclo[4.2.0]oct-2-ene-2-carboxylic acid, cephalothin, was evaluated in the system API 5L X52/1 M HCl, using electrochemical impedance spectroscopy and SEM analysis. The results showed that the inhibition mechanism involves blockage of the steel surface by the inhibitor molecules through a Langmuir-type adsorption process. The studies to determine the durability where the inhibitor remained effective showed that, at stagnant conditions, the η was maintained over 92% for up to 600 immersion hours at 50 ppm, reaching the best corrosion efficiency when temperature was 25 °C.
Keywords
Electrochemical techniques
Corrosion inhibitor
Organic compounds
Adsorption

1 Introduction
Carbon steels are widely used throughout the petroleum industry, including at the production, transport and storage stages. Although their corrosion resistance is limited, these materials are preferred to others because of economic considerations and the fact that their corrosion falls into general attack (Heydari and Javidi, 2012). The API 5L X52 steel is one of the most employed materials for pipelines construction due to its overall mechanical resistance; however, it is exposed to the different aggressive environments found in the petroleum industry such as acid media, including variable chloride concentrations. It is therefore mandatory to protect all components built from the corrosive environment. There are various methods for corrosion abatement concerned with diminishing the rate of attack; hence, this work addresses the corrosion inhibitors (Olvera-Martinez et al., 2013). Recent literature leads to establishing that the most effective and efficient inhibitors are the organic compounds comprising π bonds, P, S, N, and O heteroatoms, and inorganic compounds, such as chromate, dichromate and nitrite (Şahin et al., 2008; Samiento-Bustos et al., 2008). Many of these compounds exhibit several negative effects to the environment (Paustovskaya, 2000). Thus, the development of novel corrosion inhibitors, non-toxic and synthesized from inexpensive natural sources, has been considered a strategic, environmental and economically plausible route (Gece, 2011). Some of the features just stated can be found in various drugs (Raja and Sethuraman, 2008; Espinoza-Vázquez et al., 2014a), which when added to their potential application as biocides to fight bacterial corrosion (Gece, 2011; Golestani et al., 2014), make them eligible candidates to replace traditional, unifunctional corrosion inhibitors. The cephalothin is a first generation cephalosporin antibiotic useful for preventing diverse infections, including those of the respiratory and urinary tract. Its molecular structure, see Fig. 1, comprises π electrons and heteroatoms such as nitrogen, oxygen and sulfur, all of which are thought capable of inducing better adsorption of the molecule onto industrially commissioned steel surfaces. Some first generation cephalosporins were used as corrosion inhibitors; for instance, Raja and Sethuraman (2008) studied first the cephatrexyl inhibition on iron chloride, sulfate and phosphate media. Singh and Quraishi (2010) studied the effect of cephazolin on the corrosion of mild steel in HCl solution: their results showed that the inhibition efficiency increased with inhibitor concentration. Shukla and Quraishi (2010) also evaluated the cephalexin as mild steel corrosion inhibitor in HCl solution, displaying as well increased inhibition efficiency with increasing inhibitor concentration, up to an optimum at 400 ppm, which on consideration of our group’s recent results, is indeed a high concentration (Palomar-Pardavé et al., 2012; Espinoza-Vázquez et al., 2014a,b). The results thus far have indicated that the first generation cephalosporins showed good results for corrosion inhibition of mild steels in chloride media. Therefore, the aim of this work was to determine the effect of other parameters such as temperature, hydrodynamic conditions and concentration to contribute to the study of cephalothin’s corrosion inhibition for mild steel.![Molecular structure of cephalothin: sodium (6R,7R)-3-[(acetoxy)methyl]-8-oxo-7-[(2-thienylacetyl)amino]-5-thia-1-azabicyclo[4.2.0]oct-2-ene-2-carboxylic acid.](/content/184/2019/12/8/img/10.1016_j.arabjc.2015.08.033-fig1.png)
Molecular structure of cephalothin: sodium (6R,7R)-3-[(acetoxy)methyl]-8-oxo-7-[(2-thienylacetyl)amino]-5-thia-1-azabicyclo[4.2.0]oct-2-ene-2-carboxylic acid.
2 Experimental methodology
All solutions were duly prepared with analytical grade reagents and deionized water (resistivity of 18.2 MΩ cm (at 25 °C) and a TOC value below 5 ppb) obtained from a Milli-Q ultrapure water system. An aqueous solution containing 1 M HCl and 0.01 M cephalothin ((6R,7R)-3-[(acetoxy)methyl]-8-oxo-7-[(2-thienylacetyl)amino]-5-thia-1-azabicyclo[4.2.0]oct-2-ene-2-carboxylic acid) was prepared. From this solution aliquots were diluted in 1 M HCl (50 ml) in order to prepare Cephalothin solutions with different concentration (5–200 ppm, mg dm−3). The electrochemical studies were conducted in a typical three-electrode electrochemical cell, using a Ag/AgCl 3 M KCl reference electrode, a graphite rod as counter electrode, and a rotating disk electrode, RDE, of the API 5L X52 steel sample as the working electrode. The rotation speed was controlled via a Pine research instrumentation MSRX module. The steel samples were prepared from rectangular API 5L X52 pipeline steel coupons, having the chemical composition (wt.%) of C: 0.22, Mn: 1.22, Si: 0.24, Ti: 0.04, Cr: 0.16, Nb: <0.05, Cu: 0.19, S: 0.036, Al: 0.032, Ni: 0.14, Mo: 0.06, Fe: balance (Pluvinage and Sedmak, 2009), which after their electrical connection by means of a copper wire, were encapsulated in epoxy resin at room temperature, so as to expose 1 cm2 surface area to the corrosive electrolyte.
Prior to each experiment, the electrodes’ surface was prepared using conventional metallographic methods. Subsequent to cleaning, the electrodes were ultrasonicated in ethanol for 10 min, rinsed with acetone and deionized water and finally, dried in warm air. Before each experiment, the open circuit potential (OCP) was measured to the extent of 2000 s that is considered the corrosion potential (Ecorr) to carry out the EIS and polarization curves. The latter were performed using a Princeton Applied Research VersaSTAT 4 potentiostat–galvanostat, scanning the electrode potential within −300 < Ecorr < 300 mV potential range at 1 mV s−1 scan rate.
The working electrode was immersed in the test solutions, each of the cephalothin aliquots mentioned above and also in 1 M HCl solution, without cephalothin (blank), during 15 min until a steady-state open circuit potential (OCP) was measured, see Section 3.1. Electrochemical impedance measurements (EIS) were performed using the Zahner Zennium electrochemical workstation, with a small sinusoidal perturbation signal of ±10 mV around Ecorr (which was potentiostatically held) within the 106–10−2 Hz frequency range, recording 10 points per decade. The Ecorr per measurement is shown where appropriate, see Tables 1 and 2. The experimental impedance data were obtained for different inhibitors concentrations, from 0, 5–200 ppm, with the hydrodynamic conditions of 0, 40, 100, 500 and 1000 rpm and within the 25–80 °C temperature range. The EIS results were presented through Nyquist plots. The charge-transfer resistance, Rct and the double-layer capacitance (Cdl) values were calculated by fitting an appropriate equivalent electrical circuit (EEC) to the experimental data points of the impedance plots. Moreover, the effect of exposure time of the steel sample to the corrosion media was also evaluated. The resulting surface corrosion morphologies associated with some of the experiments of inhibiting efficiency were obtained by means of SEM using a JEOL JXA-8200 microscope. Each value of inhibition efficiency has been calculated on the basis of three or more corrosion rate determinations (different samples); the error bars shown indicate the associated standard deviation.
C (ppm)
Rs (Ω cm2)
CPEct
CPEmol
η (%)
104 Q (Ω−1 cm−2 sα)
α
Cdl (μF cm−2)
Rct (Ω cm2)
104 Q (Ω−1 cm−2 sα)
α
Rmol (Ω cm2)
0
1.2
6.78
0.8
103.5
30
–
–
–
–
5
2.0
2.48
0.8
42.0
63
–
–
–
52.7
10
1.6
1.16
0.8
27.6
237
5.12
0.8
73
87.3
15
1.6
1.06
0.8
28.6
136
1.50
0.8
77
86.8
20
1.6
1.46
0.8
46.9
229
0.32
0.8
82
86.9
25
1.6
1.79
0.9
59.0
181
1.62
0.9
24
88.0
30
1.7
1.32
0.9
46.7
138
16.8
0.8
36
88.2
50
1.7
1.29
0.9
57.2
264
2.63
0.8
37
88.7
80
1.7
0.45
0.9
17.0
270
1.31
0.9
33
88.9
100
1.7
0.40
0.9
16.1
276
2.54
0.5
34
89.1
200
1.7
0.41
0.9
16.8
288
4.14
0.9
28
89.6
C (ppm)
Rs (Ω cm2)
CPECT
CPEMOL
η (%)
104 Q (Ω−1 cm−2 sα)
α
Cdl (μF cm−2)
Rct (Ω cm2)
103 Q (Ω−1 cm−2 sα)
α
Rmol (Ω cm2)
0
1.1
3.92
0.8
38.1
40
–
–
–
–
5
10.2
1.25
0.8
36.8
144
9.01
0.8
27
71.0
10
10.0
1.93
0.8
40.5
97
9.29
0.7
40
56.6
15
9.8
1.90
0.8
39.6
106
9.81
0.8
53
60.6
20
10.2
1.95
0.8
33.7
107
21.7
0.8
46
60.8
25
10.1
3.04
0.7
32.1
172
14.6
0.7
80
75.6
30
10.0
1.92
0.8
40.2
162
6.72
0.7
73
74.0
50
9.8
1.70
0.8
25.1
162
6.07
0.7
76
74.1
80
10.0
0.91
0.8
15.8
168
0.34
0.8
77
75.0
100
14.6
2.04
0.8
32.6
168
7.13
0.8
78
75.8
200
14.8
2.11
0.8
50.0
168
0.21
0.7
75
75.0
3 Results
3.1 Eocp-time and polarization plots
Fig. 2A shows the experimental variation of the open circuit potential (Eocp) with time, evaluated in the system API 5L X52/1 M HCl with different cephalothin concentrations. It is important to note that a stable Eocp value is reached after 500 s and that as the concentration of cephalothin increases the Eocp value becomes more negative; this same behavior is depicted in the polarization curves as shown in Fig. 2B, and this shift in the potential, due to the presence of the inhibitor on the electrode surface, indicates that the cephalothin is most probably acting as a cathodic inhibitor. Moreover, from these polarization plots it was possible to estimate the corrosion rate (Hurley et al., 2014; Nam et al., 2014) in each case that diminishes as a function of the inhibitor concentration.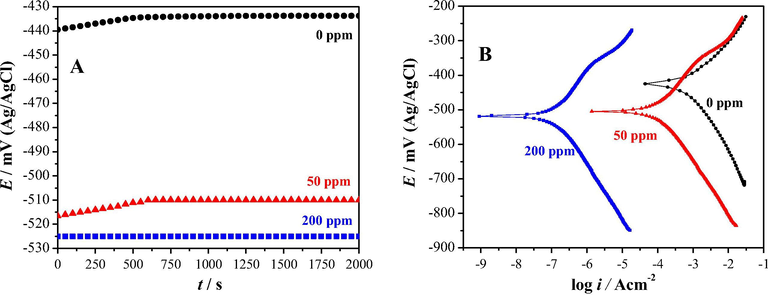
Open circuit potential (Eocp) time variation (A) and polarization plots recorded in the system API 5L X52/1 M HCl with different cephalothin concentrations indicated in the figure in ppm.
3.2 EIS experiments
3.2.1 Influence of the inhibitor concentration and electrode rotation speed
Fig. 3 shows the experimental Nyquist, see Fig. 3A, and Bode, see Fig. 3B, plots recorded for the API 5L X52 immersed in 1 M HCl, at stagnant conditions and 25 °C, adding different inhibitor concentrations. The diameter of the corresponding semicircle (which is usually associated with the charge transfer resistance) increased as a function of the inhibitor concentration, indicating that there was a decrease on the API 5L X52 corrosion rate. When the electrode rotation speed was varied from 40 to 1000 rpm, see Fig. 3C, for 50 ppm cephalothin the diameter of the corresponding semicircle slightly decreased as a function of the electrode rotation speed; the same occured with the respective blanks (0 ppm), see Fig. 3D.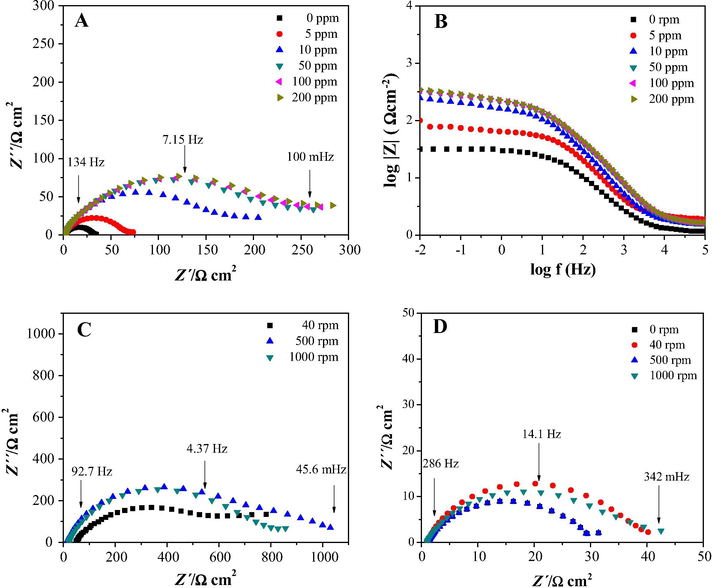
Experimental (A) Nyquist and (B) Bode plots recorded at stagnant conditions and 25 in. the system API 5L X52/1 M HCl varying the cephalothin concentrations as indicated in the figures. (C) Nyquist plots recorded after imposing a cephalothin concentration of 50 ppm and different rotation speeds to the electrode. (D) The blanks (0 ppm) impedance plots evaluated at different rotation speeds.
Considering the characteristic features depicted by the impedance plots recorded in the absence and in the presence of inhibitors, it was decided to use the equivalent electrical circuits (ECC) shown as insets in Fig. 4, in order to simulate the experimentally generated impedance diagrams.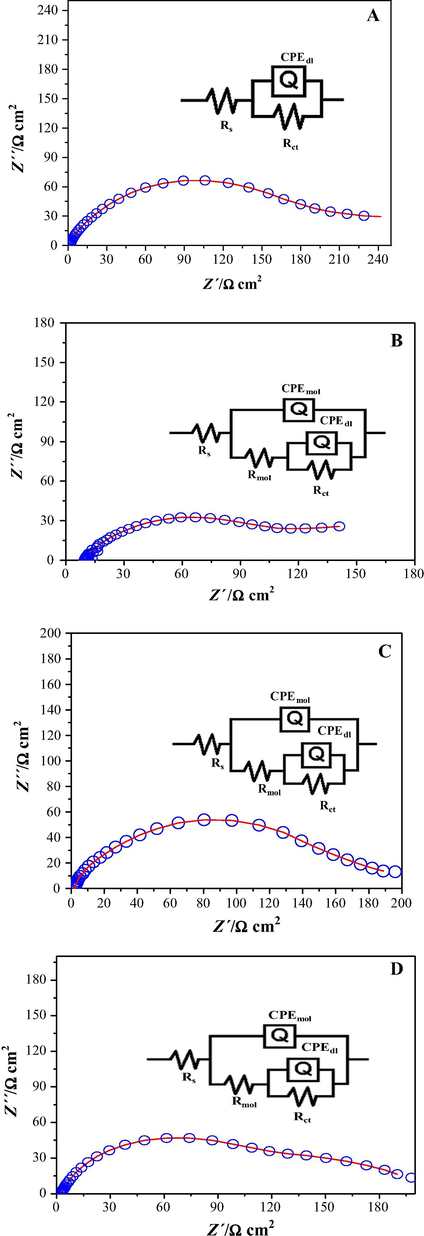
Comparison of experimental EIS data (circles), measured for pipeline steel samples immersed in 1 M HCl + 25 ppm of cephalothin at 25 °C and different rotation speeds: (A) 40, (B) 100, (C) 500 and (D) 1000 and the result of fitting (line), the equivalent electrical circuits used to emulate the impedance spectra are shown in each figure.
Fig. 4 shows some comparisons of experimental impedance plots with the corresponding ones, generated by EECs using the ZView impedance fitting program. It is clear that the measured impedance plots are in accordance with the equivalent circuit used. The circuit consists of the solution resistance Rs, the charge transfer resistance, Rct, the resistance of the organic compound present at the interface Rmol and the constant phase element, CPE. For the description of a frequency independent phase shift between an applied AC potential and its current response, a constant phase element (CPE) is used, which is defined in impedance representation as follows:
From the Bode plots shown in Fig. 5 it is possible to note that there are two time constants coupled, as also noted from the Nyquist plot. The impedance (Z) recorded at low frequency values is higher at 500 rpm, see Fig. 5B, that in static conditions, see Fig. 5A; this indicates that a better corrosion protection is achieved when the rotation rate is increased (Yıldız et al., 2014). The corrosion inhibition efficiency, η, of the cephalothin was calculated from the charge-transfer resistance (Rct) values; see Tables 1, 2, 4 and 5, according to Eq. (3):
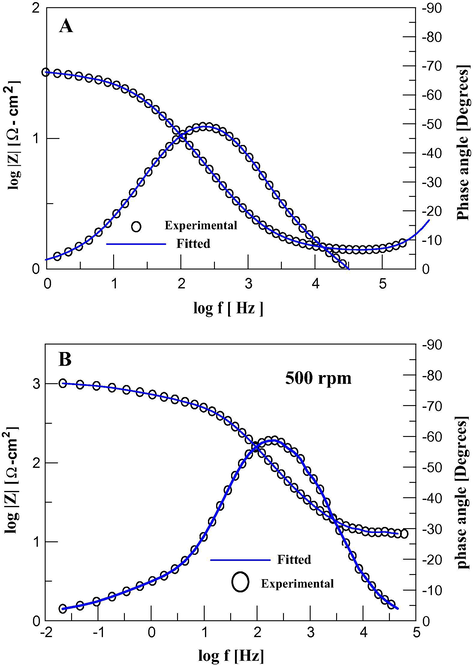
Bode plots recorded in the system API 5L X52/1 M HCl, 25 ppm cephalothin at 25 °C and different rotation speeds: (A) 0 and (B) 500 rpm.
Table 1 shows the summary of the results of the impedance parameters obtained under static conditions; in this case the Rct increased with increasing inhibitor’s concentration, which indicates that the inhibition efficiency increases. These results suggest that an increase in the concentration of the inhibitor’s adsorbed species on the steel surface, increased the charge transfer resistance at the metal interface, simply by blocking the active reaction sites available on the metal, that were formerly susceptible to be corroded (Benabdellah et al., 2012). Furthermore, the values of the electrochemical double layer capacitance, Cdl, diminish with respect to the inhibitor concentration increase. The inhibitor’s adsorption at the metal–solution interface creates a gradual substitution of the water molecules, which were originally adsorbed at the metal surface by the inhibitor molecules (Bochris and Swinkels, 1964; Ouici et al., 2013). Therefore, it can be assumed that the overall current is proportional to the amount of sites available for corrosion that are being blocked by the adsorbates. Therefore, the thickness of the protective surface layer at the metal–solution interface improves notably (Solmaz, 2014). Similar results have been reported when thiophene derivatives were used as corrosion inhibitors (Yurt et al., 2004; Issaadi et al., 2011; Daoud et al., 2014; Yadav et al., 2014).
The same behavior became evident after evaluating the inhibitor at 40 rpm, see Table 2, as compared to the previous case, although the inhibition efficiency was smaller by 9%.
Fig. 6 shows a comparison of the η as a function of the inhibitor concentration for different electrode rotation speeds. The results clearly show that in all cases the η increases as a function of the inhibitor concentration, reaching a maximum value when the inhibitor concentration is greater than 25 ppm. However, when increasing the electrode’s rotation rate to 40 rpm, an important η diminution took place, compared to static conditions; notwithstanding when increasing the electrode’s rotation rate, the η increased until attaining a maximum at 500 rpm, although it did not surpassed the η obtained at static conditions.![Variation of the η of the cephalothin evaluated in the system API 5L X52/1 M HCl, × ppm cephalothin at 25 °C as a function of [cephalothin] at different working electrode’s rotation speed, indicated in the figure.](/content/184/2019/12/8/img/10.1016_j.arabjc.2015.08.033-fig6.png)
Variation of the η of the cephalothin evaluated in the system API 5L X52/1 M HCl, × ppm cephalothin at 25 °C as a function of [cephalothin] at different working electrode’s rotation speed, indicated in the figure.
3.2.2 Thermodynamic analysis
In order to understand the corrosion inhibition mechanism, it becomes necessary to use different adsorption isotherms, i.e. as those given by the Frumkin, Langmuir, and Temkin models, among others (Espinoza-Vázquez et al., 2014b), from which the degree of metal surface coverage with the inhibitor molecules (θ) is related with the inhibitor concentration, C, in solution. For the study of the cephalothin, the best model that describes the interaction inhibitor–metal surface is that of Langmuir’s isotherm for the different rotation rates, see Fig. 7, expressed as Eq. (4) (Zheng et al., 2014):
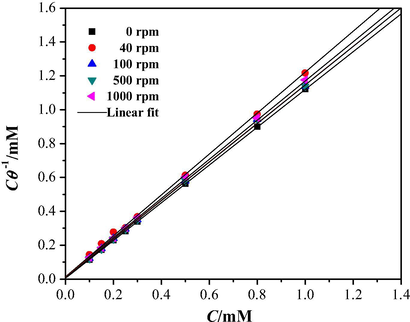
Comparison between the experimental adsorption isotherm (markers) for cephalothin on API 5L X52 steel in 1 M HCl at 25 °C and different rotation speeds, indicated in the figure, with the theoretical model (lines) following the Langmuir model, Eq. (4).
The Gibbs standard free energy of adsorption of the organic inhibitor was estimated by means of Eq. (5) (Deyab and El-Rehim, 2014; Tansug et al., 2014; Wang et al., 2014a,b):
Table 3, summarizes the estimated thermodynamic parameters, from where it can be noted that for all cases the
value is lower than −20 kJ mol−1. According to Yıldız et al. (2014) if
the undergoing process is physisorption and that those above such relative limit of −40 kJ mol−1 means that a chemisorptive process is in control. Therefore, for all the cases considered in this work it is possible to state that electrostatic interaction or weak bonding (i.e. hydrogen bonds-type) between the inhibitor molecules and the metallic surface is occurring through a physisorption process (Tang et al., 2013).
Hydrodynamic conditions (rpm)
ln Kads
(kJ mol−1)
Linear fit
R2
0
5.08
−11.54
C/Θ [mM] = 1.114 C [mM] + 0.0062 [mM]
1
40
4.06
−9.23
C/Θ [mM] = 1.2056 C [mM] + 0.0171 [mM]
0.9986
100
4.29
−9.75
C/Θ [mM] = 1.1336 C [mM] + 0.0136 [mM]
0.9999
500
4.50
−10.22
C/Θ [mM] = 1.1354 C [mM] + 0.0111 [mM]
0.9999
1000
4.06
−9.23
C/Θ [mM] = 1.1531 C [mM] + 0.0171 [mM]
0.9997
3.2.3 Effect of the exposure time on the η
It was thought appropriate to determine how efficient would the inhibitor be at a fixed 50 ppm concentration where the η reached a maximum value regardless of the electrode rotation speed, see Fig. 6; thus, a study was carried out as a function of immersion time for a prolonged period of up to 30 days. Fig. 8 shows the comparison made for different immersion times. It can be seen that for 240 h, a maximum of 800 Ω cm2 was attained, after which the value decreased to 400 Ω cm2.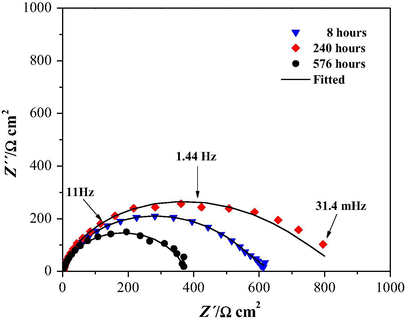
Experimental electrochemical impedance data (markers) and fitted (lines) Nyquist plots, for API 5L X52 steel immersed in 1.0 HCl in the presence of 50 ppm cephalothin, under stagnant conditions and 25 °C, during different immersion times indicated in the figure. The equivalent electric circuit used to obtain the impedance parameters is shown in Fig. 4B.
Table 4 shows the values of the Cdl, Rct and η as a function of the immersion time at a 50 ppm inhibitor concentration. The Rct increased until attaining a maximum value at 168 h immersion; thereafter, it diminished to 765 Ω cm2 but increased again. Fig. 9 shows the η as a function of the immersion time, and it is possible to observe that within the experimental error, the η almost keeps constant, around 95%, regardless of the immersion time.
Immersion time (h)
Cdl (μF cm−2)
Rct (Ω cm2)
η (%)
0
310
30
–
0.5
35
264
89
8
47
653
95
48
54
817
96
120
68
765
96
168
51
983
97
240
82
849
96
432
140
564
95
504
101
382
92
576
77
371
92
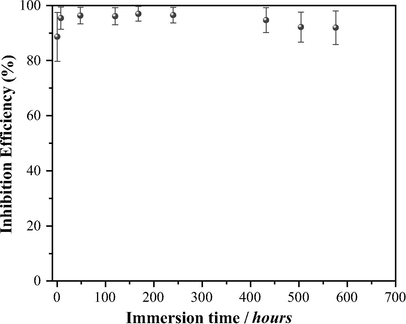
Variation of the cephalothin corrosion η as a function of the immersion time recorded in the system API 5L X52/1 M HCl, 50 ppm cephalothin at stagnant conditions and 25 °C.
3.2.4 Effect of temperature
From the Nyquist diagram shown in Fig. 10, it can be observed the effect of temperature variation while keeping constant the inhibitor concentration at 50 ppm under static conditions on the impedance response of the system. Table 5, summarizes the electrochemical parameters obtained at a constant concentration of 50 ppm at different temperatures.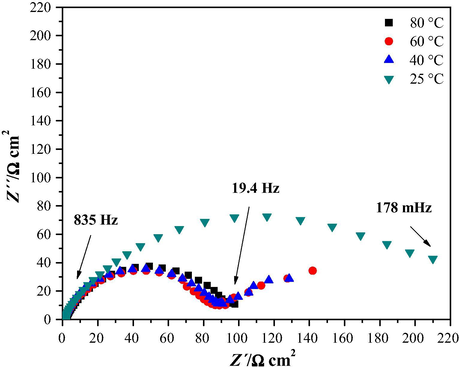
Experimental electrochemical impedance diagrams, Nyquist plots, for the pipeline mild steel immersed in HCl in the presence of 50 ppm cephalothin, under stagnant conditions and different temperatures indicated in the figure.
Temperature (°C)
Rs (Ω cm2)
Ecorr (mV) (Ag/AgCl)
n
Cdl (μF cm−2)
Rct (Ω cm2)
η (%)
25
1.7
−521
0.8
45.2
253
88
30
0.8
−464
0.8
37.4
162
81
35
0.9
−478
0.8
37.6
75
75
40
0.9
−484
0.9
50.1
89
66
45
1.0
−488
0.9
51.8
90
66
50
1.5
−493
0.8
45.9
91
67
55
1.1
−496
0.8
45.0
89
66
60
1.4
−501
0.8
44.3
86
65
65
1.3
−506
0.8
54.5
87
66
70
1.4
−510
0.8
15.8
94
68
75
1.4
−509
0.9
25.8
91
67
80
1.9
−512
0.8
18.0
92
67
Fig. 11 shows the corrosion η variation with respect to the temperature at a constant concentration of 50 ppm and stagnant conditions. It can be observed that from 25 to 40 °C the η diminish up to 66%, after which it becomes practically stable. The temperature at which the best η was obtained was at 25 °C, with a value of 88%.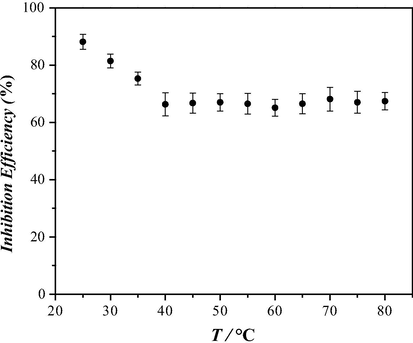
Inhibition efficiency as a function of temperature evaluated in the system at 50 ppm of cephalothin in API 5L X52 steel in 1 M HCl.
3.2.5 SEM analysis
Fig. 12, shows the results obtained through SEM analysis of the surfaces of the sample of the API 5L X52 steel after 48 h immersion at 50 ppm inhibitor concentration in the 1 M HCl medium, see Fig. 12(a) and (b); it can be observed that the surface has been partially attacked, although when compared with the surfaces of steel samples exposed to 1 M HCl without inhibitor, the difference becomes notable, particularly in reference to the morphology obtained, see Fig. 12(c) and (d). Further, surface pits can be easily noted, as indeed similar to those formed in chloride-rich media. In agreement with the observations from the polished material, Fig. 12(d) and (e), it becomes plain that the inhibitor worked correctly since it impeded pits’ formation over the material surface.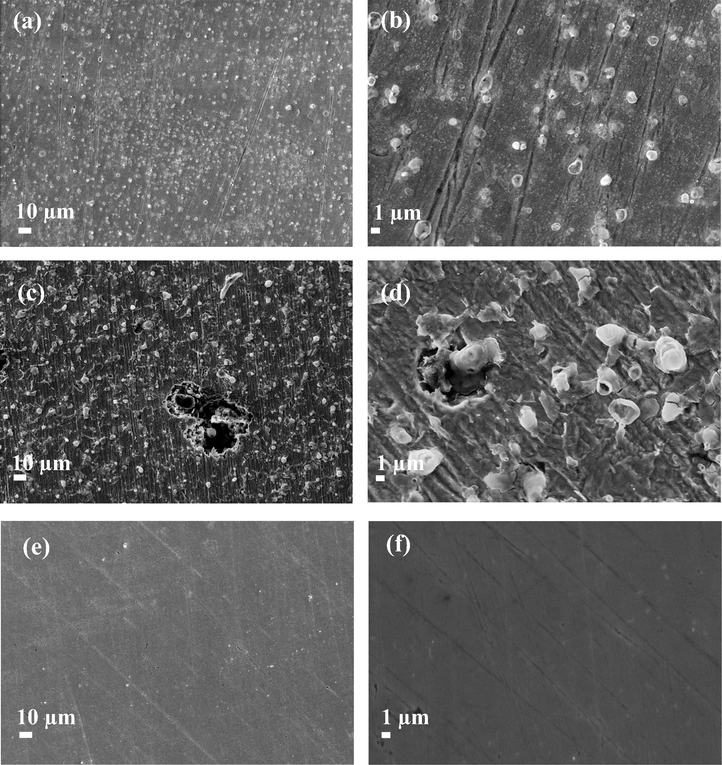
Secondary electron images of the API 5L X52 steel surfaces: (a) and (b) taken after 48 h of immersion in 1 M HCl and 50 ppm of cephalothin, (c) and (d) after 48 h in 1 M HCl and (e) and (f) prior to exposure to the acid medium.
4 Discussion
4.1 Influence of the inhibitor concentration and electrode rotation speed
4.1.1 Inhibitor concentration
From Fig. 5 it is possible to note that, in all cases, the inhibition efficiency increases with concentration until it reaches a maximum value, and most of the inhibitors display this η vs. concentration behavior (Mondal and Taylor, 2014); however, the concentration at which the highest corrosion inhibition is reached depends strongly on the nature of the inhibitor and that is why this sort of plot must be experimentally obtained for each inhibitor. In this respect it is important to mention that the economic viability of a proposed inhibitor depends on the amount that must be used in order to achieve the desired inhibition efficiency effect that regularly must be higher than that 80%. In the present case, the highest η value is reached at 25 ppm that is small enough compared to other cases reported in the literature; for instance, Shukla and Quraishi (2010) evaluated cephalexin and reported an optimum concentration at 400 ppm. In this sense it is relevant to mention that the highest η value is reached when the working electrode surface coverage (θ) is close to 1. From the thermodynamic analysis made, see Section 3.2.2, it becomes plain that the cephalothin molecules adsorb on the steel surfaces following the Langmuir isotherm, which strongly suggest that the principal interaction occurs between the inhibitor molecules and the steel substrate, rather than with the neighboring molecules or the solvent.
4.1.2 Electrode rotation speed
Also, from Fig. 4, it is possible to note that the inhibition efficiency, within the experimental error, is practically constant, and it is higher than 80% for an inhibitor concentration larger than 25 ppm, independent of the electrode rotation speed. This is an important finding because it indicates that the cephalothin molecules remain on the electrode surface even when it rotates at 1000 rpm. Notwithstanding, it is important to state that with a RDE the hydrodynamic conditions imposed at this electrode angular velocity correspond to a non-turbulent flow, which can explain why the inhibition efficiency remains practically constant.
4.2 Effect of temperature
It is notorious that the plot depicting the dependence of the inhibition efficiency with temperature, see Fig. 11, follows quite closely the shape of the dynamic viscosity of water with temperature in 20–100 °C, see Fig. 4, (Mondal and Taylor, 2014); therefore, the increase in the viscosity with lower temperatures diminishes (hindering) the diffusion of cephalothin molecules toward the bulk solution, facilitating its adsorption onto the steel surface and therefore increasing its corrosion protection capacity (η).
5 Conclusions
The electrochemical evaluation of cephalothin was carried out as corrosion inhibitor of the API 5L X52 steel in 1 M HCl medium. The best conditions determined where the inhibitor was more effective were attained at 50 ppm cephalothin and a temperature of 25 °C. The study varying the hydrodynamic conditions helped determine that incrementing the electrode’s rotation rate did not lead to a substantial increment of the η. The studies to determine the durability where the inhibitor was effective showed that the η was maintained over 92% for up to 600 immersion hours. It was found out that the interaction between the metal surface and the inhibitor molecules was through adsorption, physisorption, and in agreement with the Langmuir’s model. Therefore, the cephalothin can well be a corrosion inhibitor candidate applicable to cases where the API 5L X52 steel is exposed to acid media.
Acknowledgments
JIAG is grateful to Programa para el Desarrollo Profesional Docente en Educación Superior of the UAEM for the support for postdoctoral research. AEV, MARR, MEPP and JUC thank the SNI for the distinction of their membership and the stipend received. AEV, MEPP and MARR wish to thank the Department of Materials at UAM-A for the financial support through their registered research projects.
References
- 2,5-disubstituted 1,3,4-oxadiazole derivatives as effective inhibitors for the corrosion of mild steel in 2 M H3PO4 solution. Int. J. Electrochem. Sci.. 2012;7(4):3489-3500.
- [Google Scholar]
- J. Electrochem. Soc.. 1964;111:36.
- The analysis of electrode impedances complicated by the presence of a constant phase element. J. Electroanal. Chem. Interfacial Electrochem.. 1984;176(1–2):275-295.
- [Google Scholar]
- Adsorption and corrosion inhibition of new synthesized thiophene Schiff base on mild steel X52 in HCl and H2SO4 solutions. Corros. Sci.. 2014;79:50-58.
- [Google Scholar]
- Effect of succinic acid on carbon steel corrosion in produced water of crude oil. J. Taiwan Inst. Chem. Eng.. 2014;45(3):1065-1072.
- [Google Scholar]
- EIS evaluation of pantoprazole as corrosion inhibitor for mild steel immersed in HCl 1 M. Effect of pantoprazole, hydrodynamic conditions, temperature and immersion times. Int. J. Electrochem. Sci.. 2014;9(2):493-509.
- [Google Scholar]
- Mild steel corrosion inhibition in HCl by di-alkyl and di-1,2,3-triazole derivatives of uracil and thymine. Mater. Chem. Phys.. 2014;145(3):407-417.
- [Google Scholar]
- Drugs: a review of promising novel corrosion inhibitors. Corros. Sci.. 2011;53(12):3873-3898.
- [Google Scholar]
- Electrochemical evaluation of antibacterial drugs as environment-friendly inhibitors for corrosion of carbon steel in HCl solution. Appl. Surf. Sci.. 2014;308:347-362.
- [Google Scholar]
- Corrosion inhibition and adsorption behaviour of an amido-imidazoline derivative on API 5L X52 steel in CO2-saturated solution and synergistic effect of iodide ions. Corros. Sci.. 2012;61:148-155.
- [Google Scholar]
- Corrosion inhibition of zinc by aqueous vanadate species. J. Electrochem. Soc.. 2014;161(10):C471-C475.
- [Google Scholar]
- Novel thiophene symmetrical Schiff base compounds as corrosion inhibitor for mild steel in acidic media. Corros. Sci.. 2011;53(4):1484-1488.
- [Google Scholar]
- The identification and characterization of organic corrosion inhibitors: correlation of a computational model with experimental results. J. Electrochem. Soc.. 2014;161(10):C476-C485.
- [Google Scholar]
- Rare earth 4-hydroxycinnamate compounds as carbon dioxide corrosion inhibitors for steel in sodium chloride solution. J. Electrochem. Soc.. 2014;161(12):C527-C534.
- [Google Scholar]
- Effects of turbulent flow on the corrosion inhibition properties of 2-mercaptobenzimidazole. Mater. Corros. – Werkstoffe Korrosion. 2013;64(6):522-529.
- [Google Scholar]
- The effect of some triazole derivatives as inhibitors for the corrosion of mild steel in 5% hydrochloric acid. Res. Chem. Intermed.. 2013;39(7):3089-3103.
- [Google Scholar]
- Influence of the alkyl chain length of 2 amino 5 alkyl 1,3,4 thiadiazole compounds on the corrosion inhibition of steel immersed in sulfuric acid solutions. Corros. Sci.. 2012;54:231-243.
- [Google Scholar]
- Some results of a research in the problem “inhibitors of metal corrosion. Toxicology and industrial hygiene”. Protect. Met.. 2000;36(1):89-93.
- [Google Scholar]
- Security and Reliability of Damaged Structures and Defective Materials. Netherlands: Springer; 2009.
- Natural products as corrosion inhibitor for metals in corrosive media — a review. Mater. Lett.. 2008;62(1):113-116.
- [Google Scholar]
- Experimental and theoretical study of the effect of some heterocyclic compounds on the corrosion of low carbon steel in 3.5% NaCl medium. J. Appl. Electrochem.. 2008;38(6):809-815.
- [Google Scholar]
- Effect of inorganic inhibitors on the corrosion behavior of 1018 carbon steel in the LiBr + ethylene glycol + H2O mixture. Corros. Sci.. 2008;50(8):2296-2303.
- [Google Scholar]
- Cefalexin drug: a new and efficient corrosion inhibitor for mild steel in hydrochloric acid solution. Mater. Chem. Phys.. 2010;120(1):142-147.
- [Google Scholar]
- Effect of Cefazolin on the corrosion of mild steel in HCl solution. Corros. Sci.. 2010;52(1):152-160.
- [Google Scholar]
- Investigation of corrosion inhibition mechanism and stability of Vitamin B1 on mild steel in 0.5 M HCl solution. Corros. Sci.. 2014;81:75-84.
- [Google Scholar]
- Novel benzimidazole derivatives as corrosion inhibitors of mild steel in the acidic media. Part I: Gravimetric, electrochemical, SEM and XPS studies. Corros. Sci.. 2013;74:271-282.
- [Google Scholar]
- Corrosion control of copper in 3.5 wt.% NaCl solution by domperidone: experimental and theoretical study. Corros. Sci.. 2014;85:77-86.
- [Google Scholar]
- In situ corrosion characterization of simulated weld heat affected zone on API X80 pipeline steel. Corros. Sci.. 2014;85:401-410.
- [Google Scholar]
- Experimental and quantum studies on adsorption and corrosion inhibition effect on mild steel in hydrochloric acid by thiophene derivatives. Acta Metall. Sin. (Engl. Lett.). 2014;27(1):37-46.
- [Google Scholar]
- Experimental studies of 2-pyridinecarbonitrile as corrosion inhibitor for mild steel in hydrochloric acid solution. Corros. Sci.. 2014;82:125-132.
- [Google Scholar]
- Investigation on some Schiff bases as HCl corrosion inhibitors for carbon steel. Mater. Chem. Phys.. 2004;85(2–3):420-426.
- [Google Scholar]
- Investigation of 1-butyl-3-methyl-1H-benzimidazolium iodide as inhibitor for mild steel in sulfuric acid solution. Corros. Sci.. 2014;80:383-392.
- [Google Scholar]


