

Translate this page into:
Electrochemical sensitive determination of acetaminophen in pharmaceutical formulations at iron oxide/graphene composite modified electrode
⁎Corresponding authors. liuchen@szu.edu.cn (Chen Liu), karpoormath@ukzn.ac.za (Rajshekhar Karpoormath)
-
Received: ,
Accepted: ,
This article was originally published by Elsevier and was migrated to Scientific Scholar after the change of Publisher.
Peer review under responsibility of King Saud University.
Abstract
Acetaminophen (AC) is one of the most commonly prescribed analgesic and antipyretic drug, which is considered to be safe as well as effective. Rational use of AC does not pose any toxicity or adverse effects, however, an overdose or prolonged use could lead to nephrotoxicity and severe hepatoxicity. Thus, monitoring of AC is essential for drug safety. In this work, a facile Fe2O3/reduced graphene oxide (Fe2O3/RGO) nanocomposite was synthesized for improved electrochemical detection of AC. The material was synthesized through a simple one-step process. For characterization of synthesized Fe2O3/RGO composite, energy-dispersive X-ray spectroscopy (EDX), field emission-scanning electron microscopy (FE-SEM) and electrochemical impedance spectroscopy (EIS) were employed. To verify the electrochemical performance of Fe2O3/RGO nanocomposite, GCE was modified with this nanocomposite and utilized for quantification of AC. The detection limit of AC was 21 nM in a linear range from 1.0 × 10⁻⁷ to 74 × 10−6 M. Furthermore, the sensor also unveiled good stability, promising sensitivity and selectivity. Hence, Fe2O3/RGO could be applied as a sensing material for electrochemical detection of AC. Finally, the analytical utility of the method was also verified in human urine and drug samples with some preliminary treatments.
Keywords
Fe2O3/graphene
Acetaminophen
Electrochemical determination
Voltammetry
Electrochemical impedance spectroscopy

1 Introduction
Designing of sensors for the qualitative and quantitative detection of drugs is one of the most crucial techniques. They need to be very precise accuracy with long durability. Sensitivity and specificity are the foremost important parameters that help to determine a target analyte. From the commencement of official pharmaceutical analysis, laboratory analysis of the drug plays an important role in quality control of drug and quality assurance of pharmaceutical formulations and biological fluids (such as serum and urine) in the medical field. Quality of the drug further has an enormous impact on human health (Karikalan et al., 2016). Acetaminophen (N-acetyl-p-aminophenol; paracetamol) (AC) is a broadly prescribed and over the counter drug used as painkiller and antipyretic throughout the world with rather limited anti-inflammatory properties. Usually, AC does not show any harmful side effects at recommended dosage, however, abnormal levels of AC, primarily, is associated with acute liver and kidney failure (Mazer and Perrone, 2008; Rowden et al., 2006; Woolbright and Jaeschke, 2017). Quantification of AC in pharmaceutical formulations and biological fluids is essential considering for therapeutic purposes. Therefore, the development of a promising analytical device for sensing of AC is of importance that makes a great input for drug quality control and clinical diagnosis. A very vast literature is available, where the broad applications of AC have been reported. By keeping this in mind, therefore, it is an urgent requirement of some additional sophisticated analytical techniques for the detection and identification and accurate detection method for AC.
Reviewing the literature to date reveals that there are different methods that have been reported for the determination of AC. The reported methods are very sophisticated, refined and sensitive i.e. titrimetric (Burgot et al., 1997), colorimetry (Shihana et al., 2010), spectrophotometry and spectroscopy (Sirajuddin et al., 2007), gas chromatography (Belal et al., 2009), near-infrared transmittance spectroscopy (Eustaquio et al., 1999), High Performance Liquid Chromatography (HPLC) (Ravisankar et al., 1998) chemiluminescence (Ruengsitagoon et al., 2006) and Thin-layer chromatography (TLC) (Macek, 1972). Determination of AC using above mentioned techniques shows sensitivities but some factors like high-cost in performance, long processing time, multiple-step sample preparation procedures, requirement of highly sophisticated laboratory and highly skilled technicians limits its applications. To circumvent such limitations and to increase its applications, there is a requirement of an alternative technique which is very simple at an affordable cost, high sensitivity with rapid detection and eco-friendly. Research is continually on into investigating new ways to develop cost-effective electrochemical techniques for the determination of AC.
With notable achievements in nanotechnology, it has been noted that modification of electrode's surface with nanomaterials play an important role in electrochemical-signal amplification which has significance in electrochemical sensing of drugs in their dosage forms with promising sensitivity, high selectivity with low background current. Researchers have been carrying out extensive work using graphene and its hybrid composites in various fields such as batteries (Atar et al., 2015b, 2015a), fuel cells (Akyıldırım et al., 2016) and sensors (Elçin et al., 2016; Yokuş et al., 2016; Yola et al., 2015) due to their excellent properties such as large surface area and high electrical conductivity, good biocompatibility. Specifically, reduced graphene oxide (RGO) and its hybrids have been widely used as promising electrode materials for electrochemical sensors and biosensors.
In the past decade, a huge amount of research on metal oxide-based nanomaterials for electrochemical applications has been devoted (Dong et al., 2015; El-Nagar et al., 2014; Karuppiah et al., 2014; Nantaphol et al., 2015; Salimi et al., 2008; Zolgharnein et al., 2014). Among the biocompatible and low-cost metal oxide nanomaterials, iron oxide (Fe2O3) has attracted a great deal of consideration due to non-toxicity, chemical stability, easy of production and storage. Besides, it is one of the most abundant, promising materials, and has been successfully utilized for sensing of analytes in several fields (Liu et al., 2013; Wei et al., 2010). Though, Fe2O3 struggles from some drawbacks such as its comparatively low conductivity and low electron transfer rate, both of them can pointedly decrease its activity (Wang et al., 2014). To avoid such disadvantages, recently, graphene has attained wide consideration as an ideal conducting support material with a very high specific surface area (2630 m2/g) and high electrical conductivity for an alternative approach for preparing Fe2O3. Particularly, the combination of reduced graphene oxide (RGO) with Fe2O3 not only avoids RGO from aggregating but also progresses the surface area with huge electronic conductivity, high biocompatibility, good stability and excellent catalysis, which are essential physicochemical properties for enhanced electrochemical sensing of analytes (Yang et al., 2017).
Present work is an attempt in providing a feasible solution for highly sensitive detection of AC. Herein a simple Fe2O3/RGO nanocomposite was developed for the electrocatalytic oxidation of AC. The composite material displays an excellent electrocatalytic activity and electrical conductivity by the synergistic effect. The nanocomposite-based sensor showed prominent sensing ability and selectivity for determination of AC in pharmaceutical formulations.
2 Experimental
2.1 Apparatus and chemicals
CHI 660E electrochemical workstation (CH Instruments, USA) was used for all electrochemical measurements. All the electrochemical measurements were carried out with GCE or a modified GCE (working electrode), an Ag/AgCl (3.0 M NaCl) electrode (reference electrode) and a platinum wire (axillary electrode). For morphological studies of prepared materials, ZEISS® energy-dispersive X-ray spectroscopy (EDX) coupled with field emission-scanning electron microscopy (FE-SEM) Ultra Plus (Germany) was employed. Preparation of buffer solutions was carried out using pH 60 pH pen (Extech Instruments).
Acetaminophen (Merck, South Africa), potassium chloride (Merck, South Africa), ferric chloride hexahydrate (Merck, South Africa), potassium ferricyanide (Merck, South Africa), graphite powder (Merck, South Africa), potassium ferrocyanide (Sigma-Aldrich, China), magnesium sulfate (RLFCI, India), sucrose (Merck, South Africa), hydrazine hydrate (Sigma-Aldrich, China), glucose (ACE, South Africa), L-lactose (Sigma-Aldrich, Germany) and sodium chloride (Sigma-Aldrich, USA) were used as usual without any further pre-treatment. De-ionised water (DI water) was employed throughout this experiment. Na2HPO4·2H2O (Sigma-Aldrich, Germany) and NaH2PO4·2H2O (Merck, South Africa) were used to prepare buffer solutions.
2.2 Synthesis of Fe2O3/RGO composite
Graphene oxide (GO) was synthesized through modified Hummers method (Hummers and Offeman, 1958). In a typical synthesis procedure of Fe2O3/RGO, 20 mg of GO was dispersed in 40 mL of DI water and sonicated for 10 min. To this, 0.2 g of ferric chloride (FeCl3·6H2O) was added and stirred for 30 min. Then, 15 mL of hydrazine hydrate was added to the above solution and stirred again for 3 h. The resultant product was centrifuged and washed with DI water several times to get Fe2O3/RGO. In a similar way, RGO was synthesized in absence of Fe2O3.
2.3 Preparation of Fe2O3/RGO/GCE
Prior to GCE modification, the surface of GCE was polished using smoothing pads with 0.3 and 0.05 µm of γ-alumina powder. 10 mg of Fe2O3/RGO was dispersed into 5 mL of DI water to make a suspension. Then, 6 µL of the Fe2O3/RGO suspension was dropped onto the surface of GCE and dried under IR lamp for 5 min. This electrode was denoted as Fe2O3/RGO/GCE and used as a working electrode. RGO/GCE was also prepared in a similar way.
3 Results and discussion
3.1 Characterization of nanocomposite
The morphological characterization of RGO and Fe2O3/RGO was carried out using FE-SEM. As can be seen in Fig. 1(A), RGO displays the wrinkles of graphene nanosheets. This structure is advantageous to offer a large surface area. Fig. 2(B) displays the morphology of Fe2O3/RGO, which reveals that a large number of spindles of Fe2O3 were incorporated on the surface of RGO. Such structures prevent the aggregating of RGO and improve the conductivity of Fe2O3, which is advantageous for enhancing the electrochemical detection of AC. The energy-dispersive X-ray spectrum (Fig. 1(C)) reveals an elemental composition of Fe2O3/RGO nanocomposite. Therefore, it confirms the formation of Fe2O3/RGO.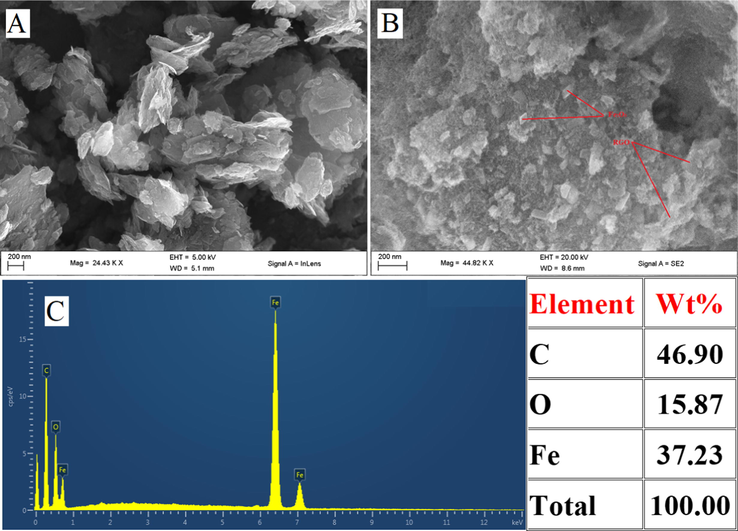
Surface characterization of (A) RGO, (B) Fe2O3/RGO and (C) EDX spectra of Fe2O3/RGO.
![EIS spectra of 0.1 M KCl containing 2.5 mM [Fe(CN)6]3−/4− at modified and bare GCEs. Inset: Randles equivalent circuit model.](/content/184/2020/13/2/img/10.1016_j.arabjc.2019.08.001-fig2.png)
EIS spectra of 0.1 M KCl containing 2.5 mM [Fe(CN)6]3−/4− at modified and bare GCEs. Inset: Randles equivalent circuit model.
3.2 Electrochemical impedance study and electrode surface area
Electrochemical impedance spectroscopy (EIS) is used to study the charge transfer resistance at the electrode/electrolyte interfaces (Palakollu et al., 2017b). By using this technique, the charge transfer properties of various electrodes were studied in 0.1 M KCl having 2.5 mM [Fe(CN)6]3−/4−. The resulting Nyquist plots for modified electrodes and bare GCE were shown in Fig. 2. The obtained impedance data was fitted into the corresponding electronic elements based on the Randle’s equivalent circuit model for estimating the charge transfer resistance (Rct). From the Randles equivalent circuit model, the charge transfer resistance (Rct) (the semicircle) was found to be 106.3 Ω at bare GCE and defines least interfacial charge transfer. The Rct at RGO/GCE was found to be 38.3 Ω, demonstrating the creation of surface with low resistance onto the RGO/GCE that would promote the electron flow rate. However, the Rct was found to be 10.28 Ω at Fe2O3/RGO/GCE, describes least charge transfer resistance and implying that the combination of RGO and Fe2O3 could demonstrate the synergistic effect which effectively enhances their electrical conductivity. Therefore, the study results reveal that Fe2O3/RGO/GCE facilitates the least charge transfer resistance and high conductivity than RGO/GCE and bare GCE.
The surface area of modified electrodes were calculated using CV response at a 0.1 M KCl containing 2.5 mM K3[Fe(CN)6]. For a reversible reaction, the Randles-Sevcik equation (Bard and Faulkner, 2001) is where ip is the peak current (Amp), A is the surface area of the electrode (cm2), D is diffusion coefficient of K3[Fe(CN)6] (taken to be 7.60 × 10⁻⁶ cm2 s−1), n is the number of electrons involved (n = 1 for K3[Fe(CN)6]), υ is the scan rate (V s−1) and C is the concentration of K3[Fe(CN)6] (mol cm−3). By considering the slope of the plots of anodic peak currents vs square root of scan rate (Fig. S1 (A, B)), the surface area of RGO/GCE and Fe2O3/RGO/GCE was found to be 0.08216, 0.09981 cm2, respectively. Therefore, the surface area of Fe2O3/RGO/GCE was higher than RGO/GCE and theoretical geometrical area of GCE (0.07 cm2).
3.3 Electrocatalytic activity of AC
In order to verify the electrocatalytic response of Fe2O3/RGO/GCE, cyclic voltammetric (CV) responses of 1 mM AC in 0.1 M PBS (pH 4.0) were recorded at various modified electrodes. As shown in Fig. 3, AC shows a quasi-reversible redox system with relatively poor redox peaks at GCE, indicating slow electron transfer of the redox system of AC at GCE. However, a well-defined redox system of AC with increased peak currents and decreased over potentials was noticed at RGO/GCE suggesting better electron transfer rate at RGO/GCE due to the large surface area of graphene sheets. Interestingly, an enhancement in the peak currents of redox system with a decreased peak to peak separation potential (ΔEp) of AC was observed at Fe2O3/RGO/GCE, which could be attributed to the electronic conductivity and electrocatalytic activity of Fe2O3/RGO and their synergy. The intercalation of Fe2O3 with RGO decreases the stacking of RGO as well as improves the electronic conductivity and electron transfer ability of the Fe2O3/RGO/GCE for AC detection. This recommends that oxidation of AC is extremely favourable at Fe2O3/RGO/GCE than the other electrodes. The schematic illustration of electrochemical sensing of AC at Fe2O3/RGO/GCE is presented in Scheme 1.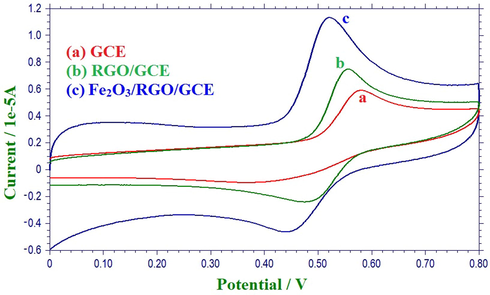
CVs of 1 mM AC in 0.1 M PBS (pH 4.0) at a scan rate of 100 mV s−1.
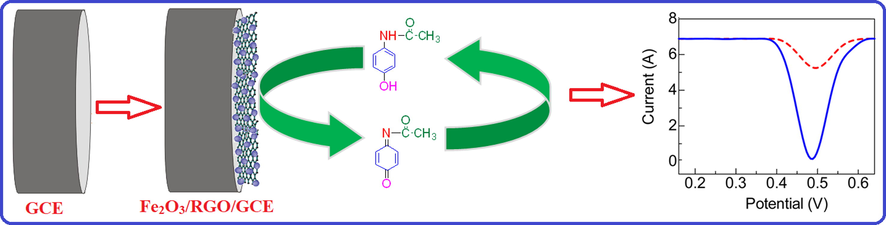
Schematic illustration of electrochemical sensing of AC at Fe2O3/RGO/GCE.
The apparent diffusion coefficient (Dapp) of AC at modified and bare GCEs were calculated using above said Randles-Sevcik equation (Bard and Faulkner, 2001). The estimated Dapp values of AC are given in Table 1. As can be seen in Table 1, it has been concluded that the Dapp value at Fe2O3/RGO/GCE was higher when compared to bare GCE and RGO/GCE. The higher Dapp of AC at Fe2O3/RGO/GCE might be due to the good electrocatalytic activity for electro-oxidation of AC at Fe2O3/RGO/GCE. This observation is evidence of the electrocatalytic activity of Fe2O3/RGO/GCE (Palakollu and Karpoormath, 2018).
S. No.
Electrode
Dapp values (cm2 s−1)
1
GCE
3.5648 × 10⁻⁶
2
RGO/GCE
4.4326 × 10⁻⁶
3
Fe2O3/RGO/GCE
5.1548 × 10⁻⁶
3.4 Effect of scan rate
The effect of scan rate on the peak currents of AC in 0.1 M PBS (pH 4.0) at Fe2O3/RGO/GCE was investigated from 5 to 250 mV s−1. Fig. 4(A) displays the cyclic voltammograms of AC at different scan rates. From Fig. 4(B), the redox peak currents of AC (ip) were linearly proportional to the square root of scan rate (ν1/2) in the range from 5 to 250 mV s−1 indicating diffusion-controlled process. The corresponding linear regression equation(s) can be written as follows.
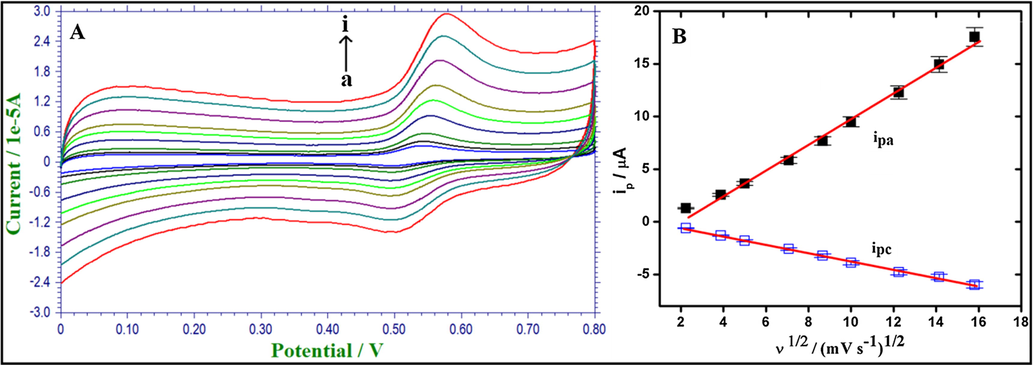
(A). CVs of 1 mM AC in 0.1 M PBS (pH 4.0) at various scan rates (5–250 mV s−1) at Fe2O3/RGO/GCE. (B). Calibration plot of the redox peak currents vs. square root of scan rate.
3.5 Effect of solution pH
The pH of supporting electrolyte plays an important role in the peak current of an analyte. Moreover, it also provides an insight to the number of protons and electrons involved in electro redox reactions. The electrochemical response of AC at pH 3.5–9.0 (0.1 M PBS) were carried out at Fe2O3/RGO/GCE using cyclic voltammetry. Fig. 5(A) displays the cyclic voltammograms of AC at various pH. Moreover, as an increase in the pH of PBS, the anodic peak potentials of AC shifted negatively. From Fig. 5(B), good linearity was attained for pH vs. peak potential of AC. Therefore, the electro-oxidation of AC is pH-dependent behaviour at Fe2O3/RGO/GCE.
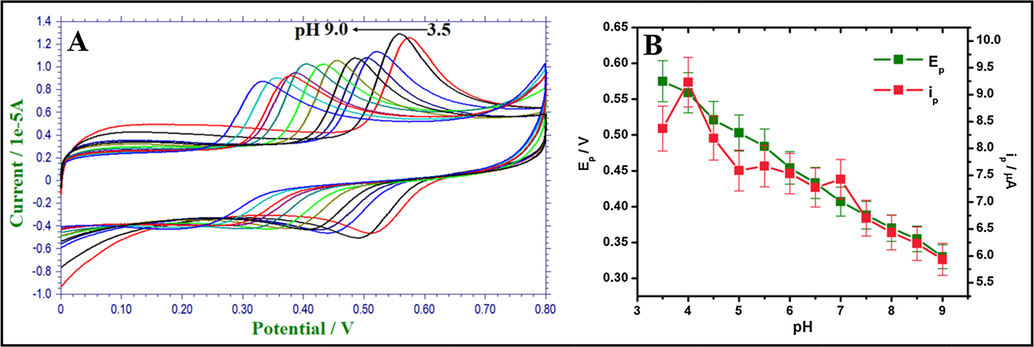
(A). CVs of AC at various pH. (B). The plot of ipa of AC vs. pH (3.5–9.0) and Epa of AC vs. pH (3.5–9.0) at a scan rate of 100 mV s−1.
The slope of the calibration curve, 0.049 V/pH is close to Nernstian value 0.592 V/pH at room temperature and recommends that an equal number of electrons and protons are participating in the electrocatalytic-oxidation of AC at Fe2O3/RGO/GCE. From the cyclic voltammetric results, the highest peak current and the best peak shape were observed in pH 4.0. Thus, pH 4.0 of PBS was selected for the determination of AC.
3.6 Electrochemical determination of AC
The scope of enhancement in the electrochemical response of Fe2O3/RGO/GCE was examined through the determination of AC in 0.1 M PBS (pH 4.0) using DPV technique. From Fig. 6, the peak current was found to increase linearly with the successive addition of AC. Fig. 6 (inset) displays the calibration curve and the corresponding linear regression equation can be written as follows.
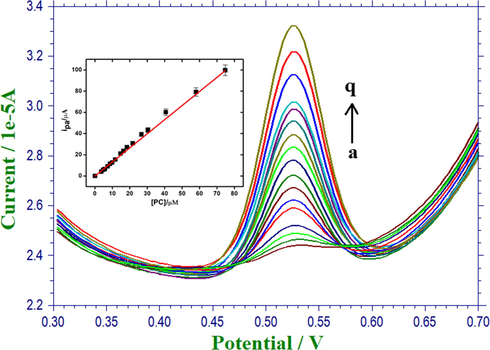
DPVs of AC with various concentrations in 0.1 M PBS (pH 4.0). Inset-Calibration plot of concentration of AC vs ipa.
The detection limit of AC using the proposed method was found to be 21 nM at a signal-to-noise ratio of 3 in a linear range from 1.0 × 10⁻⁷ to 74 × 10−6 M. A comparison of the limit of detection obtained using Fe2O3/RGO/GCE with recently reported methods has been summarized in Table 2 and obviously specifies an enhancement over the stated values. poly(AHNSA)/GCE: Poly(4-amino-3-hydroxynaphthalene sulfonic acid)-modified glassy carbon electrode; AgNPs-CB-PEDOT:PSS/GCE: silver nanoparticles-carbonblack-poly(3,4-ethylenedioxythiophene)-poly(styrenesulfonate)/glassy carbon electrode; Au/Pani/cMWCNT/Bas/GA: gold working electrode/Carboxylated multi-walled carbon nanotube/polyaniline/Bacillus subtilis/glutaraldehyde; GO/poly(Val)/CPE: graphene oxide/poly(valine)/carbon paste electrode; MWCNTs/poly(Gly)/GCE: multi-walled carbon nanotubes/poly(Glycine)/glassy carbon electrode; SWV: Square wave voltammetry; Amp: Amperometry.
S. No
Electrode
Technique
pH
Linear range (M)
LOD (µM)
Ref.
1
poly(AHNSA)/GCE
SWV
4.5
–
0.45
(Tefera et al., 2016)
2
AgNPs-CB-PEDOT:PSS/GCE
SWV
6.0
6.2 × 10⁻⁷ to 7.1 × 10⁻⁶
0.012
(Wong et al., 2018)
3
Au/Pani/cMWCNT/Bas/GA
Amp
7.0
5.0 × 10⁻⁶ to 6.3 × 10⁻⁴
2.9
(Bayram and Akyilmaz, 2016)
4
GO/poly(Val)/CPE
DPV
7.0
5 × 10⁻⁶ to 60 × 10−6
0.29
(Venu Gopal et al., 2018)
5
MWCNTs/poly(Gly)/GCE
DPV
7.0
5 × 10⁻⁷ to 1 × 10⁻⁵
0.5
(Narayana et al., 2014)
6
Fe2O3/RGO/GCE
DPV
4.0
1.0 × 10⁻⁷ to 7.4 × 10⁻⁶
0.021
Present work
3.7 Interference study
The influence of several foreign species in the quantification of AC was studied at Fe2O3/RGO/GCE under the experimental conditions (Fig. S2). The displayed results reveal that the presence of K+, Ca2+, Na+, Mg2+, SO42− and Cl− have not considerably influenced the peak current of AC. The tolerance limit was taken as the maximum concentration of the foreign substances, which caused an approximately ±5% relative error in the AC detection (Palakollu et al., 2017a). Moreover, a 10-fold of uric acid did not affect the peak current of AC. Therefore, the redox peaks of AC could obviously be separated from each other.
3.8 Stability and reproducibility
Long-term stability of the proposed sensor was studied for 7, 14, 21 and 28 days in 50 µM AC in 0.1 M PBS (pH 4.0) (Fig. S3). The responses, from electrodes measurements, were 96.14% (for 7 days), 94.45% (for 14 days), 91.76% (for 21 days) and 87.54% (for 28 days) when compared with day one response. Thus, good long-term stability of the proposed sensor was achieved. Additionally, in order to verify the reproducibility of the nanocomposite-based sensor, 3 Fe2O3/RGO composite modified electrodes were prepared under the same experimental conditions to test the cyclic voltammetric response of 50 µM AC in 0.1 M PBS (pH 4.0) (Fig. S4); the RSD was found to be 2.3%, indicating that the sensor has good reproducibility.
3.9 Real sample analysis
To confirm the applicability of Fe2O3/RGO nanocomposite modified GCE, the determination of the content of AC in commercially available tablet (Dolo − 650®) sample was carried out at this proposed sensor. The tablet sample was diluted with 0.1 M PBS (pH 4.0) to get the concentration of tablet sample within the linear range. The quantity of AC in the pharmaceutical formulation was estimated using standard addition method (Fig. S5). From Table 3, it can be concluded that the results attained using the proposed sensor displayed a satisfactory agreement with the labelled amount. Moreover, to examine the feasibility of the proposed sensor, the determination of AC in the urine sample was carried out. Prior to the analysis, the collected urine sample was diluted with 0.1 M PBS (pH 4.0). Then, the urine sample was added with an unknown concentration of AC and a series of a known standard sample of AC were spiked into the real sample using standard addition method (Fig. S6). From the calibration curve, the results were summarized in Table 4. The recovery studies reveal that the proposed sensor is reliable and affordable for real sample and pharmaceutical formulations analysis.
Sample
Added (µM)
Found (µM)
Recovery (%)
Bias (%)
Tablet
0.0
Not detected
–
–
5.0
4.95 ± 0.05
99.00
1.00
10.0
9.62 ± 0.12
96.20
3.80
20.0
19.43 ± 0.45
97.10
2.90
30.0
29.51 ± 0.72
98.36
1.64
Sample
Added (µM)
Found (µM)
Recovery (%)
Bias (%)
Urine
0.0
Not detected
–
–
5.0
5.01 ± 0.14
100.2
0.2
10.0
10.14 ± 0.77
101.4
1.4
20.0
19.78 ± 0.26
98.9
1.1
30.0
30.15 ± 0.06
100.5
0.5
4 Conclusions
A simple and one-step synthesis of Fe2O3/RGO/GCE composite material was successfully synthesized for electrochemical detection of AC. The morphology of the material was effectively characterized using FE-SEM and EDX. The electron transfer property at the surface of Fe2O3/RGO/GCE was investigated using EIS. Further, the developed nanocomposite-based sensor showed promising sensitivity, selectivity, a good linear range and low detection limit for the determination of AC. The sensor displayed good recovery results for the analysis of AC in real samples. By having high stability and sensitivity, the developed sensor has the potential for clinical applications.
Acknowledgements
This work was supported by UKZN-Nanotechnology platform, College of Health Sciences, University of KwaZulu-Natal, South Africa and National Research Foundation (NRF), South Africa (Grant No. 103728 and 112079).
References
- Platinum nanoparticles supported on nitrogen and sulfur-doped reduced graphene oxide nanomaterial as highly active electrocatalysts for methanol oxidation. J. Mater. Sci. Mater. Electron.. 2016;27:8559-8566.
- [CrossRef] [Google Scholar]
- Ultrahigh capacity anode material for lithium ion battery based on rod gold nanoparticles decorated reduced graphene oxide. Thin Solid Films. 2015;590:156-162.
- [CrossRef] [Google Scholar]
- Fe@Ag nanoparticles decorated reduced graphene oxide as ultrahigh capacity anode material for lithium-ion battery. Ionics. 2015;21:3185-3192.
- [CrossRef] [Google Scholar]
- Electrochemical Methods: Fundamentals and Applications. New York: John Wiley; 2001. p. :2001.
- Development of a new microbial biosensor based on conductive polymer/multiwalled carbon nanotube and its application to paracetamol determination. Sens. Actuat. B Chem.. 2016;233:409-418.
- [CrossRef] [Google Scholar]
- Determination of paracetamol and tramadol hydrochloride in pharmaceutical mixture using HPLC and GC-MS. J. Chromatogr. Sci.. 2009;47:849-854.
- [CrossRef] [Google Scholar]
- Determination of acetaminophen by thermometric titrimetry. Anal. Chim. Acta. 1997;343:125-128.
- [CrossRef] [Google Scholar]
- Enhancement of electrogenerated chemiluminescence of luminol by ascorbic acid at gold nanoparticle/graphene modified glassy carbon electrode. Spectrochim. Acta Part A Mol. Biomol. Spectrosc.. 2015;134:225-232.
- [CrossRef] [Google Scholar]
- Acrylonitrile-contamination induced enhancement of formic acid electro-oxidation at platinum nanoparticles modified glassy carbon electrodes. J. Power Sources. 2014;265:57-61.
- [CrossRef] [Google Scholar]
- Highly selective and sensitive voltammetric sensor based on ruthenium nanoparticle anchored calix[4]amidocrown-5 functionalized reduced graphene oxide: simultaneous determination of Quercetin, morin and rutin in grape wine. Electroanalysis. 2016;28:611-619.
- [CrossRef] [Google Scholar]
- Determination of paracetamol in intact tablets by use of near infrared transmittance spectroscopy. Anal. Chim. Acta. 1999;383:283-290.
- [CrossRef] [Google Scholar]
- Electrochemical properties of the acetaminophen on the screen printed carbon electrode towards the high performance practical sensor applications. J. Colloid Interface Sci.. 2016;483:109-117.
- [CrossRef] [Google Scholar]
- Direct electrochemistry of glucose oxidase and sensing glucose using a screen-printed carbon electrode modified with graphite nanosheets and zinc oxide nanoparticles. Microchim. Acta. 2014;181:1843-1850.
- [CrossRef] [Google Scholar]
- Magnetic and electrochemical behavior of rhombohedral α-Fe2O3 nanoparticles with (104) dominant facets. Particuology. 2013;11:327-333.
- [CrossRef] [Google Scholar]
- Pharmaceutical Applications of Thin Layer and Paper Chromatography. Amsterdam: Elsevier Publishing Company; 1972. 1972
- Acetaminophen-induced nephrotoxicity: pathophysiology, clinical manifestations, and management. J. Med. Toxicol.. 2008;4:2-6.
- [CrossRef] [Google Scholar]
- Sensitive and selective electrochemical sensor using silver nanoparticles modified glassy carbon electrode for determination of cholesterol in bovine serum. Sens. Actuat. B Chem.. 2015;207:193-198.
- [CrossRef] [Google Scholar]
- Electrochemical sensing of paracetamol and its simultaneous resolution in the presence of dopamine and folic acid at a multi-walled carbon nanotubes/poly(glycine) composite modified electrode. Anal. Methods. 2014;6:9459-9468.
- [CrossRef] [Google Scholar]
- Electrochemical sensitive determination of isoprenaline at β-cyclodextrin functionalized graphene oxide and electrochemically generated acid yellow 9 polymer modified electrode. J. Mol. Liq.. 2017;248:953-962.
- [CrossRef] [Google Scholar]
- Enhanced electrochemical sensing of dopamine based on carboxylic acid functionalized multi-walled carbon nanotubes/poly(toluidine blue) composite. Synth. Met.. 2018;245:87-95.
- [CrossRef] [Google Scholar]
- Electrochemically reduced graphene oxide/poly-glycine composite modified electrode for sensitive determination of L-dopa. Mater. Sci. Eng. C. 2017;77:394-404.
- [CrossRef] [Google Scholar]
- Reversed-phase HPLC method for the estimation of acetaminophen, ibuprofen and chlorzoxazone in formulations. Talanta. 1998;46:1577-1581.
- [CrossRef] [Google Scholar]
- Flow injection chemiluminescence determination of paracetamol. Talanta. 2006;69:976-983.
- [CrossRef] [Google Scholar]
- Electrochemical detection of trace amount of arsenic(III) at glassy carbon electrode modified with cobalt oxide nanoparticles. Sens. Actuat. B Chem.. 2008;129:246-254.
- [CrossRef] [Google Scholar]
- A modified low-cost colorimetric method for paracetamol (acetaminophen) measurement in plasma. Clin. Toxicol.. 2010;48:42-46.
- [CrossRef] [Google Scholar]
- Simpler spectrophotometric assay of paracetamol in tablets and urine samples. Spectrochim. Acta Part A Mol. Biomol. Spectrosc.. 2007;68:747-751.
- [CrossRef] [Google Scholar]
- Simultaneous determination of caffeine and paracetamol by square wave voltammetry at poly(4-amino-3-hydroxynaphthalene sulfonic acid)-modified glassy carbon electrode. Food Chem.. 2016;210:156-162.
- [CrossRef] [Google Scholar]
- Rapid and sensitive electrochemical monitoring of paracetamol and its simultaneous resolution in presence of epinephrine and tyrosine at GO/poly(Val) composite modified carbon paste electrode. Colloids Surfaces A Physicochem. Eng. Asp.. 2018;545:117-126.
- [CrossRef] [Google Scholar]
- One-pot synthesis of α-Fe2O3 nanoparticles-decorated reduced graphene oxide for efficient nonenzymatic H2O2 biosensor. Sens. Actuat. B Chem.. 2014;190:645-650.
- [CrossRef] [Google Scholar]
- Dumbbell-like Au-Fe3O4 nanoparticles as label for the preparation of electrochemical immunosensors. Biosens. Bioelectron.. 2010;26:627-631.
- [CrossRef] [Google Scholar]
- Simultaneous determination of paracetamol and levofloxacin using a glassy carbon electrode modified with carbon black, silver nanoparticles and PEDOT:PSS film. Sens. Actuat. B Chem.. 2018;255:2264-2273.
- [CrossRef] [Google Scholar]
- Role of the inflammasome in acetaminophen-induced liver injury and acute liver failure. J. Hepatol.. 2017;66:836-848.
- [CrossRef] [Google Scholar]
- A facile one-step synthesis of Fe2O3 nanoparticles/reduced graphene oxide for enhanced hydrazine sensing. J. Electrochem. Soc.. 2017;164:B74-B80.
- [CrossRef] [Google Scholar]
- Sensitive voltammetric sensor based on polyoxometalate/reduced graphene oxide nanomaterial: application to the simultaneous determination of l-tyrosine and l-tryptophan. Sens. Actuat. B Chem.. 2016;233:47-54.
- [CrossRef] [Google Scholar]
- Sensitive and selective determination of aqueous triclosan based on gold nanoparticles on polyoxometalate/reduced graphene oxide nanohybrid. RSC Adv.. 2015;5:65953-65962.
- [CrossRef] [Google Scholar]
- Simultaneous determination of propanil and monalide by modified glassy carbon electrode with nickel oxide nanoparticles, using partial least squares modified by orthogonal signal correction and wavelet packet transform. Sens. Actuat. B Chem.. 2014;197:326-333.
- [CrossRef] [Google Scholar]
Appendix A
Supplementary material
Supplementary data to this article can be found online at https://doi.org/10.1016/j.arabjc.2019.08.001.
Appendix A
Supplementary material
The following are the Supplementary data to this article:Supplementary data 1
Supplementary data 1


