

Translate this page into:
Elucidating the interaction of propofol as an intravenous anesthetic drug with blood components: IgG and peripheral blood mononuclear cell as targets
⁎Corresponding author at: No.27, Jiefang Road, Linyi 276200, Shandong Province, China. huili.medicine@yahoo.com (Hui Li)
-
Received: ,
Accepted: ,
This article was originally published by Elsevier and was migrated to Scientific Scholar after the change of Publisher.
Abstract
Propofol is known as an intravenous anesthetic drug utilized for stimulation and prolongation of general anesthesia. However, the side effects of propofol are still elusive in the blood system. Therefore, in this study the interaction of propofol with immunoglobulin G (IgG) and peripheral blood mononuclear cells (PBMCs) as a model of blood system was explored by different spectroscopic, theoretical, cellular and molecular assays. The UV–Vis, intrinsic/ANS/synchronous fluorescence spectroscopic studies indicated the static quenching of IgG and corresponding protein unfolding in the presence of propofol. Far- and near-circular dichroism (CD) study further demonstrated that the structure of IgG was unfolded after interaction with propofol. Molecular docking study indicated that formation of IgG-propofol complex occurs through involvement of hydrogen bonding and van der Waals forces. Moreover, the cellular assay determined that propofol led to an increase in the cell mortality, membrane leakage, upregulation of intracellular ROS, elevation of Caspase-3 and -9 protein levels, and overexpression of Bax/Bcl-2 mRNA ratio, in PBMCs. This paper may pave the way for exploring the nature of the reaction and side effects between propofol and the biological system.
Keywords
Propofol
Anesthetic drug
Interaction
IgG
Spectroscopy
PBMCs
Cytotoxicity

1 Introduction
Propofol is the most widely used intravenous (IV) drug from the alkylphenol family, which is formulated as a fat emulsion (Baker and Naguib, 2005). It is used to induce anesthesia and is characterized by a short recovery period (Emik et al., 2016) and some side effects (Li et al., 2016). Indeed, some well-known adverse effects following anesthesia etomidate, thiopental, methohexital, and propofol have been reported in several studies (Hoyer et al., 2014; Canbek et al., 2015; Mir et al., 2017). However, due to the fact that propofol is the most widely used IV drug for induction of anesthesia today, this issue is of special importance. In addition, this drug, which is known as an anticonvulsant drug, can lead to seizures (Rutazaana and Kasturi, 2018) and unconsciousness (Flores et al., 2017) under certain conditions. They can be persistent in some cases and lead to arterial oxygen desaturation and hypoxemia (Beitz et al., 2012). The pathophysiological mechanism of toxicity induced by propofol is not yet fully understood, but it appears that the timing of the change in level of consciousness from awakening to anesthesia or, conversely, is related to this issue (Eagleman et al., 2019).
On the other hand, IV anesthetics may lead to transient adverse effects against the blood systems of animals and humans (Yu et al., 2018; Sun et al., 2019). Therefore, exploring the responses of the blood system with respect to the adverse effects against serum proteins and blood cells under experimental conditions induced by propofol can provide useful information regarding their biomedical application.
Immunoglobulin G (IgG) as a plasma protein has received much interest in biomedical applications such as diagnostics (Gao et al., 2020) and therapeutic (Irani et al., 2019) platforms. Human IgG as the most therapeutically crucial Ig is an important member of the human immune system (Kearns et al., 2017; Scott-Taylor et al., 2018). Also, as one of the plasma proteins, this type of antibody is the most abundant antibody in the body and accounts for about 15% of total serum proteins (Scott-Taylor et al., 2018). This antibody is present only in the blood and is able to enter the fetus through the placenta and protect it against foreign agents (Pierzynowska et al., 2020). Similar to some other plasma proteins such as albumin, hemoglobin and fibrinogen, IgG serves as a potential drug carrier based on its capability to interact with several drugs (Scott-Taylor et al., 2018). Indeed, the pharmacodynamic and pharmacokinetic of drugs are correlated with their binding with IgG, because this affinity may cause an alteration in free drug level and change the drug’s potency and relevant cytotoxicity (Wang et al., 2016; Shahlaei et al., 2020). On the other hand, the interaction of drugs with IgG may induce some unwanted effects on the protein structure and corresponding function (Khoramian et al., 2019).
Also, the apoptotic cytotoxicity induced by general anesthetics drives from mitochondrial impairment due to the oxidative stress (Bergamini et al., 2016). Therefore, some studies should be developed to identify the main pathways target of propofol cytotoxicity and to explore the probable protective potency of some supplementations. It has been shown that propofol results in reduction of cellular oxygen consumption rate through mitochondrial malfunction (Bergamini et al., 2016).
The mechanisms of induction of apoptosis by propofol are not well understood at present and despite many efforts to identify the pathways leading to cell death by propofol, it is not possible to predict their induced cytotoxicity. Therefore, any effort to understand the mechanism of cell death can greatly help to better understand the pathogenesis of the propofol and to provide appropriate protective protocols. Peripheral blood mononuclear cells (PBMCs) are vital cells in response to toxic drugs (Martínez-Rodríguez et al., 2019; Oda et al., 2020). PBMCs apoptosis may be the main cause of decreased immune system function in patients administered by propofol (Li et al., 2018).
Therefore, in this paper, the interaction of propofol with IgG and PBMCs were investigated by biophysical and cellular studies to explore the adverse effects of propofol on biological systems.
2 Materials and methods
2.1 Sample preparation
IgG, propofol, and 8-anilinonaphthalene-1-sulfonic acid (ANS) were obtained from Sigma-Aldrich (USA) and both dissolved in a 10 mM phosphate buffer (pH 7.4). All chemicals were of analytical grade and used without further purification.
2.2 Measurement of absorption spectrum
The absorption spectra oh IgG in the absence and presence of varying concentrations of propofol (1, 2, 5, 10, and 20 µM) were recorded employing a Cary UV–visible (Vis) spectrometer at a scan rate of 500 nm/min in the λ range of 230–370 nm at room temperature. UV–vis absorption assay was done by stepwise titration of propofol solutions to a cell containing 5 μM IgG. The samples were blanked against the absorbance of buffer and propofol solutions.
2.3 Measurement of steady state, ANS, and synchronous fluorescence spectrum
Emission spectrum of IgG was recorded using Hitachi F-7000 Spectro fluorimeter with excitation at 280 nm. The excitation and emission bandwidth were set at 5 nm and 10 nm, respectively. Propofol with different concentrations of 1, 2, 5, 10, and 20 µM was stepwise added to a cell containing 2 μM IgG. For ANS study, the IgG solution in the presence of varying concentrations of propofol was mixed with ANS (15 µM) and incubated in the dark for 20 min. The fluorescence intensity of the sample was corrected against the buffer and propofol solutions. Synchronous fluorescence spectra of IgG with various concentrations of propofol (1, 5, 10, and 20 µM) were obtained at Δλ = 20 (Tyr residues) and Δλ = 60 nm (Trp residues) with the excitation and emission slit widths of 5 and 10 nm, respectively. Also, the inner filter effects were calculated and subtracted from the fluorescence intensity of IgG samples.
2.4 Circular dichroism (CD) study
The far-UV CD spectra of IgG (5 µM) and near-UV CD spectra of IgG (10 µM) with increasing concentration of propofol (1, 5, 10, and 20 µM) were recorded using a JASCO-J815 spectrometer at room temperature. The obtained data were expressed as following equation (Zeinabad et al., 2016):
The scan rate was fixed at 200 nm/min, and each spectrum was corrected against buffer and propofol solutions.
2.5 Molecular docking
The Hex 6.3 docking tool (www.ttp://hex.loria.fr) was used to study the interaction between the propofol and IgG. The crystal structure of IgG was downloaded from the Protein Data Bank. The H2O2 molecules were removed from the protein backbone using a text editor. The hydrogen atoms, surface charge, and solvation parameters were applied through Hex 6.3 docking tool. The grid box was designed large enough to include the binding site(s) of IgG and specified domains of the surrounding residues with a grid spacing of 4 Å. Afterwards, the potential structure for the flexible propofol was optimized by the rotation of all single atoms and the docking parameters were optimized by the Hex 6.3 program. At the end of the molecular docking analysis, the IgG-propofol complex with the minimum energy was analyzed as the most favorable geometry of the complex for IgG. Molecular graphics were determined with the PyMOL tool (http://www.pymol.org/).
2.6 Cellular assays
PBMCs were extracted from blood samples of humans by Ficoll-Paque density gradient centrifugation (Ulmer et al., 1984) (approved by the ethical committee of Linyi people's Hospital, China). PBMCs were then cultured in complete RPMI-1640 media and then incubated with varying concentrations of propofol (1, 10, 20, and 50 µM) to assay the cytotoxicity for 24 hr using MTT assay.
2.7 MTT assay
The MTT (3-(4,5-dimethylthiazolyl-2)-2,5-diphenyltetrazolium bromide) assay was done after the treatment period. PBMCs were added by MTT solution (5 mg/mL) for a 4 hr 37 °C. Afterward, purple formazan crystals were dissolved using DMSO. Finally, the absorbance of the samples was read at 595 nm spectrophotometrically using an ELISA plate reader (Dynex MRX II, USA). The cells without any treatment were used as the negative control cells.
2.8 LDH assay
After incubating the cells, supernatants were collected and LDH release assay was one at 450 nm using reaction buffers (DiaSys, Germany) according to the instructions of the manufacturer employing an ELISA plate reader (Dynex MRX II, USA).
2.9 ROS assay
The generation of intracellular ROS after treatment of PBMCs with IC50 concentration of propofol for 24 hr at 37 °C was measured through DCFDA / H2DCFDA - Cellular ROS Assay Kit (ab113851) based on the manufacturer's instruction using a microplate reader (Synergy-HT; BioTek).
2.10 Quantitative PCR (qPCR) analysis
The expression levels of Bax and Bcl-2 were evaluated by quantitative qPCR technique based on the standard protocols. PBMCs were treated with IC50 concentration of propofol for 24 hr at 37 °C. RNA extraction was then performed using RNX™-Plus Kit (Invitrogen™, UK) according to the protocol. After examination of the quality of the extracted RNA, synthesis of cDNA was one using Invitrogen™ SuperScript™ VILO™ cDNA Synthesis Kit. Real-time PCR assay was done through the SYBR Green-based PCR Master Mix. Applied Primer sequences for qPCR are obtained based on previous report (Sharifi et al., 2015). mRNA expressions were normalized in comparison with 18S rRNA as a housekeeping gene.
2.11 Analysis of Caspase-9 and Caspase-3 protein levels
To measure Caspase-9 and Caspase-3 protein levels, PBMCs cells were treated with varying concentrations of propofol (1, 10, 20, and 50 µM) for 24 hr at 37 °C. Then Caspase levels were then determined through enzyme-linked immunosorbent assay (ELISA; eBioscience©) according to the instructions of the manufacturer employing an ELISA plate reader (Dynex MRX II, USA).
2.12 Statistical analysis
The statistical analyses were done using SPSS software. Data collected from three independent runs were reported as mean ± SD and were then analyzed by One-Way ANOVA and Tukey post Hoc tests. p-values < 0.05 were considered as statistically significant.
3 Results and discussion
Several investigations on the interaction of small molecules with plasma protein, mostly IgG, have been conventionally carried out using different spectroscopic approaches, including UV–Vis, fluorescence and CD spectroscopy. These techniques provide useful data on the nature of protein binding and the conformational changes of protein upon interaction with ligands (Asl et al., 2018; Babadaei et al., 2018; Mansouri et al., 2018).
3.1 UV–Vis spectroscopy study
UV–Vis spectroscopy which is known as an important technique to explore the structural changes of proteins (Jafari Azad et al., 2017; Fardanesh et al., 2019) was employed to analyze the structural changes of IgG after interaction with increasing concentrations of propofol (1, 5, 10, and 20 µM). The one main absorption peak of a typical IgG at the wavelengths of 285 nm is mostly observed due to the presence of Trp, Tyr, and Phe residues. Indeed, the absorption maximum of IgG at this wavelength heavily depends on the microenvironmental changes in which these residues are located. As depicted in Fig. 1a, a significant enhancement at 285 nm accompanying a red shift (Fig. 1b) was determined upon addition of the increasing concentrations of propofol to the IgG solution. These data revealed the incidence of IgG unfolding with an increase in the hydrophilicity of microenvironment of the Trp, Tyr, and Phe residues, as a result of interaction between IgG and propofol.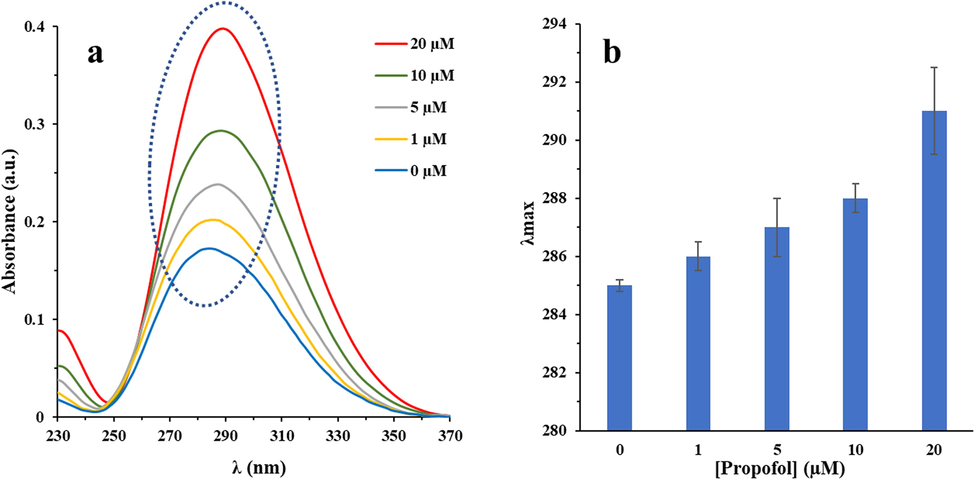
Changes in UV–Vis spectra of IgG (a) and a red shift (b) with increasing concentrations of propofol in 10 mM phosphate buffer (pH 7.4) at room temperature.
3.2 Fluorescence quenching mechanism
The fluorescence quenching study was performed to determine the quenching mechanism of the interaction between IgG and propofol at room temperature. Fig. 2a shows the gradual fluorescence quenching of IgG with increasing in concentration of propofol at room temperature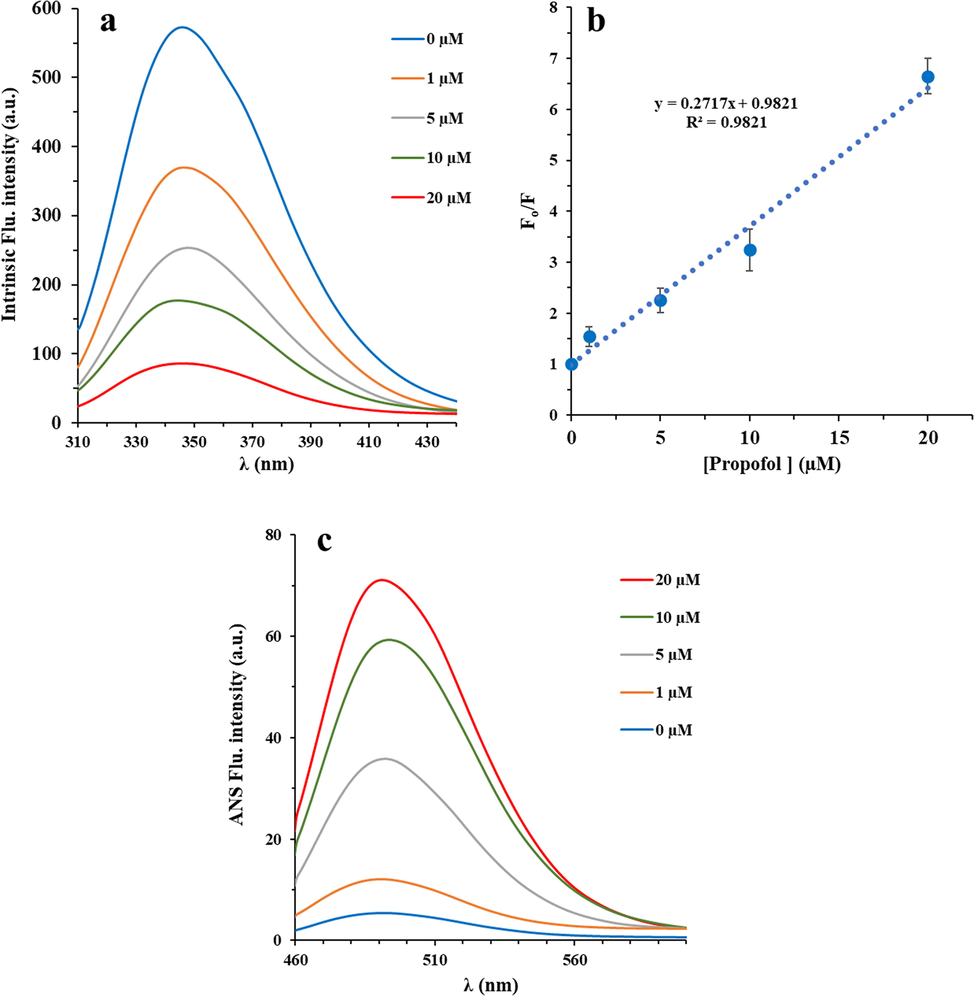
Fluorescence emission spectra of IgG (2 µM) in the presence of various concentrations of propofol (propofol/IgG molar ratio) from 0.5 to 10; λem = 280 nm λex = 375 nm in 10 mM phosphate buffer (pH 7.4) at room temperature (a). Stern-Volmer curve for quenching of IgG in the presence of various concentrations of propofol (b). ANS (15 µM) fluorescence study of IgG (2 µM) in the presence of various concentrations of propofol (propofol/IgG molar ratio) from 0.5 to 10; λem = 380 nm λex = 495 nm in 10 mM phosphate buffer (pH 7.4) at room temperature (c).
Indeed, this reduction in fluorescence intensity of IgG as a result of increasing the propofol concentration indicates the displacement of aromatic residues into a more hydrophilic microenvironment. Furthermore, fluorescence intensity data were analyzed by Stern Volmer equation (Eq. (3)) to determine the nature of quenching mechanism based on the following (Aghili et al., 2016):
Therefore, the KSV and kq values of the interaction between IgG and propofol were then determined based on Stern-Volmer plot (Fig. 2b). As summarized in Table 1, the kq value was found to be 27 ± 0.019 × 10¹² M−1 s−1. The maximum collision quenching kq of different quenchers for biomacromolecules is ∼2.0 × 10¹⁰ M−1 s−1 (Zeinabad et al., 2016). In this study, kq of binding of propofol with IgG is much greater than the maximum value of collision quenching kq, which reveals that the quenching is by static collision, i.e., the formation of propofol-IgG complex.
Complex
T (K)
KSV * 104 (M−1)
kq * 1012 (M−1s−1)
R2
IgG-propofol
298
27 ± 0.019
27 ± 0.019
0.98
3.3 ANS fluorescence study
ANS fluorescence Spectroscopy is one the main approaches exist for determining the surface hydrophobicity of biomolecules (Singh et al.). ANS, as an extrinsic fluorescent probe, is exceptionally sensitive to polarity of the microenvironment, where in aqueous solutions its fluorescence intensity is very weak, however after binding to the hydrophobic domain, its quantum yield enhances remarkably (Singh et al.). Therefore, ANS fluorescence analysis can be used in addressing the probable alterations in hydrophobicity of protein surface stimulated by interaction with some drugs drug binding. As shown in Fig. 2c, at a fixed concentration of IgG (2 μM) and increasing concentrations of propofol (1–20 μM), the ANS fluorescence intensity increases, which indicates the probable IgG unfolding in the presence of propofol. Indeed, increasing the ANS index of IgG (from 5.3 to 70.9 unit) suggests that the surface hydrophobicity of IgG increases by ∼ 13.33% upon propofol binding.
3.4 Synchronous fluorescence spectroscopy study
Synchronous fluorescence spectroscopy has been widely used to probe the molecular microenvironment in the vicinity of the aromatic residues (Steiner-Browne et al., 2019). Indeed, in the synchronous fluorescence study, the fluorescence spectrum of protein is derived mainly from Trp and Tyr residues which are sensitive to the microenvironmental changes. It has been depicted that synchronous fluorescence spectroscopy study of IgG will result in providing characteristic information on Trp and Tyr residues when the scanning interval is set at 60 and 20 nm, respectively (Steiner-Browne et al., 2019). The blue/red shift in the λem corresponds to changes in the polarity of chromophore molecules. The synchronous fluorescence spectra of interaction between IgG and propofol are demonstrated in Fig. 3. It was displayed that the fluorescence intensity of IgG increased gradually along with the addition of propofol, which further revealed the incidence of protein destabilization in the binding process. Moreover, there is a significant red shift of 6 nm and 5 nm in the propofol-IgG system at Δλ = 20 nm (Fig. 3a) and Δλ = 60 nm (Fig. 3b), respectively, indicating that interaction of propofol with IgG affects the conformation of the protein around both Tyr and Trp residues.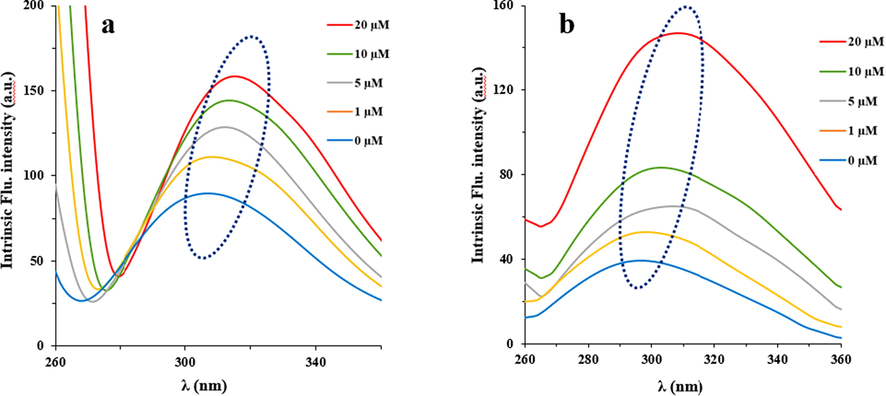
Synchronous fluorescence spectra of interaction between IgG and propofol at Δλ = 20 and (a) and at Δλ = 60 (nm) (b). Concentration of IgG was 2 μM, while concentrations of propofol were 0, 1, 5, 10, and 20 μM in a10 mM phosphate buffer (pH 7.4) at room temperature.
3.5 CD study
CD spectroscopy can be used as a sensitive technique to reveal any changes in the secondary and tertiary structure of biomacromolecules upon interaction with ligands (Zeinabad et al., 2016). Therefore, we tried to probe the secondary and tertiary structural changes of IgG in the presence of varying concentrations of propofol using far-and near-UV CD, respectively. Far-UV CD (190 nm to 260 nm) analysis showed that β-sheet structures are dominant in IgG as a result of one minimum at 2017 nm (Zeinabad et al., 2016). Fig. 4a shows the CD spectra of IgG upon titration with different concentrations of propofol (1, 5, 10, and 20 µM). It was disclosed that addition of different concentrations of propofol to IgG samples substantially changes the ellipticities of the CD signals at 2017 nm (Fig. 4b), indicating that the interaction processes resulted in the IgG unfolding. As tabulated in Table 2.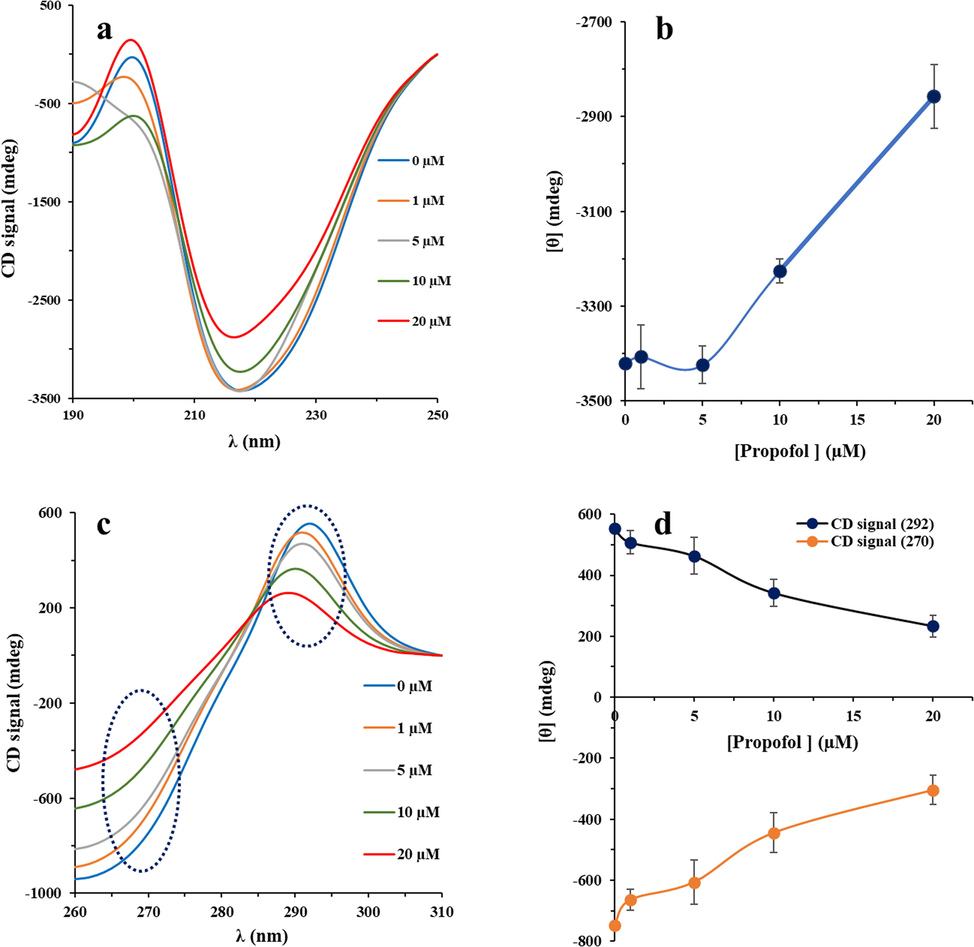
Far-UV CD (a), ellipticity changes at 217 nm (b), near-UV CD (c), and ellipticity changes at 295 nm and 270 nm (d) for IgG after interaction with varying concentrations of propofol (1, 5, 10 and 20 µg/mL) in 10 mM phosphate buffer (pH 7.4) at room temperature.
[Propofol] (µM)
α-Helix (%)
β-Sheet (%)
Turn/loop (%)
Random coil (%)
0
8.25
63.11
12.39
16.25
1
8.11
62.91
12.61
16.37
5
7.54
62.09
12.99
17.38
10
6.38
58.94
13.83
20.85
20
5.81
55.16
14.57
24.46
Near UV-CD was also used to determine the tertiary structural changes of IgG upon interaction with varying concentrations of propofol. As shown in Fig. 4c, and Fig. 4d, the ellipticity changes of IgG at 295 nm (Trp residues) and 270 nm (Tyr residues) decreased after addition of different concentrations of propofol. Therefore, it was deduced that after addition of propofol, both the secondary and tertiary structures of IgG undergo substantially structural changes. Therefore, these data are in good agreement with UV–Vis and fluorescence outcomes manifested that some structural changes occur in the vicinity of aromatic residues after interaction of IgG with propofol.
3.6 Docking study
In order to model the interaction between IgG and propofol molecule, at first the structure of propofol was optimized through semiempirical AM1 method implemented in Gaussian 98 W suite of program (Ja, 2000) as shown in Fig. 5a. The X-ray crystallographic 3D structure of IgG (PDB ID: 1igy) was obtained from the online Protein Data Bank. The docked complex is shown in Fig. 5b and the reported binding energy was found to be −161.64 E-value. Visualization of the docked pose was by using CHIMERA PyMOL tool. The ligand with surrounding amino acid residues inside a grid box of 4 Å are demonstrated in Fig. 5c. The nearest interacting residues are revealed to be Ile-205, Thr-114, Val-115, Val-206, Lys-107, Thr-139, Met-137, Asn-135, Thr-134. Due to dominance of hydrophilic residues such as Thr, Lys, and Arg in the binding pocket, it can be suggested that hydrogen bond and van der Waals interaction play an important role in the interaction IgG and propofol molecule.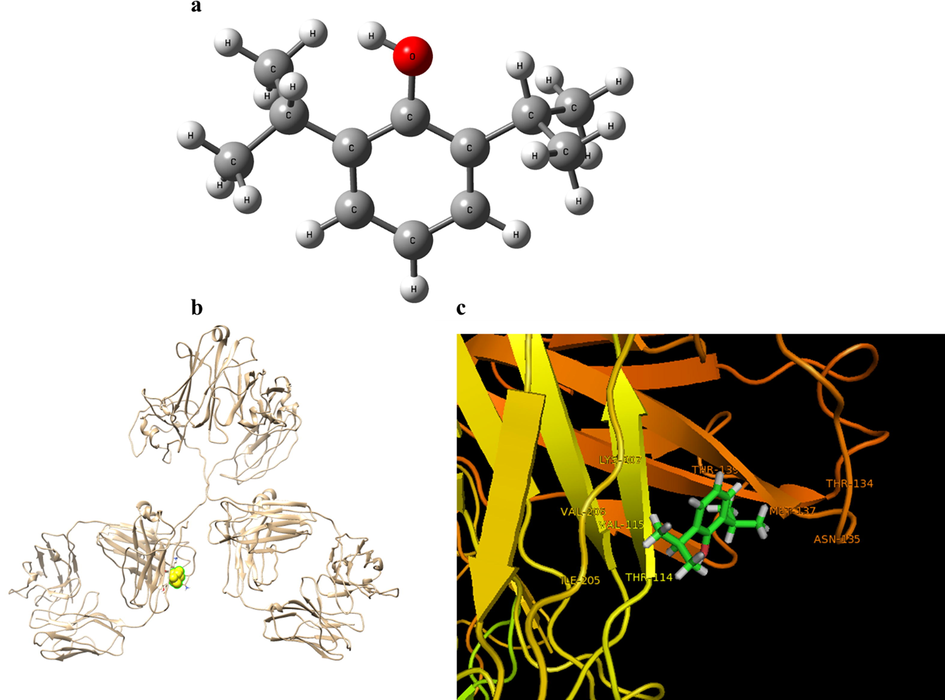
The optimized structure of propofol molecule (a). Crystal structure of IgG and the binding site of propofol in IgG (b). IgG backbone is depicted in the ribbon representation, and propofol in the binding pocket is shown in the ball representation. The propofol and interacting residues (c).
3.7 MTT and LDH assays
PBMNCs cells were treated with different concentrations of the propofol ranging from 1 to 50 μM for 24 hr, and cell viability and LDH release was measured by MTT (Fig. 6a) and LDH (Fig. 6b) assays. MTT assay indicated that increased concentrations of the propofol reduced the cell viability in a concentration dependent manner. IC50 value was determined to be 17.5 μM for the cells incubated for 24 hr (Fig. 6a). LDH assay also indicated that the LDH releases were 100%, 104.02%, 112.35%, 120.11%, 193.67%, and 274.42% after incubation of cells with different concentrations of propofol, i.e., 0, 1, 5, 10, 20, and 50 µM, respectively (Fig. 6b). The results revealed a significant increase in LDH release in 20 and 50 µM propofol.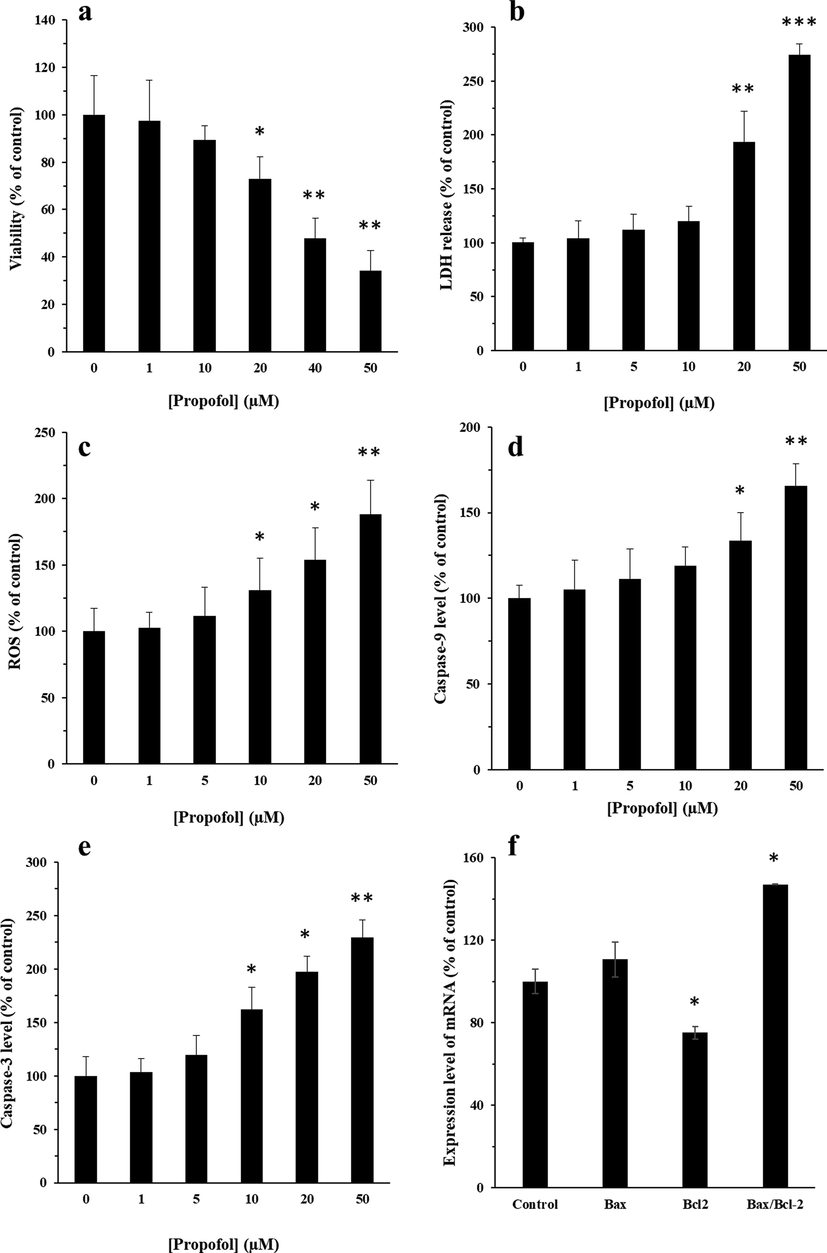
Effects of different concentrations of propofol (1–50 µM) on mitochondria by MTT assay (a), membrane leakage by LDH assay (b), ROS assay (c) protein level of Caspase-9 (d), protein level of Caspase-3 (e), and the effect of IC50 concentration of propofol (17.5 µM) on the expression of Bax and Bcl-2 mRNA (f). The cells were exposed to different concentrations of propofol (1–50 µM) for 24 hr. The data were expressed as he mean ± SD of three independent experiments and then normalized to the negative control cells.
3.8 ROS assay
ROS generation was analyzed following exposure to propofol by the fluorophore H2DCF-DA in PBMCs. The cells incubated with 10, 20 and 50 µM propofol for 24 hr presented a significant increase in the ROS generation in a dose-dependent manner (Fig. 6c). Indeed, the number of DCF-positive cells was enhanced after exposure of PBMCs to propofol.
3.9 Caspase-9 and -3 proteins level
Caspase-9 level in the PBMCs exposed to different concentrations of propofol (20 and 50 μM) showed a significant increase after 24 hr incubation (p > 0.05) (Fig. 6d). Caspase-9 level showed a significant increase when the cells were incubated with different concentrations of propofol (10, 20, and50 μM) after 24 h incubation (Fig. 6e). Propofol with concentrations of 1 and 5 μM caused no significant increase in Caspase-9 and Caspase-3 level after 24 hr incubations
3.10 Expression of Bax, Bcl-2 mRNA and Bax /Bcl-2 ratio
Expression of Bax mRNA showed no significant overexpression in the presence of IC50 concentration of propofol (17.5 μM) after 24 hr incubation (Fig. 6f). However, Bcl-2 mRNA expression was significantly decreased after 24 hr incubation (Fig. 6f). In general, the results determined a remarkable increase in Bax /Bcl-2 ratio in the presence of IC50 concentration of propofol.
It has been indicated that propofol could result in the quenching of intrinsic fluorescence of HSA through a static quenching incidence (Darwish, 2010). The spectroscopy analysis displayed some significant spectral changes of HSA as determined by reduction in the absorption band of α-helix in comparison with that of β-sheets (Darwish, 2010). Sun et al. (2016) also investigated the interaction of propofol with HSA by spectroscopic and theoretical analyses (Sun et al., 2016). It was shown that static fluorescence quenching, exothermic process and hydrophobic force are involved in the interaction of propofol and HSA. It was also indicated that HSA undergoes a significant denaturation upon interaction with propofol (Sun et al., 2016). In another study, biophysical interactions of propofol-linolenate with HSA were explored by different techniques (Alanazi et al., 2020). The data of interactions between propofol-linolenate and HSA disclosed a static quenching of HSA by the target ligand. Also, it was revealed conformational changes in HSA with significant enhancement in the random coil structure (Alanazi et al., 2020). These data are in good agreement with our reported results, indicating the presence of hydrophilic interaction between propofol and IgG and the subsequent structural changes of protein.
Regarding cellular assays, it was found that propofol induced significant cytotoxic effects on PBMCs in a dose- dependent manner. Cell membrane changes which expressed by LDH assay were compared with intracellular ROS level and apoptotic changes. Compared with the control group, the group incubated with propofol showed a remarkable increase in ROS level and apoptosis rate. Expression of apoptosis related Bax/Bcl-2 mRNA and Caspases proteins were determined by qPCR and ELISA analysis. The results showed that propofol up-regulated the Bax/Bcl-2 ratio and upregulated the Caspase-9 and Caspase-3 protein levels. In summary, it can be deduced that propofol triggers apoptosis in PBMCs through activating caspases and Bcl-2 family pathways. It has been also indicated that propofol stimulates apoptosis through upregulation of Bax/Bcl-2 mRNA and activated caspase-3 in neuron cells (Lv et al., 2018).
4 Conclusion
In summary, we have studied the probable binding mechanism of propofol as an intravenous anesthetic drug with IgG. In view of spectroscopic and theoretical analysis it can be deduced that propofol interacts with IgG through static quenching and undergoes some significant structural changes facilitated by Hydrogen bonding and van der Waals interactions. Furthermore, propofol induces significant cytotoxicity towards PBMCs and triggers distinct reduction in cell viability and membrane integrity pertaining to mechanism of apoptosis. Therefore, it can be suggested that these outcomes may help in explaining the pharmacokinetic details of propofol and understanding the mechanistic pathways of cytotoxicity induced by propofol abuse.
Declaration of Competing Interest
The authors declare that they have no known competing financial interests or personal relationships that could have appeared to influence the work reported in this paper.
References
- Investigating the interaction of Fe nanoparticles with lysozyme by biophysical and molecular docking studies. PLoS ONE. 2016;11(10):e0164878 Oct 24
- [Google Scholar]
- Biophysical interactions, docking studies and cytotoxic potential of a novel propofol-linolenate: a multi-technique approach. J. Biomol. Struct. Dyn.. 2020;38(8):2389-2401. May 23
- [Google Scholar]
- Probing the interaction of zero valent iron nanoparticles with blood system by biophysical, docking, cellular, and molecular studies. Int. J. Biol. Macromol.. 2018;1(109):639-650. Apr
- [Google Scholar]
- Biophysical, bioinformatical, cellular, and molecular investigations on the effects of graphene oxide nanosheets on the hemoglobin structure and lymphocyte cell cytotoxicity. Int. J. Nanomed.. 2018;13:6871.
- [Google Scholar]
- PropofolThe Challenges of Formulation. Anesthesiol.: J. Am. Soc. Anesthesiol.. 2005;103(4):860-876. Oct 1
- [Google Scholar]
- Capnographic monitoring reduces the incidence of arterial oxygen desaturation and hypoxemia during propofol sedation for colonoscopy: a randomized, controlled study (ColoCap Study) Am. J. Gastroenterol.. 2012;107(8):1205-1212. Aug 1
- [Google Scholar]
- Role of mitochondrial complex I and protective effect of CoQ 10 supplementation in propofol induced cytotoxicity. J. Bioenerg. Biomembr.. 2016;48(4):413-423. Aug 1
- [Google Scholar]
- Comparison of propofol, etomidate, and thiopental in anesthesia for electroconvulsive therapy: a randomized, double-blind clinical trial. J. ECT. 2015;31(2):91-97. Jun 1
- [Google Scholar]
- Spectroscopic study of propofol binding to human serum albumin. Biophys. Rev. Lett.. 2010;5(04):209-226. Dec
- [Google Scholar]
- Nonlinear dynamics captures brain states at different levels of consciousness in patients anesthetized with propofol. PLoS ONE. 2019;14(10):e0223921 Oct 30
- [Google Scholar]
- The effects of memantine on recovery, cognitive functions, and pain after propofol anesthesia. Revista brasileira de anestesiologia.. 2016;66(5):485-491. Oct
- [Google Scholar]
- Amorphous aggregation of tau in the presence of titanium dioxide nanoparticles: biophysical, computational, and cellular studies. Int. J. Nanomed.. 2019;14:901.
- [Google Scholar]
- Thalamocortical synchronization during induction and emergence from propofol-induced unconsciousness. Proc. Natl. Acad. Sci.. 2017;114(32):E6660-E6668. Aug 8
- [Google Scholar]
- Detection of serum immunoglobulin M and immunoglobulin G antibodies in 2019 novel coronavirus infected patients from different stages. Chin. Med. J.. 2020;133(12):1479. Jun 20
- [Google Scholar]
- Impact of the anesthetic agent’s ketamine, etomidate, thiopental, and propofol on seizure parameters and seizure quality in electroconvulsive therapy: a retrospective study. Eur. Arch. Psychiatry Clin. Neurosci.. 2014;264(3):255-261. Apr 1
- [Google Scholar]
- Use of intravenous immunoglobulin G to treat spontaneous heparin-induced thrombocytopenia. Transfusion.. 2019;59(3):931-934. Mar
- [Google Scholar]
- Probing the conformational changes and peroxidase-like activity of cytochrome c upon interaction with iron nanoparticles. J. Biomol. Struct. Dyn.. 2017;35(12):2565-2577. Sep 10
- [Google Scholar]
- Clinical profile, dosing, and quality-of-life outcomes in primary immune deficiency patients treated at home with immunoglobulin G: data from the IDEaL patient registry. J. Managed Care Specialty Pharmacy.. 2017;23(4):400-406. Apr
- [Google Scholar]
- Synthesis and characterization of biocompatible ferrofluid based on magnetite nanoparticles and its effect on immunoglobulin G as an immune protein. J. Mol. Liq.. 2019;1(273):326-338. Jan
- [Google Scholar]
- Effect of Propofol on breast Cancer cell, the immune system, and patient outcome. BMC Anesthesiol.. 2018;18(1):77. Dec 1
- [Google Scholar]
- Chitosan oligosaccharide reduces propofol requirements and propofol-related side effects. Mar. Drugs. 2016;14(12):234. Dec
- [Google Scholar]
- Hypoxic preconditioning reduces propofol-induced neuroapoptosis via regulation of Bcl-2 and Bax and downregulation of activated caspase-3 in the hippocampus of neonatal rats. Neurol. Res.. 2018;40(9):767-773. Sep 2
- [Google Scholar]
- Interaction of manganese nanoparticle with cytochrome c: A multi-spectroscopic study. Int. J. Biol. Macromol.. 2018;1(106):78-86. Jan
- [Google Scholar]
- In vitro toxicity assessment of zinc and nickel ferrite nanoparticles in human erythrocytes and peripheral blood mononuclear cell. Toxicol. In Vitro. 2019;1(57):54-61. Jun
- [Google Scholar]
- Effectiveness of sodium thiopentone, propofol, and etomidate as an ideal intravenous anesthetic agent for modified electroconvulsive therapy. Saudi J. Anaesthesia. 2017;11(1):26. Jan
- [Google Scholar]
- An in vitro coculture system of human peripheral blood mononuclear cells with hepatocellular carcinoma-derived cells for predicting drug-induced liver injury. Arch. Toxicol.. 2020;20:1-20. Aug
- [Google Scholar]
- Maternal Immunoglobulins in Infants—Are They More Than Just a Form of Passive Immunity? Front. Immunol.. 2020;19(11):855. May
- [Google Scholar]
- Albumin binding, antioxidant and antibacterial effects of cerium oxide nanoparticles. J. Mol. Liq.. 2019;15(296):111839. Dec
- [Google Scholar]
- Immunoglobulin G; structure and functional implications of different subclass modifications in initiation and resolution of allergy. Immun. Inflammation Dis.. 2018;6(1):13-33. Mar
- [Google Scholar]
- Increasing the effectiveness of oxaliplatin using colloidal immunoglobulin G nanoparticles: Synthesis, cytotoxicity, interaction, and release studies. Colloids Surf., B. 2020;1(195):111255. Nov
- [Google Scholar]
- Doxorubicin changes Bax/Bcl-xL ratio, caspase-8 and 9 in breast cancer cells. Adv. Pharmaceut. Bull.. 2015;5(3):351. Sep
- [Google Scholar]
- Singh, K., Hussain, I., Mishra, V., Akhtar, M.S. New insight on 8-anilino-1-naphthalene sulfonic acid interaction with TgFNR for hydrophobic exp.
- Steiner-Browne, M., Elcoroaristizabal, S., Ryder, A.G., 2019. Using polarized Total Synchronous Fluorescence Spectroscopy (pTSFS) with PARAFAC analysis for characterizing intrinsic protein emission. Chemometrics and Intelligent Laboratory Systems 194: 103871. osure analysis. International journal of biological macromolecules. 2019 Feb 1;122:636-43.
- Propofol directly induces caspase-1-dependent macrophage pyroptosis through the NLRP3-ASC inflammasome. Cell Death Dis.. 2019;10(8):1-4. Jul 17
- [Google Scholar]
- Elucidating the interaction of propofol and serum albumin by spectroscopic and docking methods. J. Mol. Liq.. 2016;1(219):405-410. Jul
- [Google Scholar]
- Isolation and subfractionation of human peripheral blood mononuclear cells (PBMC) by density gradient centrifugation on Percoll. Immunobiology. 1984;166(3):238-250. May 1
- [Google Scholar]
- Molecular modeling and multi-spectroscopic approaches to study the interaction between antibacterial drug and human immunoglobulin G. Luminescence. 2016;31(3):704-711. May
- [Google Scholar]
- Progression of systemic lupus erythematosus associated with propofol administration: a case report. Eur. J. Hospital Pharm.. 2018;25(4):225-227. Jul 1
- [Google Scholar]
- Thermodynamic and conformational changes of protein toward interaction with nanoparticles: a spectroscopic overview. RSC Adv.. 2016;6(107):105903-105919.
- [Google Scholar]


