

Endoplasmic reticulum-targetable selenium-doped carbon nanodots with redox-responsive fluorescence for in situ free-radical scavenging in cells and mice
⁎Corresponding authors. zhoudanling@succ.edu.cn (Danling Zhou), linpingsun2000@aliyun.com (Ping Lin)
-
Received: ,
Accepted: ,
This article was originally published by Elsevier and was migrated to Scientific Scholar after the change of Publisher.
Abstract
Endoplasmic reticulum, the largest cellular organelle where protein synthesis, folding, transportation, and the maintenance of Ca2+ homeostasis occurred, is sensitive to the imbalance of its inner environment. Particularly, overproduction of reactive oxygen species in endoplasmic reticulum region can initiate endoplasmic reticulum stress and is tightly related to many metabolic diseases. In this respect, to retain normal function of endoplasmic reticulum, it is highly important to synthesize antioxidants with endoplasmic reticulum-targeting capability for precisely clearing excessively generated reactive oxygen species in endoplasmic reticulum. Herein, we demonstrate the preparation of endoplasmic reticulum-targeting Se-doped carbon nanodots and assays with HeLa cells as well as in vivo tests with mice have shown that the prepared carbon nanodots can significantly eliminate both •OH and O2•−. Experimental results declared that the fabricated carbon nanodots with powerful scavenging capabilities toward •OH and O2•-, low cytotoxicity and endoplasmic reticulum targetability can be utilized to protect cells against raised levels of reactive oxygen species in endoplasmic reticulum. What’s more, the fabricated carbon nanodots effectively alleviated phorbol 12-myristate 13-acetate induced ear inflammation in live mice.
Keywords
Endoplasmic reticulum
Antioxidant
Superoxide anion
Hydroxyl radical
Inflammation

1 Introduction
Reactive oxygen species (ROS) comprised of oxygen radicals, such as superoxide (O2•−) and hydroxyl radicals (•OH), and nonradical oxidizing agents, such as hydrogen peroxide (H2O2), are a class of highly reactive oxygen containing molecules (Hou et al., 2020; Li and Ma, 2018; Huang and Tian, 2018; Liu et al., 2022; Liu and Tian, 2021). In normal cellular environments, the amount of intracellular ROS is precisely regulated by enzymatic and nonenzymatic antioxidant system. The produced ROS are helpful to multiple critical biological processes, such as signal transduction, defense of pathogens invasion, and cell redox homeostasis (Zhen and Pu, 2018; Liu et al., 2023). However, under some conditions, such as anemia, long-term UV exposure or excessive intake of food additives, overproduction of ROS can occur and lead to oxidative stress and succeeding functional decline of biosystems, which are closely related to serious human diseases (Dickinson and Chang, 2011). As such, to retain normal function and prolong the lives of cells, it is of great importance to establish reliable and effective methodologies to diminish superfluous free radicals.
Until now, a series of antioxidants based on nanomaterials, including cerium oxide nanoparticles (Zhang et al., 2020); polydopamine nanoparticles (Bao et al., 2018); graphdiyne nanoparticles (Xie et al., 2020), iridium nanoparticles (Zhang et al., 2021), biopolymers (Zhang et al., 2020), metal–organic frameworks (Li et al., 2021), carbon nitride nanosheets (Cao et al., 2020), and carbon nanodots (CDs) (Luo et al., 2020; Das et al., 2014), have been reported for their medicinal effects to treat ROS related injury and/or diseases. Among them, CDs as a new type of zero-dimensional fluorescent carbonaceous nanomaterials have gained tremendous research interests in recent years because of their fascinating properties and have been widely used in biosensing (Zhou et al., 2017; Li et al., 2020; Huang et al., 2022); bioimaging (Zhao et al., 2020; Du et al., 2020), drug delivery (Wang et al., 2021), as well as antibacterial agents and antioxidants (Li et al., 2019; Zhou et al., 2021). For instance, Zhang et al. developed a benign approach to fabricate nitrogen and sulfur co-doped CDs for alleviating cellular oxidative stress (Zhang et al., 2018). Cai’s group prepared selenium-doped CDs that possessing broad-spectrum antioxidant properties and renal specificity for acute kidney injury management (Rosenkrans et al., 2020). More recently, Chen and coworkers prepared tellurium-doped CDs that can consume intracellular ROS and protect cells against H2O2 (Chen et al., 2020). These reported CDs are conducive to blocking oxidative injuries from ROS and would facilitate the development of CD-based antioxidants for practical application in biomedical fields. As ROS show remarkably high reactivity and short half-life, it is desirable to synthesize antioxidants with targeting ability for scavenging ROS in situ, i.e., eliminating ROS right in the place where it is generated. Endoplasmic reticulum (ER), the largest cellular organelle where protein synthesis, folding, transportation, and the maintenance of Ca2+ homeostasis occurred, is sensitive to the imbalance of its inner environment (Wang and Kaufman, 2014; Deng et al., 2020). Particularly, excessive generation of ROS in ER can initiate ER-stress, which is closely related to many metabolic diseases, such as diabetes, obesity, and insulin resistance. In this context, to retain normal function of ER, it is critical to prepare antioxidants with ER-targeting capability for accurately clearing excessive ROS in the ER region.
To our knowledge, no ER-targeted antioxidants have yet been reported. To fill the gap, herein we demonstrate the preparation of ER-targeting Se-doped CDs (ER-Se-CDs) and assays with HeLa cells as well as in vivo tests with mice have shown that ER-Se-CDs can significantly eliminate both •OH and O2•− (Fig. 1). Se-CDs covered with redox-responsive moiety (-C-Se) were conveniently prepared from selenocystamine through a benign hydrothermal approach, followed by the covalent conjugation with 3-((2-((4-methylphenyl)sulfonamido)ethyl)amino)-3-oxopropanoic acid, an ER targeting unit. The as-obtained ER-targeting unit modified Se-CDs, referred as ER-Se-CDs, showed superb scavenging capabilities toward O2•− and •OH, low cyotoxicity, and ER targetability. By virtue of these properties, ER-Se-CDs had been resoundingly used to consume raised ROS in ER region. More excitedly, ER-Se-CDs can effectively relieve phorbol 12-myristate 13-acetate (PMA) triggered ear inflammation of live mice.
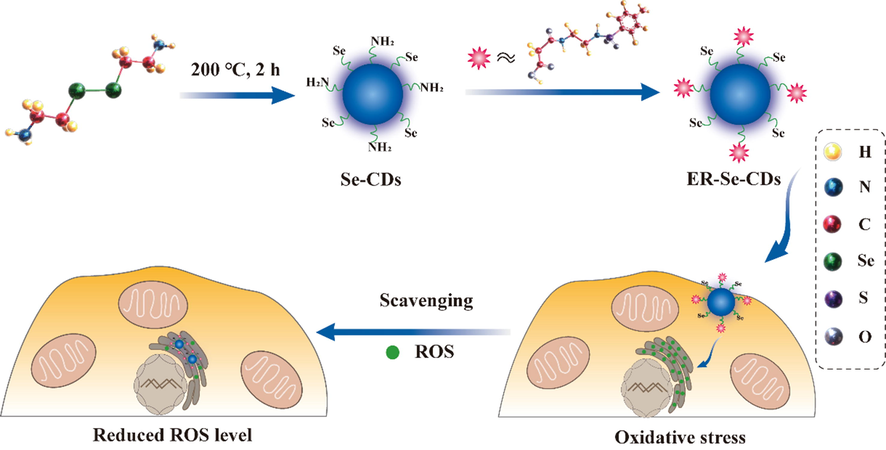
- Schematic illustration of the preparation of ER-Se-CDs and its utilization in diminishing ROS in ER.
2 Experimental section
2.1 Reagents
Selenocystamine, 5,5-dimethyl-1-pyrroline N-oxide (DMPO), glutathione, riboflavin, methionine, nitro blue tetrazolium (NBT), FeCl2, NaHCO3, H2O2 were supplied by Aladdin Chemistry Co. Ltd. N-(2-aminoethyl)-4-methyl-benzenesulfonamide, phorbol 12-myristate 13-acetate (PMA), 3-(4,5-dimethylthiazol-2-yl)-2,5-diphenyl tetrazolium bromide (MTT), and LiOH were bought from Sigma-Aldrich. Methyl 3-chloro-3-oxopropanoate was a kind gift from Dr. Zhichao Liu. 2′,7′-Dichlorofluorescein diacetate (DCFH-DA) were purchased from Beyotime Chemical Reagent Co. Ltd. High glucose Dulbecco’s modified Eagle’s media (DMEM) were received from KeyGEN Biotech. Co. Ltd. All the mentioned reagents were of analytical grade and used as received.
2.2 Characterizations
Absorption spectra were acquired on a Shimadzu UV-2550 spectrophotometer. Fluorescence spectra were measured on a F-4600 fluorescence spectrophotometer (Hitachi). Transmission electron microscopy (TEM) experiments were performed on transmission electron microscope working at an acceleration voltage of 200 kV (JEOL JEM-2100F). Atomic force microscopic (AFM) characterizations were conducted in the ScanAsyst mode under ambient conditions (Bruker). X-ray photoelectron spectroscopy (XPS) data was collected using a thermoelectron instrument (Thermo Scientific ESCALAB 250). Fourier transform infrared spectroscopy (FTIR) spectrum of the samples were acquired by applying a Nicolet iS10 FTIR spectrometer. Electron spin resonance (ESR) experiments were carried out on a Bruker ELEXSYS E500 ESR spectrometer. 1H and 13C nuclear magnetic resonance (NMR) spectra were obtained from a Bruker 500 MHz spectrometer. Confocal fluorescence and bright field images (512 × 512 pixels) were acquired with a Leica TCS-SP8 confocal laser scanning microscope. Cells images were captured using a 63 × objective lens.
2.3 Synthesis of Se-CDs
Se-CDs can be synthesized from selenocystamine via a benign, one-pot solvothermal carbonization approach. Briefly, 0.1 g selenocystamine was dissolved in 40 mL of deionized water under rapid stirring. Then, the aqueous dispersion was transferred into a Teflon-lined autoclave (50 mL) and heated for 2 h at a temperature of 200 ℃. The resulting solution with reddish brown color was filtrated with a 0.22 μm filter membrane, centrifugated at 12000 g for 10 min, and dialyzed through a dialysis tubing with a molecular weight cutoff of 1000 Da (changing the water every 8 h). After lyophilization of the purified solution, Se-CDs powder can thus be acquired.
2.4 Synthesis of 3-((2-((4-methylphenyl)sulfonamido)ethyl)amino)-3-oxopropanoic acid (abbreviated as MOA)
To a round-bottomed flask (100 mL), in which N-(2-aminoethyl)-4-methyl-benzenesulfonamide (1.0 g, 4.7 mmol) was dissolved into a mixed solution of tetrahydrofuran (20 mL) and saturated NaHCO3 solution (5 mL), was introduced methyl 3-chloro-3-oxopropanoate (0.7 g, 5.1 mmol). After reaction for 1 h at 0 ℃, LiOH solution (2 M, 5 mL) was slowly injected, followed by another incubation at room temperature for ∼ 12 h. Afterwards, the solvent was discarded under reduced pressure and the obtained residue was purified by HPLC system using a gradient program (mobile phase: acetonitrile to water, from 5% to 95%, with 0.1% TFA) at 20 mL/min flow rate to afford desired product as pale yellow oily matter (0.24 g, yield: 17%). 1H NMR (400 MHz, CDCl3) δ (ppm): 7.92 (s, 1H), 7.77 (s, 1H), 7.67 (d, 2H), 7.22 (d, 2H), 6.31 (s, 1H), 3.37 (m, 4H), 3.00 (s, 2H), 2.34 (s, 3H). 13C NMR (400 MHz, CDCl3) δ (ppm): 171.11, 169.13, 143.63, 136.36, 129.82, 126.99, 42.16, 40.36, 39.66, 21.46. HRMS-ESI (m/z): [M + Na]+ calcd for C12H16N2NaO5S: 323.0678; found: 323.0672.
2.5 Preparation of ER-Se-CDs
The immobilization of MOA on Se-CD’s surface was realized under the activation of EDC/NHS. Typically, MOA solution (1.0 mL, 1.5 mM) was mixed with EDC/NHS (50 mg/50 mg) and activated at room temperature for 2 h. After then, Se-CDs solution (2.0 mL, 1.0 mg·mL−1) was introduced, and further reacted for one night to afford MOA functionalized Se-CDs (ER-Se-CDs). The unreacted MOA was removed by dialysis. By measuring the absorption spectra of MOA in the above collected water and the stock solution, density of MOA on the Se-CD surface were determined to be 46.6 μmol·g−1.
2.6 Cytotoxicity evaluations
HeLa cells were fostered at a density of ∼ 1 × 10⁴ cells per well in 96-well plates, and grown in DMEM containing 10% fetal bovine serum, 80 U·mL−1 penicillin, and 80 μg·mL−1 streptomycin in a humid incubator with 5% CO2/95% air. After 12 h, the culture media were removed, and fresh one with serial dilutions of ER-Se-CDs (0–80 μg·mL−1) was introduced, cultured for 48 h. As to each amount, five independent experiments were carried out. Thereafter, MTT solution (1.0 mg·mL−1) with a volume of 20 μL was injected into each well, culturing for 4 h to allow the formation of formazan crystals. Subsequently, 150 μL DMSO was added into the wells. Absorbance (A) of the resultant hybrid at 570 nm was measured. Cellular viability values were counted according to the following equation: cellular viability (%) = Atest/Acontrol × 100%, where Acontrol refers to the absorbance recorded from the control group, and Atest refers to the absorbance obtained with the presence of ER-Se-CDs.
2.7 Cellular imaging
The subcellular localization of ER-Se-CDs was investigated by co-localization bioimaging experiment, in which ER-Se-CDs (20 μg·mL−1) stained cells were again stained for 20 min with ER-Tracker Red (50 nM). After finishing the labeling experiments, cells were rinsed thoroughly with cool PBS. Fluorescence signal of ER-Tracker Red was obtained in 570–650 nm wavelength region (excited at 552 nm), as for ER-Se-CDs, an excitation wavelength of 405 nm was selected, and its blue fluorescence was collected in the wavelength region of 410–480 nm.
2.8 In vivo imaging
All animal experiments were approved by the Animal Ethics Committee of East China Normal University. Kunming male mice with a body weight of 15 g were selected for establishing an ear inflammation model, which was triggered by topically applying PMA solution (100 μg·mL−1, 50 μL) on the right ear. After incubation for 6 h, the mice were subcutaneously administered with ER-Se-CDs (20 μg·mL−1, 100 μL; 40 μg·mL−1, 100 μL). 0.5 h later, DCFH-DA (1 mM, 50 μL), a non-fluorescent cell permeable dye that reacts with intracellular ROS and emits fluorescence at 520 nm was injected. After another 0.5 h, fluorescence image of the mice body was captured with a PerkinElmer in vivo imaging system (λex = 488 nm; λem = 520 nm).
3 Results and discussion
3.1 Characterization of Se-CDs
In our experiment, Se-CDs can be conveniently prepared by one-step hydrothermal treating of selenocystamine solution (Fig. 1). The size and morphology of the obtained Se-CDs were characterized by TEM and AFM. TEM image in Fig. 2A shows that Se-CDs are distributed randomly and uniformly with a narrow size distribution in 2.4 ∼ 3.2 nm range (Fig. 2B). This size is comparable to other heteroatom doped CDs (Gong et al., 2016; Liu et al., 2017). The morphology of Se-CDs was further examined by AFM (Fig. 2C). From which, we can see that Se-CDs were monodispersed. The line scan of three individual CDs reveals that their topographic heights range from 2.6 to 3.3 nm (Fig. 2D), which agrees well with the TEM characterization.
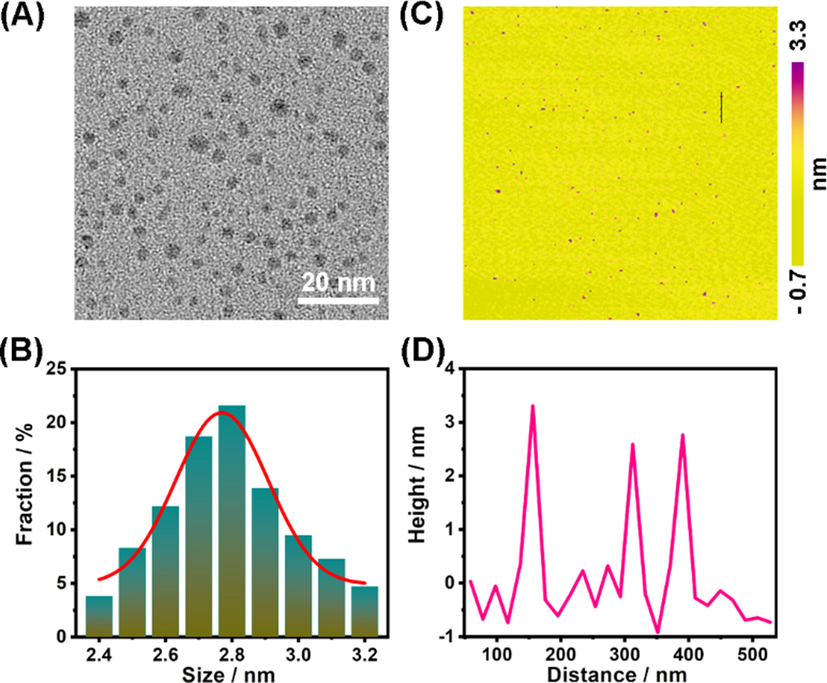
- (A) TEM characterization of Se-CDs. (B) Size distribution of Se-CDs. (C) Typical AFM image of Se-CDs. (D) Height distribution of Se-CDs along the black line in panel C.
Then, functional groups of the Se-CDs were studied by XPS experiments. As depicted in the XPS survey spectrum (Fig. 3A), four main peaks were found at 530.8 eV (O1s), 399.8 eV (N1s), 284.7 eV (C1s), along with 55.1 eV (Se3d), demonstrating that Se-CDs are dominantly composed of oxygen (atomic ratio: 9.57%), nitrogen (18.62%), carbon (64.91%), and selenium (6.9%). Deconvoluted XPS spectra for C1s (Fig. 3B) show that the C1s band contains three distinct peaks at 284.7, 286.1, and 287.9 eV, attributed to C–C, C-N/C-O/C-Se, and C = O, respectively (Li et al., 2017; Liu et al., 2020; Liu et al., 2023). Deconvoluted XPS spectra for N1s spectra show two peaks at 399.8 and 401.1 eV, ascribed to C-N-C and amino N, respectively (Fig. 3C) (Lu et al., 2017; Zhao et al., 2021). The high-resolution XPS spectrum of Se3d (55.1 eV) reveals -C-Se group existed on the surface of Se-CDs (Fig. 3D) (Huang et al., 2020). Besides, the absorption peaks appeared in the FTIR spectrum at 3429, 1578, and 1221 cm−1, respectively corresponding to N–H, C = N, and C-N, which suggested the existence of amine groups on the surface of the Se-CDs (Fig. S1, curve a) (Gong et al., 2019).
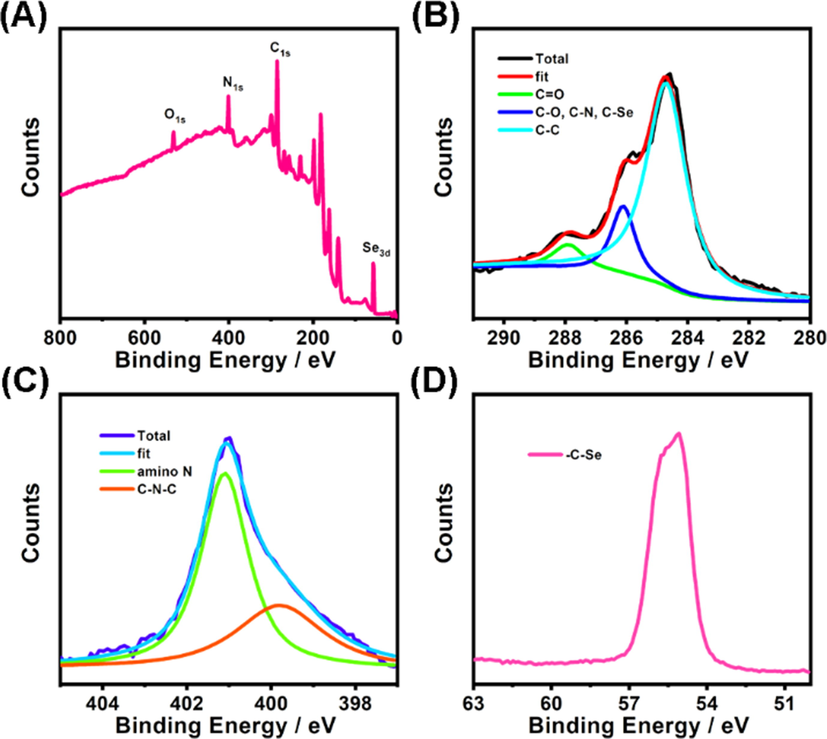
- (A) XPS survey spectrum of Se-CDs. (B) High-resolution C1s spectrum of Se-CDs. (C) High-resolution N1s spectrum of Se-CDs. (D) High-resolution Se3d spectrum of Se-CDs.
Subsequently, the optical features of Se-CDs were monitored. The absorption spectrum of Se-CDs presents two peaks at 241 and 299 nm, as indicated in Fig. S2, which respectively attributes to the π-π* transition of C = C band and n-π* electron transition of C = O band (Lu et al., 2018; Wang et al., 2016; Li et al., 2018). Under the excitation with a maximum wavelength of 369 nm (Fig. 4A, curve a), a strong emission peak centered at 445 nm is observable (Fig. 4A, curve b). Using quinine sulfate in 0.10 M H2SO4 solution as the reference, fluorescence quantum yield of Se-CDs was calculated to be 8.3%, which is comparable to Se-CDs reported by Xu and coworkers (Li et al., 2017). However, unlike previously reported Se-CDs, which show excitation-energy dependent fluorescence, the fluorescence peak of Se-CDs did not change under excitation in the wavelength range from 360 to 410 nm (Fig. 4B). The excitation-energy independent fluorescence of our Se-CDs probably result from its uniform size (Wang and Hu, 2014; Li et al., 2010). Remarkably, Se-CDs had robust photostability. Illuminating Se-CDs with a 405 nm light for 1 h witnessed truly little variation of its fluorescence (Fig. 4C). Besides, there were no changes in fluorescence intensity at high ionic strengths (Fig. 4D), suggesting the great potency of Se-CDs to be used in physical salt concentrations.
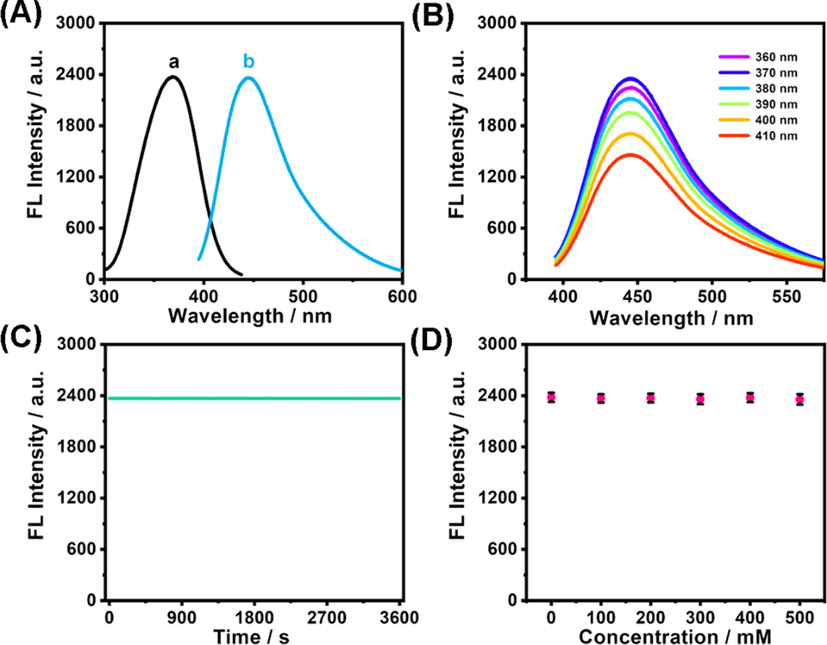
- (A) Fluorescence spectra of Se-CDs (a: excitation spectrum; b: emission spectrum). (B) Fluorescence spectra of Se-CDs gained at varied excitation from 360 to 410 nm. (C) Change of fluorescence intensity under uninterrupted irradiation by a 90 W Xe lamp (λex = 405 nm). (D). Variation of fluorescence intensity at 445 nm in NaCl solution.
Moreover, we found Se-CDs exhibited redox-responsive fluorescence. As shown in Fig. 5A and Fig. 5B (curve a and curve b), addition of H2O2 to Se-CD solution could induce an apparent increasement of its fluorescence. At the same time, selenic acid was generated in the presence of H2O2 (Fig. 5C). However, when reduced glutathione was introduced into the above mixed solution of Se-CDs and H2O2, the fluorescence intensity was nearly reduced back to its initial state (Fig. 5B, curve c). Concurrently, -C-Se was generated from the reduction of selenic acid (Fig. 5D). Overall, these analyses suggested that the redox state of Se atom had a prominent influence on the fluorescence of Se-CDs.
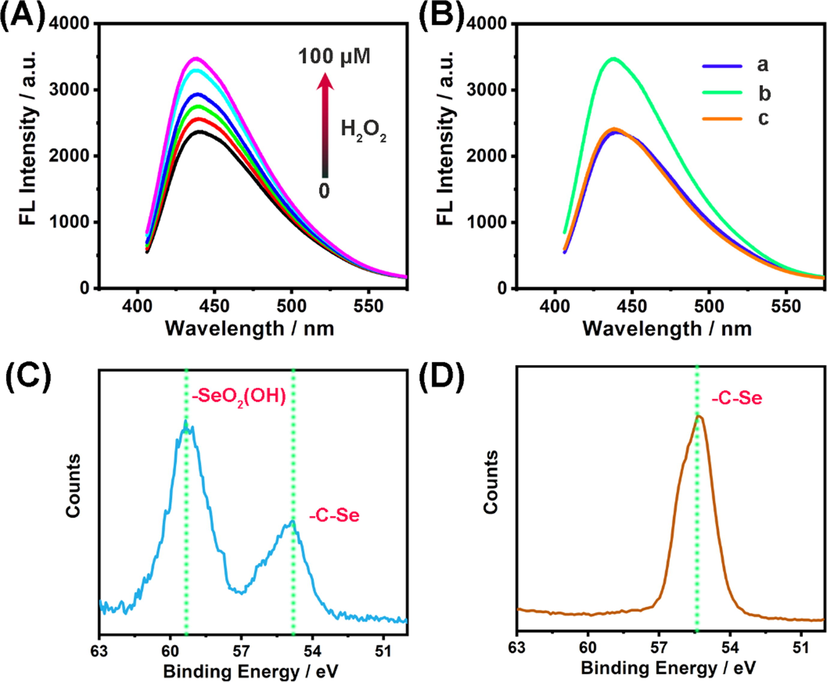
- (A) Fluorescence response of Se-CDs (20 μg·mL−1) to various amounts of H2O2 (From bottom to up: 0, 20, 40, 60, 80, and 100 μM). (B) Redox-responsive fluorescence of Se-CDs: (a) Se-CDs (20 μg mL−1); (b) Se-CDs (20 μg mL−1) + H2O2 (100 μM); (c) Se-CDs (20 μg mL−1) + H2O2 (100 μM) + glutathione (1.0 mM). (C) High-resolution XPS spectrum of Se3d in Se-CDs reacted with H2O2. (D) High-resolution XPS spectrum of Se3d in Se-CDs reacted with H2O2 and glutathione.
3.2 Synthesis of ER-Se-CDs
We then synthesized an ER targeting molecule, MOA, whose chemical structure was verified by 1H NMR, 13C NMR, and HRMS (Fig. S3–S6). MOA was rationally designed with two functional moieties. Moiety one is a methyl sulphonamide group, which is commonly used for targeting molecules and/or nanomaterials into ER region (Xiao et al., 2018; Huang et al., 2022), and moiety two is a carboxyl group that can be used for further conjugation with amine group. The fixation of MOA on Se-CDs was affirmed by FTIR spectroscopy. As shown in Fig. S1 (curve c), an absorption band at 1153 cm−1, assigned to the C-S group in MOA, was found in the FTIR spectrum of ER-Se-CDs. Additionally, a larger hydrodynamic size was obtained for ER-Se-CDs, as compared with that of Se-CDs, which further testified the successful preparation of ER-Se-CDs (Fig. S7). It is worthy to note that the attachment of MOA on Se-CDs had no obvious influence on the size and fluorescence of Se-CDs (Fig. S8-S9).
3.3 ROS scavenging efficiency of ER-Se-CDs
The existence of redox-responsive unit -C-Se on the surface of ER-Se-CDs implied its possibility to be used for eliminating •OH and O2•-. For investigating its elimination efficiency toward •OH, ESR experiments, a direct and reliable method to detect ROS, were carried out, in which Fe2+/H2O2 was chosen as the source to provide •OH and 5,5-dimethyl-1-pyrroline N-oxide (DMPO) as the spin trap agent (Huang et al., 2019). Typically, an intense four-line ESR signal with a height ratio of 1:2:2:1, characteristic of DMPO-OH adduct, could be detected once Fe2+/H2O2 was injected to DMPO solution, evidencing the high level of •OH (Fig. 5A, curve a). Upon ER-Se-CDs treatment, the ESR intensity of the above mixture significantly weakened in a dose-dependent manner (Fig. 6A, curve b-f). The ESR signal intensity decreased down to 28.1% (elimination efficiency: 71.9%) with the involvement of ER-Se-CDs at a concentration of 50 μg·mL−1 (Fig. 6B), indicating ER-Se-CDs possessed an excellent removal capacity toward •OH. Subsequently, O2•- removal capacity was assessed through determining the inhibition ratio of NBT reduction by O2•-. As seen in Fig. 6C (curve a), a strong absorption signal around 560 nm appeared after photoirradiation (intensity: 3500 lx; irradiation time: 15 min) of a mixture containing methionine, riboflavin, and NBT, reflecting the generation of O2•- in this process (Zhang et al., 2021). Once ER-Se-CDs was added into the aforesaid mixture, the absorption signal significantly decreased (Fig. 6C, curve b-f), as expected. More than 70% O2•- could be removed from the solution with ER-Se-CDs treatment at the concentration of 50 μg·mL−1 (Fig. 6D), suggesting the forceful O2•- removing ability of ER-Se-CDs. These results demonstrated that ER-Se-CDs can act as efficient scavengers for both •OH and O2•-.
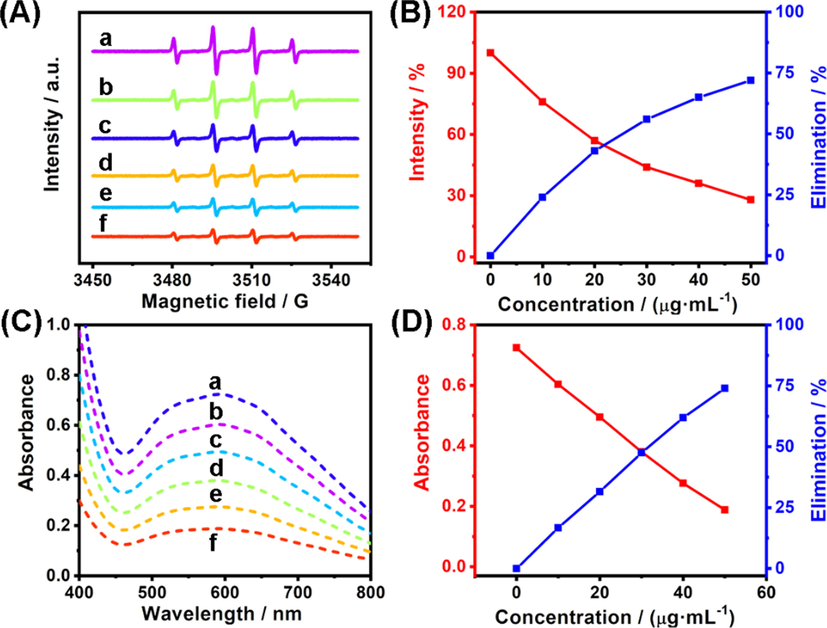
- (A) ESR spectra of DMPO (50 mM) with the co-existence of •OH (10 μM) and different amounts of ER-Se-CDs (a: 0 μg·mL−1; b: 10 μg·mL−1;c: 20 μg·mL−1; d: 30 μg·mL−1; e: 40 μg·mL−1; f: 50 μg·mL−1). (B) The corresponding intensity of ESR signal and elimination efficiency of ER-Se-CDs toward •OH. (C) Absorption spectra of a system comprised of riboflavin, methionine, and NBT with the existence of different concentrations of ER-Se-CDs (a: 0 μg·mL−1; b: 10 μg·mL−1;c: 20 μg·mL−1; d: 30 μg·mL−1; e: 40 μg·mL−1; f: 50 μg·mL−1). (D) The corresponding absorbance and elimination efficiency of ER-Se-CDs toward O2•-.
3.4 Scavenging activity of ER-Se-CDs in cells
After successfully verifying ER-Se-CDs’ antioxidant capacity, its potency as scavengers against intracellular ROS was explored. Prior to this investigation, cytotoxicity of ER-Se-CDs was studied by standard MTT assay with various dosages of ER-Se-CDs and incubated for a period of 48 h. The findings, as shown in Fig. 7A, revealed that even incubated with a high dosage (up to 80 μg·mL−1) of ER-Se-CDs, the cells still showed a high viability rate over 90%. As such, we conclude that ER-Se-CDs is almost nontoxic to live cells.
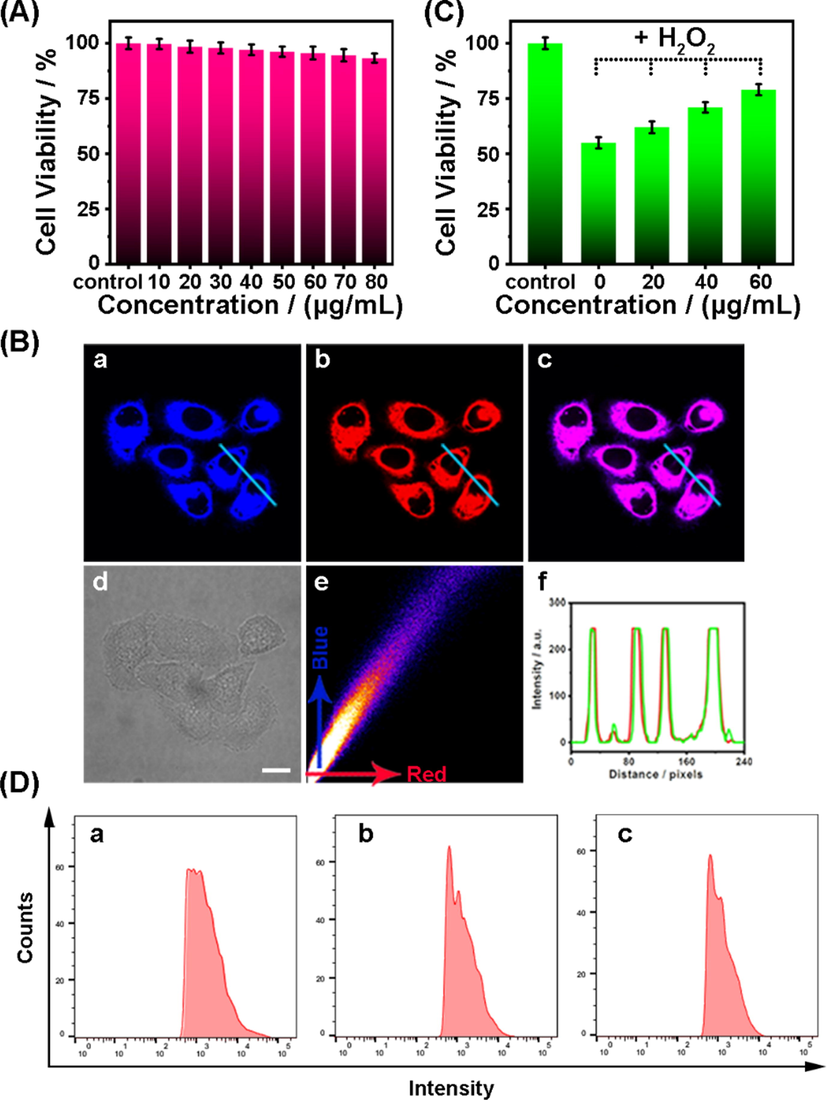
- (A) Viabilities of HeLa cells incubated with different amounts of ER-Se-CDs. (B) Co-localization investigations in HeLa cells that were co-labeled with ER-Se-CDs (20 μg·mL−1) and ER-Tracker Red (50 nM): (a) fluorescence image from ER-Se-CDs (λem = 410–480 nm, λex = 405 nm); (b) fluorescence image from ER-Tracker Red (λem = 570–650 nm, λex = 552 nm); (c) the merged image of (a) and (b); (d) the bright field image; (e) the corresponding intensity correlation plot of the blue channel with red channel; (f) intensity profiles of ER-Se-CDs and ER-Tracker Red along the line across the cell. Scale bar: 10 μm. (C) Protective capabilities of ER-Se-CDs to HeLa cells from oxidative damage initiated by H2O2 (150 μΜ). Data showed are mean values and standard deviations from five independent experiments. (D) HeLa cells were co-incubated with DCFH-DA (10 µM) and PMA (3 μg·mL−1) with or without ER-Se-CDs and analyzed by flow cytometry: (a) DCFH-DA + PMA; (b) DCFH-DA + PMA + ER-Se-CDs (20·μg mL−1); (c) DCFH-DA + PMA + ER-Se-CDs (40 μg·mL−1).
As ER-Se-CDs was functionalized by methyl sulphonamide group, which possesses ER-targeting capability, we then examined its potential to localize into ER of cells. In this respect, co-localization experiment was conducted via treating cells with ER-Se-CDs (20 μg·mL−1) and commercial ER-Tracker Red (50 nM) in sequence. As displayed in Fig. 7B, the bright blue fluorescence from ER-Se-CDs (Fig. 7Ba) showed a large extent of overlap with the red fluorescence from ER-Tracker Red (Fig. 7Bb), as observed from the intense pink signal in the merged image (Fig. 7Bc). The corresponding Pearson's coefficient is 0.87 (Fig. 7Be). Moreover, the variations in the intensity profiles of the lines across the cells are coinstantaneous in the two separate channels (Fig. 7Bf). On the other hand, a high Pearson’s coefficient value of 0.85 was also obtained when co-localization experiments were conducted in living astrocytes with ER-Se-CDs and ER-Tracker Red (Fig. S10). These results inferred that with the anchor of methyl sulphonamide group, ER-Se-CDs, as expected, can selectively reside in ER region.
Oxidative stress occurs as the amount of ROS exceeds the antioxidant competence of cellular antioxidants, giving rise to severe harm to nucleic acids, proteins, and lipids. Since ER-Se-CDs presented high elimination efficiency toward •OH and O2•-, low cytotoxicity, and ER targetability, we envisioned that ER-Se-CDs could exert an efficient protection against ROS-induced damage within ER. Then, H2O2 was served as the damage initiator to assess the protection ability of ER-Se-CDs against oxidative stress. The corresponding data are displayed in Fig. 7C. It was obvious that ER-Se-CDs, the first ER targetable nanoantioxidant, could dose-dependently restrain ROS-caused decline of cell viabilities. Moreover, to further monitor the cellular ROS level after treatment with different amounts of ER-Se-CDs, DCFH-DA assay was performed by flow cytometry. DCFH-DA itself showed no fluorescence. Once it enters into cells, it would be hydrolyzed by cellular enzyme to produce DCFH, which could emit strong fluorescence after being oxidized by ROS (Wei et al., 2019). As seen in Fig. 7D, a lower fluorescence intensity was observed for the cells pre-incubated with ER-Se-CDs than the cells treated with H2O2 alone, suggesting a lower level of ROS in the cells pre-treated with ER-Se-CDs. Together, these data demonstrate that ER-Se-CDs is competent to consume ROS in ER region.
3.5 In vivo anti-inflammation
The in vivo anti-inflammation performance of ER-Se-CDs was also studied. In the experiments, to establish an inflammation model of the right ear, PMA, an apoptotic drug that can initiate tissue inflammation was regionally applied. As shown, no visible fluorescence signal was found from the right ear of the mouse solely treated with DCFH-DA, manifesting a low level of ROS (Fig. 8A). In sharp contrast, a strong fluorescence was clearly perceptible from DCFH-DA and PMA co-treated ear, demonstrating the elevation of ROS level in this process (Fig. 8B). After subcutaneously treated with ER-Se-CDs, the fluorescence in the inflamed region strongly quenched (Fig. 8C and 8D). Additionally, as shown in Fig. S11, hematoxylin and eosin (H&E) stained histological images of heart, liver, spleen, lung, and kidney demonstrated negligible toxicity of ER-Se-CDs toward major organs. These results indicated that ER-Se-CDs possessed an efficient ROS scavenging ability against ear inflammation in live mice with great biosafety.
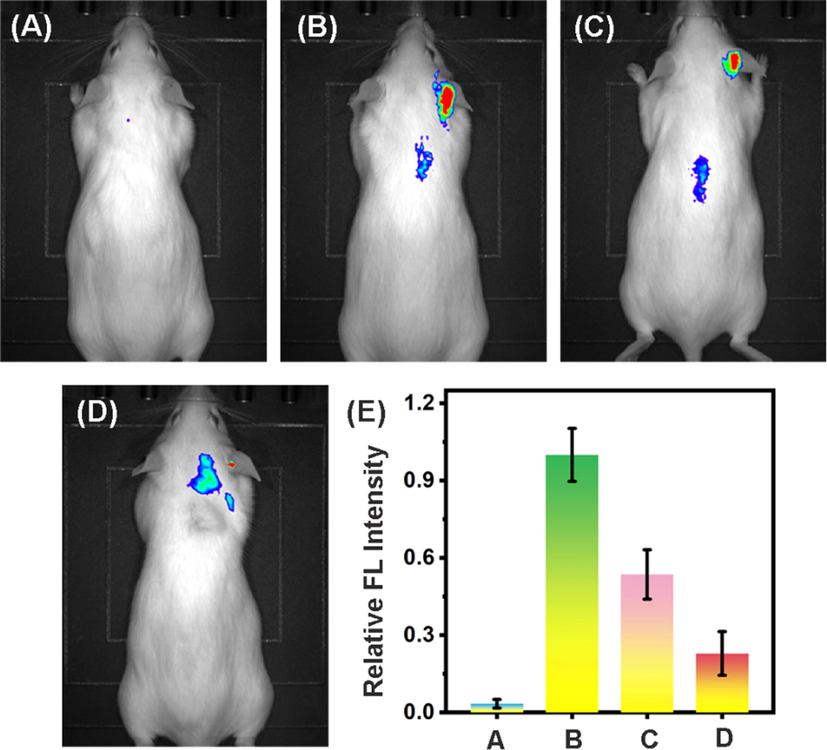
- (A) In vivo fluorescence imaging of mouse solely treated with DCFH-DA (1 mM, 50 μL) in the right ear region. (B) In vivo fluorescence imaging of mouse sequentially treatment with PMA (100 μg·mL−1, 50 μL) and DCFH-DA (1 mM, 50 μL). (C) In vivo fluorescence imaging of mouse orderly treated with PMA (100 μg·mL−1, 50 μL), ER-Se-CDs (20 μg·mL−1, 100 μL), and DCFH-DA (1 mM, 50 μL). (D) In vivo fluorescence imaging of mice sequentially treated with PMA (100 μg·mL−1, 50 μL), ER-Se-CDs (40 μg·mL−1, 100 μL), and DCFH-DA (1 mM, 50 μL). Each group contains five mice. (E) Relative fluorescence intensity in panel A–D. All the fluorescence intensities were compared to panel B, which was normalized to 1.0.
4 Conclusion
In this work, we successfully constructed an ER-targeting Se-CDs that effectively eliminate both •OH and O2•- in vitro and in vivo. The Se-CDs with uniform size distribution and redox-responsive fluorescence can be conveniently synthesized via a one-pot hydrothermal method. After modified by methyl sulphonamide group, ER-Se-CDs with robust scavenging power toward •OH and O2•-, low cytotoxicity and ER targeting capability was obtained. Because of these satisfying properties, ER-Se-CDs had been utilized to protect cells against raised ROS levels in ER region. Importantly, ER-Se-CDs effectively relieved PMA-induced ear inflammation of live mice. To conclude, these results demonstrate that ER-Se-CDs is a promising nanoantioxidant for alleviating ROS-related inflammation and holds great prospect in clinic.
Acknowledgements
The authors gratefully thank the Zhejiang Provincial Natural Science Foundation of China (Grant No. LQ20B050003), the Scientific Research Project of Shanghai Urban Construction Vocational College (AA-05-2023-01-03-08; AA-05-2023-01-03-05-11).
Declaration of Competing Interest
The authors declare that they have no known competing financial interests or personal relationships that could have appeared to influence the work reported in this paper.
References
- Polydopamine nanoparticles as efficient scavengers for reactive oxygen species in periodontal disease. ACS Nano. 2018;12:8882-8892.
- [Google Scholar]
- Fluorescent Se-modified carbon nitride nanosheets as biomimetic catalase for free-radical scavenging. Chem. Commun.. 2020;56:916-919.
- [Google Scholar]
- Ultra-stable tellurium-doped carbon quantum dots for cell protection and near-infrared photodynamic application. Sci. Bull.. 2020;65:1580-1586.
- [Google Scholar]
- Carbon nanodots from date molasses: new nanolights for the in vitro scavenging of reactive oxygen species. J. Mater. Chem. B. 2014;2:6839-6847.
- [Google Scholar]
- Endoplasmic reticulum targeting to amplify immunogenic cell death for cancer immunotherapy. Nano Lett.. 2020;20:1928-1933.
- [Google Scholar]
- Chemistry and biology of reactive oxygen species in signaling or stress responses. Nat. Chem. Biol.. 2011;7:504.
- [Google Scholar]
- Facile synthesis of ultrahigh fluorescence N, S-self-doped carbon nanodots and their multiple applications for H2S sensing, bioimaging in live cells and zebrafish, and anti-counterfeiting. Nanoscale. 2020;12:20482-20490.
- [Google Scholar]
- A novel bis-component AIE smart gel with high selectivity and sensitivity to detect CN−, Fe3+ and H2PO4−. Soft Matter. 2019;15:6348-6352.
- [Google Scholar]
- Phosphorus, and nitrogen co-doped carbon dots as a fluorescent probe for real-time measurement of reactive oxygen and nitrogen species inside macrophages. Biosens. Bioelectron.. 2016;79:822-828.
- [Google Scholar]
- Fluorescent imaging of reactive oxygen and nitrogen species associated with pathophysiological processes. Chem. 2020;6:832-866.
- [Google Scholar]
- A comprehensive study on the generation of reactive oxygen species in Cu-Aβ-catalyzed redox processes. Free Radic. Biol. Med.. 2019;135:125-131.
- [Google Scholar]
- A ratiometric fluorescent probe for bioimaging and biosensing of HBrO in mitochondria upon oxidative stress. Chem. Commun.. 2018;54:12198-12201.
- [Google Scholar]
- Selenium-doped two-photon fluorescent carbon nanodots for in-situ free radical scavenging in mitochondria. J. Colloid Interf. Sci.. 2020;567:402-409.
- [Google Scholar]
- Endoplasmic reticulum-targeted polymer dots encapsulated with ultrasonic synthesized near-infrared carbon nanodots and their application for in vivo monitoring of Cu2+. J. Colloid Interf. Sci.. 2022;627:705-715.
- [Google Scholar]
- A two-photon fluorescence probe with endoplasmic reticulum targeting ability for turn-on sensing photosensitized singlet oxygen in living cells and brain tissues. Talanta. 2022;237:122963
- [Google Scholar]
- Water-soluble fluorescent carbon quantum dots and photocatalyst design. Angew. Chem. Int. Edit.. 2010;49:4430-4434.
- [Google Scholar]
- Selenium-doped carbon quantum dots for free-radical scavenging. Angew. Chem. Int. Ed.. 2017;56:9910-9914.
- [Google Scholar]
- Highly fluorescent chiral N-S-doped carbon dots from cysteine: affecting cellular energy metabolism. Angew. Chem. Int. Edit.. 2018;57:2377-2382.
- [Google Scholar]
- New progress in spectroscopic probes for reactive oxygen species. J. Anal. Test.. 2018;2:2-19.
- [Google Scholar]
- Dual photoluminescence emission carbon dots for ratiometric fluorescent GSH sensing and cancer cell recognition. ACS Appl. Mater. Interfaces. 2020;12:18250-18257.
- [Google Scholar]
- Non-metal-heteroatom-doped carbon dots: synthesis and properties. Chem. Eur. J.. 2019;25:1165-1176.
- [Google Scholar]
- Spatially organized functional bioreactors in nanoscale mesoporous MOFs for cascade scavenging of intracellular ROS. Chem. Mater.. 2021;33:2198-2205.
- [Google Scholar]
- Red emission B, N, S-co-doped carbon dots for colorimetric and fluorescent dual mode detection of Fe3+ ions in complex biological fluids and living cells. ACS Appl. Mater. Interfaces. 2017;9:12663-12672.
- [Google Scholar]
- Deep red emissive carbonized polymer dots with unprecedented narrow full width at half maximum. Adv. Mater.. 2020;32:1906641
- [Google Scholar]
- Covalent organic framework/g-C3N4 van der Waals heterojunction toward H2 production. Inorg. Chem.. 2023;62:3271-3277.
- [Google Scholar]
- Recent advances in development of devices and probes for sensing and imaging in the brain. Sci. China Chem.. 2021;64:915-931.
- [Google Scholar]
- Raman fiber photometry for understanding mitochondrial superoxide burst and extracellular calcium ion influx upon acute hypoxia in the brain of freely moving animals. Angew. Chem. Int. Ed.. 2022;61:e202111630
- [Google Scholar]
- Near-infrared photoluminescent polymer–carbon nanodots with two-photon fluorescence. Adv. Mater.. 2017;29:1603443
- [Google Scholar]
- Concentrated solar irradiation protocols for the efficient synthesis of tri-color emissive carbon dots and photophysical studies. J. Mater. Chem. C. 2018;6:13013-13022.
- [Google Scholar]
- Selenium-doped carbon quantum dots efficiently ameliorate secondary spinal cord injury via scavenging reactive oxygen species. Int. J. Nanomedicine. 2020;15:10113-10125.
- [Google Scholar]
- Selenium-doped carbon quantum dots act as broad-spectrum antioxidants for acute kidney injury management. Adv. Sci.. 2020;7:2000420.
- [Google Scholar]
- Carbon quantum dots: synthesis, properties and applications. J. Mater. Chem. C. 2014;2:6921-6939.
- [Google Scholar]
- The impact of the endoplasmic reticulum protein-folding environment on cancer development. Nat. Rev. Cancer. 2014;14:581-597.
- [Google Scholar]
- Highly fluorescent carbon dots for visible sensing of doxorubicin release based on efficient nanosurface energy transfer. Biotechnol. Lett.. 2016;38:191-201.
- [Google Scholar]
- Carbon dots as a new class of nanomedicines: Opportunities and challenges. Coordin. Chem. Rev.. 2021;442:214010
- [Google Scholar]
- Carrier-free nano-integrated strategy for synergetic cancer anti-angiogenic therapy and phototherapy. Chem. Sci.. 2019;10:2778-2784.
- [Google Scholar]
- Simultaneous fluorescence visualization of endoplasmic reticulum superoxide anion and polarity in myocardial cells and tissue. Anal. Chem.. 2018;90:6081-6088.
- [Google Scholar]
- Graphdiyne nanoradioprotector with efficient free radical scavenging ability for mitigating radiation-induced gastrointestinal tract damage. Biomaterials. 2020;244:119940
- [Google Scholar]
- Antioxidant capacity of nitrogen and sulfur codoped carbon nanodots. ACS Appl. Nano Mater.. 2018;1:2699-2708.
- [Google Scholar]
- ROS scavenging biopolymers for anti-inflammatory diseases: classification and formulation. Adv. Mater. Interfaces. 2020;7:2000632.
- [Google Scholar]
- Ceria nanozymes with preferential renal uptake for acute kidney injury alleviation. ACS Appl. Mater. Interfaces. 2020;12:56830-56838.
- [Google Scholar]
- Biofriendly molecular and protein release substrate with integrated piezoelectric motivation and anti-oxidative stress capabilities. Nanoscale. 2021;13:8481-8489.
- [Google Scholar]
- Multi-enzyme mimetic ultrasmall iridium nanozymes as reactive oxygen/nitrogen species scavengers for acute kidney injury management. Biomaterials. 2021;271:120706
- [Google Scholar]
- Self-enhanced carbonized polymer dots for selective visualization of lysosomes and real-time apoptosis monitoring. iScience. 2020;23:100982
- [Google Scholar]
- Facile synthesis of water-stable multicolor carbonized polymer dots from a single unconjugated glucose for engineering white light-emitting diodes with a high color rendering index. ACS Appl. Mater. Interfaces. 2021;13:30098-30105.
- [Google Scholar]
- Development of optical nanoprobes for molecular imaging of reactive oxygen and nitrogen species. Nano Res.. 2018;11:5258-5280.
- [Google Scholar]
- Lysosome-targetable selenium-doped carbon nanodots for in situ scavenging free radicals in living cells and mice. Microchim. Acta. 2021;188:223.
- [Google Scholar]
- Carbon dots doped with heteroatoms for fluorescent bioimaging: a review. Microchim. Acta. 2017;184:343-368.
- [Google Scholar]
Appendix A
Supplementary data
Supplementary data to this article can be found online at https://doi.org/10.1016/j.arabjc.2023.105036.
Appendix A
Supplementary data
The following are the Supplementary data to this article:


