

Translate this page into:
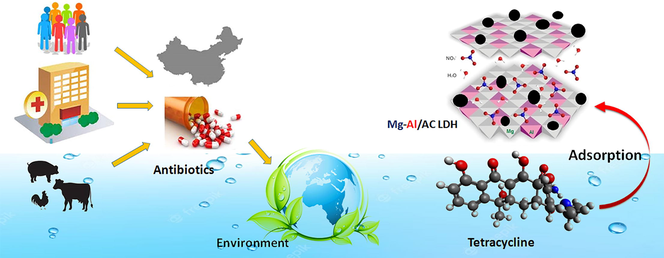
Enhanced adsorption performance of tetracycline in aqueous solutions using Mg-Al-LDH/AC nanocomposite
⁎Corresponding authors. s.asadpour@sku.ac.ir (Saeid Asadpour), s.asadpour@gmail.com (Saeid Asadpour), n.sarmast2010@gmail.com (Narges Sarmast)
-
Received: ,
Accepted: ,
This article was originally published by Elsevier and was migrated to Scientific Scholar after the change of Publisher.
Peer review under responsibility of King Saud University.
Abstract
Abstract
Water contamination with antibiotics promotes environmental antibiotic resistance. Tetracycline(TC), commonly used in agriculture, pollutes water and enables bacteria to develop resistance genes. Mg-Al-layered double hydroxides/Activated carbon (Mg-Al-LDH/AC) nanocomposite effectively removes tetracycline from water in this study. The synthesized adsorbent was characterized using Brunauer–Emmett–Teller (BET), Fourier-transform Infrared Spectroscopy (FT-IR), Field Emission Scanning Electron Microscopy (FESEM), X-Ray Diffraction (XRD), and Energy-dispersive X-ray spectroscopy (EDS) tests, and exhibited a large surface area of 105.46 m2/g, a total pore volume of 0.4571 cm3/g, and an average pore diameter of 27.99 nm. The optimal conditions for eliminating TC using the Mg-Al-LDH/AC nanocomposite were determined via the central composite design response surface methodology (CCD-RSM) approach. The responses were evaluated using a second-order polynomial multiple regression model, which was found to be a satisfactory fit to the data based on the analysis of variance (R2 = 0.9690, R2Adj = 0.9478, and R2Pred = 0.9042). The ideal conditions were identified as pH = 5.1, 0.11 g of adsorbent, a TC concentration of 50 mg/L, and a contact time of 90 min. The adsorption isotherms showed that TC elimination follows the Langmuir model with a maximum adsorption capacity of 106.4 mg/g and a high R2 value of 0.9986. The kinetics of the TC adsorption process was found to fit the pseudo-second-order model with a correlation value of 0.9997. The values of ΔG, ΔH, and ΔS for TC were determined to be 1.90 kJ/mol (at 333.15 K), −41.97 kJ/mol, and −0.131 kJ/(mol·K), respectively. Additionally, the study showed that ionic strength did not affect the effectiveness of TC removal, and the adsorbent was effective in removing TC antibiotics in a range of ionic strengths. Finally, the study found that adding 20% by weight of AC to LDH resulted in the best TC removal efficiency.
Keywords
Layered double hydroxide
Activated carbon
Central compound design
Adsorption isotherm
Tetracycline

1 Introduction
Antibiotics have been widely used for the treatment and prevention of bacterial infection in veterinary and human medicine, as well as in agriculture. Their abundant use as well as the ineffectiveness of traditional sewage handling methods have resulted in the accumulation of a number of antibiotics in water supplies and aquatic environments (Wei et al., 2021; Guo et al., 2020).
Tetracyclines (TCs), which are produced naturally by the fermentation of some fungi or by semi-synthetic processes, are the second most popular class of antibiotics in terms of production and consumption worldwide. TCs are currently used repeatedly and indiscriminately to treat a variety of infectious diseases. In addition, the presence of these medicinal substances in the environment promotes the development of antibiotic-resistant pathogens, which may pose a threat to both human and ecological health. The presence of these antibiotics in the environment, including the aquatic environment, can result in a variety of reactions, ranging from straightforward allergies to direct toxicity in some cases. TC and other antibiotics must thus be under control and managed to maintain a safe environment (Pouretedal and Sadegh, 2014).
The adsorption procedure stands out among all antibiotic abatement techniques because it is affordable, simple to use, and effective in removing organic pollutants from water. Anionic clays called Layered Double Hydroxides (LDHs) have a structure similar to brucite [Mg (OH)2]. It is made up of layers of positively charged metal hydroxide that are stacked in layers and are kept apart and stable by an interlamellar area that is made up of anions and water. It has the general formula [M1-x+2Mx+3 (OH)2]+xAx/n-n mH2O, where M2+ is a divalent cation (Mg, Zn, Ca) and M3+ is a trivalent cation (Al, Cr, Fe) (Lin et al., 2014).
The use of LDH as effective adsorbents is now of significant interest because of their lamellar structure, high porosity, substantial surface area, and favorable ion exchange capacity. The removal of organic and inorganic chemicals from polluted water is thought to be possible using LDHs. LDHs can lixiviate when utilized in continuous treatments or regeneration processes, however, they lack mechanical resistance. As a result, using larger, more powerful particles with adsorptive qualities as support (such as activated carbon (AC) is a viable option (Wang et al., 2007; Shan et al., 2014; Lins et al., 2020). Recently, several researchers have suggested using ACs as support for nanometric particles to lessen their agglomeration, improve their surface area, and lessen the exfoliation phenomenon (Yao et al., 2014; Wang et al., 2015; Wang et al., 2019). AC is a top choice for supporting materials in the wastewater treatment industry due to its renewability, widespread availability, cheap cost, biocompatibility, and biodegradability (Aldawsari et al., 2021).
The study aimed to optimize the removal of the antibiotic TC from water using an Mg-Al-LDH/AC nanocomposite. RSM based on CCD was employed to analyze and optimize key factors such as pH, adsorbent mass, TC concentration, and time. Modeling studies were conducted to quantify equilibrium isotherm, kinetic, and thermodynamic properties. The research concluded that the Mg-Al-LDH/AC nanocomposite effectively removes TC from water.
2 Materials and methods
2.1 Reagents and materials
All of the supplies utilized in this investigation came from Merck and Sigma-Aldrich (Tetracycline hydrochloride (≥95%), Mg (NO3)2·6H2O (99%), Al (NO3)2·9H2O (≥98%), NaOH (≥99%), Na2CO3 (≥99%), HCl (37%), NaCl (≥99%), and commercial AC with a particle size of 325–400 mesh, supplied by Merck).
2.2 Preparation of laboratory solutions
TC samples were made from a stock solution with a concentration of 400 mg/L. To determine the concentration of TC in the samples, an adsorption calibration curve was drawn based on the concentration. Additionally, 0.1 M solutions of NaOH and HCl were made to alter the pH. Furthermore, a calibration graph was constructed by preparing aqueous solutions of TC at different concentrations (3, 8, 10, 20, 30, 40, and 50 mg/L). The resulting calibration curve is presented in Fig. 1S.
2.3 Synthesis of Mg-Al-LDH/AC nanocomposite
2.3.1 Synthesis of Mg-Al LDH
Mg2+/Al3+ salts were precipitated in a 2:1 ratio to produce Mg-Al LDH (Sarmast et al., 2019) (Huang et al., 2021). 0.03 mol (7.6923 g) of Mg (NO3)2·6H2O and 0.015 mol (5.6269 g) of Al (NO3)2·9H2O were dissolved in 20 ml of double-distilled water at 50 °C and continuously stirred for 30 min at a speed of 600–700 rpm. For each alkaline solution, 150 ml of double-distilled water was used to dissolve 0.072 mol (2.88 g) of NaOH and 0.03 mol (3.18 g) of Na2CO3. The alkaline solution of the necessary salts was then added to the flask. The components were then combined for 1 h at 65 °C at a speed of 1200 rpm after the pH was adjusted to 10. The resultant mixture was then maintained at the same temperature for 4 h without stirring, which is known as the aging process. The sediment was then centrifuged and washed several times with double distilled water to neutralize the pH before being dried in an oven at 80 °C for 24 h. The resulting material was finely milled in chinese mortar manually until fully powdered and employed in the manufacture of composites.
2.3.2 Synthesis of Mg-Al-LDH/AC nanocomposite
Carbon weight percentages of 10%, 20%, 30%, 40%, and 50% were used to create an Mg-Al-LDH/AC nanocomposite. Finally, for adsorption studies, an LDH/20%AC-NC was utilized. To make this composite, 1 g of synthesized Mg-Al LDH was weighed and 100 ml of double distilled water was added, followed by 30 min of ultra-sonication at 35 °C. 20% by weight of AC was added to the flask containing LDH and ultra-sonicated for another 30 min. The colloidal solution was then agitated continuously for 2 h at 65 °C and a speed of 1200 rpm using a magnetic stirrer. The homogeneous mixture was then centrifuged, rinsed with distilled water, and dried at 80 °C to produce a composite. In the same approach, other weight percentages of AC were produced (Sharifi-Bonab et al., 2020).
2.4 Central composite design
By the Design-Expert-v11 program, the subcategory of RSM and CCD was used to evaluate the impact of the primary variables, interaction, and square effects between them to reduce the number of tests and save time and money. Table 1 lists the variety of factors that were examined.
Affecting factors
Test scope
A:pH
2.5–8.5
B: Adsorbent mass (g)
0.03–0.15
C: TC concentration (mg/L)
30–100
D: Contact time (min)
30–150
The response variable taken into consideration was removal efficiency. 30 experiments were run in three-time blocks and were constructed using the CCD approach and the amount of parameters listed in Table 2. The table lists the quantity and circumstances of tests for the optimization of four components.
Experiment
Block
Influential factors
Response
pH
Adsorbent mass (g)
Concentration (mg/L)
Contact time (min)
Removal efficiency (%)
Experimental
Predicted
1
First day
7
0.06
82
120
81.48
79.63
2
First day
4
0.06
48
120
91.32
90.88
3
First day
7
0.12
82
60
86.08
84.48
4
First day
4
0.12
48
60
90.52
90.17
5
First day
4
0.06
82
60
76.38
75.38
6
First day
7
0.12
48
120
94.36
94.34
7
First day
5.5
0.09
66
90
84.16
86.18
8
First day
4
0.12
82
120
88.46
89.91
9
First day
7
0.06
48
60
84.60
81.01
10
First day
5.5
0.09
66
90
84.17
86.18
11
Second day
4
0.12
82
60
82.56
81.32
12
Second day
7
0.12
48
60
84.44
85.76
13
Second day
5.5
0.09
66
90
83.75
83.42
14
Second day
7
0.06
48
120
83.46
84.08
15
Second day
7
0.12
82
120
87.89
87.96
16
Second day
4
0.06
82
120
79.62
78.45
17
Second day
7
0.06
82
60
69.78
71.04
18
Second day
4
0.06
48
60
81.50
82.3
19
Second day
5.5
0.09
66
90
84.80
83.42
20
Second day
4
0.12
48
120
93.14
93.23
21
Third day
8.5
0.09
66
90
66.52
60.81
22
Third day
5.5
0.09
66
90
79.16
76.53
23
Third day
5.5
0.09
30
90
89.42
88.83
24
Third day
5.5
0.03
66
90
71.05
72.45
25
Third day
5.5
0.09
66
150
84.93
85.16
26
Third day
5.5
0.15
66
90
89.23
88.76
27
Third day
5.5
0.09
66
90
77.13
76.53
28
Third day
5.5
0.09
100
90
73.82
75.16
29
Third day
2.5
0.09
66
90
63.35
63.89
30
Third day
5.5
0.09
66
30
72.90
73.5
2.5 Characterization of Mg-Al-LDH/AC nanocomposite
The following methods were used to characterize the synthesized materials: FESEM, XRD, EDS, BET, and FTIR.
3 Results and discussion
3.1 Characterization of Mg-Al-LDH/AC nanocomposite
Fig. 1 depicts the XRD pattern for the LDH/20% AC-NC and pure Mg-Al LDH (a and b). In this pattern, all Mg-Al LDH peak comparisons to the sources are seen. Diffraction peaks for Mg-Al LDH may be found at points 11.6, 23.4, 34.9, 39.39, 46.9, 61, and 2θ = 62.3 respectively. These points correlate to crystal plates (003), (006), (009), (012), (015), (110), and (113). Additionally, the LDH/20% AC-NC sample contains AC in the region of 2θ = 27. The average size of the crystallites was obtained using Scherer's relation for the peak with the highest intensity, i.e. the peak with an angle of 11.6°, about 11 nm. The value of d003 for LDH/20% AC-NC is approximately equal to 14 nm.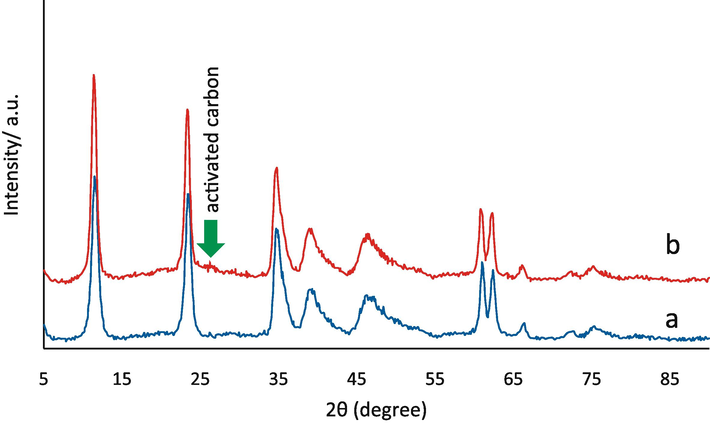
X-ray diffraction pattern a) Mg-Al LDH, b) Mg-Al-LDH/AC nanocomposite.
The FT‐IR spectra of the AC, LDH and LDH/20% AC are shown in Fig. 2. In all the spectra, the broad observed peaks at 3400–3500 cm−1 were attributed to the O–H stretching vibrations. The other notable finding for these figures (b, c) is the appearance of the strong peak at 1358 cm−1 imputed to the interlayer CO32− anion replaced with NO3–. The peak absorved in 1031 cm−1 in Fig. 2a attributed to C-O stretching vibrations in AC that shifted to 1015 cm−1 in LDH/20% AC and confirm the integration of AC on the LDH in the composite materials. In the othet word, the integration of AC didn't change the layered structure. In Fig. 2 b and c, the peaks in the areas of 2982 and 1625 cm−1 are respectively related to C–H stretching vibrations and O–H bending vibrations of interlayer water. Also the peaks of 400–800 cm−1 indicate the vibrations of metal oxides Al-O and Mg-O in Mg-Al LDH. The observed peaks related to interlayer water and anions demonstrated the layered structure of LDH/20% AC (Aldawsari et al., 2021; Koilraj et al., 2017).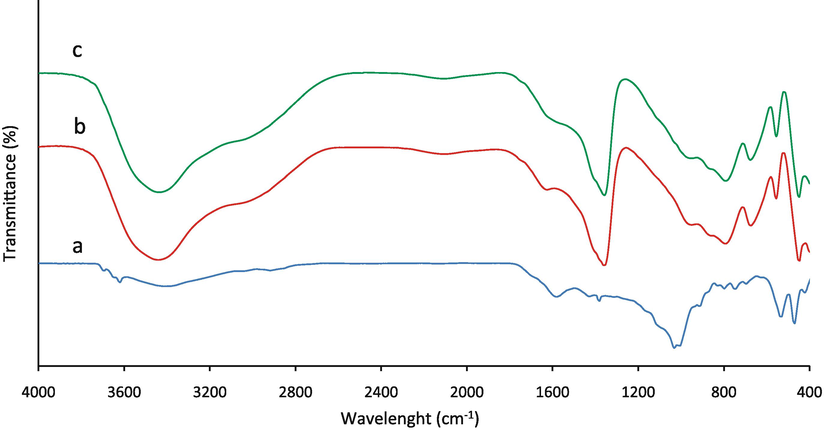
FT-IR spectrum of a) AC, b) Mg-Al LDH and c) Mg-Al-LDH/AC nanocomposite.
Nitrogen adsorption and desorption isotherm of LDH/20% AC-NC are shown in Fig. 3. As seen in the figure, this isotherm is similar to type (IV) isotherm, which is usually used for porous materials. Adsorption residual curvature is H3 (Peng et al., 2019). The information related to the nanocomposite includes the size of the total pore volume 0.4571 cm3/g, the average pore diameter 27.99 nm, and the specific surface area of the adsorbent 105.46 m2/g. According to the analysis, the specific surface area of AC and initial LDH were obtained at 180 and 65 m2/g, respectively. As expected, Mg-Al LDH/AC nanocomposite showed a higher specific surface area compared to initial LDH, this result means that by adding a suitable amount of AC, its adsorption capacity for pollutants can be significantly increased. This indicates that the nanocomposite possesses a larger surface area and numerous large pores, which contribute to its enhanced adsorption capabilities.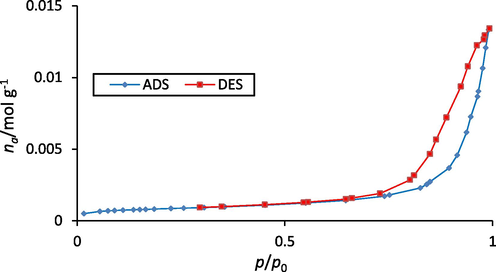
Nitrogen adsorption and desorption isotherm diagram of Mg-Al-LDH/AC nanocomposite.
Considering the remarkable features of each of these compounds, i.e. AC and LDHs, it is possible to synthesize a new composite by properly combining these two materials, which has remarkable characteristics in the field of adsorbing and removing various pollutants. The significant specific surface area of AC, as well as the layered nature of LDHs, can be integrated into the new composition and we have a material with multi-layered properties to adsorb pollutants, and on the other hand, with a higher specific surface area.
FESEM images of nanocomposite are shown in Fig. 4. It can be seen that the LDH has a sheet state and the AC is distributed on the external surface of the nanocomposite. Also, the size of the particles has been determined on the images, and the average size of the nanocomposite particles is equal to 81 nm.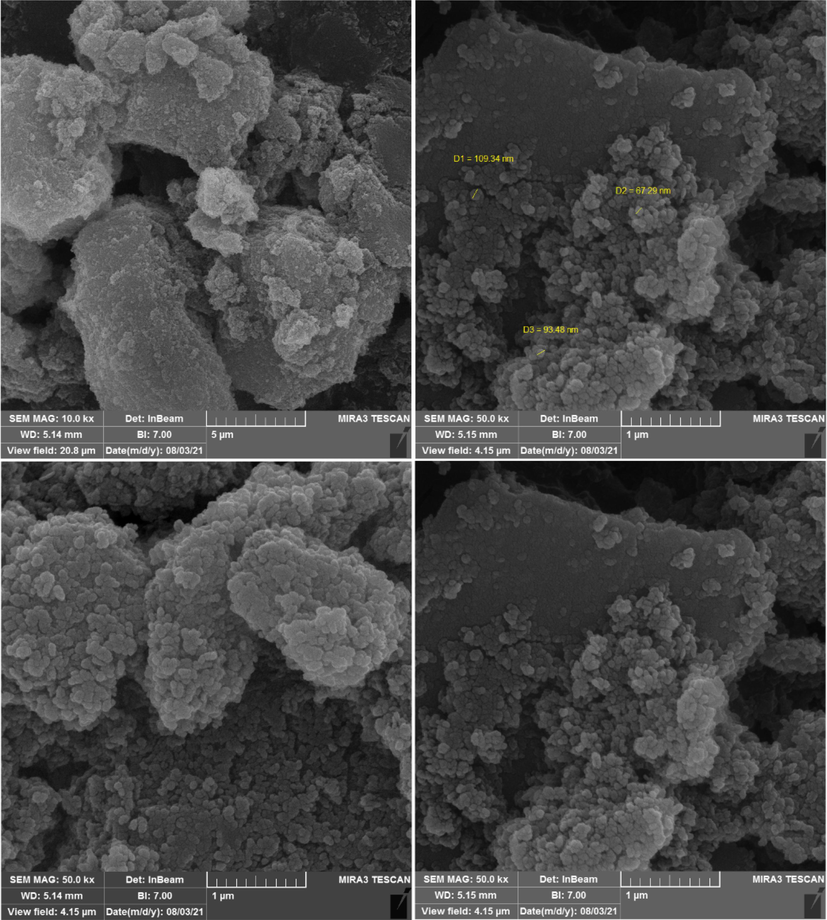
FESEM images of Mg-Al-LDH/AC.
In this work, the composition of the components in the produced nanocomposite structure was ascertained by EDS analysis. Fig. 5a displays the LDH/20% AC nanocomposite's EDS spectra. These graphs make it easy to see the peaks of the elements Mg, Al, O, and C. The peaks of Mg, Al, and O are for Mg-Al LDH, while the peak of C is associated with AC and carbonate. Additionally, the composite structure's weight % of the components revealed that Mg, Al, C, and O made up 23.93, 15.46, 15.68, and 44.03, respectively, of the total weight. The map of elemental abundance distribution is shown in Fig. 5b.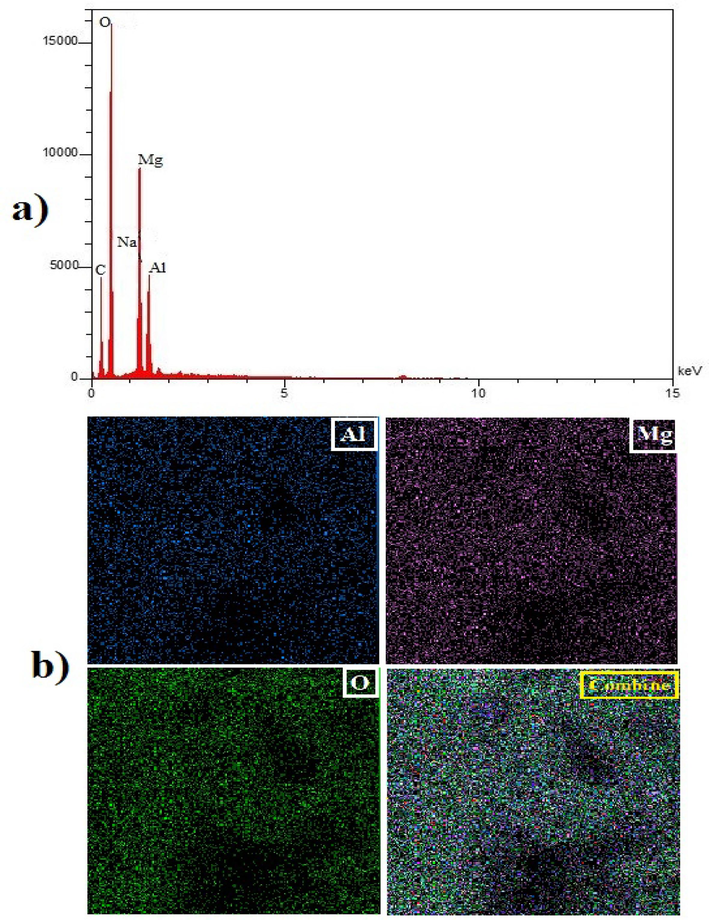
A) the EDS spectrum of Mg-Al-LDH/AC nanocomposite and b) element abundance distribution map.
3.2 Determine the pHpzc of the adsorbent
At pHpzc, the outcome of the charge is equal to zero because the total of the positive charges on the surface balances out the sum of the negative charges on the surface. The adsorbent surface has a negative charge at pH values more than pHpzc and a positive charge at pH values less than pHpzc (Zaher et al., 2021). The results of the experiment are presented in Fig. 6, and the value of pHpzc for the adsorbent was found to be 8.3. As a result, the surface of the adsorber is anionic at pH less than 8.3 and cationic at more than 8.3. It should be noted that TC removal efficacy reduces at pH values higher than 8.3 owing to repulsion between the adsorbent surface and the anionic form of TC.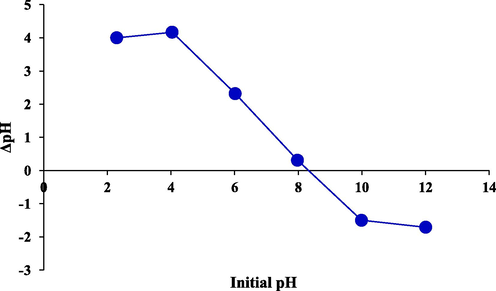
Determination of point zero charge (pHPZC) of Mg-Al-LDH/AC nanocomposite using the pH drift method.
3.3 Statistical analysis and model validation
Table 2 displays the CCD-based experimental design matrix, as well as the obtained and expected values. According to the above table, it can be seen that the removal efficiency for 30 experiments for TC varied between 60.53% and 94.36%. Table 3 displays the model's ANOVA findings. To evaluate if a phrase is statistically significant, a 95% confidence level was utilized. The significance of the coefficients was assessed using the F-test and P-value, where a higher absolute F-value and a lower P-value indicate that a term is more significant (Mirsoleimani-Azizi et al., 2018). The constructed model was statistically significant for removing TC, as evidenced by the F-value of 28.12 and the extremely low P-value (less than 0.0001). The adsorbent mass, TC concentration, and time were the variables that had the most effects on the removal efficiency of TC. The good R2 (0.9690), R2Adj (0.9478), and R2Pred (0.9042) demonstrate a significant correlation between the experimental data and the model, as well as a high prediction capacity for the model. The appropriate precision number (29.1446), a signal-to-noise ratio, is much more than the target value of 4, confirming the model's statistical robustness. The acceptable value of the PRESS index, as well as the low value of the standard deviation, suggests that the projected model has extremely high sensitivity and accuracy. As a result, the quadratic model was obtained as the equation provided to explain the relationship between the response and the process variables. For each factor, a value and a coefficient are provided in this equation, indicating the quantity and kind of effect of that component, respectively. Equation 1 described the link between response (TC removal) and variables well (pH, adsorbent mass, TC concentration, and time).
Source
Sum of Squares
df
Mean Square
F-value
P-value
Block
499.73
2
249.87
significant
Model
142.73
11
129.16
45.52
< 0.0001
A-pH
15.63
1
15.63
5.51
0.0321
B-adsorbent amount
393.57
1
393.57
138.72
< 0.0001
C-initial concentration
270.64
1
270.64
95.39
< 0.0001
D-time
203.65
1
203.65
71.78
< 0.0001
AB
5.74
1
5.74
2.02
0.1742
AC
6.07
1
6.07
2.14
0.1629
BC
12.89
1
12.89
4.54
0.0489
A2
343.65
1
343.65
121.12
< 0.0001
B2
27.71
1
27.71
9.77
0.0065
C2
46.91
1
46.91
16.53
0.0009
D2
13.39
1
13.39
4.72
0.0452
Residual
45.39
16
2.84
Lack of Fit
42.26
13
3.25
3.11
0.19
not significant
Pure Error
3.13
3
1.04
Cor Total
1965.85
29
The adequacy of the model was further investigated using residual plots (Fig. 7). Residual plots, which depict the discrepancy between the obtained predicted amounts for a response, are regarded as an important tool for assessing the model's adequacy. A normal probability plot of residuals, for example, is a graphical tool for determining if the residuals are normally distributed (Foroughi et al., 2018). Fig. 7a demonstrates that there is no significant deviation of the residuals from the straight red line, showing that the normality assumption is true for the given model. Another often-used visual method for determining the model's adequacy is the plot of residuals vs. fitted values. The residuals in this plot should not follow any discernible pattern. A random spread of the residuals over the center red line, as shown in Fig. 7b, demonstrates that the model performs well and that the constant variance condition is met. Fig. 7c depicts a residual distribution chart based on the test number. If this graph shows a pattern, it means that the mistakes are not random. This diagram, as seen in the image, lacks a distinct pattern for the expected model. In Fig. 7d, a perfect prediction (dashed red line) is displayed against the experimental findings together with the projected values. Indicating the excellent predictability of the model for the defined system of variables, the data are either on the line or closely scattered around the perfect prediction line.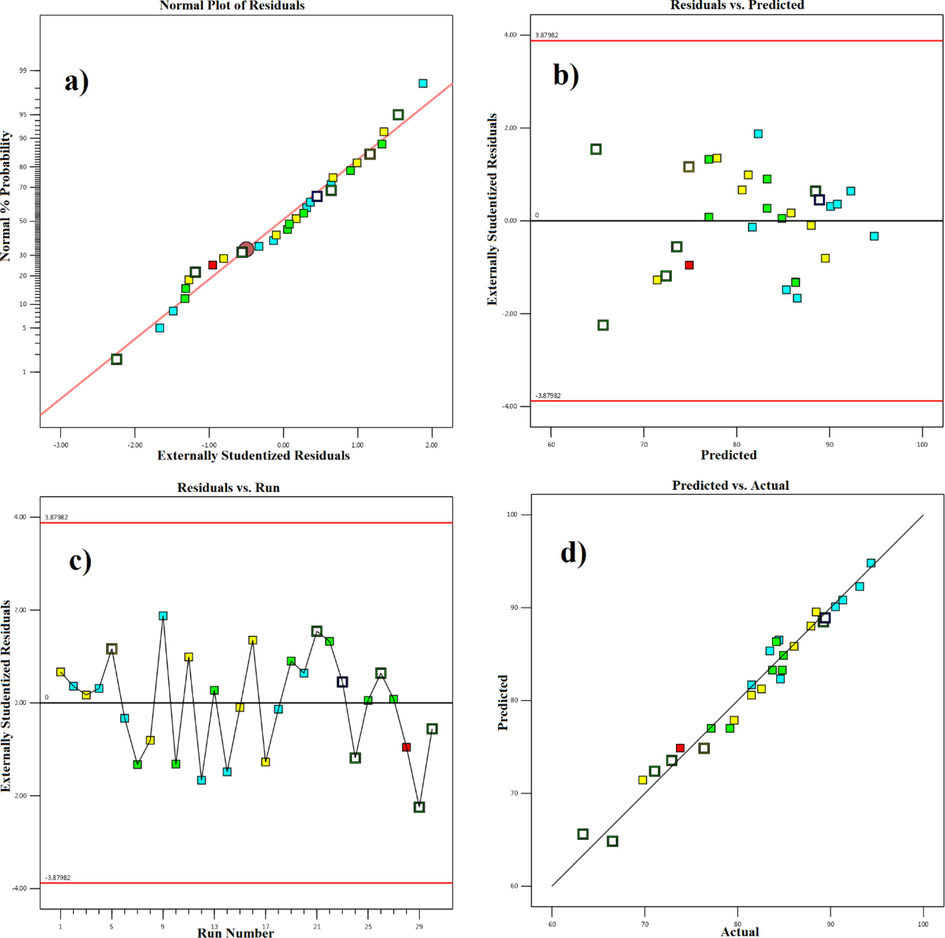
A) normal probability curve, b) residuals according to predicted values, c) distribution of residuals according to test number, and d) actual values according to predicted values.
3.4 Examining parameters influencing the adsorption process
In this part, we examine how factors affect TC removal and how they interact with one another using three-dimensional graphs and alignment. One of the key elements affecting the elimination of the antibiotic TC is the pH of the solution. TC's dissociation constants (pKa) are 3.3, 7.7, and 9.5, respectively, therefore it exists as a cation (
) in acidic solutions, a dipolar ion (
) in acidic to neutral solutions, and an anionic (
and
) in alkaline solutions [30, 31]. As was already indicated, the adsorbent surface has a positive charge at pH values below pHpzc and a negative charge at pH values above pHpzc. The pH range for this study was set at 2.5 to 8.5. With LDH/20% AC nanocomposite, Fig. 8a depicts the three-dimensional diagram and level of mutual impacts of pH and amount of adsorbent on the removal process of TC antibiotic. Concentration and contract duration are held constant in their middle points. The removal effectiveness is lowest at highly acidic pHs because of the electrostatic attraction between the cationic form of TC and the positive charge of the adsorbent surface, and it is also lowest at basic pHs. This is shown in the diagram. The decreased removal is brought on by the anionic form of TC's electrostatic attraction to the negatively charged adsorbent surface. Additionally, as the amount of adsorbent is increased, more TC is adsorbed due to an increase in the number of accessible sites for TC removal. This problem is confirmed by the adsorbent value's positive coefficient. It should be noticed that the removal efficiency altered with a lower slope when the amount of adsorbent was increased from 0.11 to 0.15. Fig. 8b illustrates the relationship between initial TC concentration and pH-related parameters. As can be observed, the removal efficiency declines as the starting TC concentration rises because at greater antibiotic concentrations, all of the adsorbent's sites progressively fill up, causing the removal efficiency to drop and the coefficient to become negative. The problem is also evident in the concentration. The clearance effectiveness has reduced from 94% to 80% with the concentration increasing from 30 to 100 mg/L, as shown in the graph. The maximum percentage of TC removal (100%) was obtained at pH = 5.15, initial concentration of TC 50 mg/L, amount of adsorbent 0.11 g, and contact time 90 min with desirability 1.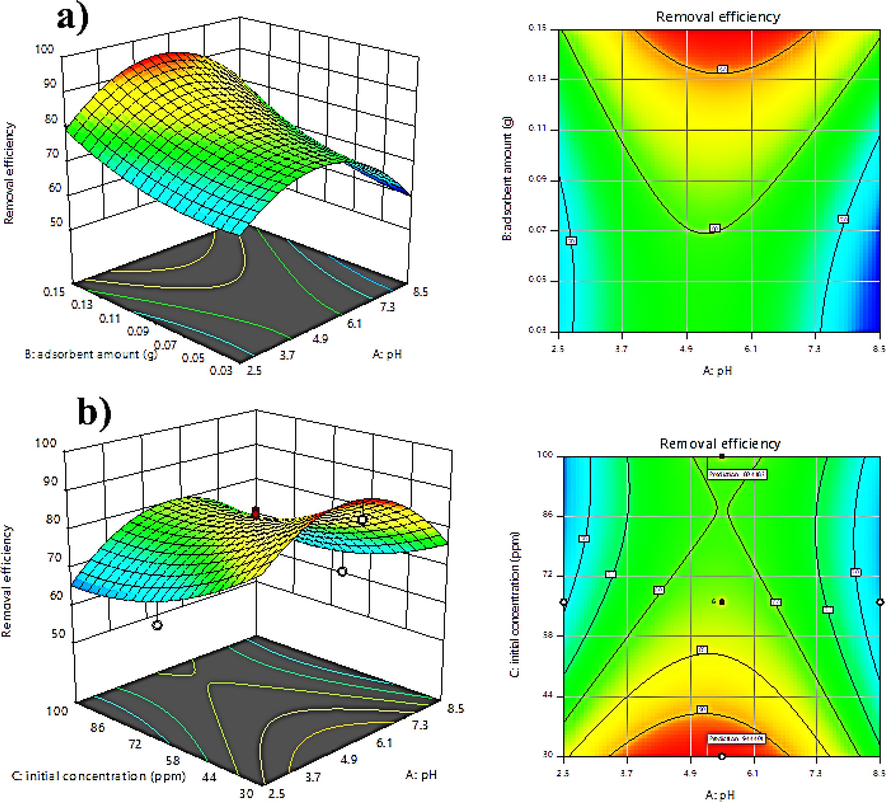
Three-dimensional and balance diagrams: a) the simultaneous effect of factors pH and amount of adsorbent and b) the simultaneous effect of factors pH and initial concentration of TC.
3.5 Adsorption isotherms
The use of adsorption isotherms provides the necessary knowledge on adsorbent capacity. This study looked at the values of the parameters associated with the Langmuir and Freundlich isotherms for the TC adsorption process on LDH/20% AC nanocomposite, which was done under ideal circumstances at concentrations of 20 to 200 mg/L. The isotherm is shown in Fig. 9 and Table 4. Based on the data, a maximum adsorption capacity of 106.4 mg/g was determined using the Langmuir constant. The Freundlich isotherm takes into account a multilayer and heterogeneous adsorption, whereas the Langmuir isotherm relates to homogenous sites isolated from one another in a monolayer. In comparison to the Freundlich model, the results of the correlation coefficient for the Langmuir model (R2 = 0.9986) were higher. Thus, this model is more appropriate since it has a greater correlation coefficient for the Langmuir adsorption isotherm. The result of the RL calculation, which was likewise 0.1, confirms the viability of the adsorption method. Additionally, the value of 1/n in the Freundlich isotherm is smaller than 1, indicating a significant interaction between the adsorbent and the adsorbed.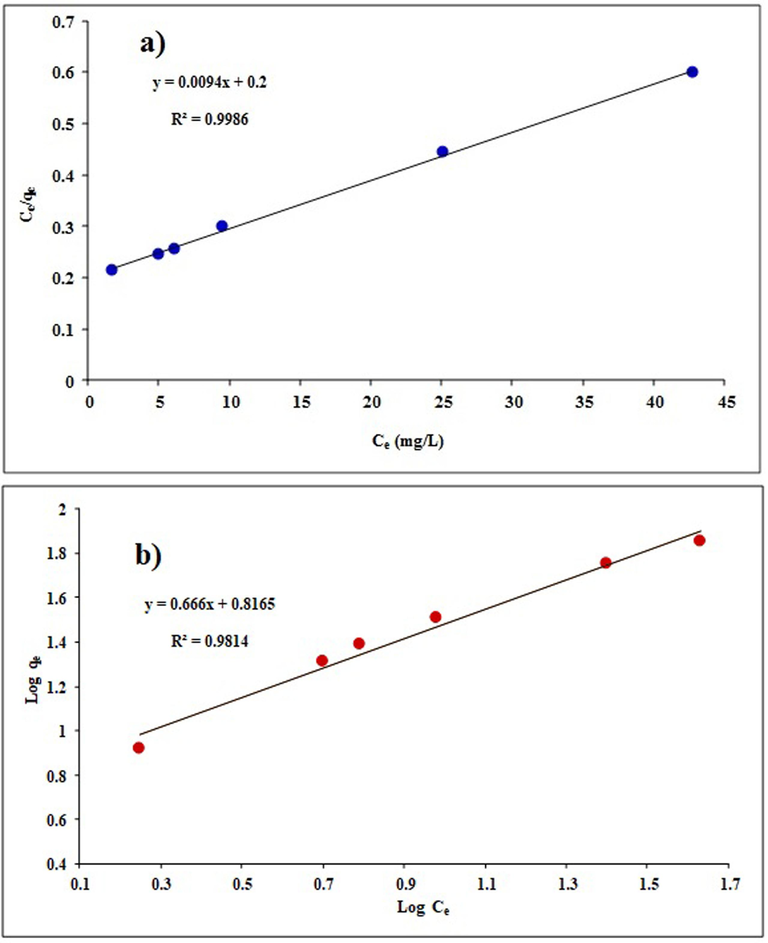
Adsorption isotherms for TC adsorption on Mg-Al-LDH/AC nanocomposite; (a) Langmuir fit; (b) Freundlich fit.
Isotherm model
Equation
Parameters
Amounts
Langmuir
qm (mg/g)
106.4
KL (L/mg)
0.047
RL
0.1
R2
0.9986
Freundlich
0.66
Kf (mg/g)(L/mg)1/n
6.55
R2
0.9814
3.6 Adsorption kinetics
The kinetics of a process is examined to learn more about the rate-limiting stage. In this study, the TC adsorption process on Mg-Al-LDH/20%AC nanocomposite was examined using pseudo-first-order and pseudo-second-order kinetic models. Fig. 10 displays pseudo-first-order and pseudo-second-order kinetic graphs. Additionally, Table 5 displays the kinetic parameter values. The results demonstrate that the reaction's kinetics is a pseudo-second-order model, and its correlation coefficient is approximately equal to 1. This demonstrates that an equilibrium exists between the quantity of antibiotic adsorption by the adsorbent and the concentration of TC on the surface of the adsorbent. TC is likely adsorbed onto the adsorbent by chemical interactions like ion exchange since the pseudo-second-order model states that the adsorption process is of a chemical kind.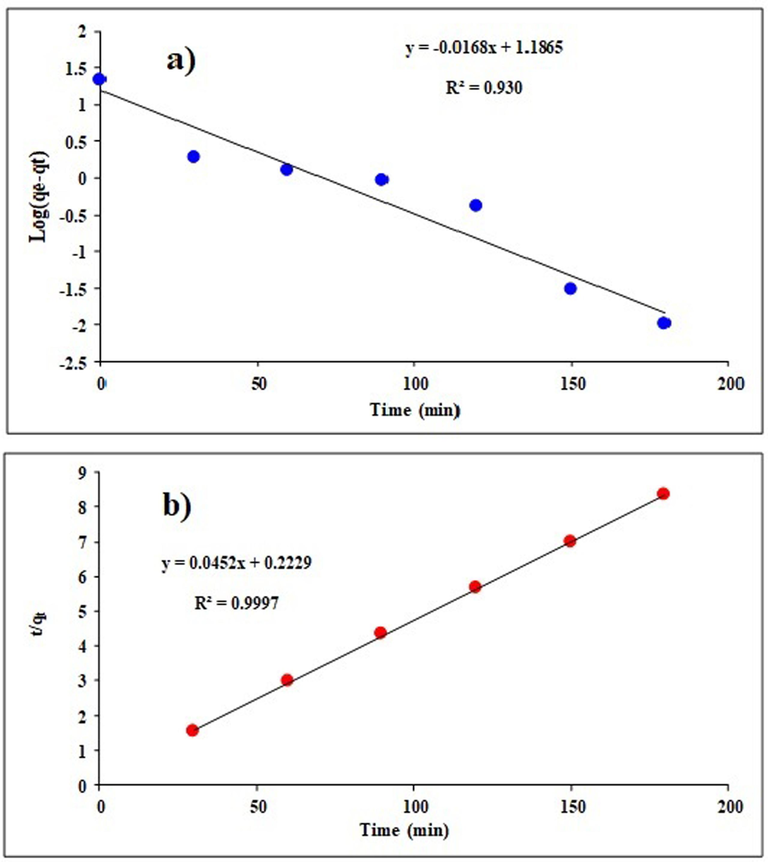
A) pseudo-first- and b) pseudo-second-order kinetics in the process of TC adsorption in optimal conditions.
Kinetic model
Equation
Parameters
Amounts
Pseudo-first-order
k1 (min−1)
0.00021
qe, Cal (mg/g)
15.36
R2
0.9303
Pseudo second order
k2 (g/mg min )
0.009
qe, Cal (mg/g)
22.12
R2
0.9997
3.7 Adsorption thermodynamics
The TC adsorption procedure on Mg-Al-LDH/20%AC nanocomposite was carried out under ideal circumstances at various temperatures to examine the impact of temperature (20–60 °C). Fig. 11 displays the test's outcomes. When noted, the TC removal effectiveness dropped from 90% to 52% as the temperature rose from 20 to 60 °C. This decrease may result from the TC species' enhanced mobility or the adsorption sites being reduced as a result of the adsorbent dissolving at high temperatures.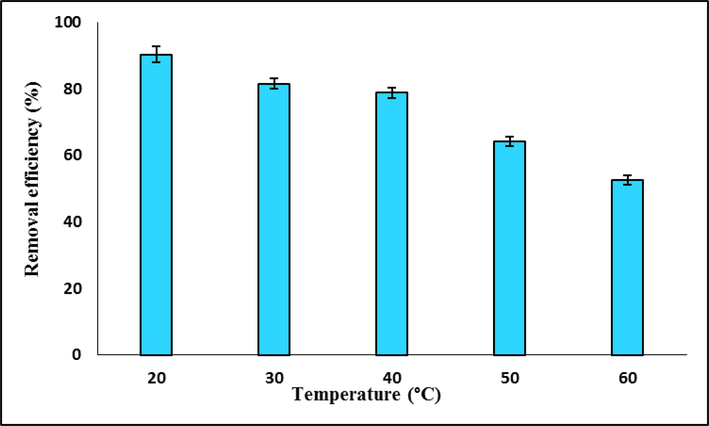
Effect of temperature on TC removal efficiency by LDH/20% AC nanocomposite.
Table 6 displays the values of the thermodynamic parameters of TC adsorption (enthalpy, entropy, and Gibbs free energy). The obtained findings show that the negative value of ΔH° reflects the exothermicity of the TC adsorption process on the nano adsorbent and also verifies that the TC is physically adsorbed on the aforementioned adsorbent. Because TC molecules travel towards the adsorbent throughout the adsorption process and cause the environment to change from more to less disordered, ΔS° < 0 implies a reduction in disorder and an increase in organization in the system during the reaction. At temperatures from 20 to 40 °C, ΔG° > 0 indicates the spontaneity of the TC adsorption reaction.
Temperature (K)
Kd
ΔG°
(kJ/mol)ΔH°
(kJ/mol)ΔS°
(kJ/mol K )
293.15
4.26
−3.53
303.15
2.00
−1.76
313.15
1.69
−1.36
0.03 ± -41.97
0.017 ± 0.131-
323.15
0.81
0.55
333.15
0.50
1.90
3.8 Investigating the effect of ionic strength
In addition to contaminants, home and industrial wastewater also contain a variety of salts that might influence the removal of pollutants. Therefore, it is important to consider how environmental factors (such as ionic strength, etc.) may affect the adsorption of antibiotics (Zhang et al., 2019). To investigate the effect of ionic strength on TC absorption by Mg-Al-LDH/AC nanocomposite from aqueous solutions, the absorption process was carried out for both types of synthetic solutions and real samples under optimal conditions and in the presence of 0–0.1 M sodium chloride concentration. As can be seen in Fig. 12, in both types of synthetic and real samples, ionic strength does not have a significant effect on the percentage of TC removal efficiency. Therefore, this nano adsorbent can adsorb TC well in different ionic strengths.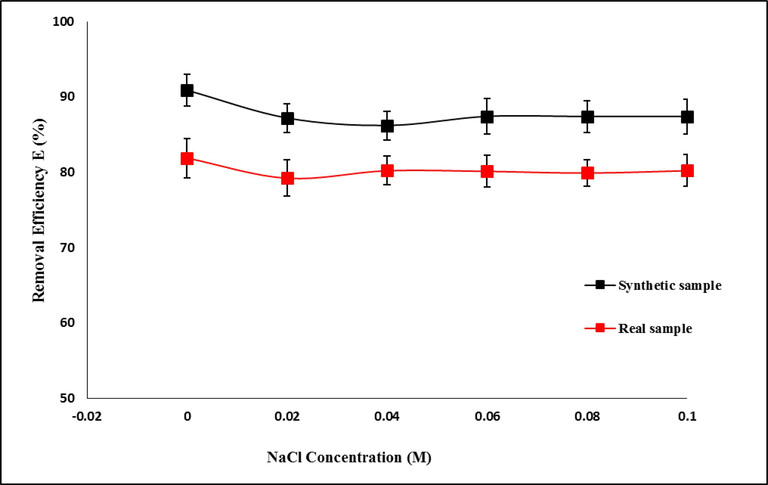
Effect of ionic strength on TC removal efficiency by LDH/AC nanocomposite under optimal conditions.
The result obtained is consistent with the reports of other researchers. According to Zhang et al. (Zhang et al., 2019) and Chao et al.(Chao et al., 2014), the presence of various salt concentrations had no impact on the adsorption of TC from aqueous solutions. According to Chang et al., the interlayer adsorption of clay is very little affected by ion addition, and as a result, the majority of the adsorbed TC is concentrated in the interlayer region. This indicates that, in contrast to surface adsorption, the additional ionic species' competition with the TC species in interlayer adsorption is far lower (Chang et al., 2014). These arguments suggest that the majority of TC adsorption by adsorbent may be interlayer, meaning that ionic strength may not have an impact on the elimination of the substance. Therefore, this nano adsorbent can be used in water environments and even in wastewater treatment units to remove TC.
3.9 Investigating the efficiency of TC removal by processed adsorbents
The adsorption capacity of TC was investigated by carbon adsorbents, LDHs, and a combination of LDHs and different weight percentages (10–50%) of carbon under optimal conditions. The results are shown in Fig. 13. As can be seen, the highest TC removal efficiency is provided by LDH/AC nanocomposite. According to the results, by adding 10% by weight of AC to LDH, a slight increase in TC removal efficiency is observed. Adding amounts of 20%, 30%, and 40% of AC had results with small differences from each other, the best of which was 20% by weight. With the increase of AC by 50% by weight, the removal efficiency decreased, which may be due to the occupation of LDH active sites by larger amounts of carbon.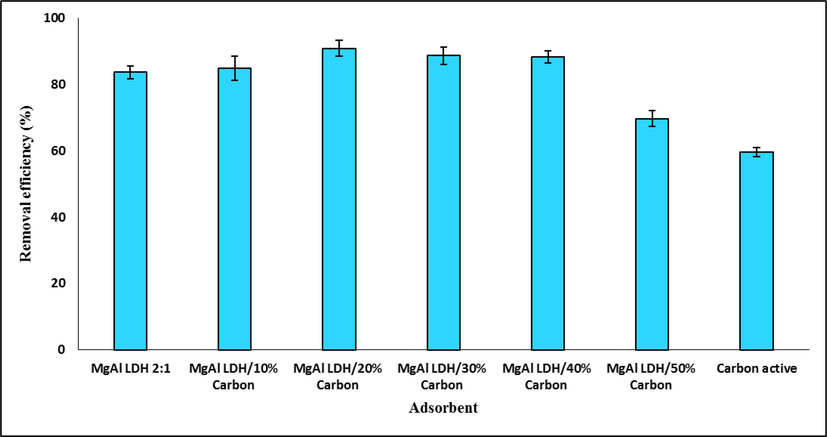
The removel efficiency percentage of TC removal by different adsorbents.
3.10 Real samples analysis
To evaluate the effectiveness of the proposed method in real samples, the presented procedure was used to remove TC from tap water samples and from the effluent channel of the final settling tanks of the municipal wastewater treatment plant, in Shahrekord, Iran. The obtained results showed that the mentioned analyte is not present in them, so to evaluate the effect of the real sample matrix on the efficiency of the technique, the samples were spiked with analyte in different concentrations and the experiments were performed in optimal conditions. The removal efficiency of TC with Mg-Al-LDH/AC nanocomposite was calculated and depicted in Table 7.
Analyte
Spiked concentration (mg/L)
Removal Efficiency E (%)
TC
Wastewater
Tap water
0
–
–
30
80.2 ± 0.9
89.5 ± 1.3
50
81.9 ± 1.4
88.6 ± 1.1
70
72.3 ± 0.7
82.7 ± 0.8
The recovery values obtained from real samples have confirmed the validity of the proposed method.
3.11 Analytical figures of merit
Above 90 % removal efficiency was achieved for TC when the procedure was performed under the optimal experimental conditions. The calibration graph was linear between 3 and 50 mg/L with a correlation coefficient of 0.9989. The regression equation was A = 0.0066C + 0.0158, where A is absorbance and C is TC concentration in mg/L. The relative standard deviation (RSD, %), based on six replicate analysis of 30 mg/L of TC was 1.68 % and the limit of detection (LOD) which is defined as three times of standard deviation of blank (n = 8) was 1.03 mg/L. The sensitivity of proposed method for removal efficiency of TC based on 0.0044/m (where m is the slope of calibration curve) was 0.667 mg/L.
4 Conclusion
Mg-Al-LDH/20%AC nanocomposite was used as the adsorbent in the preparation of an LDH/AC nanocomposite with various percentages. An experimental design was used to optimize the TC elimination process. It is extremely beneficial and profitable to optimize purification processes utilizing the RSM approach in addition to drastically decreasing the amount of samples and consumables, hence lowering investment and operating costs, and modeling the process. For Mg-Al-LDH/20%AC adsorbent, the RSM approach indicated a second-order polynomial model with a P-value of less than 0.0001 and a high R2 value of 0.9690. The optimization results using RSM indicated that the Mg-Al-LDH/20%AC adsorbent had a maximum TC removal efficiency of 94%, achieved under the following conditions: pH of 5.15, initial TC concentration of 50 mg/L, adsorbent dosage of 0.11 g, and contact time of 90 min. The Langmuir adsorption isotherm model indicated a maximum adsorption capacity of 106.4 mg/g with a high R2 value of 0.9986. Additionally, the equilibrium data were well-fitted by the pseudo-second-order kinetic model (R2 = 0.9997). The thermodynamic parameters for TC adsorption were determined as follows: ΔG = 1.90 kJ/mol (at 333.15 K), ΔH = −41.97 kJ/mol, and ΔS = −0.131 kJ/(mol. K). The LDH/20% AC nanocomposite demonstrated superior TC removal efficiency compared to LDH, AC, and nanocomposites containing 10%, 30%, 40%, and 50% AC. This nanocomposite shows strong potential for TC removal from aqueous environments and is also cost-effective, environmentally friendly, and biodegradable compared to other TC adsorbents. Thus, this adsorbent can be a promising candidate for the efficient removal of TC. Probably, upgrading and optimizing LDH with other interlayer anions and supporting materials that improve their surface area and on the other hand, they have renewable capability, widespread availability, low cost, biocompatibility, and biodegradability It can be promising that LDH is a suitable candidate for efficacy removal of antibiotics and other industrial wastewater.
Declaration of competing interest
The authors declare that they have no known competing financial interests or personal relationships that could have appeared to influence the work reported in this paper.
References
- Tailoring an efficient nanocomposite of activated carbon-layered double hydroxide for elimination of water-soluble dyes. J. Alloy. Compd.. 2021;857:157551
- [CrossRef] [Google Scholar]
- Adsorption of tetracycline on montmorillonite: influence of solution pH, temperature, and ionic strength. Desalin. Water Treat.. 2014;1–13
- [CrossRef] [Google Scholar]
- Commercial diatomite for adsorption of tetracycline antibiotic from aqueous solution. Separ. Sci. Technol.. 2014;49:2221-2227.
- [CrossRef] [Google Scholar]
- Optimization of a three-dimensional electrochemical system for tetracycline degradation using Box-Behnken design. Fresenius Environ. Bull.. 2018;27:1914-1922.
- [Google Scholar]
- Mesocrystalline Ta3N5 superstructures with long-lived charges for improved visible light photocatalytic hydrogen production. J. Colloid Interface Sci.. 2020;560:359-368.
- [CrossRef] [Google Scholar]
- Comparative study of removing anionic contaminants by layered double hydroxides with different paths. Colloids Surfaces A Physicochem. Eng. Asp.. 2021;624:126841
- [CrossRef] [Google Scholar]
- Carbon-dot-decorated layered double hydroxide nanocomposites as a multifunctional environmental material for co-immobilization of SeO42- and Sr2+ from aqueous solutions. ACS Sustain. Chem. Eng.. 2017;5:9053-9064.
- [CrossRef] [Google Scholar]
- Perchlorate uptake and molecular mechanisms by magnesium/aluminum carbonate layered double hydroxides and the calcined layered double hydroxides. Chem. Eng. J.. 2014;237:38-46.
- [CrossRef] [Google Scholar]
- Adsorption of a non-steroidal anti-inflammatory drug onto MgAl/LDH-activated carbon composite – experimental investigation and statistical physics modeling. Colloids Surfaces A Physicochem. Eng. Asp.. 2020;586:124217
- [CrossRef] [Google Scholar]
- Tetracycline antibiotic removal from aqueous solutions by MOF-5: Adsorption isotherm, kinetic and thermodynamic studies. J. Environ. Chem. Eng.. 2018;6:6118-6130.
- [CrossRef] [Google Scholar]
- Insights into the adsorption mechanism of carbon cellulose fiber loaded globular flowers bimetallic layered double hydroxide for efficiency pollutant removal. J. Mol. Liq.. 2019;290:111201
- [CrossRef] [Google Scholar]
- Effective removal of amoxicillin, cephalexin, tetracycline and penicillin G from aqueous solutions using activated carbon nanoparticles prepared from vine wood. J. Water Process Eng.. 2014;1:64-73.
- [CrossRef] [Google Scholar]
- Enhancement of azo dyes removal efficiency by using LDH/Tris/Pd catalyst: kinetic studies. Appl. Organomet. Chem.. 2019;33
- [CrossRef] [Google Scholar]
- Magnetic Fe3O4/MgAl-LDH composite for effective removal of three red dyes from aqueous solution. Chem. Eng. J.. 2014;252:38-46.
- [CrossRef] [Google Scholar]
- Synthesis of CoZnAl-layered double hydroxide/graphene oxide nanocomposite for the removal of methylene blue: kinetic, thermodynamic, and isotherm studies. Environ. Prog. Sustain. Energy. 2020;39
- [CrossRef] [Google Scholar]
- Defluoridation of drinking water by Mg/Al hydrotalcite-like compounds and their calcined products. Appl. Clay Sci.. 2007;35:59-66.
- [CrossRef] [Google Scholar]
- Sorption of arsenate onto magnetic iron–manganese (Fe–Mn) biochar composites. RSC Adv.. 2015;5:67971-67978.
- [CrossRef] [Google Scholar]
- Biochar-supported nZVI (nZVI/BC) for contaminant removal from soil and water: a critical review. J. Hazard. Mater.. 2019;373:820-834.
- [CrossRef] [Google Scholar]
- Removal of tetracycline hydrochloride from wastewater by Zr/Fe-MOFs/GO composites. RSC Adv.. 2021;11:9977-9984.
- [CrossRef] [Google Scholar]
- Characterization and environmental applications of clay–biochar composites. Chem. Eng. J.. 2014;242:136-143.
- [CrossRef] [Google Scholar]
- Possible adsorption mechanisms of the removal of tetracycline from water by La-doped Zn-Fe-layered double hydroxide. J. Mol. Liq.. 2021;322:114546
- [CrossRef] [Google Scholar]
- Study on adsorption of tetracycline by Cu-immobilized alginate adsorbent from water environment. Int. J. Biol. Macromol.. 2019;124:418-428.
- [CrossRef] [Google Scholar]
Appendix A
Supplementary data
Supplementary data to this article can be found online at https://doi.org/10.1016/j.arabjc.2023.105301.
Appendix A
Supplementary data
The following are the Supplementary data to this article:Supplementary Data 1
Supplementary Data 1


