

Translate this page into:
Enhanced visible-light-driven photodegradation of Acid Orange 7 azo dye in aqueous solution using Fe-N co-doped TiO2
⁎Corresponding authors. dsannino@unisa.it (Diana Sannino), vvaiano@unisa.it (Vincenzo Vaiano)
-
Received: ,
Accepted: ,
This article was originally published by Elsevier and was migrated to Scientific Scholar after the change of Publisher.
Peer review under responsibility of King Saud University.
Abstract
Fe—N -co-doped TiO2 photocatalysts are prepared by sol–gel method using titanium tetraisopropoxide, urea and iron(II) acetylacetonate as precursors of titania, nitrogen and iron, respectively. The prepared samples are analysed from chemical-physical point of view by X-ray diffraction (XRD), Raman spectroscopy, UV–Vis diffuse reflectance spectroscopy (UV–Vis DRS), specific surface area measurements and scanning electron microscopy (FESEM). UV–Vis DRS spectra evidence that the co-doping of TiO2 with N and Fe leads to the narrowing of the band gap value (2.7 eV) with respect to Fe-doped TiO2 (2.8 eV) and N-doped TiO2 (2.9–3 eV). XRD patterns show that photocatalysts are mainly in anatase phase and Fe and N ions are successfully incorporated into the TiO2 lattice. The average crystallite size of Fe-N co-doped TiO2 is slightly lower than the other samples and equal to about 7 nm and the specific surface area of the co-doped sample results to be 117 m2 g−1. Photocatalytic performances of all prepared samples are evaluated by analysing the degradation of Acid Orange 7 azo dye under visible light irradiation. Photocatalytic efficiency obtained using Fe—N co-doped TiO2 strongly increases compared to undoped TiO2, N-doped TiO2 and Fe-doped TiO2 photocatalysts. In detail, using the co-doped photocatalyst, dye discoloration and mineralization result equal to about 90 and 83% after 60 min of LEDs visible light irradiation, underlining the best performances of the Fe—N co-doped TiO2 photocatalyst both in terms of treatment time and electric energy consumption.
Keywords
Fe-N co-doped TiO2
Acid Orange 7 Azo Dye
Photocatalysis
Visible Light
Discoloration
Mineralization
Electric Energy Consumption

1 Introduction
Wastewater currently presents discharge problems due to the growing diffusion of non-biodegradable compounds, mainly resulting by industrial production processes (Gadipelly et al., 2014). The direct consequence of industrial activities is the generation of liquid streams that, before to be returned to the environment, must necessarily undergo a purification treatment typically performed by biological oxidation processes (activated by microorganisms) (Manahan, 2017). However, these conventional methods are not able to remove bio-recalcitrant pollutants and, therefore, they require further treatment steps in order to eliminate non-biodegradable contaminants (Segneanu et al., 2013; Elshorbagy and Chowdhury, 2013; Zhou and Smith, 2002).
For this reason, the scientific research has focused attention on the application of innovative processes based on Advanced Oxidation Processes (AOPs) (Rokicka-Konieczna et al., 2019).
As far AOPs, heterogeneous photocatalysis based on semiconductor oxide has been strongly investigated in the latest recent years, because it is a technology able to completely degrade water pollutants into carbon dioxide, water and other non-toxic inorganic compounds (Klavarioti et al., 2009; Herrmann, 1999; Sannino et al., 2017; Al-Zahrani et al., 2020; Murcia et al., 2015; Tanji et al., 2020; Akhundi et al., 2019; Pirhashemi et al., 2018; Omrani and Nezamzadeh-Ejhieh, 2020a; Ghattavi and Nezamzadeh-Ejhieh, 2019; Senobari and Nezamzadeh-Ejhieh, 2018; Omrani and Nezamzadeh-Ejhieh, 2020b).
Different semiconductor oxides are widely used as photocatalysts. When a semiconductor is irradiated by light source with a wavelength greater than the band gap energy, electrons are promoted from the valence band (VB) to the conduction band (CB) with the simultaneous generation of positive holes in VB (Park et al., 2013; Zangeneh et al., 2015; Mousavi et al., 2018; Shekofteh-Gohari et al., 2018). The hole-electron pairs react with the pollutant molecules adsorbed on the semiconductor surface generating highly reactive radical species that are thus involved in oxidation and reduction processes of water pollutants (Fujishima and Honda, 1972). The most used semiconductor is titanium dioxide (TiO2), due to its properties, such as strong oxidizing power, high thermal stability, hydrophilicity, non-toxicity, high reactivity and environmentally safety (Nakata and Fujishima, 2012). Photocatalytic activity of TiO2 depends on its morphology, crystalline structure, size distribution and porosity. TiO2 is a polymorphic material, whose crystalline forms are anatase, brookite and rutile. Among all, anatase is the most active because it has a greater affinity towards organic molecules (Nakata and Fujishima, 2012).
TiO2 presents a wide band gap (3.2 eV for anatase) and therefore, it can be excited only by ultraviolet light irradiation (λ = 315–400 nm), which represents 3–5% of solar radiation. (Nakata and Fujishima, 2012). Moreover, the efficient exploitation of TiO2 is limited by rapid recombination of electron/hole pair (Ejhieh and Khorsandi, 2010). An important aim of the research is to make TiO2 active under visible light enhancing its photocatalytic activity also under the direct sunlight. To reach this goal, it is possible to couple TiO2 with other materials (Habibi-Yangjeh et al., 2020; Sedaghati et al., 2019; Feizpoor et al., 2019, 2018) or to reduce the band gap energy and therefore broaden the absorption spectrum of light radiation to the visible range by doping the TiO2 lattice with metallic and non-metallic elements (Cheng et al., 2018; Mohseni-Salehi et al., 2018). The possible expected action of TiO2 doped with metals like Fe, is that metal ions can play as hole and electron traps enhancing the generation of species at high oxidizing power, such as hydroxyl radicals and superoxides (Cheng et al., 2018). Thus, the generated highly oxidizing species further oxidize contaminants and intermediates up to the complete mineralization of the target pollutants. Moreover, non-metal dopants, such as N may substitute semiconductor lattice atoms or enter into the lattice interstices of TiO2 (Di Valentin et al., 2005; Di Valentin and Pacchioni, 2013). The introduction of a dopant in the lattice may allow the activation of TiO2 in the visible range (Di Valentin et al., 2004). Metallic or non-metallic elements in TiO2 structure can result in impurities promoting the recombination of photogenerated holes and electrons (Sharotri and Sud, 2017). For these reason, the research interest has been recently focused on the co-doping of TiO2 with two different ions (metal and non-metals), allowing a better separation of the photogenerated electrons and holes, assuring an effective enhancement of the visible light adsorption together with higher photocatalytic activity of TiO2. (Su et al., 2011). Liu et al. (2007) reported the incorporation of nitrogen (N) and lanthanum (La) in TiO2 lattice. Such obtained systems showed better photocatalytic performances towards degradation of methyl orange dye under visible irradiation compared to N-doped or La-doped TiO2 (Wei et al., 2004; Sakatani et al., 2003). Moreover, nitrogen and cerium co-doped TiO2 showed a photocatalytic activity higher than undoped and N-doped TiO2 (Liu et al., 2008). A certain number of papers are devoted to the formulation of Fe-N co-dopedTiO2 samples (Yen et al., 2011) and the evaluation of their photocatalytic activity towards the degradation of diphenylamine (Su et al., 2011), rhodamine B dye (Cong et al., 2007), methyl orange dye (Shen et al., 2008) and methylene blue dye (Zhou and Wang, 2014). In all cases, Fe-N co-doped TiO2 photocatalysts revealed a significant increase of photocatalytic activity under visible light with respect to undoped TiO2, N-doped TiO2 and Fe-doped TiO2. Unfortunately, to achieve a photodegradation performance higher than 85%, treatment times above 120 min are required. Therefore, further investigation should be required to improve the photocatalytic activity under visible irradiation of Fe-N co-doped TiO2 and to reduce the treatment time for the degradation of water pollutants. The aim of this work was to formulate titanium-based photocatalysts co-doped with both metal and non-metal elements (Fe and N). The prepared photocatalysts were tested in the discoloration and mineralization of Acid Orange 7 azo dye (AO7) under visible light irradiation. Azo dyes, such as AO7, are emerging contaminants widely used in the textile industries for dyeing cotton, wool and silk (Nezamzadeh-Ejhieh and Zabihi-Mobarakeh, 2014). It is worth noting that, among the main synthetic dyes which characterize the effluents coming from the textile industry, AO7 is a colouring agent consisting of an azo group bound to aromatic rings (Fig. 1) (Liu et al., 2005). This azo dye can react with other chemical substances producing aromatic amines which cause toxic and carcinogenic effects. So, AO7 has been chosen as model dye pollutant to be removed through effective methods from aqueous solutions.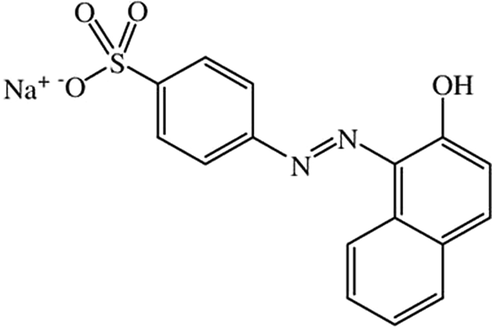
Chemical structure of Acid Orange 7 azo dye (AO7).
2 Experimental section
2.1 Materials
Titanium tetraisopropoxide (C12H28O4Ti > 97% Sigma Aldrich), urea (CH4N2O Sigma Aldrich), iron(II) acetylacetonate (99.95% Sigma Aldrich) and distilled water were utilized.
2.2 Photocatalysts preparation
N-doped TiO2 photocatalysts with different nitrogen content were synthetized through sol–gel method using urea as nitrogen precursor and titanium tetraisopropoxide as TiO2 precursor. Fe-doped TiO2 (Fe-TiO2) photocatalyst was prepared by reaction between titanium tetraisopropoxide (TTIP) and an aqueous solution containing iron(II) acetylacetonate. In order to prepare photocatalysts doped with Fe and N, distilled water containing a certain amount of urea were mixed with a solution of titanium tetraisopropoxide and iron(II) acetylacetonate. The system was maintained at room temperature under continuous stirring for 10 min. The obtained suspension was centrifuged for the separation of a precipitates, which was washed with distilled water three times and finally placed in a furnace at 450 °C for 30 min in static air. The obtained samples were named (N-TiO2_x or Fe-N-TiO2_x) where x indicates the amount of urea (in grams) used for synthesis. The Fe/Ti molar ratio used for the preparation of Fe-TiO2 was equal to 0.0017 and corresponds to an optimized catalyst formulation as reported in a previous work (Zuorro et al., 2019). Table 1 reports the solution volume, the amount of N and Fe precursor used for the synthesis with together N/Ti and Fe/Ti molar ratio for each prepared photocatalyst samples.
Catalyst
TTIP volume (mL)
Urea weight (g)
Distilled water volume (mL)
Iron acetylacetonate weight (g)
Fe/Ti molar ratio
N/Ti molar ratio
TiO2
12.5
0
50
0
0
0
N-TiO2_0.3
12.5
0.3
50
0
0
0.243
N-TiO2_0.6
12.5
0.6
50
0
0
0.485
N-TiO2_1.2
12.5
1.2
50
0
0
0.970
N-TiO2_2.4
12.5
2.4
50
0
0
1.940
Fe-TiO2
12.5
0
50
0.025
0.0017
0
Fe-N-TiO2_1.2
12.5
1.2
50
0.025
0.0017
0.970
2.3 Photocatalyst characterization techniques
Photocatalysts chemical-physical properties were analyzed using different characterization techniques. Specific surface area (SBET) were measured from dynamic N2 adsorption at low-temperature (−196 °C) by using a Costech Sorptometer 1042 instrument. Before the analysis, the samples were pretreated at 150 °C for 30 min in He flow. UV–Visible reflectance spectroscopy (UV–Vis DRS) was used for the determination of the light absorption properties. The reflectance spectra were recorded by using a Perkin-Elmer spectrophotometer Lambda 35, using an 88 sample positioning holder (Labsphere Inc., North Sutton, NH). The reflectance data were reported in terms of Kubelka-Munk values (F(R∞)) as a function of wavelength. The determination of the direct band gap was obtained by plotting [F(R∞)·hν]2 vs hν (eV) (Derikvandi and Nezamzadeh-Ejhieh, 2017; Ghattavi and Nezamzadeh-Ejhieh, 2019). XRD patterns were acquired with a Brucker D8 diffractometer, employing Cu Kα radiation. The lattice parameter values were determined using the following equation:
The average crystallite size d (nm) can be estimated from the intercept of the plot of βcos (θ) as a function of sin (θ).
Raman spectra were obtained using a Dispersive MicroRaman spectrometer (Invia, Renishaw) equipped with a 514 nm laser in the range 150–900 cm−1. Mass titration method was used to estimate the point of zero charge (PZC) of all samples. PZC was measured using the mass titration method proposed by Noh and Schwarz (Noh and Schwarz, 1989; Rizzo et al., 2014). A field emission scanning electron microscope (FESEM, mod. LEO 1525, Carl Zeiss SMT AG, Oberkochen, Germany) was used to observe the morphology of powders that were previously dispersed on a carbon tab stuck to an aluminum stub (Agar Scientific, Stansted, United Kingdom) and then coated with gold–palladium (layer thickness 250 Å) using a sputter coater (mod. 108 A, Agar Scientific).
2.4 Photocatalytic activity tests under visible light
Photocatalytic tests were performed in a cylindrical pyrex photoreactor (ID = 2.6 cm, LTOT = 41 cm and VTOT = 200 mL). Visible-LEDs strip (nominal power: 10 W; provided by LED lighting hut; emission in the range 400–800 nm; light intensity: 13 mW cm−2) was positioned in contact to the external surface of the photoreactor. The total volume of solution was 100 mL with 10 mg L−1 AO7 initial concentration (pH = 5.95). The photocatalyst dosage was equal to 3 g L−1.
The suspension was left in dark conditions for 60 min to achieve the adsorption/desorption equilibrium of AO7 dye on the photocatalyst surface. After the dark phase, the LEDs were switched on and the photocatalytic test started. During the light irradiation, the reaction suspension was continuously mixed using a magnetic stirrer to avoid the sedimentation of the catalyst at the bottom of the photoreactor. An air distributor device (Qair = 150 cm3 min−1 (STP)) was also used to assure the presence of oxygen in the reaction medium and therefore to favor the oxidation reactions of the organic compound.
At regular time intervals, about 3 mL of the suspension was withdrawn from the photoreactor and centrifuged to remove the catalyst particle. The aqueous solution was then analyzed by UV–Vis spectrophotometer (Thermo Scientific Evolution 201) to monitor the reaction progress. In details, the color removal of the chosen dye was monitored by measuring the maximum absorbance value at 485 nm (Rodríguez et al., 2019). The mineralization of the target pollutant was assessed by the measure of the total organic carbon (TOC) content of the solutions during the irradiation time. The TOC of solution was measured from CO2 obtained by the high temperature (680 °C) catalytic combustion (Franco et al., 2019).
The discoloration efficiency and mineralization (by TOC removal) were evaluated using the following relationships:
C = pollutant concentration at the generic irradiation time (mg L−1);
C0 = initial AO7 concentration (mg L−1);
TOC = total organic carbon at the generic irradiation time (mg L−1);
TOC0 = initial total organic carbon (mg L−1).
3 Results and discussion
3.1 Photocatalytic materials characterization
Table 2 reports the specific surface area (SBET) of all samples evaluated by BET method. The undoped titania sample showed the lowest value of 107 m2 g−1. All doped titania samples presented values of specific surface area higher than those of the undoped titania. Moreover, it seems that the SBET values are not influenced by urea amount used as precursor for the preparation of N-TiO2_x samples. On the other hand, the specific surface area of Fe-N co-doped TiO2 sample was found to be 117 m2 g−1, very similar to the value observed for the N-doped TiO2 sample prepared with the same amount of urea (N-TiO2_1.2).
Catalyst
Cristallite size (nm)
Lattice parameter (Ǻ)
SBET (m2 g−1)
Ebg (eV)
ZPC (pH unit)
a = b
c
TiO2
8
3.74
8.68
107
3.2
6.02
N-TiO2_0.3
6
3.79
9.20
139
3.0
5.14
N-TiO2_0.6
7
3.78
9.33
112
3.0
5.10
N-TiO2_1.2
7
3.77
8.81
115
2.9
5.12
N-TiO2_2.4
6
3.78
9.06
126
2.9
5.14
Fe-TiO2
6
3.77
9.21
122
2.8
5.15
Fe-N-TiO2_1.2
7
3.75
8.58
117
2.7
5.02
The reflectance spectra of TiO2 and N-TiO2_x samples are reported in Fig. 2.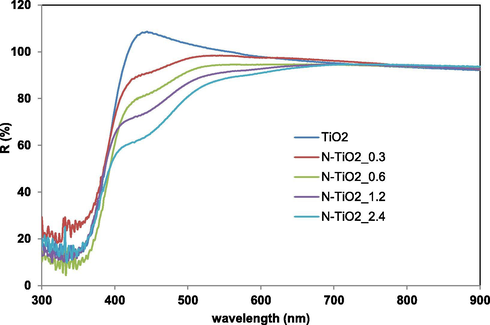
Reflectance spectra vs wavelength for TiO2 and N-TiO2_x samples.
As expected, the main absorption edge of undoped titania lies in the range 390–400 nm (UV region). On the other hand, a marked shift toward the visible region for N-TiO2_x samples was achieved since the presence of a weak shoulder in the range 400–500 nm was observed and its intensity progressively enhanced with the increase of the urea content used for samples synthesis (Shao et al., 2008, Chainarong et al., 2011). Possibly, this result indicates that the doping with N led to new electron state above VB, shifting the absorption edge towards the visible light region, as already reported in literature (Chainarong et al., 2011, Cheng et al., 2012).
Fig. 3 displays the optical properties of undoped TiO2, N-TiO2_1.2, Fe-TiO2 and Fe-N-TiO2_1.2 photocatalysts.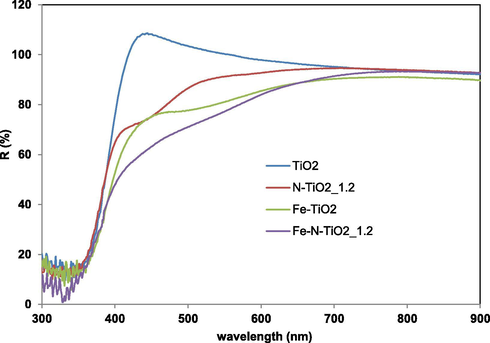
Reflectance spectra vs wavelenght for TiO2, N-TiO2_1.2, Fe-TiO2 and Fe-N-TiO2_1.2 samples.
The reflectance spectra indicate that the doping of Fe into TiO2 lattice shifts its optical absorption edge from UV into visible range (i.e. red shift) (Wu and Chen, 2004). This red shift is due to the charge transfer transitions between the metal ion d electrons and the CB of TiO2 (Ganesh et al., 2012, Ali et al., 2017). It is worthwhile to note that Fe-N-TiO2_1.2 sample gives rise visible-light absorptions contributions higher than those of undoped TiO2, N-TiO2_1.2 and Fe-TiO2 photocatalysts, similarly to the results reported in a previous paper (Yen et al., 2011). Additionally, the Fe-N-TiO2_1.2 showed a noticeable absorbance at less than 500 nm and a marked increase of absorption properties in the range 400–500 nm compared to N-TiO2_1.2 or Fe-TiO2 (Yen et al., 2011).
Band gap values (Ebg) were obtained by UV–Vis DRS measurements (Fig. 4 for undoped TiO2, N-TiO2_1.2, Fe-TiO2 and Fe-N-TiO2_1.2 samples) and the obtained data are included in Table 2.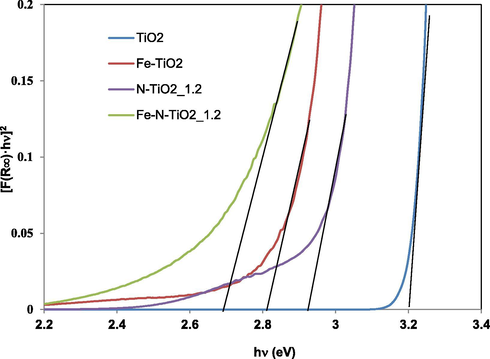
Band gap calculation by UV–VIS DRS spectra for TiO2, N-TiO2_1.2, Fe-TiO2 and Fe-N-TiO2_1.2 samples.
Ebg value was 3.2 eV for undoped titania and 2.9–3 eV for N-TiO2_x samples. This change in Ebg values can be attributed to the presence of nitrogen in the TiO2 lattice (Cheng et al., 2012). Moreover, from the Ebg values and the trend of the reflectance curves, undoped TiO2 is expected to be active under UV irradiation, while Fe-TiO2 under visible light. Ebg was about 2.8 eV for Fe-TiO2 sample while it was possible to obtain a further decrease in Ebg up to the value of 2.7 eV with Fe-N-TiO2_1.2 photocatalyst. The narrow band gap of Fe-N-TiO2_1.2 may be therefore an indication of the possible enhancement of the photocatalytic activity in the visible light region with respect to both Fe-TiO2 and N-TiO2_1.2 samples (Cong et al., 2007).
Figs. 5a and 6a report the XRD patterns of all prepared samples.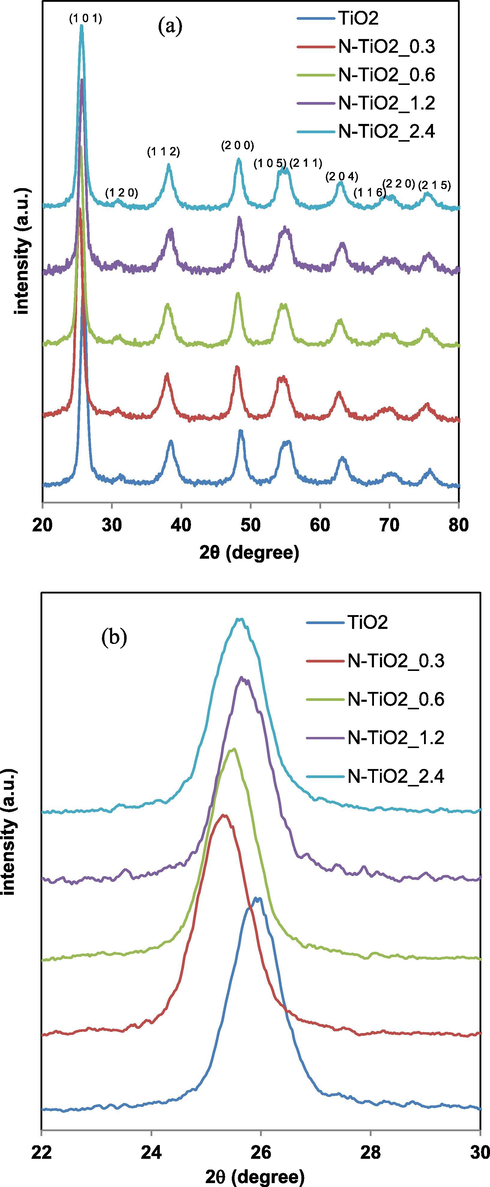
XRD patterns for TiO2 and N-TiO2_0.3, N-TiO2_0.6, N-TiO2_1.2 and N-TiO2_2.4 samples in the range 2Θ = 20–80° (a) and in the range 2Θ = 22–30° (b).
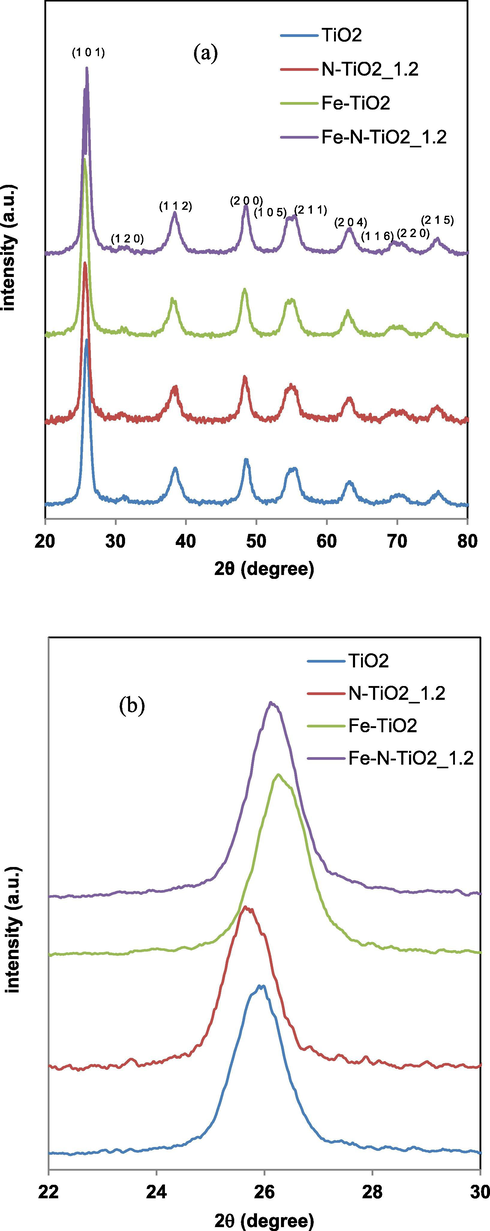
XRD patterns for TiO2 and N-TiO2_1.2, Fe-TiO2 and Fe-N-TiO2_1.2 samples in the range 2Θ = 20–80° (a) and in the range 2Θ = 22–30° (b).
In particular, the sharp peaks of anatase phase at 2θ = 25.91° (1 0 1) and 2θ = 48.62° (2 0 0) for undoped titania are evident (JCPDS Card No. 21-1272). Similarly the XRD patterns all doped samples exhibited the characteristic peaks of TiO2 anatase phase (Ramalingam et al., 2017). The peak corresponding to the (1 0 1) crystalline plane was the most intense (Ramalingam et al., 2017). No peaks of rutile phase was observed in all the N-TiO2_x samples prepared with different urea loadings (Fig. 5a) and in Fe-TiO2 (Fig. 6a) (Cheng et al., 2008, Zuorro et al., 2019). This result indicates that the phase transformation from anatase to rutile does not take place when nitrogen doped titania powders are calcined at temperature of 450 °C. In fact, as reported in literature, the use of urea as a nitrogen precursor inhibits the transformation from anatase to rutile phase (Cheng et al., 2008). Furthermore, traces of brookite phase were observed in the XRD pattern at about 2θ = 31° (1 2 0) (Figs. 5a and 6a) (Lee and Yang, 2006, Bhave, 2007, Yanqing et al., 2000). The XRD patterns of all N-TiO2_x samples were analyzed more in detail in the 2θ range between 22 and 30° (Fig. 5b). It is possible to observe a shift to lower values of 2θ, from 2θ = 25.91° (undoped TiO2) to 2θ = 25.30° (N-TiO2_0.3). This shift is consistent with literature and it can be associated to distortion and strain phenomena in the TiO2 crystal lattice induced by the incorporation of the nitrogen ions (Smirniotis et al., 2018, Sun et al., 2008). In particular, this phenomenon may occur because nitrogen ions replace oxygen in the TiO2 structure due to differences in binding properties (Vaiano et al., 2015a, Batzill et al., 2006), indicating that the crystalline structure of TiO2 was doped with nitrogen. The a and c lattice parameters calculated for the N-TiO2_x samples are reported in Table 2. The values of a and c parameters for the N-TiO2 samples are both higher than those observed for the undoped titania. It has also been possible to consider that the increase of N/Ti ratio does not influence both the value of a parameter (3.79–3.78 Ǻ) and c parameter (9.20–9.06 Ǻ). As shown in the Fig. 6b, the presence of Fe led to a slight shift of the peak related to the anatase phase for Fe-TiO2 at higher value (2θ = 26.31°) with respect to undoped TiO2 (2θ = 25.91°) (Morales et al., 2018). Generally, the Fe doping does not change the crystalline structure of TiO2, while a small change in the lattice parameters can be observed as reported in Table 2. The a and c lattice constant values for undoped TiO2 are 3.74 Å and 8.68 Å, respectively, whereas with the addition of Fe ions, the value of a parameter was 3.77 Å, while the c parameter changed to 9.21 Å. These lattice parameter values suggest that the iron doping caused the decrease of TiO2 crystallite size along c-axis because the ionic radius of Fe (0.64 Å) is relatively smaller compared to the ionic radius of Ti (0.68 Å) (Ganesh et al., 2012). Probably, due to the almost similar ionic radius, some portion of Ti ions in TiO2 lattice was replaced with Fe ions (Ganesh et al., 2012). When Fe ions substitute Ti ions, defective sites are formed which act as a long-lasting space charge region. Consequently, the electrical energy of these defects improves the efficiency of the carriers separation and the charge transfer (Prajapati et al., 2017). Thus, the XRD results indicate that the crystallinity of the iron and nitrogen doped materials is not affected by the presence of the dopant element. The XRD patterns of Fe-N-TiO2_1.2 sample (Fig. 6a) showed the presence of all diffraction peaks related to the anatase phase and a small signal associated to brookite, similarly to the other analyzed samples. The peak corresponding to anatase (1 0 1) plane evidenced a shift up to 2θ = 26.11°, as also observed for Fe-TiO2 sample (Fig. 5b) (Ramalingam et al., 2017). Finally, a and c lattice parameters for Fe-N-TiO2_1.2 are 3.75 Å and 8.58 Å, respectively (Table 2). The a lattice parameter for this sample seems to be similar to undoped TiO2 (3.74 Å) and lower than N-TiO2_1.2 and Fe-TiO2 (3.77 Å), whereas the c lattice parameter for Fe-N-TiO2_1.2 (8.58 Å) is lower with respect to undoped TiO2 (8.68 Å), N-TiO2_1.2 (8.81 Å) and Fe-TiO2 (9.21 Å).
The average crystallite size is in the range 6–8 nm (Table 2). Photocatalysts exhibiting the lowest values of crystallite size, showed the highest values of SBET, as expected.
Raman spectra in the range of 100–900 cm−1 for undoped and N-doped TiO2_x photocatalysts are presented in Fig. 7.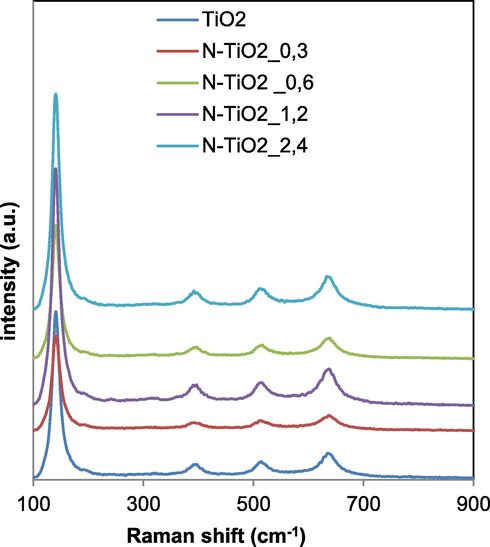
Raman spectra of TiO2, N-TiO2_0.3, N-TiO2_0.6, N-TiO2_1.2 and N-TiO2_2.4 samples.
Raman bands were observed at 144, 397, 516 and 638 cm−1 together with a weak shoulder at 195 cm−1 in the spectra of all samples, indicating that anatase was the predominant crystalline structure. No Raman signals associated to TiN bonds were detectable in the N-TiO2_x samples (Gurkan et al., 2012). This result may be an indication that N anions did not react with TiO2 surface, meaning that the dopant element is placed in the interstitial or the substitutional sites of the titania structure (Gurkan et al., 2012), as also evidenced by XRD (Fig. 5) and UV–Vis DRS results (Fig. 2). TiO2 common signals related to the anatase phase were also evident for Fe-TiO2 sample (Fig. 8).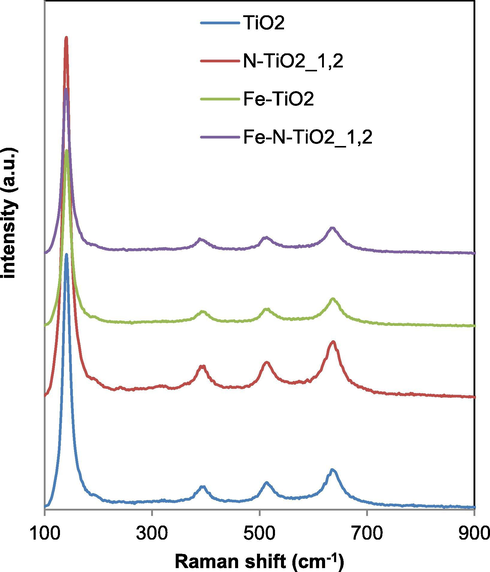
Raman spectra of TiO2, N-TiO2_1.2, Fe-TiO2 and Fe-N-TiO2_1.2 samples.
No bands due to iron oxides were detected (Zuorro et al., 2019). Fe-doped TiO2 maintained the TiO2 structure indicating that the Fe3+ ions are present into the TiO2 framework, replacing Ti4+ cations (Ali et al., 2017). Additionally, the intensity of the Raman bands for Fe-TiO2 sample was lower than those observed for undoped TiO2, indicating the possible incorporation of Fe3+ into the substitutional sites of the TiO2 lattice (Prajapati et al., 2017), in agreement with XRD results. Fe-N-TiO2_1.2 photocatalyst (Fig. 8) also showed the typical Raman signals related to anatase TiO2 and the intensity of these bands is lower than that of undoped TiO2, Fe-TiO2 and N-TiO2_1.2 photocatalysts.
The surface acidity of the prepared samples was estimated using the mass titration method. The pH values (representative of PZC) are reported in Table 2. In particular, the PZC value of undoped TiO2 is 6.02, very close to those reported in literature for TiO2 in anatase phase (Ciambelli et al., 2005). On the other hand, N-TiO2_x, Fe-TiO2 and Fe-N-TiO2_1.2 photocatalysts showed an acidic character, being the ZPC values equal to 5.10, 5.15 and 5.02 pH unit, respectively (Ganesh et al., 2012). It is worth to underline that the result obtained for the N-TiO2_x samples could be an indication about the absence of surface nitrogen groups, which typically induce a basic character to the surface of TiO2 samples modified with nitrogen (Sorrentino et al., 2001). Fig. S1 (reported in Supplementary Material) shows the FESEM images of TiO2, Fe-TiO2, N-TiO2_1.2 and Fe-N-TiO2_1.2 photocatalysts. In particular, from the images it is possible to observe that all the samples are characterized by a non-uniform structure of macro aggregates indicating that the doping process does not influence the photocatalysts morphology.
3.2 Photocatalytic activity results under visible light
3.2.1 Effect of photocatalyst formulation
The visible light driven degradation of AO7 was investigated for all prepared photocatalysts. Fig. 9 reports the AO7 relative concentration as a function of irradiation time showing the influence of the amount of urea in N-TiO2_x in the photocatalytic discoloration efficiency.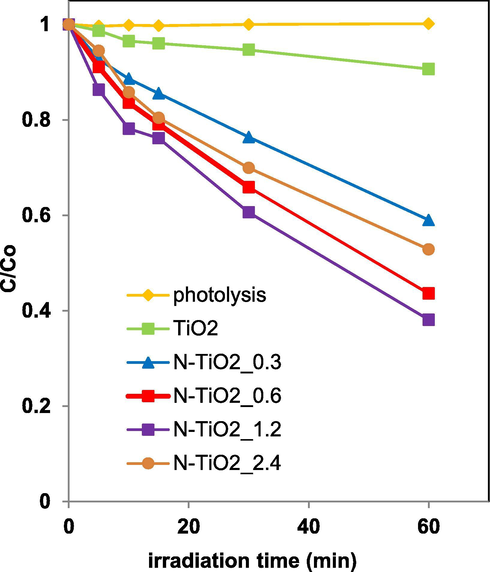
Photocatalytic discoloration of TiO2, N-TiO2_0.3, N-TiO2_0.6, N-TiO2_1.2, N-TiO2_2.4 photocatalysts under visible light irradiation.
The AO7 relative concentration did not change under visible irradiation for 60 min in the absence of photocatalyst, indicating that the photolysis effect is negligible. In the presence of the photocatalysts, the AO7 relative concentration progressively decreased. In detail, after 60 min, AO7 discoloration efficiency was equal to about 10% with undoped TiO2. All N-TiO2_x samples were more active than undoped TiO2 under visible light irradiation: the increase in the amount of urea from 0.3 to 1.2 g in the preparation causes an increase of photocatalytic activity. A further increase in the urea content shows a worsening of the photocatalytic performance. The optimal colour removal efficiency (about 62%) was obtained using the photocatalyst prepared with a urea amount equal to 1.2 g (N-TiO2_1.2). The influence of N presence and its content on photocatalytic activity of N-doped TiO2 is widely reported in literature (Kim et al., 2018; Haoli et al., 2007; Qin et al., 2008; Sacco et al., 2018, 2015; Vaiano et al., 2015b; Cheng et al., 2016; Reda et al., 2017; Wojtaszek et al., 2020). It is reported that the incorporation of N in the TiO2 structure induces the formation of an N 2p band above the original O 2p valance band leading to the band gap decrease and enhancing the photocatalytic activity under visible light (Kim et al., 2018, Vaiano et al., 2015a). On the other hand, the existence of an optimal N content can be explained considering that the oxygen sites of TiO2 can be partially replaced with nitrogen ions (Shin et al., 1991) inducing oxygen vacancies and, as a consequence, the amount of Ti3+ increases with the increase of N content (Haoli et al., 2007; Qin et al., 2008). Both oxygen vacancies and Ti3+ species acted as hole traps, inhibiting the recombination of electron-hole pairs and, therefore, improving the photocatalytic activity under visible light (Linsebiger et al., 1995). However, when the concentration of N in N-doped TiO2 is excessively high, the recombination of the photogenerated electron-hole pairs became easier (Li et al., 2004) since the excessive amount of oxygen vacancies and Ti3+ species act as recombination centres for electron-hole pairs (Haoli et al., 2007; Qin et al., 2008). The previous observations can explain why the AO7 discoloration efficiency becomes lower when the N content was higher than the optimal amount (1.2 g).
Fe-TiO2 sample was much more active than undoped TiO2 under visible light. From Fig. 10, it is also possible to notice a substantial enhancement of the photocatalytic performances for Fe-TiO2 sample with a discoloration efficiency of about 80%, compared to 62% achieved using N-TiO2_1.2 photocatalyst.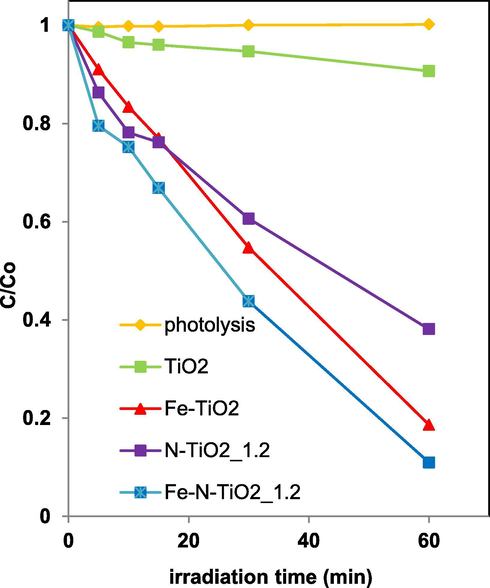
Photocatalytic discoloration of TiO2, N-TiO2_1.2, Fe-TiO2 and Fe-N-TiO2_1.2 photocatalysts under visible light irradiation.
A further increase in visible light driven AO7 discoloration was obtained using Fe-N co-doped TiO2 prepared with the optimal amount of urea, as assessed from the photocatalytic tests carried out on N-TiO2_x photocatalysts. In particular, after 60 min of irradiation time, the relative AO7 concentration for Fe-N-TiO2_1.2 photocatalyst was lower than Fe-TiO2 and N-TiO2_1.2 photocatalysts, reaching a discoloration efficiency of about 90%. The higher photocatalytic activity of Fe-TiO2 with respect to undoped TiO2 should be due to the substitution of Ti4+ ions with Fe3+, which acts as electron acceptors promoting the charge separation of photo-generated electrons and holes and yielding more hydroxyl radicals on the surface of the oxide lattice, as reported in literature (Delekar et al., 2012; Zhang et al., 2011). Additionally, Fe-TiO2 showed a higher SBET and a lower Ebg with respect to N-TiO2_1.2 (Table 2), justifying the better performances of Fe-TiO2 photocatalyst under visible light. On the other hand, the enhanced photocatalytic activity by modification of the TiO2 structure with N and Fe may be associated with the simultaneous action of Fe3+ (previously underlined) and N anions, which are able to replace the oxygen sites of TiO2 lattice, generating Ti3+ sites and oxygen vacancies (Ramalingam et al., 2017). At the same time, despite Fe-N-TiO2_1.2 sample presented a SBET slightly lower than Fe-TiO2, the co-doped photocatalyst displayed a lower Ebg value (Table 2). Therefore, it is not surprising that Fe-N-TiO2_1.2 showed the best photocatalytic activity under visible light irradiation. It is worthwhile to note that, with Fe-N-TiO2_1.2 sample, about 90% of AO7 discoloration was achieved in a very short time (60 min), if compared to the treatment time reported in several papers, about the AO7 degradation under visible light using also different photocatalyst formulations (Li et al., 2016; Wu et al., 2010c, 2010b, 2010a; Ji et al., 2012).
The TOC of solutions was measured to assess the mineralization performances of the photocatalysts. TOC removal efficiency after 60 min of treatment time using N-TiO2_x samples was shown in Fig. 11. The highest mineralization efficiency (55%) was observed for the N-TiO2_1.2 sample, confirming that 1.2 g of urea was the optimal value also for the mineralization of the target pollutant.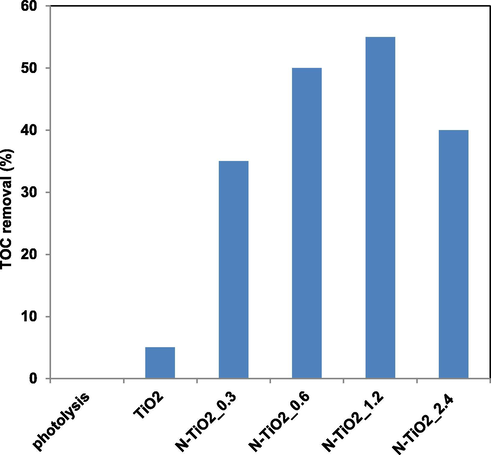
TOC removal (%) after 60 min of visible light irradiation of TiO2, N-TiO2_0.3, N-TiO2_0.6, N-TiO2_1.2 and N-TiO2_2.4 photocatalysts.
Fig. 12 reports the TOC removal of Fe-N-TiO2_1.2 photocatalyst that was found to be equal to 83%. The co-doped sample (Fe-N-TiO2_1.2) was certainly more efficient than the undoped titania (5%), but it also showed a better efficiency in the AO7 mineralization compared to N-TiO2_1.2 (55%) and Fe-TiO2 (73%) samples.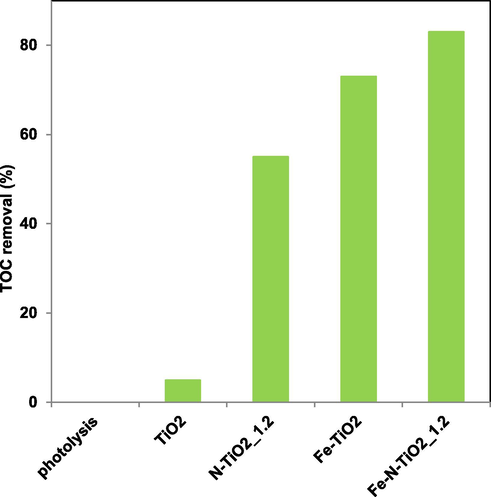
TOC removal (%) after 60 min of visible light irradiation of TiO2, N-TiO2_1.2, Fe-TiO2 and Fe-N-TiO2_1.2 photocatalysts.
So, it is worthwhile to note that discoloration and mineralization occurs simultaneously under visible light irradiation of N-doped and Fe-N co-doped photocatalysts.
3.2.2 Kinetics evaluation of AO7 discoloration and mineralization
The apparent kinetic constant for AO7 discoloration and mineralization was evaluated in order to better evidence the influence of co-doping on photocatalytic performances. It was considered that AO7 photodegradation reaction follows a pseudo first-order kinetic, as reported in literature (Li et al., 2016; Wu et al., 2010c; Omrania et al., 2019). The photocatalytic degradation rate (r) depends on AO7 concentration or TOC in aqueous solution according to the following relationship:
s = concentration of AO7 (mg L−1) or TOC (mgc L−1);
k = apparent kinetic constant (min−1).
Integrating the mass balance (Eq. (7)) equation between the initial time (t = 0) and a generic irradiation time t, it is possible to obtain the equation Eq. (8).
The values of the apparent kinetic constant k are calculated by plotting as a function of the irradiation time (t) (Figs. S2 and S3 of Supplementary Material).
The obtained values (kdec for discoloration and kmin for mineralization) are reported in Fig. 13 for the TiO2, N-TiO2_1.2, Fe-TiO2 and Fe-N-TiO2_1.2 samples.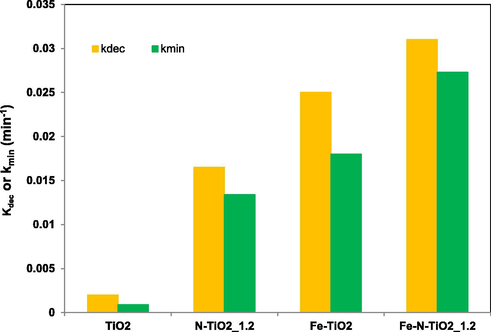
Apparent kinetics constant for AO7 discoloration (kdec) and mineralization (kmin) using TiO2, N-TiO2_1.2, Fe-TiO2 and Fe-N-TiO2_1.2 photocatalysts.
The overall rate constants for AO7 discoloration were given in the following order:
kdec Fe-N-TiO2_1.2 > kdec Fe-TiO2 > kdec N-TiO2_1.2 > kdec N-TiO2_x > kdec TiO2, indicating the faster AO7 discoloration and therefore the higher photocatalytic activity for Fe-N-TiO2_1.2 photocatalyst. The mineralization rate constants also increased in the following order:
kmin Fe-N-TiO2_1.2 > kmin Fe-TiO2 > kmin N-TiO2_1.2 > kdec N-TiO2_x > kminTiO2, thus proving that also the AO7 mineralization with Fe-N-TiO2_1.2 photocatalyst is faster than that with undoped TiO2, N-TiO2_1.2 and Fe-TiO2 photocatalysts.
3.3 Calculation of electric energy consumption
In order to compare the system under investigation (Fe-N-TiO2_1.2) with the literature dealing with the Fe-N doped TiO2 formulation, the electric energy consumption (EE/O) was estimated. It is recognized that EE/O (given in kWh in European Countries) represents a scale-up parameter required to remove a pollutant by one order of magnitude (90%) in 1 m3 of polluted water (YASAR and YOUSAF, 2012). The EE/O values were calculated using the following proposed equation (Azbar et al., 2004, Vaiano et al., 2019):
where
P = nominal power of the light source (kW);
t = irradiation time (minutes);
V = solution volume (L);
Co = AO7 initial concentration (mg L−1);
Cf = AO7 final concentration (mg L−1).
The EE/O value for Fe-N-TiO2_1.2 is reported in Table 3 and compared with the energy consumption required to remove different contaminants using Fe-N co-doped TiO2 as reported in other papers (Cong et al., 2007, Shen et al., 2008, Zhou and Wang, 2014).
Contaminant
Types light source
Power input (W)
EE/O (KWh m−3)
Reference
Acid Orange 7
Visible-LEDs
10
43
Present work
Rhodamine B
halogen lamp
1000
3.5·104
Cong et al. (2007)
Methylene Blue
xenon lamp
450
1.6·104
Zhou and Wang (2014)
Methyl Orange
xenon lamp
300
1.3·103
Shen et al. (2008)
Phenol
metal halide lamp
575
250
Sun et al. (2013)
Ciprofloxacin
LEDs lamp
12
120
Suwannaruang et al. (2020)
The EE/O values confirm that the electric energy consumption for the AO7 degradation by Fe-N-TiO2_1.2 photocatalyst under investigation is drastically less than EE/O data related to the removal of water pollutants under visible light with similar photocatalysts.
3.4 Possible role of reactive oxygen species towards the AO7 discoloration under visible light
The possible role of reactive oxygen species (ROS), such as hydroxyl radicals, superoxide and positive holes has been investigated during the AO7 photocatalytic discoloration process using Fe-N-TiO2_1.2. The scavenger probe molecules were: isopropanol (IPA, 10 mmol L−1) for hydroxyl radicals (Zhang et al., 2018), benzoquinone (BQ, 1 μmol L−1) for superoxide (Zhang et al., 2017) and disodium ethylenediamine tetra-acetate (EDTA, 10 mmol L−1) for positive holes. Fig. 14 shows the effects of the scavengers presence on photocatalytic performances.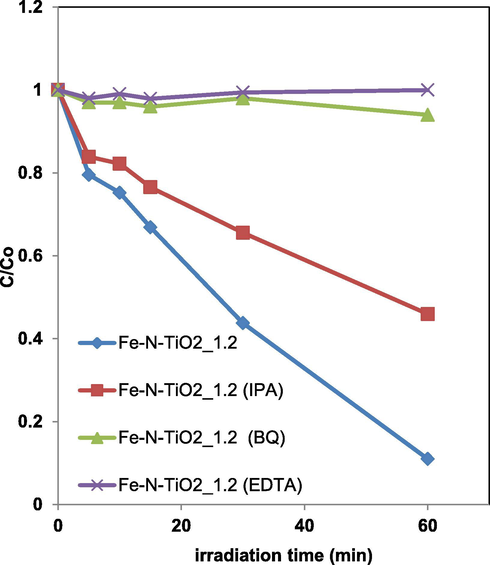
Effects of different scavengers on AO7 photodegradation using Fe-N-TiO2_1.2 photocatalyst under visible light irradiation.
It can be seen as the addition of IPA, BQ and EDTA influenced the AO7 discoloration rate. In particular, it was found that the IPA presence slightly decreased the AO7 discoloration efficiency while, the addition of BQ and EDTA completely inhibited the photocatalytic process. These results demonstrate that the main reactive oxygen species involved in the AO7 discoloration mechanism were represented by superoxide and positive holes. They are consistent with the literature reporting the role of ROS on visible light driven photodegradation of AO7 (Stylidi et al., 2004).
4 Conclusions
The photocatalytic performances under visible light irradiation of Fe-N codoped TiO2 photocatalysts were investigated in the treatment of aqueous solutions containing AO7. The photocatalysts were prepared by sol–gel method and analyzed by different characterization techniques. UV–vis DRS spectra showed that Fe-N-TiO2_1.2 sample gives visible-light absorption contributions higher than those of undoped TiO2, N-TiO2_1.2 and Fe-TiO2 photocatalysts. It was observed a decrease in Ebg up to the value of 2.9 eV for N-TiO2_1.2 and 2.8 eV for Fe-TiO2, with respect to undoped TiO2 (3.2 eV). The further narrowing of Fe-N-TiO2_1.2 Ebg to value of 2.7 eV may be a possible indication of the enhancement of the photocatalytic activity in the visible light region with respect to both Fe-TiO2 and N-TiO2_1.2 samples. Furthermore, the XRD results indicate that the crystalline phase of the iron and nitrogen doped materials is not influenced by the presence of the dopant elements, showing the presence of all diffraction peaks related to the anatase phase and a small signal associated to brookite. It was observed an enhancement of photocatalytic AO7 discoloration and mineralization under visible light irradiation using Fe-N-TiO2_1.2 photocatalyst, also confirmed by the kinetic constants values for AO7 degradation. In particular, Fe-N-TiO2_1.2 was able to achieve 90% of discoloration efficiency and 83% of TOC removal in 60 min of LEDs light irradiation. This enhancement of photocatalytic activity should be due to the modification of the TiO2 structure with N and Fe associated with the simultaneous action of Fe3+ ions that inhibit the hole and electron recombination and nitrogen ions, which are able to replace the oxygen sites of TiO2 lattice, generating Ti3+ sites and oxygen vacancies. The main reactive oxygen species responsible of AO7 photocatalytic degradation are superoxide and positive holes generated under visible light irradiation. Finally, the optimized Fe-N-TiO2_1.2 evidenced photocatalytic performances better than other Fe-N co-doped TiO2 formulations investigated in literature, both in terms of treatment time and electrical energy consumption.
Declaration of Competing Interest
The authors declare that they have no known competing financial interests or personal relationships that could have appeared to influence the work reported in this paper.
References
- Review on photocatalytic conversion of carbon dioxide to value-added compounds and renewable fuels by graphitic carbon nitride-based photocatalysts. Catal. Rev.. 2019;61:595-628.
- [Google Scholar]
- Photocatalytic decolourization of a new water-insoluble organic dye based on phenothiazine by ZnO and TiO2 nanoparticles. Arab. J. Chem.. 2020;13:3633-3638.
- [Google Scholar]
- Photocatalytic performance of Fe-doped TiO2 nanoparticles under visible-light irradiation. Mater. Res. Express. 2017;4:015022.
- [Google Scholar]
- Comparison of various advanced oxidation processes and chemical treatment methods for COD and color removal from a polyester and acetate fiber dyeing effluent. Chemosphere. 2004;55:35-43.
- [Google Scholar]
- Influence of nitrogen doping on the defect formation and surface properties of TiO 2 rutile and anatase. Phys. Rev. Lett.. 2006;96:026103.
- [Google Scholar]
- Bhave, R., 2007. Synthesis and photocatalysis study of Brookite phase titanium dioxide nanoparticles.
- Synthesis and Characterization of Nitrogen-doped TiO2 Nanomaterials for Photocatalytic Activities under Visible Light. Rajamangala University of Technology Thanyaburi; 2011.
- Sol-Gel hydrothermal synthesis and visible light photocatalytic degradation performance of Fe/N codoped TiO2 catalysts. Materials. 2018;11:939.
- [Google Scholar]
- Effect of urea on the photoactivity of titania powder prepared by sol–gel method. Mater. Chem. Phys.. 2008;107:77-81.
- [Google Scholar]
- Enhanced photocatalytic activity of nitrogen doped TiO2 anatase nano-particle under simulated sunlight irradiation. Energy Procedia. 2012;16:598-605.
- [Google Scholar]
- Synthesis and characterization of N-doped TiO2 and its enhanced visible-light photocatalytic activity. Arabian J. Chem.. 2016;9:S1706-S1711.
- [Google Scholar]
- Cyclohexane photocatalytic oxidative dehydrogenation to benzene on sulphated titania supported MoOx. In: Studies in Surface Science and Catalysis. Elsevier; 2005.
- [Google Scholar]
- Preparation, photocatalytic activity, and mechanism of nano-TiO2 co-doped with nitrogen and iron (III) J. Phys. Chem. C. 2007;111:10618-10623.
- [Google Scholar]
- Structural refinement and photocatalytic activity of Fe-doped anatase TiO2 nanoparticles. Appl. Surf. Sci.. 2012;263:536-545.
- [Google Scholar]
- Increased photocatalytic activity of NiO and ZnO in photodegradation of a model drug aqueous solution: effect of coupling, supporting, particles size and calcination temperature. J. Hazard. Mater.. 2017;321:629-638.
- [Google Scholar]
- Trends in non-metal doping of anatase TiO2: B, C, N and F. Catal. Today. 2013;206:12-18.
- [Google Scholar]
- Origin of the different photoactivity of N-doped anatase and rutile TiO2. Phys. Rev. B. 2004;70:085116.
- [Google Scholar]
- Photodecolorization of Eriochrome Black T using NiS–P zeolite as a heterogeneous catalyst. J. Hazard. Mater.. 2010;176:629-637.
- [Google Scholar]
- Water Treatment. BoD–Books on Demand; 2013.
- Oxygen-rich TiO2 decorated with C-Dots: Highly efficient visible-light-responsive photocatalysts in degradations of different contaminants. Adv. Powder Technol.. 2019;30:1183-1196.
- [Google Scholar]
- Integration of carbon dots and polyaniline with TiO2 nanoparticles: substantially enhanced photocatalytic activity to removal various pollutants under visible light. J. Photochem. Photobiol., A. 2018;367:94-104.
- [Google Scholar]
- Zinc oxide nanoparticles obtained by supercritical antisolvent precipitation for the photocatalytic degradation of crystal violet dye. Catalysts. 2019;9:346.
- [Google Scholar]
- Electrochemical photolysis of water at a semiconductor electrode. Nature. 1972;238:37-38.
- [Google Scholar]
- Pharmaceutical industry wastewater: review of the technologies for water treatment and reuse. Ind. Eng. Chem. Res.. 2014;53:11571-11592.
- [Google Scholar]
- Preparation and characterization of Fe-doped TiO2 powders for solar light response and photocatalytic applications. Process. Appl. Ceram.. 2012;6:21-36.
- [Google Scholar]
- A brief study on the boosted photocatalytic activity of AgI/WO3/ZnO in the degradation of Methylene Blue under visible light irradiation. Desalination Water Treat.. 2019;166:92-104.
- [Google Scholar]
- Photocatalytic degradation of cefazolin over N-doped TiO2 under UV and sunlight irradiation: Prediction of the reaction paths via conceptual DFT. Chem. Eng. J.. 2012;184:113-124.
- [Google Scholar]
- Improving visible-light-induced photocatalytic ability of TiO2 through coupling with Bi3O4Cl and carbon dot nanoparticles. Sep. Purif. Technol.. 2020;238:116404.
- [Google Scholar]
- Preparation of nitrogen-doped titania and its photocatalytic activity. Rare Met.. 2007;26:254-262.
- [Google Scholar]
- Heterogeneous photocatalysis: fundamentals and applications to the removal of various types of aqueous pollutants. Catal. Today. 1999;53:115-129.
- [Google Scholar]
- CeO2 mediated photocatalytic degradation studies of CI acid orange 7. Environ. Technol.. 2012;33:467-472.
- [Google Scholar]
- A novel synthetic method for N Doped TiO2 Nanoparticles through plasma-assisted electrolysis and photocatalytic activity in the visible region. Front. Chem.. 2018;6:458.
- [Google Scholar]
- Removal of residual pharmaceuticals from aqueous systems by advanced oxidation processes. Environ. Int.. 2009;35:402-417.
- [Google Scholar]
- Synthesis of TiO 2 nanoparticles with pure brookite at low temperature by hydrolysis of TiCl 4 using HNO 3 solution. J. Mater. Sci.. 2006;41:557-559.
- [Google Scholar]
- Photocatalytic degradation of 2-mercaptobenzothiazole in aqueous La3+–TiO2 suspension for odor control. Appl. Catal. B. 2004;48:185-194.
- [Google Scholar]
- Efficient photocatalytic degradation of acid orange 7 over N-doped ordered mesoporous titania on carbon fibers under visible-light irradiation based on three synergistic effects. Appl. Catal. A. 2016;524:163-172.
- [Google Scholar]
- Photocatalysis: fundamentals and application to the removal of various types of aqueous pollutants. Chem. Rev.. 1995;95:735.
- [Google Scholar]
- Characterization and activity of visible-light-driven TiO2 photocatalyst codoped with nitrogen and cerium. J. Solid State Chem.. 2008;181:913-919.
- [Google Scholar]
- Photocatalytic degradation of azo dyes by nitrogen-doped TiO2 nanocatalysts. Chemosphere. 2005;61:11-18.
- [Google Scholar]
- Enhanced photocatalytic activity of (La, N) co-doped TiO2 by TiCl4 sol-gel autoigniting synthesis. J. Univ. Sci. Technol. Beijing, Mineral, Metall., Mater.. 2007;14:552-557.
- [Google Scholar]
- Industrial Ecology: Environmental Chemistry and Hazardous Waste. Routledge; 2017.
- Effect of dopant (Co, Ni) concentration and hydroxyapatite compositing on photocatalytic activity of titania towards dye degradation. J. Photochem. Photobiol., A. 2018;356:57-70.
- [Google Scholar]
- Coupling of the electrochemical oxidation (EO-BDD)/photocatalysis (TiO2-Fe-N) processes for degradation of acid blue BR dye. J. Electroanal. Chem.. 2018;808:180-188.
- [Google Scholar]
- Review on magnetically separable graphitic carbon nitride-based nanocomposites as promising visible-light-driven photocatalysts. J. Mater. Sci.: Mater. Electron.. 2018;29:1719-1747.
- [Google Scholar]
- Study of the phenol photocatalytic degradation over TiO2 modified by sulfation, fluorination, and platinum nanoparticles photodeposition. Appl. Catal. B. 2015;179:305-312.
- [Google Scholar]
- TiO2 photocatalysis: Design and applications. J. Photochem. Photobiol., C. 2012;13:169-189.
- [Google Scholar]
- Heterogeneous photodecolorization of mixture of methylene blue and bromophenol blue using CuO-nano-clinoptilolite. J. Ind. Eng. Chem.. 2014;20:1421-1431.
- [Google Scholar]
- Estimation of the point of zero charge of simple oxides by mass titration. J. Colloid Interface Sci.. 1989;130:157-164.
- [Google Scholar]
- A comprehensive study on the enhanced photocatalytic activity of Cu2O/BiVO4/WO3 nanoparticles. J. Photochem. Photobiol., A. 2020;389:112223.
- [Google Scholar]
- Focus on scavengers’ effects and GC-MASS analysis of photodegradation intermediates of sulfasalazine by Cu2O/CdS nanocomposite. Sep. Purif. Technol.. 2020;235:116228.
- [Google Scholar]
- Brief study on the kinetic aspect of photodegradation of sulfasalazine aqueous solution by cuprous oxide/cadmium sulfide nanoparticles. Catalyst. 2019;17:24.
- [Google Scholar]
- Surface modification of TiO2 photocatalyst for environmental applications. J. Photochem. Photobiol., C. 2013;15:1-20.
- [Google Scholar]
- Review on the criteria anticipated for the fabrication of highly efficient ZnO-based visible-light-driven photocatalysts. J. Ind. Eng. Chem.. 2018;62:1-25.
- [Google Scholar]
- Investigation of the physical properties of Fe: TiO 2-diluted magnetic semiconductor nanoparticles. J. Mater. Chem. C. 2017;5:4257-4267.
- [Google Scholar]
- Preparation of nitrogen-doped titania with visible-light activity and its application. C. R. Chim.. 2008;11:95-100.
- [Google Scholar]
- Surface and electrochemical characterization of N-Fe-doped-TiO2 nanoparticle prepared by hydrothermal and facile electro-deposition method for visible light driven pollutant removal. Int. J. Electrochem. Sci. 2017;12:797-811.
- [Google Scholar]
- Photocatalytic activity of nitrogen and copper doped TiO2 nanoparticles prepared by microwave-assisted sol-gel process. Arab. J. Chem.. 2020;13:86-95.
- [Google Scholar]
- Effect of solar simulated N-doped TiO2 photocatalysis on the inactivation and antibiotic resistance of an E. coli strain in biologically treated urban wastewater. Appl. Catal. B. 2014;144:369-378.
- [Google Scholar]
- A simple synthesis way to obtain iron-doped TiO2 nanoparticles as photocatalytic surfaces. Chem. Phys. Lett.. 2019;732:136643.
- [Google Scholar]
- Photocatalytic water disinfection under the artificial solar light by fructose-modified TiO2. Chem. Eng. J.. 2019;372:203-215.
- [Google Scholar]
- Removal of phenol in aqueous media by N-doped TiO2 based photocatalytic aerogels. Mater. Sci. Semicond. Process.. 2018;80:104-110.
- [Google Scholar]
- Photocatalytic removal of atrazine using N-doped TiO2 supported on phosphors. Appl. Catal. B. 2015;164:462-474.
- [Google Scholar]
- Photocatalytic decomposition of acetaldehyde under visible light irradiation over La3+ and N co-doped TiO2. Chem. Lett.. 2003;32:1156-1157.
- [Google Scholar]
- Progress in Nanomaterials Applications for Water Purification. Nanotechnologies for Environmental Remediation. Springer; 2017.
- Boosted visible-light photocatalytic performance of TiO2-x decorated by BiOI and AgBr nanoparticles. J. Photochem. Photobiol., A. 2019;384:112066.
- [Google Scholar]
- A comprehensive study on the enhanced photocatalytic activity of CuO-NiO nanoparticles: designing the experiments. J. Mol. Liq.. 2018;261:208-217.
- [Google Scholar]
- Preparation and photocatalytic activity of hierarchically mesoporous-macroporous TiO2− xNx. Appl. Catal. B. 2008;82:208-218.
- [Google Scholar]
- Visible light responsive Mn-S-co-doped TiO2 photocatalyst–Synthesis, characterization and mechanistic aspect of photocatalytic degradation. Sep. Purif. Technol.. 2017;183:382-391.
- [Google Scholar]
- Magnetically separable nanocomposites based on ZnO and their applications in photocatalytic processes: a review. Crit. Rev. Environ. Sci. Technol.. 2018;48:806-857.
- [Google Scholar]
- Visible-light-driven titania photocatalyst co-doped with nitrogen and ferrum. Appl. Surf. Sci.. 2008;254:4726-4731.
- [Google Scholar]
- Preparation and characterization of titanium oxynitrides with high specific surface areas. J. Solid State Chem.. 1991;95:145-155.
- [Google Scholar]
- Single-step synthesis of N-doped TiO2 by flame aerosol method and the effect of synthesis parameters. Aerosol Sci. Technol.. 2018;52:913-922.
- [Google Scholar]
- Performances of V2O5-based catalysts obtained by grafting vanadyl tri-isopropoxide on TiO2-SiO2 in SCR. Appl. Catal. A. 2001;209:45-57.
- [Google Scholar]
- Visible light-induced photocatalytic degradation of Acid Orange 7 in aqueous TiO2 suspensions. Appl. Catal. B. 2004;47:189-201.
- [Google Scholar]
- Preparation, photocatalytic performance and electronic structures of visible-light-driven Fe–N-codoped TiO2 nanoparticles. Mater. Chem. Phys.. 2011;126:761-768.
- [Google Scholar]
- Visible-light-driven TiO2 catalysts doped with low-concentration nitrogen species. Sol. Energy Mater. Sol. Cells. 2008;92:76-83.
- [Google Scholar]
- Visible light responsive titania photocatalysts codoped by nitrogen and metal (Fe, Ni, Ag, or Pt) for remediation of aqueous pollutants. Chem. Eng. J.. 2013;231:18-25.
- [Google Scholar]
- Visible light-induced degradation of antibiotic ciprofloxacin over Fe–N–TiO2 mesoporous photocatalyst with anatase/rutile/brookite nanocrystal mixture. J. Photoch. Photobio. A 2020112371
- [Google Scholar]
- A comprehensive kinetic study on the electrocatalytic oxidation of propanols in aqueous solution. Solid State Sci.. 2019;98:106033.
- [Google Scholar]
- Role of Fe (III) in aqueous solution or deposited on ZnO surface in the photoassisted degradation of rhodamine B and caffeine. Chemosphere. 2020;241:125009.
- [Google Scholar]
- Electric energy saving in photocatalytic removal of crystal violet dye through the simultaneous use of long-persistent blue phosphors, nitrogen-doped TiO2 and UV-light emitting diodes. J. Cleaner Prod.. 2019;210:1015-1021.
- [Google Scholar]
- Nanostructured N-doped TiO2 coated on glass spheres for the photocatalytic removal of organic dyes under UV or visible light irradiation. Appl. Catal. B. 2015;170:153-161.
- [Google Scholar]
- Photocatalytic removal of spiramycin from wastewater under visible light with N-doped TiO2 photocatalysts. Chem. Eng. J.. 2015;261:3-8.
- [Google Scholar]
- Preparation and photocatalysis of TiO 2 nanoparticles co-doped with nitrogen and lanthanum. J. Mater. Sci.. 2004;39:1305-1308.
- [Google Scholar]
- The influence of nitrogen doping on the electronic structure of the valence and conduction band in TiO2. J. Synchrotron Radiat.. 2019;26:145-151.
- [Google Scholar]
- A visible-light response vanadium-doped titania nanocatalyst by sol–gel method. J. Photochem. Photobiol., A. 2004;163:509-515.
- [Google Scholar]
- Preparation of nitrogen and fluorine co-doped mesoporous TiO2 microsphere and photodegradation of acid orange 7 under visible light. Chem. Eng. J.. 2010;162:710-717.
- [Google Scholar]
- Effective visible light-active boron and carbon modified TiO2 photocatalyst for degradation of organic pollutant. Appl. Catal. B. 2010;97:182-189.
- [Google Scholar]
- Properties of carbon and iron modified TiO2 photocatalyst synthesized at low temperature and photodegradation of acid orange 7 under visible light. Appl. Surf. Sci.. 2010;256:4260-4268.
- [Google Scholar]
- Hydrothermal preparation and characterization of brookite-type TiO2 nanocrystallites. J. Mater. Sci. Lett.. 2000;19:1445-1448.
- [Google Scholar]
- Solar assisted photo Fenton for cost effective degradation of textile effluents in comparison to AOPs. Global Nest J.. 2012;14:477-486.
- [Google Scholar]
- Characterization and photocatalytic activity of Fe-and N-co-deposited TiO2 and first-principles study for electronic structure. J. Solid State Chem.. 2011;184:2053-2060.
- [Google Scholar]
- Photocatalytic oxidation of organic dyes and pollutants in wastewater using different modified titanium dioxides: A comparative review. J. Ind. Eng. Chem.. 2015;26:1-36.
- [Google Scholar]
- Mechanism of enhanced photocatalysis of TiO2 by Fe3+ in suspensions. Appl. Surf. Sci.. 2011;258:1294-1299.
- [Google Scholar]
- Fabrication of novel visible-light-driven AgI/g-C3N4 composites with enhanced visible-light photocatalytic activity for diclofenac degradation. J. Colloid Interface Sci.. 2017;496:167-176.
- [Google Scholar]
- Synthesis of Ag3PO4/G-C3N4 composite with enhanced photocatalytic performance for the photodegradation of diclofenac under visible light irradiation. Catalysts. 2018;8:45.
- [Google Scholar]
- Advanced technologies in water and wastewater treatment. J. Environ. Eng. Sci.. 2002;1:247-264.
- [Google Scholar]
- Noncompensated codoping TiO2 nanowires: the enhanced visible light photocatalytic properties. Int. J. Photoenergy. 2014;2014
- [Google Scholar]
- Photocatalytic degradation of azo dye reactive violet 5 on Fe-doped titania catalysts under visible light irradiation. Catalysts. 2019;9:645.
- [Google Scholar]
Appendix A
Supplementary material
Supplementary data to this article can be found online at https://doi.org/10.1016/j.arabjc.2020.05.019.
Appendix A
Supplementary material
The following are the Supplementary data to this article:Supplementary data 1
Supplementary data 1


