

Translate this page into:
Enhanced visible light photocatalytic activity of CeO2@Zn0.5Cd0.5S by facile Ce(IV)/Ce(III) cycle
⁎Corresponding author. tfwd@163.com (Fei Teng)
-
Received: ,
Accepted: ,
This article was originally published by Elsevier and was migrated to Scientific Scholar after the change of Publisher.
Peer review under responsibility of King Saud University.
Abstract
In this study, CeO2@Zn0.5Cd0.5S heterostructure (Ce@ZCS) is synthesized via a simple two-step hydrothermal method. The effect of CeO2 loading on the visible-light photoactivity of Zn0.5Cd0.5S is mainly investigated. It is found that Ce@ZCS shows a 1.9 times activity as high as ZCS for the MB degradation. The improved activity mainly results from the significant enhanced charge separation by CeO2, in which the electron transfer is obviously promoted by the facile Ce(IV)/Ce(III) cycle. The excited electrons of ZCS is easy to transfer to CeO2, thus obviously increasing the charge separation of ZCS. The accepted electrons by CeO2 may easily be captured by the adsorbed O2 to form O2•−, and then O2•− could combine with H+/H2O to form HO2•, and •OH. Finally, O2•−, h+ and •OH are confirmed as the major oxidative species in photocatalytic reaction for Ce@ZCS, and a possible photocatalytic mechanism is proposed. The cheap, efficient Ce@ZCS photocatalyst could be applied for practical waste water treatment.
Keywords
Ce(IV)/Ce(III) cycle
CeO2@Zn0.5Cd0.5S
Electron transfer
Photocatalysis

1 Introduction
Recently, water pollution caused by organic contamination has got more attention of the researchers, especially, toxic organic dyes released by textile industry are becoming a serious threat to environment and aquatic life (Gonçalves et al., 2013; Yuan et al., 2011; Correia et al., 1994). Many methods have been developed to deal with the organic pollutants (Ye et al., 2019a, 2017a, 2017b). Amongst, solar energy photocatalysis is considered as a promising technology for dye degradation (Fujishima and Honda, 1972). During recent decade, a remarkable progress in environmental photocatalysis have been acquired (Ye et al., 2019a, 2019b; Chen et al., 2013; Zhang et al., 2011; Long et al., 2013; Fisher et al., 2013; Gu et al., 2018; Hua et al., 2019). Amongst semiconductor photocatalysts, ZnO and TiO2 are extensively used for the degradation of organic pollutants due to the high activity and relatively low cost (Chen et al., 2014; Lu et al., 2011; Ong et al., 2014). Due to the wide band gaps, however, they are effective only under UV light (λ ≤ 420 nm), which comprises 5% of solar energy, compared with visible light (45%) (Ong et al., 2013; Tan et al., 2014). To fully utilize solar energy, the efficient visible light photocatalysts are highly needed.
In the past decades, chalcogenides have been widely investigated as the efficient photocatalysts (Abideen and Teng, 2019, 2018; Liu et al., 2008; Ke et al., 2009). Amongst, CdS (band gap: 2.35 eV) (Abideen and Teng, 2019) and ZnS (3.10 eV) (Abideen and Teng, 2018) are considered as efficient visible-light and ultraviolet-light responsive photocatalysts, respectively. However, the severe photocorrosion limits their practical applications (Liu et al., 2008; Ke et al., 2009). To minimize these problems, solid solution is an effective way to enhance photocatalytic performances (Abideen and Teng, 2019; Xue et al., 2018). Furthermore, the band gap of solid solution can be easily adjusted by changing the molar ratio of Cd/Zn, which balance the redox ability of photoinduced carries and light absorption (Xue et al., 2018; Qin Li et al., 2013).
In addition, to develop efficient photocatalysts, co-catalysts are often used as efficient electron transport mediums to improve charge transfer and separation. Furthermore, co-catalysts can also provide active sites favouring for photocatalytic reactions, for example, in water splitting, noble metals can serve as an active sites for O2 or H2 generation (Zong et al., 2010). Hence, a suitable co-catalyst can effectively enhance the photocatalytic activity. Mostly, noble metals or their oxides have been confirmed to be active co-catalysts for photocatalytic reaction, such as Pt and RuO2 (Yan et al., 2009; Maeda et al., 2006). But noble metals are expensive and rare in the earth, therefore, it is highly desirable to explore new active cheap co-catalysts. For example, CeO2 is believed as an attractive material for the degradation of organic dyes, due to the flexible Ce3+/Ce4+ conversion, low cost and environmental friendliness (Li et al., 2016). Furthermore, the distinctive Ce 4f electron configuration makes it suitable for doping or modification with other material to enhance catalytic activity (Song et al., 2007). Heterostructure photocatalysts with similar band potentials can efficiently suppress the recombination of photo-induced carriers. Therefore, CeO2 coupled with Zn0.5Cd0.5S solid solution may be useful to improve charge separation and charge transfer.
In our work, a two-step hydrothermal process was designed for the synthesis of CeO2@Zn0.5Cd0.5S (Ce@ZCS). The relationship between the Ce@ZCS heterostructure and photocatalytic performances is discussed in detail. The as-synthesized Ce@ZCS heterostructure showed an improved charge separation, an increased light absorption, and an increased surface area. Under visible-light irradiation (λ ≥ 420 nm), the photocatalytic activity of Zn0.5Cd0.5S was obviously increased by loading CeO2 for the degradation of methylene blue (MB). The efficient Ce@ZCS photocatalyst could be applied for practical waste water treatment.
2 Experimental
2.1 Sample preparation
All the reagents of analytical grade were purchased from Beijing Chemical Reagents Industrial Company of China and used without further purification.
Synthesis of Zn0.5Cd0.5S (ZCS)
ZCS sample was synthesized by a simple hydrothermal method. Typically, 5 mmol of Zn(CH3COO)2·2H2O, 5 mmol of Cd(CH3COO)2·2H2O and 12.5 mmol of sulfourea (CH4N2S) were dissolved in 65 mL of distilled water under stirring. The mixture solution was further stirred for 30 min, then transferred and sealed in a 100 mL Teflon-lined autoclave and heated at 160 °C for 8 h. After reaction for 8 h, the autoclave was cooled to room temperature naturally; the solid was washed with distilled water and ethanol several times, respectively; and collected via centrifugation. Finally, the solid was dried at 60ο C in an oven overnight and denoted as ZCS.
Synthesis of CeO2@Zn0.5Cd0.5S (Ce@ZCS)
Ce@ZCS heterostructure was also synthesized via a post hydrothermal approach. Typically, 2 mmol of Ce(NO3)3·6H2O was dissolved into 35 mL of double distilled water under constant stirring for 10 min. Then, 0.1 g of obtained ZCS was dispersed into the solution under vigorous stirring and stirred for 30 min. Subsequently solution was transferred into a 50 mL Teflon cup stainless steel autoclave and processed at 180 °C for 12 h. After reaction the autoclave was let to cool down at room temperature, product obtained was washed three times with ethanol and double distilled water and collected via centrifugation. Finally dried at 60° C for 6 h and denoted as Ce@ZCS.
2.2 Characterization
The purity and crystal phases of the samples were observed by X-ray powder polycrystalline diffractometer (Rigaku D/max-2550VB), using graphite mono-chromatized Cu K radiation (λ = 0.154 nm), with an operating current of 40 kV and 50 mA. The XRD patterns of all the samples were scanned in the range of 10–80ο (2θ) at a scanning rate of 7° min−1. The morphologies of the samples were examined by scanning electron microscope (SEM, Hitachi SU-1510) with an acceleration voltage of 15 keV; and energy dispersive X‐ray spectroscopy (EDS) was perfomed by a JSM 6700F microscope linked with an Oxford Instruments X‐ray analysis system. A thick 5 nm gold layer was coated on the samples, before observation. The fine surface structures of the samples were otained by high-resolution transmission electron microscopy (HRTEM), using a JEOL JEM-2100F instrument with an acceleration voltage of 200 kV. The elemental compositions and binding energies of the samples were obtained by X-ray photoelectron spectroscopy (XPS) using VG ESCALAB MKII (Mg Kα source and a charge neutralizer), where C 1 s peak (285.0 eV) was as a reference binding energy. UV–vis diffuse reflectance spectra of the samples were obtained using a UV–vis spectrophotometer (UV-2550, Shimadzu, Japan), where BaSO4 was used as a reflectance standard. Surface areas of the samples were measured using Micrometrics ASAP 2020HD88 N2 sorption apparatus, where the Brunauer-Emmett-Teller (BET) and Barrett-Joyner-Halenda (BJH) methods were used to calculate the surface area and pore size, respectively. Room temperature photoluminescence (PL) spectra were detected by F-7000 FL Spectrophotometer (HITACHI) at an excitation wavelength (λex) of 350 nm. Chemical bonds and functional groups of the samples were determined by Fourier Transform Infrared Spectroscopy (FT-IR, P.E. Spectrum 100).
2.3 Measurements of EIS, photocurrent, Mott-Schottcky and SPV
The electrochemical impedance spectroscopy (EIS) and photocurrent were measured using an electrochemical system (CHI-660B, China). EIS was done in a range of 0.1 Hz to 100 kHz in an open circuit potential of 0.3 V with alternating current (AC) voltage amplitude of 5 mV, the results were analysed via Zsimwin software. The measurements were carried out in a conventional three-electrode system, for which indium tin oxide (ITO) glass was used for the current collection and 0.2 M Na2SO4 was used as the electrolyte solution. The sample/ITO photo-electrodes were prepared by a dip-coating method. The photo-electrode was implemented as the photo-anode in a photo-electrochemical cell (PEC). The Mott-Schottky method was applied to measure the flat potential (Efb) of semiconductor particle films. The potential ranged from −1.0 to 1.0 V (vs. SHE). Surface photovoltage (SPV) spectra were on a system consists of a photovoltaic cell, a computer monochromatic light source and a lock-in amplifier (SR830-DSP) with a light chopper (SR540). The monochromatic light is provided by a 500 W Xenon lamp (CHFXQ500 W, Global Xenon Lamp Power) and a double-prism mono-chromator (Zolix SBP500). During the SPV analysis, the samples were tested without further treatment.
2.4 Evaluation of photochemical activity
The photocatalytic activities of the samples were evaluated under visible light irradiation (λ ≥ 420 nm). Typically, 0.1 g of photocatalysts was putted into a 250-mL beaker containing 200 mL of 10 mg L−1 methylene blue (MB) dye solution. The beaker was placed in a black sealed box with an opening top, the distance between beaker and light source was kept 15 cm. Then, the suspension was continuously stirred for 30 min in the dark chamber to ensure the establishment of an adsorption–desorption equilibrium between catalyst and dye; subsequently Xe lamp (500-W Beijing Zhongjiao Jinyuan Science Co. Ltd. China) was turned on. During degradation, 3–5 mL solution was collected and centrifuged to separate the catalyst from dye solution. Afterword, UV–vis spectra of as-centrifuged solution were obtained by Spectrumlab 722sp spectrophotometer at the wavelength of 664 nm. The degradation performances of the samples were calculated according to the formula i.e. C/C0 (C0 and C are the concentration of dyes at t = 0 and t = t irradiation time, respectively). Finally, in order to examine the active oxidation species involved in the degradation process, ethylene diaminetetra-acetic acid disodium salt (EDTA), isopropanol alcohol (IPA) and N2 bubbling were used to capture the holes (h+), hydroxyl radicals (•OH) and superoxide anions (O2•−), respectively. The following operations were same as above.
3 Results and discussion
3.1 Physical analysis of the samples
As shown in Fig. 1a, the X-ray diffraction (XRD) patterns of ZCS are well in agreement with the previous work (Abideen and Teng, 2019). For Ce@ZCS, besides the ZCS peaks four additional diffraction peaks at 28.54°, 33.08°, 47.48 and 56.34° are attributed to (1 1 1), (2 0 0), (2 2 0) and (3 1 1) planes of cubic phase of CeO2 (PDF#75-0151), respectively (Fig. S1a, seeing SI). Using Debye-Scherrer formula (Serpone et al., 1995), the average crystallite sizes are calculated to be 8.74 and 13.82 nm for ZCS and Ce@ZCS, respectively (Table 1). For comparison, CeO2 sample was also prepared by the simple hydrothermal method as detailed in supporting information (SI).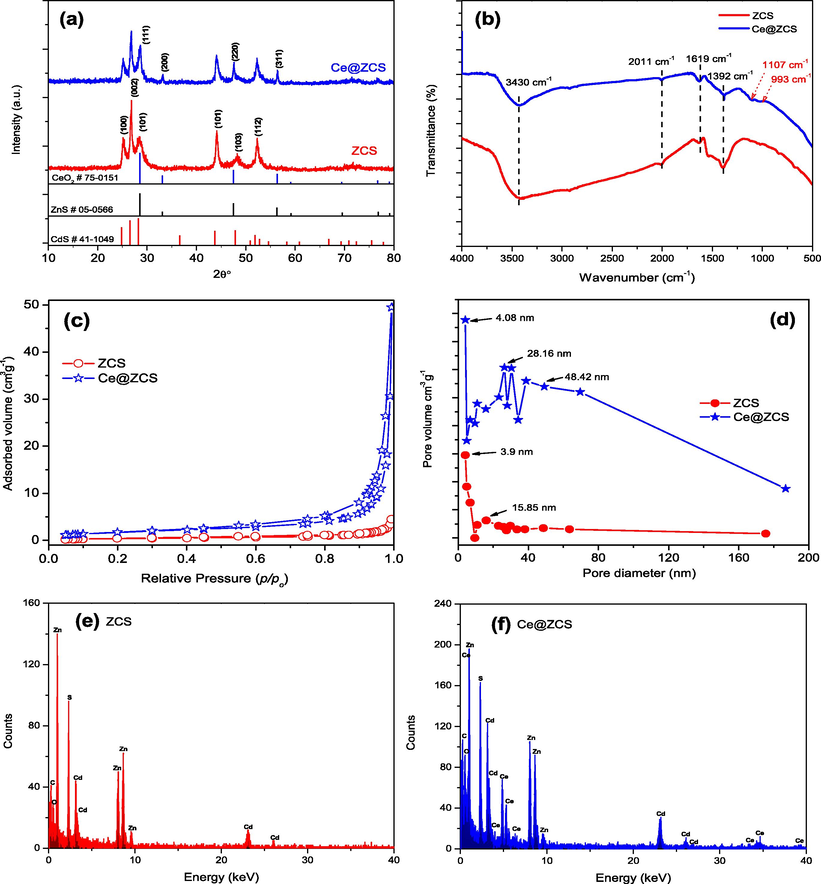
(a) XRD patterns; (b) FT-IR spectra; (c) N2 sorption isotherms; (d) pore size distribution; (e, f) EDX spectra.
Samples
aCrystallite size (nm)
Kinetics constant ka (min−1)
bSBET (m2g−1)
Absorption edge (nm)
Band gapc (eV)
ZCS
8.74
0.00938
0.36
556
2.15
Ce@ZCS
13.82
0.01763
2.12
562
2.10
Figs. 1b and 1Sb (seeing SI) show the Fourier-transform infrared spectra (FT-IR) of the samples. The absorption bands at near 1392, 1619, 2011 and 3430 cm−1 are observed for ZCS; while two additional bands at near 993 and 1107 cm−1 are observed for Ce@ZCS. The band at near 1392 cm−1 results from the bending vibration of C-H, and the bands at 3430 and 1619 cm−1 result from the stretching and bending vibrations of O—H, respectively, because of the surface absorbed water (Nakamoto, 2008). The bands at near 2011 cm−1 are resulted from the stretching vibration of H—N—H (NH2) caused by unavoidable thiourea during synthesis process (Han et al., 2009). The additional weak bands at near 993 and 1107 cm−1 result from stretching modes of Ce—O—Ce (Lv et al., 2017; Zhang et al., 2017).
Fig. 1c and d shows that ZCS and Ce@ZCS both show type IV isotherms, with hysteresis loops of type H3 at a relative pressure (p/po) range of 0.2–0.8 and 0.2–1.0, indicating the formation of mesopores and macropores (Sing et al., 1985), respectively. ZCS exhibits a narrow pore size distribution, with a most pore diameter of 3.9 nm in the range of about 4–16 nm; while Ce@ZCS exhibits a broad distribution of pore sizes, with a most pore diameter of 4.08 nm in the range of about 4–187 nm. The BET surface areas of ZCS and Ce@ZCS are measured to be 0.4 and ∼2 m2 g−1, respectively (Table 1). The higher BET surface area of Ce@ZCS can provide more active sites, which may enhance the activity. Fig. 1e and f shows energy dispersive X-ray spectra (EDS) of the samples. Compared with ZCS, the Ce and O are contained in Ce@ZCS, besides Zn, Cd and S. EDS quantitative analysis shows that the loaded CeO2 on ZCS is about 2.73 at.% (Table 2).
Samples
Weight percentage (wt.%)
Atomic percentage (at.%)
Zn
Cd
S
Ce
O
Zn
Cd
S
Ce
O
ZCS
26.23
47.67
26.10
/
/
24.31
26.21
49.48
/
/
Ce@ZCS
25.08
46.01
25.12
2.61
1.18
23.41
24.65
49.21
2.02
0.71
The morphologies of ZCS and Ce@ZCS are characterized with electron microscopy. Fig. 2a shows that ZCS sample consists of ∼1.5–4.5 μm spherical flowers, without any adhesiveness and agglomeration. Fig. 2b shows that Ce@ZCS sample consists of ∼3–5.8 μm flowers, and CeO2 nanoparticles are well attached on the surface of ZCS micro-flowers. Fig. 2e and f shows the lattice fringe images of the samples. The d value of ∼0.312 nm corresponds to the (1 0 1) facet of ZCS, and the d value of ∼0.193 nm corresponds to (2 2 0) facet of CeO2. The results confirm the formation of Ce@ZCS heterojunction.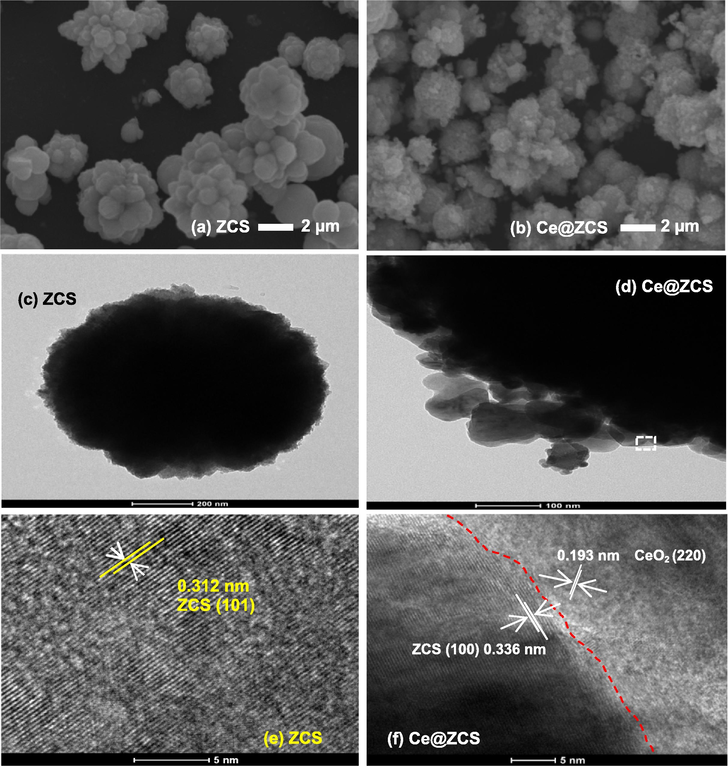
(a, b) SEM images; (c, d) TEM images; (e, f) lattice fringe images.
To examine the surface elemental composition and chemical states of the samples, X-ray photoelectron spectra (XPS) are performed. All the binding energies (BEs) are referenced by taking C 1s peak at 285.0 eV. The survey XPS spectra confirm the presence of Zn, Cd, S, Ce, and O in the samples (Fig. S2, seeing SI). The high-resolution XPS spectra of the samples are shown in Fig. 3. For ZCS, the bonding energies (BEs) of Zn 2p3/2 and Zn 2p1/2 are observed at 1022.60 and 1045.70 eV, while the BEs of Cd 3d5/2 and Cd 3d3/2 are observed at 404.84 and 411.60 eV, respectively (Fig. 3a and b) (Abideen and Teng, 2019). For Ce@ZCS, the BEs of Cd 3d shift to a higher BE value by ∼0.1 eV, compared with those of ZCS; whereas no shift in BEs of Zn 2p is observed. For Ce@ZCS, the BE shift of Cd 3d is due to the changed chemical state of Cd in the samples (Qin Li et al., 2013). The peaks of S 2p3/2 and S 2p1/2 are observed at 162.04 and 163.45 eV for ZCS (Fig. 3c), whereas 161.46 and 162.60 eV for Ce@ZCS, respectively (Fig. 3d); indicating the +2 valence of sulphur (Zhang et al., 2013). The slightly shift in BEs of S 2p could be the bonding of S2− with Ce4+ in Ce@ZCS (Zhao et al., 2017a). From Fig. 3e, it can be observed that Ce 3d spectrum has a relatively complex structure, which is composed of two doublets (3d5/2 & 3d3/2) with eight peaks after Gaussian fitting. The peaks located in the low and high BEs regions are attributed to Ce 3d5/2 and Ce 3d3/2, respectively. (Chen et al., 2016) The BEs peaks at nearly 882.46, 889.13 and 892.67 eV and their spin-orbit splitting peaks at 898.35, 904.64 and 917.10 eV are assigned to Ce 3d5/2 and Ce 3d3/2 of Ce4+, respectively (Chen et al., 2016); while BE peak at nearly 901.02 eV can be attributed to the Ce 3d3/2 of Ce3+ (Kim et al., 2007). These results demonstrate that the formation of the mixed valence state of Ce3+ and Ce4+in Ce@ZCS. From Fig. 3f, two deconvoluted peaks of O 1s at 529.25 and 531.87 eV are ascribed to the H2O adsorbed on the Ce@ZCS surface and the lattice O2− of CeO2, respectively (Zhao et al., 2017b; Zhang et al., 2016). Additionally, XPS quantitative elemental analysis shows that the loaded CeO2 on ZCS is about 3.84 at.% (Table 3).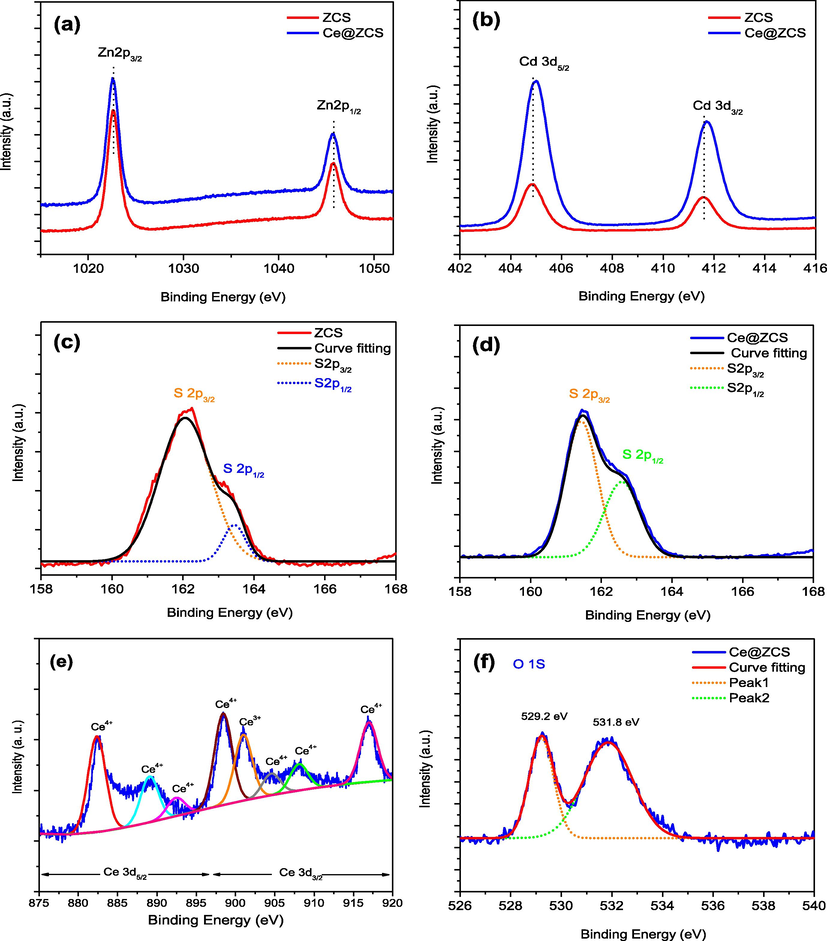
High-resolution XPS spectra of the samples: (a) Zn 2p; (b) Cd 3d; (c, d) S 2p; (e) Ce 3d; (f) O 1s.
Samples
Atomic percentage (at.%)
Zn
Cd
S
Ce
O
ZCS
24.46
26.01
49.53
/
/
Ce@ZCS
23.08
24.15
48.93
2.59
1.25
3.2 Optical property
Figs. 4a and 1Sc (seeing SI) show the ultraviolet–visible light diffuse reflectance spectra (UV-DRS), while Figs. 4b and Fig. 1Sd (seeing SI) represent Tauc plots of the samples. The band gaps energies (Eg) are obtained via generalizing a linear relation of (αhν)0.5 = 0 (Li et al., 2011a). The optical absorption edges are observed at about 400, 556 and 562 nm for CeO2, ZCS and Ce@ZCS, corresponding to the band gaps of 3.10, 2.15 and 2.10 eV, respectively (Table 1). The results indicate that ZCS and Ce@ZCS are both visible-light responsive; while CeO2 is ultraviolet responsive photocatalysts.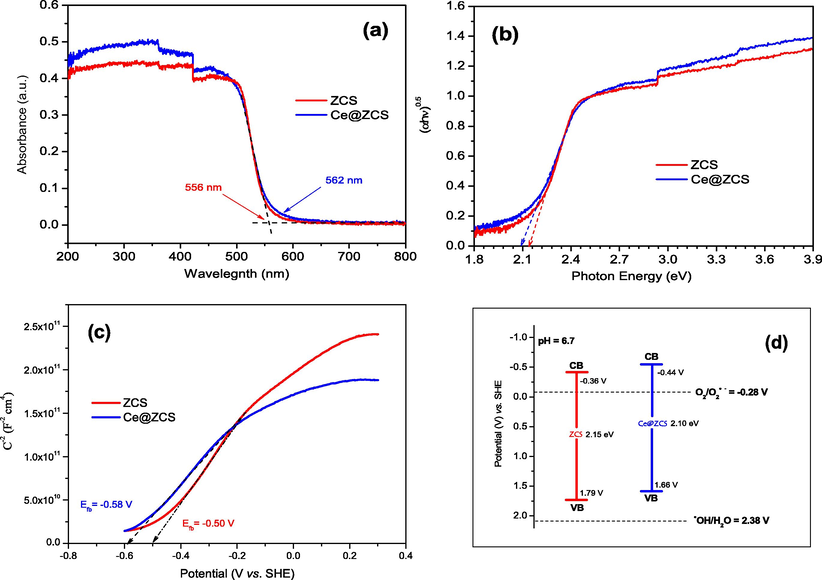
(a) UV-DRS spectra; (b) Tauc plots; (c) Mott-Schottky plots; (d) band potentials.
Furthermore, Mott-Schottky curves were measured to estimate the band potentials (Figs. 4c & S1e (seeing SI)), which can be taken as a reference for Fermi level of the semiconductor (Hua et al., 2019). Their conduction band (CB) potentials were calculated using the given Eq. (1).
Besides, Fig. 5a shows the electrochemical impedance spectroscopy (EIS), and the inset represents a simulated equivalent electric circuit (EEC). The EEC consists of a charge-transfer resistance (Rct), electrolyte resistance (Rs), constant phase angle element (CPE), and a Warburg impedance (W) (Abideen and Teng, 2019). The Rct values of ZCS and Ce@ZCS are 2.71 and 2.23 Ω, respectively. The lower Rct value of Ce@ZCS indicates the faster electron transfer rate. Furthermore, the photocurrent spectrum is used to investigate charge transfer efficiency (Abideen and Teng, 2019). Observed from Fig. 5b, while turning on light (λ ≥ 420 nm), Ce@ZCS shows a higher photocurrent than ZCS; after turning off, the photocurrent of Ce@ZCS slowly decays to the baseline, indicating an improved charge separation, compared with ZCS. The charge transfer behaviour was further investigated by surface photo-voltage (SPV), as shown in Fig. 5c. For both samples, only positive signals have appeared, indicating that holes (h+) mainly transfer to the irradiation surface, but not electrons (e−). While compared with ZCS, Ce@ZCS possesses an intense signal, which indicates more holes (h+) are generated, separated and transported to the irradiation surface.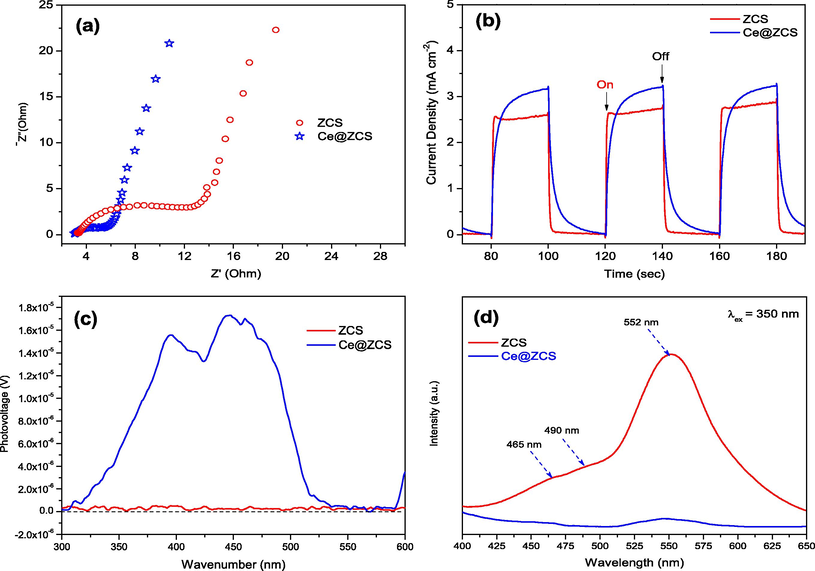
(a) EIS spectra; (b) Photocurrent spectra under visible light irradiation (λ ≥ 420 nm) ; (c) SPV; (d) PL spectra (λ ex = 350 nm).
Furthermore, the steady-state photoluminescence spectroscopy (PL) at λex = 350 nm was measured to understand the charge recombination efficiency (Fig. 5d). The weak emission peaks at nearly 465 and 490 nm may be associated to the surface states of ZCS; while a peak emission at near 552 nm could result from the band gap emission (Abideen and Teng, 2019). Compared Ce@ZCS with ZCS, the fairly low PL intensity suggests a low charge recombination efficiency (Xu et al., 2016).
3.3 Photocatalytic performances
The photocatalytic activities of the samples are evaluated by degradation of MB under visible-light irradiation (λ ≥ 420 nm), as shown in Fig. 6a and b. After degradation for 100 min, 58% and 87% MB was degraded by ZCS and Ce@ZCS, respectively; indicating a higher photocatalytic activity of Ce@ZCS. The degradation reaction can be simplified by a pseudo-first order reaction kinetics as follows (Eq. (2)).
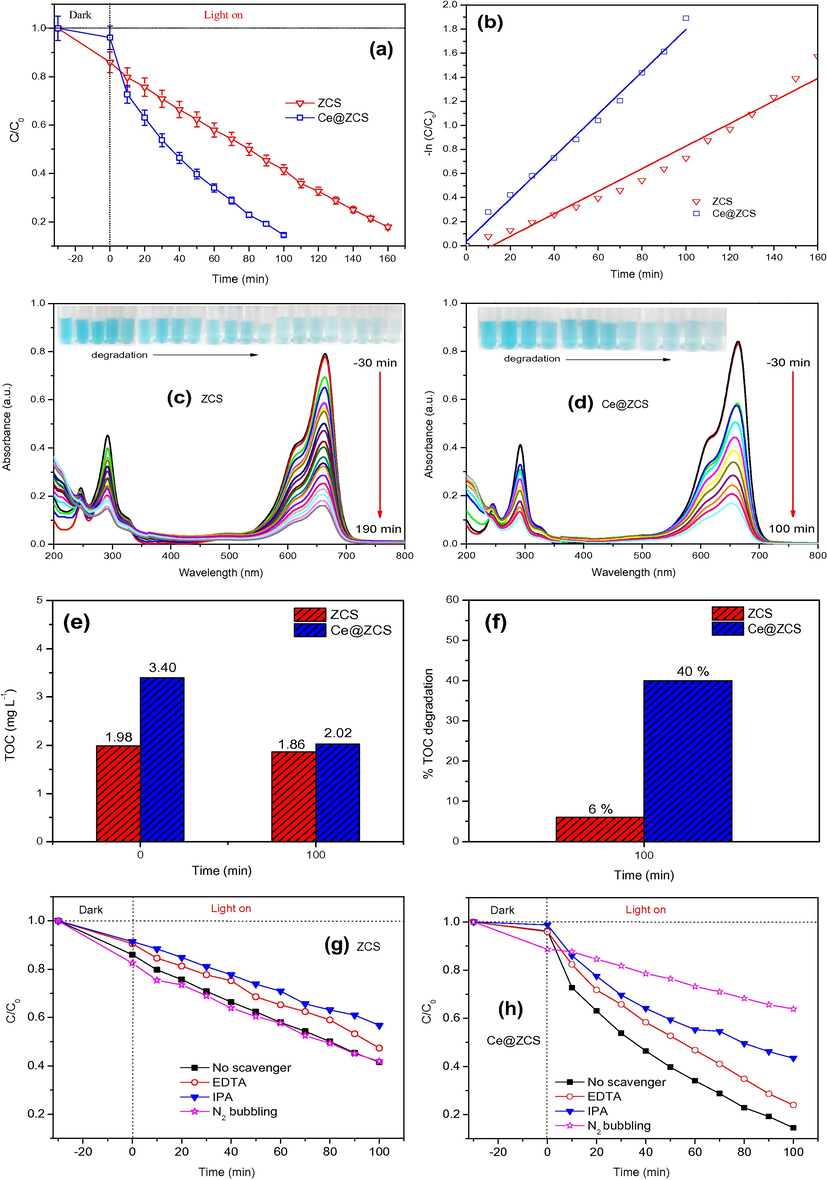
(a) Degradation curves; (b) apparent reaction kinetic curves; (c, d) absorption spectra of MB at different time intervals; (e, f) total organic carbon (TOC) plots; (g, h) trapping experiments under visible light irradiation (λ ≥ 420 nm).
Besides, the trapping experiments were used to investigate the active oxidative species involved in photocatalytic reaction. As shown in Fig. 6g and h, the addition of IPA evidently decreases the activities of both ZCS and Ce@ZCS, and the addition of EDTA also decreases their activities. For the as-obtained samples by chemical method, the defects are not avoidable. The present defects are easy to capture the excited electrons, refraining the formation of O2•− (Abideen and Teng, 2019). For Ce@ZCS, the photocatalytic activity significantly decreases in N2 environment, indicating that O2•− is a major oxidative specie in photocatalytic reaction. Nevertheless, the activity of ZCS does not decrease in the presence of N2, suggesting that O2•− is not the major active oxidative species. To summary, for Ce@ZCS, O2•− is major oxidative specie, while both the h+ and •OH also play an important role in the degradation reaction.
Additionally, Fig. 7a and e shows that after three cycles, 58%, 51% and 49% of MB were degraded by ZCS after 100 min, respectively; while 87%, 80% and 73% of MB by Ce@ZCS. After cycles, the crystal phase and morphology have not changed for both samples (Fig. 7). Hence, we could think that the slightly larger decrease for Ce@ZCS may be due to the flowing away of the supported nanoparticles, which is a common phenomenon for a supported catalyst (Jin et al., 2016). These results indicate that Ce@ZCS is photostable and reusable in photocatalysis.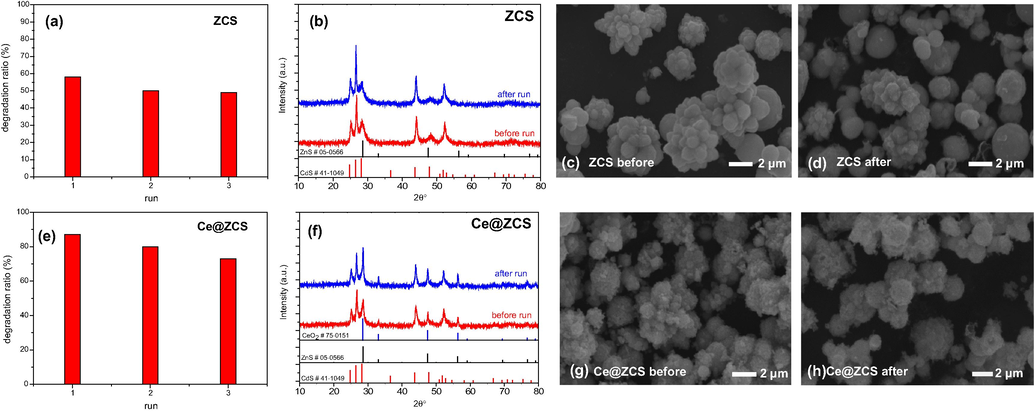
(a, e) Degradation ratios (%) of MB; (b, f) XRD patterns; (c, d, g, h) SEM images before and after three runs: reaction for 100 min under visible light irradiation (λ ≥ 420 nm).
3.4 Plausible photocatalytic mechanism
A plausible photocatalytic mechanism over Ce@ZCS is presented in Scheme 1. A heterojunction forms between CeO2 and ZCS, which can improve the charge separation. Herein, CeO2 cannot be excited by visible light because of a wide band gap (3.10 eV), but ZCS with a preferable narrow band gap (2.15 eV) can easily absorb visible light, and the photogenerated e− can generate, as presented in the given Eq. (3):
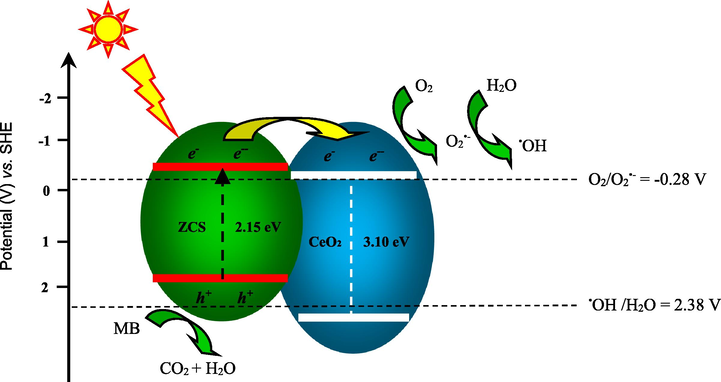
Plausible photocatalytic mechanism.
Under visible light irradiation (λ ≥ 420 nm), e− can be excited from the VB to the CB of ZCS, and h+ is remained in VB. The CB of ZCS (−0.36 V vs. SHE (standard hydrogen electrode)) is negative more than the redox potential of O2/O2•− (−0.28 V vs. SHE) (Li et al., 2011a; Xu et al., 2016), which suggests that the photogenerated electrons have a strong reductive ability and they can reduce surface absorbed O2 into O2•−, and then the other active species (HO2• or •OH) can also be generated in the following reactions (4)–(8):
Nevertheless, the VB potential of Ce@ZCS (1.79 V vs. SHE), which is not able to oxidize the OH− to form •OH radicals (•OH/OH− 2.38 V vs. SHE) (Li et al., 2011b), but the photogenerated h+ can directly oxidize MB into H2O and CO2. Additionally, since the CB potential of CeO2 (−0.29 V vs. SHE) is lower than CB of ZCS (−0.36 V vs. SHE), CeO2 can efficiently accept, transfer and store the photogenerated e− from the CB of ZCS, these stored e− may easily transfer to adsorbed O2 to form O2•−, then O2•− can combine with H+/H2O to form •OH. Herein, we think that the facile Ce (IV)/Ce (III) cycle can benefits the e− transfer (Scheme 1). Besides, the higher BET surface areas (∼2 m2 g−1) of Ce@ZCS also favours for the activity, compared with ZCS (∼0.4 m2 g−1).
4 Conclusions
In summary, a new Ce@ZCS heterostructure can be synthesized successfully via a simple two-step hydrothermal method. Under visible light irradiation (λ ≥ 420 nm), Ce@ZCS shown a 1.9 times photoactivity as high as ZCS for the degradation of MB. The enhanced activity is mainly due to the promoted electron transfer by the facile Ce(IV)/Ce(III) cycle. The excited electrons of ZCS is easy to transfer to CeO2, thus obviously increasing the charge separation of ZCS. The accepted electrons by CeO2 may easily be captured by the adsorbed O2 to form O2•−, and then O2•− could combine with H+/H2O to form HO2•, •OH. Finally, MB molecules are degraded by these active oxidation species. Moreover, Ce@ZCS maintains a high stability after three cycles. The efficient visible-light Ce@ZCS photocatalyst could be promising to be applied for practical waste water treatment.
Acknowledgements
This work is financially supported by National Science Foundation of China (21377060), the Project of Science and Technology Infrastructure of Jiangsu (BM201380277), Jiangsu Province Graduate Training Innovation Project (SJCX17_0262, SJZZ16_0153, KYCX17_0894, KYCX17_0895), Jiangsu Province Undergraduate Practice and Innovation Project (201810300043Z, 201810300240).
References
- Enhanced photochemical activity and stability of ZnS by a simple alkaline treatment approach. CrystEngComm.. 2018;20:7866-7879.
- [Google Scholar]
- Effect of alkaline treatment on photochemical activity and stability of Zn0.3Cd0.7S. Appl. Surf. Sci.. 2019;465:459-469.
- [Google Scholar]
- Synthesis of uniform CdS nanospheres/graphene hybrid nanocomposites and their application as visible light photocatalyst for selective reduction of nitro organics in water. ACS Appl. Mater. Interfaces.. 2013;5:4309-4319.
- [Google Scholar]
- In situ synthesis of V4+ and Ce3+ self-doped BiVO4/CeO2 heterostructured nanocomposites with high surface areas and enhanced visible-light photocatalytic activity. J. Phys. Chem. C.. 2016;120:18548-18559.
- [Google Scholar]
- Inorganic-organic hybrid NiO-g-C3N4 photocatalyst for efficient methylene blue degradation using visible light. RSC Adv.. 2014;4:22491-22496.
- [Google Scholar]
- Characterisation of textile wastewaters-a review. Environ. Technol.. 1994;15:917-929.
- [Google Scholar]
- Nitrogen and copper doped solar light active TiO2 photocatalysts for water decontamination. Appl. Catal. B Environ.. 2013;130–131:8-13.
- [Google Scholar]
- Electrochemical photolysis of water at a semiconductor electrode. Nature. 1972;238:37-38.
- [Google Scholar]
- A friendly environmental material: Iron oxide dispersed over activated carbon from coffee husk for organic pollutants removal. J. Environ. Manage.. 2013;127:206-211.
- [Google Scholar]
- Investigation on the different photocatalytic properties of bismuths oxychlorides: Bi12O15Cl6 versus Bi3O4Cl versus BiOCl. ChemistrySelect.. 2018;3:10721-10726.
- [Google Scholar]
- Butterfly wings as natural photonic crystal scaffolds for controllable assembly of CdS nanoparticles. J. Mater. Chem.. 2009;19:8741-8746.
- [Google Scholar]
- Highly efficient p-type Cu3 P/n-type g-C3N4 photocatalyst through Z-scheme charge transfer route. Appl. Catal. B Environ.. 2019;240:253-261.
- [Google Scholar]
- Hollow ZnxCd1-xS nanospheres with enhanced photocatalytic activity under visible light. Sci. Rep.. 2016;6:29997.
- [Google Scholar]
- CdS/regenerated cellulose nanocomposite films for highly efficient photocatalytic H2 production under visible light irradiation. J. Phys. Chem. C.. 2009;113:16021-16026.
- [Google Scholar]
- Mechanistic study of the unusual catalytic properties of a new Ni–Ce mixed oxide for the CO2 reforming of methane. J. Catal.. 2007;247:101-111.
- [Google Scholar]
- Highly efficient visible-light-driven photocatalytic hydrogen production of CdS-cluster-decorated graphene nanosheets. J. Am. Chem. Soc.. 2011;133:10878-10884.
- [Google Scholar]
- Novel approach to enhance photosensitized degradation of rhodamine B under visible light irradiation by the ZnxCd1-xS/TiO2 nanocomposites. Environ. Sci. Technol.. 2011;45:2987-2993.
- [Google Scholar]
- Mesostructured CeO2/g-C3N4 nanocomposites: Remarkably enhanced photocatalytic activity for CO2 reduction by mutual component activations. Nano Energy. 2016;19:145-155.
- [Google Scholar]
- Photocatalytic H2 evolution under visible light irradiation on a novel CdxCuyZn1-x-yS catalyst. Catal. Commun.. 2008;9:126-130.
- [Google Scholar]
- Carbon nitride for the selective oxidation of aromatic alcohols in water under visible light. ChemSusChem.. 2013;6:2074-2078.
- [Google Scholar]
- A high performance cobalt-doped ZnO visible light photocatalyst and its photogenerated charge transfer properties. Nano Res.. 2011;4:1144-1152.
- [Google Scholar]
- Controlled assemble of oxygen vacant CeO2@Bi2WO6 hollow magnetic microcapsule heterostructures for visible-light photocatalytic activity. Chem. Eng. J.. 2017;330:1297-1305.
- [Google Scholar]
- Nakamoto, K., 2008. Infrared and Raman Spectra of Inorganic and Coordination Compounds: Part A: Theory and Applications in Inorganic Chemistry, sixth ed., pp. 1–419.
- Direct growth of carbon nanotubes on Ni/TiO2 as next generation catalysts for photoreduction of CO2 to methane by water under visible light irradiation. RSC Adv.. 2013;3:4505-4509.
- [Google Scholar]
- Highly reactive 001 facets of TiO2-based composites: synthesis, formation mechanism and characterization. Nanoscale. 2014;6:1946-2008.
- [Google Scholar]
- Zn1−xCdxS solid solutions with controlled bandgap and enhanced visible-light photocatalytic H2 production activity. ACS Catal.. 2013;3:882-889.
- [Google Scholar]
- Size effects on the photophysical properties of colloidal anatase TiO2 particles: size quantization versus direct transitions in this indirect semiconductor? J. Phys. Chem.. 1995;99:16646-16654.
- [Google Scholar]
- Reporting Physisorption Data for Gas/Solid Systems, with special reference to the determination of surface area and porosity. Pure Appl. Chem.. 1985;57:603-619.
- [Google Scholar]
- Mechanism of the photocatalytic degradation of C.I. reactive black 5 at pH 12.0 using SrTiO3/CeO2 as the catalyst. Environ. Sci. Technol.. 2007;41:5846-5853.
- [Google Scholar]
- Band gap engineered, oxygen-rich TiO2 for visible light induced photocatalytic reduction of CO2. Chem. Commun.. 2014;50:6923-6926.
- [Google Scholar]
- Effect of surface defect states on valence band and charge separation and transfer efficiency. Sci. Rep.. 2016;6:32574.
- [Google Scholar]
- Novel reduced graphene oxide-supported Cd0.5Zn0.5S/g-C3N4 Z-scheme heterojunction photocatalyst for enhanced hydrogen evolution. Appl. Surf. Sci.. 2018;447:783-794.
- [Google Scholar]
- Visible-light-driven hydrogen production with extremely high quantum efficiency on Pt-PdS/CdS photocatalyst. J. Catal.. 2009;266:165-168.
- [Google Scholar]
- Biological technologies for the remediation of co-contaminated soil. Crit. Rev. Biotechnol.. 2017;37:1062-1076.
- [Google Scholar]
- Co-occurrence and interactions of pollutants, and their impacts on soil remediation—a review. Crit. Rev. Env. Sci. Tec.. 2017;47:1528-1553.
- [Google Scholar]
- The effects of activated biochar addition on remediation efficiency of co-composting with contaminated wetland soil. Resour. Conserv. Recy.. 2019;140:278-285.
- [Google Scholar]
- Facile assembled biochar-based nanocomposite with improved graphitization for efficient photocatalytic activity driven by visible light. Appl. Catal. B-Environ.. 2019;250:78-88.
- [Google Scholar]
- TiO2/montmorillonite nanocomposite for removal of organic pollutant. Appl. Clay Sci.. 2011;53:272-278.
- [Google Scholar]
- A facile one-step synthesis of TiO2/graphene composites for photodegradation of methyl orange. Nano Res.. 2011;4:274-283.
- [Google Scholar]
- Hierarchically grown CdS/α-Fe2O3 heterojunction nanocomposites with enhanced visible-light-driven photocatalytic performance. Dalt. Trans.. 2013;42:13417-13424.
- [Google Scholar]
- A novel 2D porous print fabric-like α-Fe2O3 sheet with high performance as the anode material for lithium-ion battery. Electrochim. Acta.. 2016;212:912-920.
- [Google Scholar]
- CeO2/Bi2WO6 heterostructured microsphere with excellent visible-light-driven photocatalytic performance for degradation of tetracycline hydrochloride. Photochem. Photobiol.. 2017;93:1154-1164.
- [Google Scholar]
- Enhanced photocatalytic activity for hydrogen evolution from water by Zn0.5Cd0.5S/WS2 heterostructure. Mater. Sci. Semicond. Process.. 2017;59:68-75.
- [Google Scholar]
- Synergistic effect of Fe2O3 and CeO2 co-modified titanate nanosheet heterojunction on enhanced photocatalytic degradation. J. Nanoparticle Res.. 2017;19:325.
- [Google Scholar]
- Photocatalytic H2 evolution on MoS2/CdS catalysts under visible light irradiation. J. Phys. Chem. C. 2010;114:1963-1968.
- [Google Scholar]
Appendix A
Supplementary material
Supplementary data to this article can be found online at https://doi.org/10.1016/j.arabjc.2019.06.013.
Appendix A
Supplementary material
The following are the Supplementary data to this article:Supplementary data 1
Supplementary data 1


