

Translate this page into:
Enhancing temperature cycle-induced deracemization via combined cooling and antisolvent crystallization: A proof of concept study
⁎Corresponding author. szilagyi.botond@vbk.bme.hu (Botond Szilágyi)
-
Received: ,
Accepted: ,
This article was originally published by Elsevier and was migrated to Scientific Scholar after the change of Publisher.
Peer review under responsibility of King Saud University. Production and hosting by Elsevier.
Abstract
This study investigates the enhancement possibilities of the temperature cycle-induced deracemization (TCID) process by solubility adjustments through solvent system compositions. The research hypothesizes that combined cooling and antisolvent crystallization (CCAS) can accelerate the deracemization through two effect. Firstly, the higher solubility at the beginning of the process ensures that the concentrations are raised, which translates to higher racemization reaction productivity. Secondly, well-chosen antisolvent dosing can reduce the solubility (hence, increase the solid loading) in line with the progression of deracemization. This means that the solid phase’s enantiomeric excess (EE) remains relatively high throughout the process, a condition known to accelerate deracemization. The concept is tested in TCID experiments at different solvent system compositions, indicating that higher solubility increases the apparent deracemization rate, partly at the expense of yield. The CCAS experiment revealed that the yield and the product’s EE could be improved simultaneously. The case study analyzed the glutamic acid (Glu) deracemization in the presence of the salicylaldehyde catalyst, using water as the solvent and acetic acid (AA) as the antisolvent. Comprehensive solubility measurements that enabled the design of experiments are also a part of this study.
Keywords
Deracemization
Cooling and antisolvent crystallization
Temperature cycling
Solubility
Enantiomers

1 Introduction
The problem of adverse biological effects of enantiomers got into the middle of attention in the mid-20th century by the Thalidomide tragedy (Kim & Scialli, 2011). The (R) enantiomer of the molecule delivered the desired sedative, whereas – as it turned out later - the (S)-enantiomer harbored embryo-toxic and teratogenic effects (Tokunaga et al., 2018). Since then, ensuring high enantio-purity in active pharmaceutical ingredients (APIs) has become paramount (Calcaterra & D’Acquarica, 2018; Nguyen et al., 2006).
Methods to obtain enantio-pure compounds can be divided into two major groups: stereoselective synthesis of the target molecule and separation of the target enantiomer from its racemic mixture (Ingole et al., 2016; Jacques et al., 1994). The former is often realized via biocatalytic processes or stereoselective organic catalysis. The widely used separations are chiral chromatography and diastereomeric salt formation (Faigl et al., 2008; Patil et al., 2013). Each method has advantages and disadvantages from a fundamental and economic perspective. The diastereomer formation and crystallization route has a long history (Kozma, 2001). It is relatively cheap and scalable, although a specific conformer must be used for the separation. Furthermore, the enantiomer of interest must be freed from its salt. Recently, techniques were proposed to utilize stereoselective co-crystallization, which can be used directly in drug products (Harmsen & Leyssens, 2018). However, even in these pleasant situations when the last step can be avoided, the global yield is limited as half of the material (the undesired enantiomer) is lost. Despite being a single-step process, in lack of a racemization reaction, the same thermodynamic yield limitation also applies to the induced preferential crystallization of enantiomers (Levilain and Coquerel, 2010).
Viedma presented the first experimental case where total symmetry breaking and complete chiral purity was achieved from a system where crystals of both enantiomers were present since the beginning (Viedma, 2005). This was achieved for sodium chlorate, whose crystals are optically active although the molecules of the compound are not chiral. Shortly after this discovery, the complete symmetry breaking was realized on a genuine chiral system in an attrition-enhanced deracemization and published (Noorduin et al., 2008). This was shown to be resulting from preferential crystallization of conglomerates coupled with a liquid-state racemization reaction, which allows the complete deracemization of racemic mixtures in a process also referred to as second-order asymmetric transformation (SOAT) of enantiomers. This is usually carried out in a temperature cycle-induced deracemization (TCID) (Aiba et al., 2016; Suwannasang et al., 2013), a convenient process intensification (Li et al., 2016). If the racemization rate is fast, complete deracemization can be achieved in a well-designed cooling-only crystallization, as the compound of interest is quickly regenerated by the racemization (Oketani et al., 2019). The TCID was analyzed thoroughly by experimental and process modeling approaches (Bodák et al., 2018). Alternative techniques were developed that included microwave heating for faster overall deracemization (Cameli et al., 2018) and integrated wet-milling for intensified fine particle production – known to accelerate the deracemization (Köllges & Vetter, 2017; Kovács & Szilágyi, 2023). The application of continuous crystallization also has great potential, which, in a coupled configuration, can separate the conglomerate-forming enantiomers simultaneously (Elsner et al., 2009). Continuous tubular crystallizers were proposed as well (Majumder, 2018).
A recent study overviewed, analyzed, and ranked the influence of kinetic and process parameters on the deracemization in a SOAT process (Kovács & Szilágyi, 2023). The calculations reinforced that the enantiomer excess of the solid phase is a key driver: the higher the solid phase purity creates more asymmetry in the solution during the stereoselective crystallization. This leads to faster overall racemization. However, the analyses revealed that the most significant driver was the racemization rate. Faster racemization can be achieved, amongst others, by proper catalyst selection (Ando & Emoto, 1978) or working at higher temperatures (Oketani et al., 2019). In the simplest case, the solvent selection may also intervene through the solubility: higher solubility increases the overall solute concentration. This increases the amount of the target enantiomer that can be crystallized selectively, which the racemization reaction may produce or reproduce from the counter-enantiomer. Notwithstanding, excessive solubility may be undesired as well as it may hamper the yield. This discussion projects that comprehensive crystallization systems engineering via combined cooling and antisolvent (CCAS) crystallization may unlock a chunk of yet unexploited potential of TCID.
Despite its high potential, only a handful of studies considered antisolvent crystallization for this problem. A recent study proposed solvent cycling by repurposing a Soxhlet apparatus (van Dongen et al., 2023). This follows the logic of the TCID but is realized via solvent composition changes rather than altering the temperatures. By that, it allows faster switches between the cycles of growth and dissolution. Another work investigated the effect of antisolvent addition on the dominant nucleation mechanisms. The unexpected conclusion was that the secondary nucleation was dominant rather than the primary nucleation (Hoffmann et al., 2022). This is promising for deracemization as the secondary nucleation is stereoselective, meaning that crystals of one enantiomer will reproduce their own conglomerates. A Ph.D. thesis discussed the continuous chiral resolutions, which also oversee the antisolvent crystallization (Hoffmann, 2020). However, a work that would have explored and exploited the benefits of CCAS in an easily scalable way could not be identified.
This study analyzes the opportunities CCAS offers to enhance the TCID-aided SOAT. The results are presented through the case study of deracemization of L-glutamic acid in the presence of salicylaldehyde racemization catalyst in acetic acid (AA) antisolvent and water solvent. The determination and modeling of solubility as a temperature and solvent composition function is presented. The TCID experiments were built on data from the literature (Cameli et al., 2018), which also allowed the validation of our experimental procedure. The validation is followed by designing and executing CCAS to improve the yield and the product’s enantiomer purity simultaneously. The paper is concluded with a high-level overview of the results and discussion of future perspectives.
2 Materials and methods
The chemistry of deracemization is presented in Scheme 1, and it can be described as follows. The process is initiated from a high-temperature, saturated racemic mixture containing a relatively large amount of solids with a well-specified excess of L-Glu. Both enantiomers are crystallized during the cooling, but due to excess, the L-Glu crystallizes faster, creating an excess of D-Glu in the liquid phase. The racemization reaction joins at this point, transforming the D-Glu to L-Glu in the solution until a racemic composition is reached again. This contributes to the further enrichment of L-Glu in the solid phase. A cyclic operation, e.g., partial dissolution and repeating the previous events, can further enrich the desired enantiomer in the solid phase.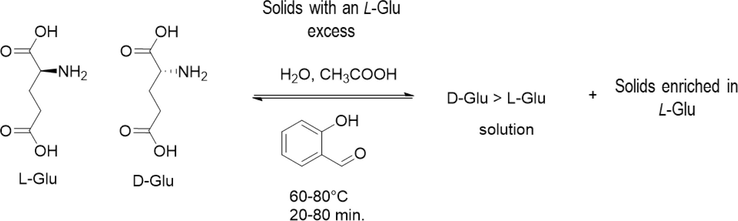
High-level summary of the chemistry of the deracemization process.
It is noteworthy that at conditions close to those listed in Scheme 1 (90 °C, 2–3 days, AA solvent and salicylaldehyde), it was reported that an anhydrous conglomerate is formed, which appears to be stable under those conditions. Since this cannot be deracemized, driving the process at excessively high temperatures may hamper the EE, which may be considered when designing the experiments and interpreting the results (Spix et al., 2012). At this stage, one may realize that DL-Glu notation may technically refer to the racemic conglomerate, and the racemic mixture of DL-Glu and L-Glu conglomerate crystals may be noted as (D-Glu + L-Glu). However, for the sake of simplicity, we will refer to the racemic mixture of conglomerate crystals as DL-Glu.
The experimental rig and methods were adjusted to serve the deracemization presented in Scheme 1. The deracemization experiments were executed in a jacketed glass crystallizer having a 0.5 L nominal volume (Schmizo, Switzerland). The temperature was controlled using a Huber Ministat 125 thermostat with a PT100 thermometer with a B accuracy class. External temperature control was applied using an in-house developed LabView-based software. Antisolvent was fed with a Syrris Asia syringe pump. The product PSD was determined with a Malvern Mastersizer 2000 using the dry head and 2.5 bar dispersion pressure. All solid samples were filtered with a vacuum filter and washed with 3 mL of cold water (7 °C). Washing was applied to remove the impurity (catalyst) and prevent agglomeration of particles within the cake by eliminating the supersaturated solution from the cake. The samples were dried at 70 °C for 12 h. The product and intermediate samples’ enantiomer excess (EE) was determined by their optical rotation, which was measured using a Perkin-Elmer 241 polarimeter in a 10 cm cell. Analyzing intermediate samples may be truncated with sampling errors, as the relatively small sample volume can cool down and crystallize. These sampling errors are expected to be higher as the solubility is higher. The glass filter was pre-heated to minimize this undesired crystallization, and the sampling and filtration were carried out as fast as possible. Offline microscope images of the product crystals were recorded with an Olympus CKX53 inverted microscope equipped with an 18Mp CAM-SC180 Camera set.
A possible racemization mechanism is presented in Scheme 2, described as follows. D-Glu and salicylaldehyde (SA) react (with the release of water). A 1–4 conjugated, non-chiral isomer is formed by proton migration, which is transformed into a racemic compound under the influence of a proton (Yamada et al., 1983).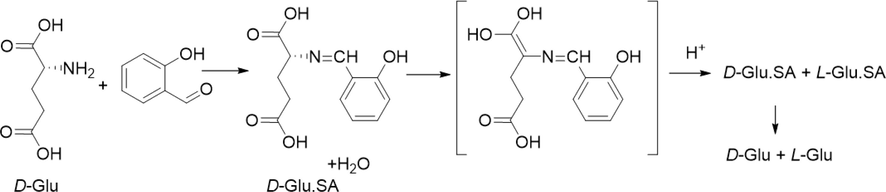
A potential mechanism of the catalyzed racemization reaction. The salicylaldehyde (SA) acts as a catalyst.
The glutamic acid may undergo a condensation reaction in acidic media at higher temperatures to pyroglutamic acid (Spix et al., 2012). Pyroglutamic acid has a higher solubility than glutamic acid; therefore, the chemical purity is not hampered. However, this side reaction can jeopardize the yield, which should be forced back for economic reasons by choosing the appropriate operating conditions that favor the main reaction over the side reaction.
Choosing the appropriate conditions is complex and everything but trivial, as the racemization reaction competes with one or more, usually heat-sensitive reactions. Kinetic control may lead to desired results for the systems mentioned above under well-chosen conditions. For showcasing purposes, let us consider the global racemization rate equation (
, Eq.1, taken from the literature (Bodák et al., 2018)). Let us assume that a decomposition reaction (
, Eq. (1)) has a 20 % higher activation energy. To mimic the behavior that the side reaction becomes significant over 90 °C, the rate constant of the side reaction is set, such as the reaction rates at
(enantiopure solution) equals each other at 90 °C. The chosen activation energies imply that over 90 °C the side-reaction is globally faster, and under that temperature for enantiopure solution, the racemization.
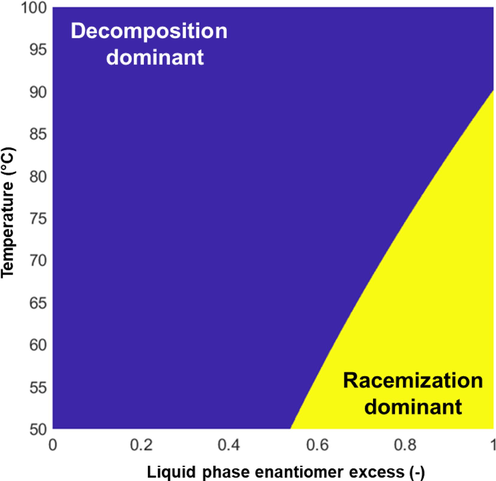
Zones of kinetic control. The figure is for illustration, not validated for the glutamic acid system.
De-ionized water (prepared in-house) was used in all experiments as the solvent, and AA glacier (Sigma-Aldrich, purity > 99.7 %) as the antisolvent. Anhydrous L-Glu was acquired from Sigma Aldrich (HPLC grade > 99 %), and DL-Glu monohydrate was purchased from Sigma-Aldrich (HPLC grade > 98 %). Salicylaldehyde (Sigma Aldrich, GC > 99 %) was used as a racemization catalyst. The crystals were used without sieving in all racemization experiments. All materials were dosed on a weight basis using a Sartorius BP 121S balance for the solids (4-digit accuracy) and a Sartorius CP622-OCE balance for measuring the liquids (2-digit accuracy).
2.1 Solubility measurements and modeling
The solubilities were determined using the thermodynamic method as follows. The suspension was kept at the desired temperature for at least two hours, and then a 5–10 mL sample was taken from the supernatant. The sample was filtered quickly with a PTFE syringe filter. It was assumed that the concentration of this sample corresponds to the solubility at the given temperature. The solute concentration was determined with the thermogravimetric method. Three samples were taken at each sampling point (temperature, solvent), and the mean values and standard deviations are reported as the solubility data. The solubility of L-Glu was determined in a wide temperature (20–80 °C) and AA: water ratio (0–100 %). A combined cooling and antisolvent solubility model was fitted on the measured data in CrySiV software to determine a temperature (
, in Kelvin) and solvent composition (
, expressing the weight fraction of AA within the solvent system) dependent solubility of the enantiopure Glu (
, expressed in weight fraction). The solubility model equation that minimized the sum of absolute deviations between the measured and simulated solubilities with reasonable parameter confidence intervals was the following:
where
are system-specific solubility constants. Since the measured solubilities span a broad domain and the solubility model parameters were fitted using the mean squared error objective, systematic inaccuracies are expected to appear in the small solubility values. This is an inherent limitation of the absolute error-based regression that weights for the larger nominal values, resulting in a large relative deviation in the low nominal solubilities. To compensate for this range-dependent bias, a polynomial correction was introduced:
This empirical correction appeared to be sufficiently flexible to keep the high solubility ranges unchanged but not prone to over-fitting in the low solubility range.
Then, the solubility of racemic DL-Glu was determined in five distinct points of the 30–80 °C temperature and 0–100 % AA: water solvent composition domain, with points taken according to a two-level full factorial experimental design with a center point. Ternary phase diagrams should be utilized for fundamentally correct solubility modeling for enantiomers. However, it was observed that simpler empirical equations could be applied to certain systems (Eicke et al., 2013; Petruševska-Seebach et al., 2011). For the sake of simplicity, we implemented the empirical model from the literature (Petruševska-Seebach et al., 2011), which allowed us to determine the effect of counter-enantiomer concentration (
) on the solubility of enantiomer
(
) as:
where is a parameter characterizing the system.
2.2 Temperature cycling and the cooling crystallization experiments
Deracemization experiments were carried out in the 0.5 L reactor using a temperature cycling strategy from the literature, which implements the temperature profile presented in Fig. 2. After the desired number of temperature cycles were executed, the system was cooled from 60 to 20 °C at 10 °C/h. The slurry was kept at 20 °C for an hour before filtration for equilibration. The filtered slurry was washed with 10 mL of cold (∼5 °C), de-ionized water, then dried at 80 °C for three hours.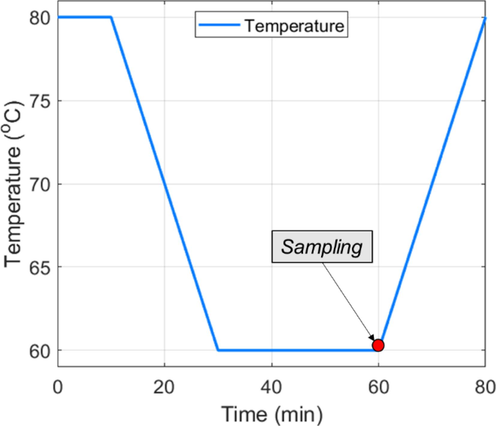
The temperature cycle was taken from the literature (Cameli et al., 2018). In some experiments, the temperature range was altered, but the durations of cooling, heating, and hold stages remained unchanged.
2.3 Antisolvent addition strategy
The antisolvent addition has multiple goals here:
-
Numerous pharmaceutical and fine chemical compounds are heat-sensitive and cannot be crystallized at high temperatures. In a cooling crystallization, this would delimit the yield. Antisolent crystallization, or CCAS is frequently used as it can improve the yield significantly while preventing thermal decomposition by operating in the low-temperature domains.
-
Antisolvent addition results in supersaturation generation and, subsequently, in crystallization by decreasing the solubility. If the antisolvent addition rate is synchronized with the racemization rate, the amount of solids increases without hampering the solid phase EE and altering the temperature range. According to the conceptual map of Fig. 1, this can be highly beneficial for the TCID.
-
Meanwhile, during a reasonable antisolvent feeding rate, the high solid EE promotes the deracemization rate, and the solute concentrations are declining due to declining solubilities, which, if there may be liquid-phase side reactions/decompositions, their rates are decreased proportionally with the solubility as well.
In this work, the antisolvent was fed continuously throughout the process, with a flow rate that ensured that the total amount of antisolvent was dosed in the duration of
-3 T-cycles,
being the total number of T-cycles. It is not necessarily the optimal strategy, but it seems a reasonable extension of the TCID investigated so far. The total amount was calculated for yield maximization: the antisolvent volume that resulted in the minimal overall dissolved Glu was dosed. The function that describes the weight of dissolved material (
in the final solvent amount (
) at the final temperature (
) and solvent composition (
) can be written as:
where
is the solubility of the enantiomer
expressed in g/g of solvent. The conversion between the weight fraction and g/g of solvent units is described in the supporting information part of this paper. Assuming that the solvent system initially contained a mass of solvent
and antisolvent
, and that
antisolvent is fed during the process, the final solvent amount and the solvent composition can be determined easily:
With these conditions, an optimization problem can be formulated and solved as:
The optimal depends on the solute’s enantiomer composition. In equilibrium, this is expected to be the racemic composition. However, since immediately after the cooling stage, there may be an imbalance, we calculated the for the two extremes, i.e., enantio-pure liquid and racemic solution, and the average was taken. The optimization was solved with the Nelder-Mead algorithm by the fminsearch function of Matlab 2022b.
3 Results and discussions
3.1 Solubility of glutamic acid in mixtures of AA and water
The solubility measurements were performed using the thermodynamic method by keeping the suspension at the desired temperature for at least two hours, which was proven to be sufficient by analyzing the results of repeated samples taken after one, two, four, and twelve hours (overnight). Furthermore, the concentrations were determined using the thermogravimetric, which excludes any calibration or sample preparation errors. The measured data is in the supporting information part of this paper.
The solubility model regression was executed sequentially based on the experimental data in three steps, with the final parameters displayed in Table 1.
-
The solubility model parameters of Eq. (1) were determined using the solubility data of L-Glu in water-AA system. This was carried out in CrySiV’s solubility regression module.
-
In line with expectations, the solubilities were systematically overestimated in the low solubility range. Therefore, the Eq. (2) correction was applied. The empirical correction Eq. (2) applies for simulated solubilities exceeding 0.0008 wt fraction.
-
Using the corrected solubility model equation for the L-Glu, and the DL-Glu solubility measurements, the parameter of Eq. (3) describing the dependency of solubility on the concentration of counter-enantiomer was identified in Matlab.
| Parameter | Nominal value | 95 % confidence interval bounds | |
|---|---|---|---|
| Lower | Upper | ||
| −61.828 | −66.986 | −56.670 | |
| 12.847 | 12.129 | 13.566 | |
| 16.095 | 14.008 | 18.183 | |
| −18.603 | −20.829 | −16.376 | |
| 8.884 | 7.216 | 10.552 | |
| 744.741 | 577.895 | 911.587 | |
| −0.0008 | – | – | |
| 1.2417 | – | – | |
| −18.005 | – | – | |
| 470.89 | – | – | |
| −3973.9 | – | – | |
| 0.144 | 0.097 | 0.191 | |
The CCAS surface for the enantiopure and racemic Glu is depicted in Fig. 3a. The surface illustrates that the measured solubilities varied widely in the applied temperature and solvent system composition domain, from nearly zero to 150 mg/g solvent. The agreement between the measured and simulated points is revealed by the parity plot of Fig. 3b. The double logarithmic representation ensures that all points remain well visible. Noticeably, the solubilities of enantiopure and racemic data points align nicely on the diagonal without systematic error, indicating a success of the empirical Eq. (3). The quality of fit is underscored by the 0.998 correlation coefficient. Hence, the solubility model can be used to design the initial solvent and solute compotisions.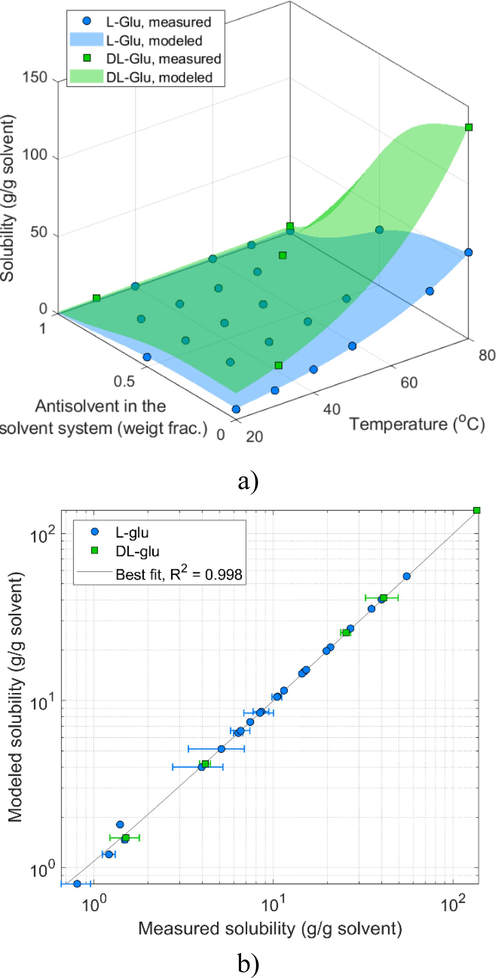
Measured and modeled solubility of L-Glu and DL-Glu: a) as a function of water-AA composition and temperature; b) the parity plot is free of systematic errors and it indicates an excellent correlation coefficient.
According to the measurements from the literature, the catalyst increased the solubility, which appeared to be more significant in the low-temperature domain – see the supporting information from (Cameli et al., 2018). Since the catalyst concentration was not varied, this was considered to cause a constant offset. It is to be mentioned that the pyroglutamic acid may also alter the solubilities, which was not investigated here.
3.2 Temperature cycling-induced deracemization
First, experiments were carried out in pure AA to validate experimental capabilities by reproducing published experimental data. Since these would not bring in new results, the validation experiments were moved to the supporting information part of this paper. Nevertheless, this experiment allowed us to make important practical conclusions regarding this case-study: (1) deracemization is a slow process, which is significantly faster if the initial EE is raised from 22 to 60 %; (2) the product weight is more than doubled when the time of the experiment is halved (case of 60 % initial EE experiment). Given these, one would expect to improve the overall recovery if the reaction time could be reduced. Reducing the batch time without compromising the deracemization may be accessible if the overall deracemization rate could be enhanced.
A simple route that does not involve a catalyst change or other techniques that would alter the racemization mechanism is to increase the racemization rate. Let us assume that the racemization rate of an enantiomer can be described with a first-order reaction kinetics, similar to Eq.(1):
where is an enantiomer and is the rate of transformation of an enantiomer to the other one. If one assumes that the rate constant is independent of the concentration, and if the temperature is constant, the reaction rate increases with the actual concentration ( ). The concentration is thermodynamically related to the solubility (although some deviation may occur due to kinetics of growth and dissolution; however, the super and undersaturation at these relatively large solid loads may not be significant, so the solubility is a good indication of the concentration conditions). Therefore, if the solubility increases, the actual concentrations also increase, translating to faster racemization rates.
Since the experiments carried out at 22 % initial EE was substantially slower, the influence of solubility was investigated under these conditions. The duration of experiments was reduced to 21 T-cycles, which provides information about the slowest part of the experiments. With these in mind, two experiments were designed at 80 and 90 wt% of AA within the solvent system, as Table 2 lists. These resulted in significant solubility enhancement compared to pure AA (Table A1 (in the SI part of this paper)). * the salicylaldehyde slightly increases the solubility, which effect was neglected.
Exp. #3
90 % AAExp. #4
80 % AA
Amount of L-Glu weighted in
6.82
Amount of D-Glu weighted in
4.36
AA (g)
202.21
178.88
Water (g)
22.47
44.72
Dissolvable* L-Glu at
/
°C (g)
0.65 / 1.08
1.44 / 2.32
Dissolvable* DL-Glu at
/
°C (g)
1.49 / 2.48
3.32 / 5.38
Fig. 4 illustrates the evolution of EEs of solids throughout the experiments. There is a remarkable jump in the EEs in the first intermediate sample. However, this does not necessarily result from the deracemization: the crystals EE is also enriched by the partial dissolution of solids. In the sampling point (Fig. 2), the liquid may contain a nearly racemic composition, meaning that the 22 % initial EE of the solids weighted-in is enriched. The higher the solubility, the stronger this effect is. Nevertheless, deracemization triggers the EE increment observed between the two intermediate samples. This is 16.5 % EE for Experiment #3 and 12.1 % EE for Experiment #4. For better comparison, an apparent deracemization rate can be introduced as:
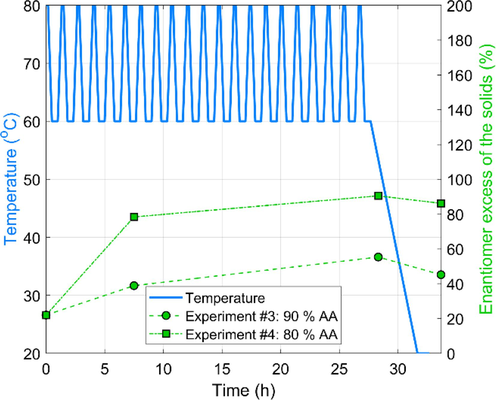
Effect of solvent composition on the evolution of solid EEs during the early stage of TCID experiments. The enantiomer excess scale goes to 200 % only for the layout. The physically realizable domain is the 0–100 %.
where, represent the average rate of gain in EE over a time. can be interpreted as the apparent deracemization rate under the action of the applied temperature cycles. Note that is linked to the cycle time and heating/cooling rates applied in this study. As in this study, offline EE determination was performed; we measured the over a that covers several T-cycles. In this context, those above 16.5 and 12.1 % EE gains translated to apparent deracemization rates of 0.97 and 0.58 EE/h. For reference, in the corresponding experiment executed in AA, was 0.0055 EE/h in the early, and 0.11 EE/h in the late stage. These figures underscore that the higher solute concentration results in faster overall deracemization.
An important motif is the EE decrease experienced in the product, compared to the sample taken at the end of temperature cycles at the lowest temperature of the T-cycle. This is explained as during the last cooling, a considerable amount of mixtures of enantiomers is crystallized, which hampers the enantio-purity. This could be prevented by executing the filtration at high temperatures, a trade-off at the expense of yield.
The weight of products recovered in experiments #3 and #4 is 5.73, respectively, 2.44 g. The deviation can be explained by the different solubilities (crystallization losses) and the side reaction (Scheme 3). Without further analyses, the accurate deconvolution of the effects is not possible.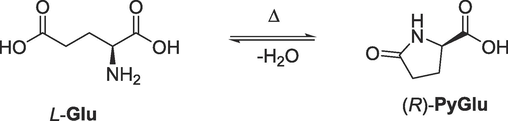
The condensation of L-Glu to pyroglutamic acid. The same reaction applies for the D-Glu as well. The reaction jeopardizes the yield of deracemization.
This last statement fueled our motivation to design another set of experiments involving the same number of temperature cycles but executed in the 50–70 °C temperature range, which, according to the map of Fig. 1, may favor the racemization over decomposition. Higher water concentrations were used within the solvent system (70 and 80 %) as a corresponding adjustment. The conditions are listed in Table 3. * the salicylaldehyde slightly increases the solubility, which effect was neglected.
Exp. #5
80 % AAExp. #6
70 % AA
AA (g)
202.21
178.88
Water (g)
22.47
44.72
/
(°C)
50 / 70
Dissolvable* L-Glu at
/
°C (g)
1.12 / 1.84
1.90 / 3.12
Dissolvable* DL-Glu at
/
°C (g)
2.56 / 4.26
4.39 / 7.26
Fig. 5 depicts the EE trends obtained in TCID experiments performed in a lower T-cycle range. Surprisingly, the intermediate sample’s EE was nearly 100 % for the experiment at 70 % AA solvent composition. A reasonable explanation is that at this solvent system composition, the high solubility caused the dissolution of the total amount of D-Glu, the remaining solid L-Glu was subsequently enantiopure. Hence, this high enantiopurity of the solid phase does not indicate successful deracemization; it results from high solubility. This is also underscored by the low amount of solid recovered in Experiment #6 (3.41 g) compared to the 6.93 g of Experiment # 5. Hence, it is useless to calculate the apparent deracemization rate for Experiment #6. Nevertheless, Experiment #5 was also performed under relatively high solubility conditions, translating to a relatively high 0.34 EE/h.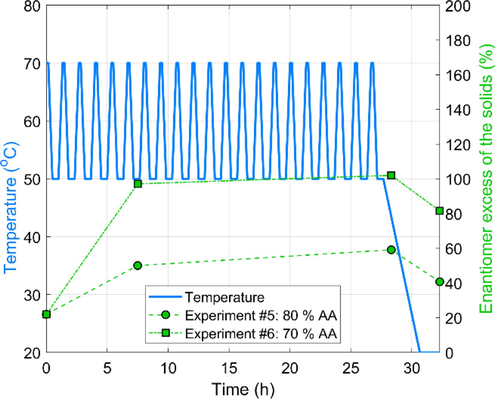
Effect of solvent composition on the evolution of solid EEs during the early stage of TCID experiments performed in lower temperature range and higher solvent to antisolvent ratio. The enantiomer excess scale goes to 200 % only for the layout. The physically realizable domain is the 0–100 %.
Experiments #4 and #5 can be investigated to elucidate the effects of temperature range on the processes. First and foremost, the product EE was more than doubled when the temperature cycling was executed in the higher temperature range (compare 86.2 and 40.7). However, a more dramatic difference is observed in the product weights, which are 2.44 and 6.93 g. There are no other thermodynamic explanations than the side reaction Scheme 3, which was also confirmed experimentally in the literature (Cameli et al., 2018).
Notably, in the preliminary experiments that also implied water for solubility enhancement, with batch times in the order of days and T-cycling in 60–80 °C, complete dissolution was observed sooner or later in all cases (as a function of water content and temperature). The observation is explained again with the reaction of Scheme 3, which transformed the lower solubility glutamic acid to the pyroglutamic acid having higher solubility. This is a shred of evidence that the conditions favoring deracemization also favor the side reaction.
4 Enhancing the process through CCAS
In theory, the CCAS operation, as described in Section 2.3, can enhance the deracemization without moving towards condition space that would favor jeopardizing the yield further by the side reaction. Experiment #6 was used as the basis of the CCAS process regarding initial concentrations and temperature profile. A total weight of 512 g AA, the average of optimums in Fig. 6a, was dosed with a constant flow rate throughout the first 18 T-cycles (Fig. 6b). The last three T-cycles were performed without feeding to allow time to consume and deposit the desired enantiomer on the crystals before the terminal cooling would begin. Fig. 6c and 6d illustrate the solubilities of the enantiopure glutamic acid and the racemic mixture, as well as the total amount that can be dissolved in the actual amount and composition of the solvent system. These figure underscores the limitation of antisolvent addition: even though the solubilities are decreasing as more antisolvent is dosed, the total amount of dissolvable solute weight shows a more modest decline as the increasing solvent system amount partly compensates for the decreasing solubility. Nevertheless, continuous antisolvent feeding reduces the amplitudes of the resulting solubility oscillations. To some extent, this reminds us of the variation of solubility under the action of programmed damped temperature cycles (Suwannasang et al., 2017), which essentially reduces the range of temperature cycles toward the end of the process. This strategy alone was shown to improve the TCID.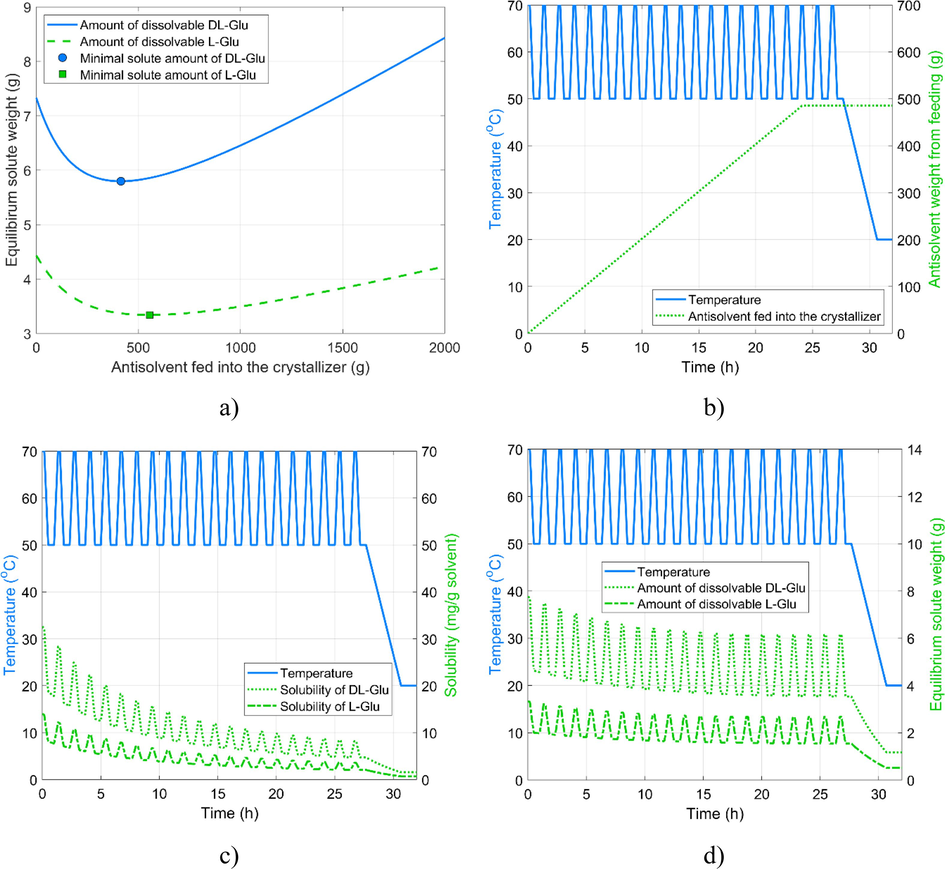
Design of CCAS experiment. a) optimal amount of antisolvent for maximal yield; b) cumulative volume of AS fed into the reactor; c) Solubility of the pure compound and racemic mixture; d) the total amount of dissolvable materials.
Fig. 7 illustrates that, in line with expectations, the EE of the solid phase remains high throughout the process. As explained above, we cannot observe a direct EE gain between the intermediate samples due to the antisolvent addition strategy. The EEs remain around 80 % throughout the experiment, in contrast with the previous experiments, where higher intermediate enantiopurities were recorded. Our hypothesis is that the antisolvent feeding was too fast, and the racemization cannot compensate for the antisolvent-generated crystallization, resulting in continuous counter-enantiomer crystallization.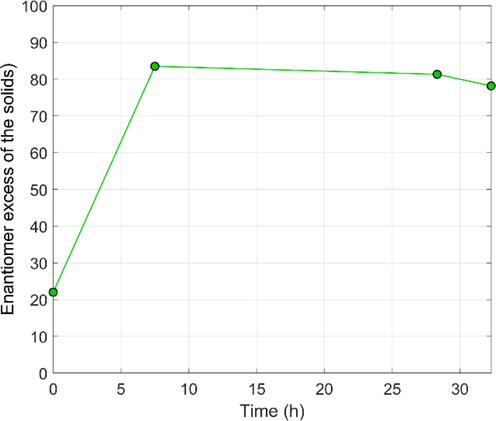
Evolution of solid-phase EE in the CCAS experiment.
The results are summarized in Table 4. Accordingly, the literature reproduction experiments (Exp #1 and #2) are executed at a much higher T-cycle number. Therefore, these must be compared with care with the rest of the experiments as the productivity and the T-cycle efficiency differ significantly. The significance of CCAS is underscored by comparing Exp #6 and Exp #7: even though the initial solvent composition was identical, the yield of the CCAS Exp #7 was significantly better (4.74 vs. 3.41 g recovered product), whereas there is only a weak decrease in product EE in the CCAS. However, the particle sizes of the CCAS experiment were significantly smaller. This could be eliminated by applying a terminal temperature cycle. A negative correlation appears to exist between the product weight and the product EE: if less product is obtained, the enantiomer purity is higher. The CCAS experiment somewhat lays out this correlation in the positive direction. It is also enlightening that the highest product EE was realized in Exp #2, executed at the highest temperature range and the longest time. This indirectly indicates that the potential side reaction, namely, the transformation of the conglomerate to racemate, did not occur under the investigated conditions. * the product sample was strongly cemented, which probably compromised the accurate determination of D50 and D90. The filtration times were also prolonged in these samples, in line with the small D10 values, indicating a large amount of small particles in the product.
Exp #1
Exp #2
Exp #3
Exp #4
Exp #5
Exp #6
Exp #7
Product weight (g)
5.15
2.44
5.73
2.44
6.93
3.41
4.74
Product EE (%)
74.8
100
45.2
93.7
40.7
81.5
78.2
Number of T-cycles (-)
∼125
∼360
21
21
21
21
21
D10 (µm)
15.2
2.7*
4.7
16.2
2.8*
10.8
3.7*
D50 (µm)
71.9
162.4*
83.6
85.5
27.8*
93.8
87.9*
D90 (µm)
217.0
701.7*
299.5
258.7
368.6*
410.7
775.9*
Exp #5 produced significantly smaller crystals than the rest of the experiments: even though the cementation during the post-processing led to agglomerates, even the D50 mean size, which is somewhat more sensitive to the presence of agglomerates than the D10, is as small as 27.8 µm. The size measurements are inconclusive, partly due to the large number of compromised PSD samples. Further investigations are necessary to explain this, but the solution may be in the interplay between solvent system, catalyst, and by-product effects on nucleation and growth kinetics.
Fig. 8 presents the microscope images of the seed and product crystals. The Exp #5 produced the smallest crystals, where locating large crystals originating from the seeds is difficult. The blackish crystal surfaces are resulting from small crystals stuck to the surface of large crystals. In line with the larger D10 sizes, Exp #1, Exp #4, and Exp #6 produced the most “beautiful”, dust-free crystals. In the case of CCAS experiments, a population of largely grown crystals is covered with fines. The images, therefore, support the previous suspicion that a terminal temperature cycle could eliminate or significantly reduce the small fraction and subsequently improve size-uniformity.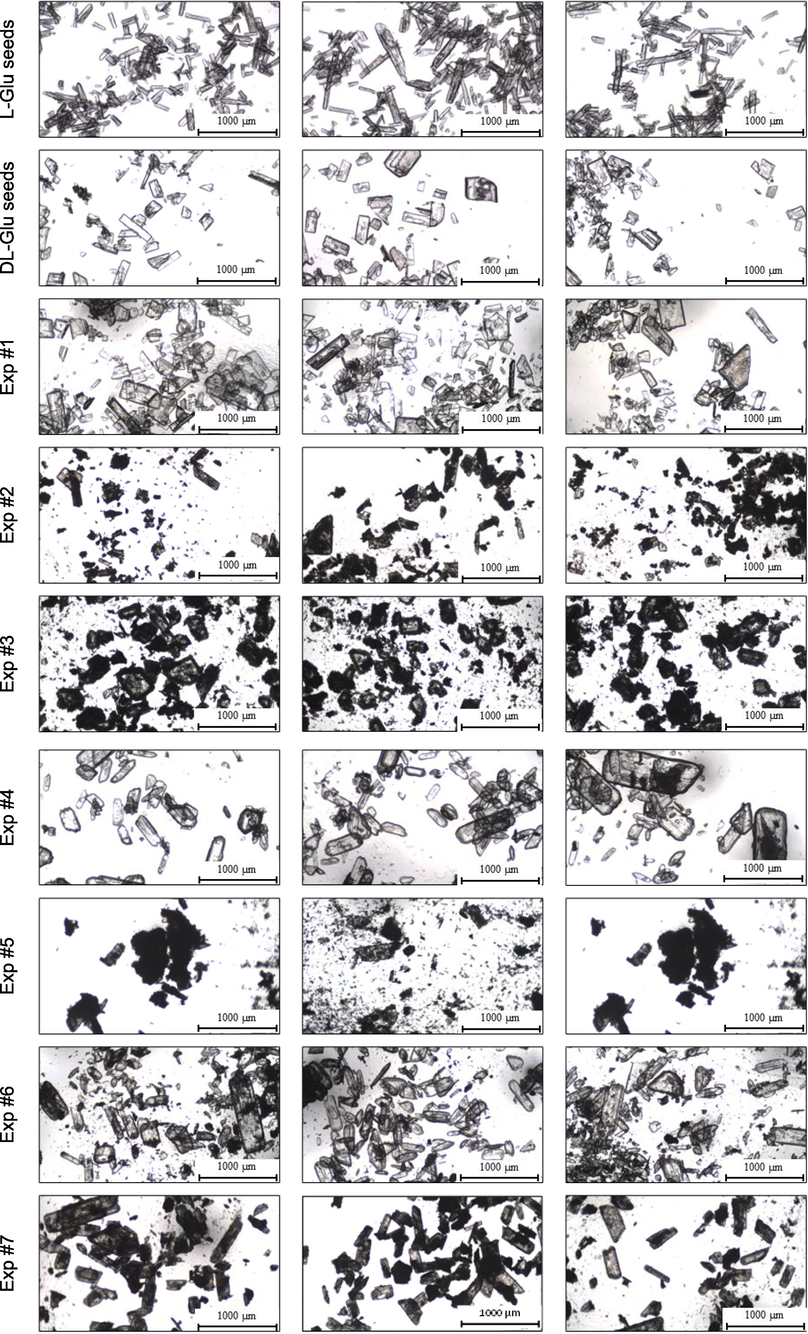
Representative microscope images of the seed crystals and the products of the experiments summarized in Table 3.
Even though the potential of CCAS for enhancing deracemization has been demonstrated here, possibilities beyond optimizing the process.
Conclusions
Combined cooling and antisolvent crystallization strategy was proposed to enhance temperature cycle-induced deracemization processes. The paper’s case study was the glutamic acid system, which undergoes racemization in the presence of the salicylaldehyde catalyst at high temperatures. First, the solubility of enantiopure L-Glu was determined in a broad range of temperatures and solvent system composition, followed by DL-Glu solubility measurements. An empirical solubility model was identified based on these measurements that consider the effects of temperature, solvent system composition, and the concentration of the counter enantiomer. This allowed us to design crystallization experiments at various solvent system compositions. The measurement methods were validated by reproducing TCID experiments from the literature. It was demonstrated that increasing the solubility by solvent effects increases, on the one hand, the apparent rate of deracemization. Still, on the other hand, the side reaction hampering the yield also became more pronounced, which was forced back by applying lower temperatures in the T-cycles. It was demonstrated that excessive solubilities are counter-effective for deracemization, but reducing it dynamically via antisolvent addition has multiple positive effects on the process. Further results are necessary to optimize and exploit the potential of CCAS for other TCIDs based on the promising results of this work.
Acknowledgements
This research was supported by Hungarian National Scientific Research Fund (OTKA) grant FK-138475. B.S. has received funding from the European Union’s Horizon 2020 research and innovation programme under the Marie Skłodowska-Curie grant agreement No 101024059. The inspiring discussions with Prof. Elemér Fogassy is greatly appreciated.
Declaration of Competing Interest
The authors declare that they have no known competing financial interests or personal relationships that could have appeared to influence the work reported in this paper.
References
- Replication of α-amino acids via Strecker synthesis with amplification and multiplication of chiral intermediate aminonitriles. Chem. Commun.. 2016;52:10834-10837.
- [CrossRef] [Google Scholar]
- Catalytic Activities of Salicylaldehyde Derivatives. VIII. Kinetic Studies of the Catalytic Racemization of L-Glutamic Acid at 25 °C. Bull. Chem. Soc. Jpn.. 1978;51(8):2366-2368.
- [CrossRef] [Google Scholar]
- Population-Based Mathematical Model of Solid-State Deracemization via Temperature Cycles. Cryst. Growth Des.. 2018;18(11):7122-7131.
- [CrossRef] [Google Scholar]
- Population-Based Mathematical Model of Solid-State Deracemization via Temperature Cycles. Cryst. Growth Des.. 2018;18:7122-7131.
- [CrossRef] [Google Scholar]
- The market of chiral drugs: Chiral switches versus de novo enantiomerically pure compounds. J. Pharm. Biomed. Anal.. 2018;147:323-340.
- [Google Scholar]
- Intensified deracemization via rapid microwave-assisted temperature cycling. CrstEngComm. 2018;20(21):2897-2901.
- [CrossRef] [Google Scholar]
- Efficient Resolution of Enantiomers by Coupling Preferential Crystallization and Dissolution. Part 2: A Parametric Simulation Study to Identify Suitable Process Conditions. Cryst. Growth Des.. 2013;13(4):1638-1648.
- [CrossRef] [Google Scholar]
- Efficient separation of enantiomers by preferential crystallization in two coupled vessels. AIChE J. 2009;55(3):640-649.
- [CrossRef] [Google Scholar]
- Strategies in optical resolution: a practical guide. Tetrahedron Asymmetry. 2008;19(5):519-536.
- [CrossRef] [Google Scholar]
- Dual-drug chiral resolution: enantiospecific cocrystallization of (S)-ibuprofen using levetiracetam. Cryst. Growth Des.. 2018;18(1):441-448.
- [CrossRef] [Google Scholar]
- Hoffmann, J., & ter Horst, J. H. 2020. Towards Continuous Crystallization-based Separation, Chiral Resolution and Deracemization of Chiral Compounds.
- The unexpected dominance of secondary over primary nucleation. Faraday Discuss.. 2022;235:109-131.
- [CrossRef] [Google Scholar]
- Enantiomeric separation of α-amino acids by imprinted terpolymer membrane. Arab. J. Chem.. 2016;9:S960-S965.
- [CrossRef] [Google Scholar]
- Enantiomers, racemates, and resolutions. Krieger Publishing Company; 1994.
- Thalidomide: The Tragedy of Birth Defects and the Effective Treatment of Disease. Toxicol. Sci.. 2011;122(1):1-6.
- [CrossRef] [Google Scholar]
- Model-based analysis of continuous crystallization/reaction processes separating conglomerate forming enantiomers. Cryst. Growth Des.. 2017;17(1):233-247.
- [CrossRef] [Google Scholar]
- A synthetic machine learning framework for complex crystallization processes: The case study of the second-order asymmetric transformation of enantiomers. Chem. Eng. J.. 2023;465:142800
- [CrossRef] [Google Scholar]
- Kozma, D. 2001. CRC handbook of optical resolutions via diastereomeric salt formation. In: CRC Handbook of Optical Resolutions via Diastereomeric Salt Formation. https://doi.org/10.1201/9781420042603.
- Pitfalls and rewards of preferential crystallization. CrstEngComm. 2010;12:1983.
- [CrossRef] [Google Scholar]
- Deracemization of a Racemic Compound via Its Conglomerate-Forming Salt Using Temperature Cycling. Cryst. Growth Des.. 2016;16(9):5563-5570.
- [CrossRef] [Google Scholar]
- Modeling and simulation studies of a novel coupled plug flow crystallizer for the continuous separation of conglomerate-forming enantiomers. Processes. 2018;6(12)
- [CrossRef] [Google Scholar]
- Emergence of a single solid chiral state from a nearly racemic amino acid derivative. J. Am. Chem. Soc.. 2008;130:1158-1159.
- [CrossRef] [Google Scholar]
- Resolution of an atropisomeric naphthamide by second-order asymmetric transformation: a highly productive technique. Org. Process Res. Dev.. 2019;23(6):1197-1203.
- [CrossRef] [Google Scholar]
- Enantiomeric separation of a melatonin agonist Ramelteon using amylose-based chiral stationary phase. Arab. J. Chem.. 2013;6(1):103-109.
- [CrossRef] [Google Scholar]
- Preferential Crystallization of L-Asparagine in Water. Cryst. Growth Des.. 2011;11(6):2149-2163.
- [CrossRef] [Google Scholar]
- Complete deracemization of proteinogenic glutamic acid using viedma ripening on a metastable conglomerate. Cryst. Growth Des.. 2012;12(11):5796-5799.
- [CrossRef] [Google Scholar]
- Using programmed heating-cooling cycles with racemization in solution for complete symmetry breaking of a conglomerate forming system. Cryst. Growth Des.. 2013;13:3498-3504.
- [CrossRef] [Google Scholar]
- Use of programmed damped temperature cycles for the deracemization of a racemic suspension of a conglomerate forming system. Org. Process Res. Dev.. 2017;21(4):623-630.
- [CrossRef] [Google Scholar]
- Understanding the thalidomide chirality in biological processes by the self-disproportionation of enantiomers. Sci. Rep.. 2018;8:17131.
- [CrossRef] [Google Scholar]
- Rapid deracemization through solvent cycling: proof-of-concept using a racemizable conglomerate clopidogrel precursor. Chem. Commun. 2023
- [CrossRef] [Google Scholar]
- Chiral symmetry breaking during crystallization: Complete chiral purity induced by nonlinear autocatalysis and recycling. Phys. Rev. Lett.. 2005;94(6):065504
- [CrossRef] [Google Scholar]
- Method for the racemization of optically active amino acids. J. Org. Chem.. 1983;48:843-846.
- [CrossRef] [Google Scholar]
Appendix A
Supplementary data
Supplementary data to this article can be found online at https://doi.org/10.1016/j.arabjc.2023.105362.
Appendix A
Supplementary data
The following are the Supplementary data to this article:Supplementary data 1
Supplementary data 1


