

Translate this page into:
Experimental and theoretical study of highly porous lignocellulose assisted metal oxide photoelectrodes for dye-sensitized solar cells
-
Received: ,
Accepted: ,
This article was originally published by Elsevier and was migrated to Scientific Scholar after the change of Publisher.
Abstract
Here, we have manufactured extremely porous photoelectrodes comprised of ZnO/TiO2 by adding lignocellulose (LC) fibers extracted from the self-growing plant (Lily) on fluorine-doped tin oxide (FTO) substrate using doctor blade technique for dye-sensitized solar cells (DSSCs) uses and first-principle calculations were performed for electronic band structures and density of state (DOS). Density functional theory (DFT) results revealed a high conductivity and narrow electronic bandgap after doping with LC. Experimental results showed the effect of the addition of LC in ZnO (ZnO + LC) and TiO2 (TiO2 + LC) on the structure, morphology, and power conversion efficiency (PCE) was studied in detail using powder X-ray diffraction, scanning electron microscope, UV–visible spectroscopy, and solar simulant. The addition of LC in ZnO/TiO2 increases the porosity and surface area for higher dye loading and light-harvesting while decreasing the backward scattering of electrons. These developments result in a 38% increase in PCE of (ZnO + LC) as related to the ZnO based DSSC and a 104% increase in the case of (TiO2 + LC) based DSSC. In this work, we express that the development of highly porous metal oxide nano-composites by mixing LC fibers which may solve the electrolyte leakage issue and enhance the porosity of the photoelectrodes and thus enhance the PCE of DSSCs.
Keywords
ZnO/TiO2 nanocomposites
Dye-sensitized solar cells
Lignocellulose (LC) fibers
First principal theory
DFT

1 Introduction
The reduction of fossil fuels-based resources, their skyrocketing prices, and the current environmental issues, has inspired researchers to develop renewable energy technologies. Among renewable resources, solar energy is a resource of primary importance. The development of technologies for its conversion is the main topic of third era of scientific research (Ampelli et al., 2013; Bailie et al., 2014). Dye-sensitized solar cell is an efficient alternative to the conventional silicon based solar cells and have been widely considered as a promising practical candidate (Bella et al., 2013). One of the main targets for this technology to intrude into the large-scale global market is to improve its long-term stability and electrolyte leakage issues (Ali et al., 2016) which is at present unsatisfactory due to the evaporation of solvents, poor airtight sealing. In this regard, the replacement of conventionally semiconductor materials used photoanodes including mono-Si, poly-Si, GaAs, CdS and InP which suffer from photo-degradation in DSSCs due to reaction with electrolyte, which reduces the lifetime of cell significantly (Raj and Prasanth, 2016; Tang et al., 1994). Both TiO2 and ZnO were found to be the most promising alternate semiconductor materials as photoanodes in DSSCs. As the photoanode is considered to be the most crucial component of DSSCs. Photoanodes play two important roles in DSSC during its operation: (i) absorption and transportation of photo-excited electrons from dye to the external circuit and (ii) to acts as a scaffold layer for dye adsorption. The processes involved by photoanodes are even more than that of dye and electrolyte. Therefore, the modifications of photoanodes have significant impact on DSSC photovoltaic performance. The main problem to the efficiency improvement of DSSC is the energetic loss due to the electrolyte leakage and long-term stability. Modifications of TiO2 and ZnO by utilizing various metallic and non-metallic dopants can further enhance DSSC performance by resolving these issues. However, the most suitable dopants for both TiO2 and ZnO photoanodes have not been identified and the DSSC efficiencies obtained for different dopants are scattered. Therefore, a further investigation is required to explain the influences of different dopants on the band structure and surface modification of photoanodes. In this regard, when considering the components to be used in energy conversion and storage devices bio-based photoanode materials deserve to be primarily considered. As they are naturally available, biodegradable and easily functionalized (Nogi et al., 2013). Among them, natural cellulose and its derivatives stand out, and their application in hydrogen production (Zhu et al., 2013), antennas (Fang et al., 2013), organic light-emitting diodes (LEDs) (Nagashima et al., 2014), supercapacitors (Huang et al., 2013), touch screens (Elstner et al., 1998), nonvolatile memory (Elstner et al., 1998), transistors (Ahmad et al., 2020), flexible Li-ion batteries (Kienle et al., 2006), and solar cells (Huang et al., 2009) is currently under thorough investigation by the scientific community. Usually, the cellulose by itself has partial functionalities because of high resistance in pure form. However, it can be made conductive by mixing with conducting materials, such as tin-doped indium oxide, silver nanowires, carbon nanotubes, graphene, and conductive polymers (Langreth and Mehl, 1983; Zhan et al., 2020). As the dimensions of nanocellulose fibers and other conductive metal oxides are almost the same. Therefore, these two materials mixed uniformly and form highly conductive porous composite appropriate for high surface area for more dye loading and large light scattering in the forward direction.
In this work, we have prepared highly porous and conductive nanocomposites photoanodes of ZnO and TiO2 by mixing nanocellulose fibers (i.e. ZnO + LC and TiO2 + LC) obtained from the self-growing plant (Lily) for the very first time, which are promising for dye-sensitized solar cell (DSSC) applications. Such a porous structure of LC-based nanocomposites photoanodes not only simplifies the fabrication process towards low-cost techniques but also enhance the device efficiency by absorbing more dye and solving the electrolyte leakage and stability issues of DSSCs. Moreover, the additional structural advantages of these photoanodes attenuate backward scattering and manipulate electrons inside the DSSCs.
2 Experimental
2.1 Synthesis of lignocellulose sheet (LC)
Initially, LC fibers were obtained from the self-growing plant (Lily) by detaching LC fibers with the help of a cutter knife as shown in Fig. 1. These LC fibers were dried out in sunlight, then distributed in 40% of NaOCl and stirred for 2 h at 400 rpm the gel was obtained. The obtained gel was filtered by vacuum suction via nitrocellulose ester filter membrane with 0.70 mm pore size and the material was pressed in a vas for one day and the sheet was obtained.(See Figs. 2 and 3)
LC sheet extracted from Lily plant.
Schematic Illustration of the preparation process of ZnO/TiO2 nanoparticles.
Fabrication procedure for the dye-sensitized solar cells.
2.2 Synthesis of ZnO and TiO2 nanoparticles
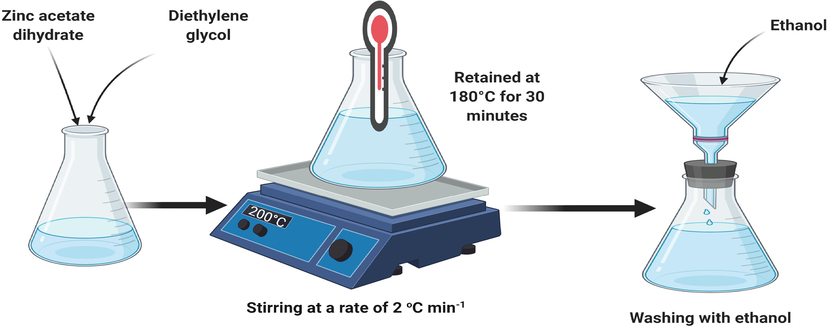
ZnO and TiO2 nanoparticles (NPs) were prepared using a hot-plate magnetic stirring method. All of the chemicals were bought from Sigma Aldrich. For the preparation of ZnO NPs, zinc acetate dihydrate (Zn (CH3COO)2·2H2O) and diethylene glycol (C4H10O3) (DEG-as solvent) were added in a uniform bottom flask. The appropriate concentration of precursor was 0.09 mol L−1. The flask was fitted with a thermometer and placed on a hot-plate magnetic stirrer and the organized mixture was magnetically stirred and heated to 200 °C at a rate of 2 °C min−1. When the temperature reached at 180 °C, the neat solution first turned yellow and then into milky-white. The growth temperature was retained at 180 °C for 30 min, after growth, the flask was removed from the stirrer. The solution was centrifuged three times with ethanol. The TiO2 nanoparticles were formulated with the same procedure using the required materials.
2.3 Preparation of ZnO/TiO2 and lignocellulose (LC) fibers nanocomposite
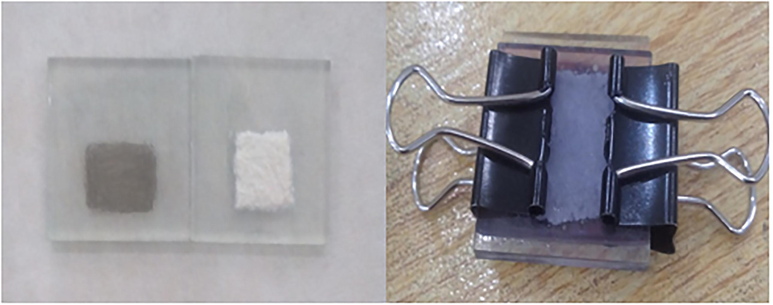
For manufacturing of the composites of ZnO or TiO2, 99.4 wt% of nanoparticles powder of each and 0.6 wt% of LC sheet were wetted with 0.5 g of polyethylene glycol (PEG 400) and stirred for 20 min and then ethanol (5 mL) was added to each past and again stirred for another 20 min to obtain suitable viscosity for the coating preparation. Eight pieces of FTO glass substrates with dimensions 2.5 × 2.5 cm2 were washed ultrasonically with acetone, water, and ethanol. Thin films of ZnO, ZnO + LC, TiO2, and TiO2 + LC were fabricated by the doctor blade method. The organized pastes were first put onto the FTO glass and uniformly scraped by using the doctor blade. The FTO glasses edges were covered with 3 M tape and the effective area of the cell exposed to light was approximately 1 cm2 (1 cm × 1 cm). After evaporation of the solvent, the tape was removed, and the films were placed in an electric oven for annealing at 250 °C for 1 h. After annealing, the films were cooled down to room temperature and then distant from the oven. The film's coated substrates were dipped into a dye (N719) solution overnight and washed with acetonitrile to remove the extra dye. The counter electrodes were prepared by depositing a sheet of graphite with a pencil on FTO glass.
2.4 Assembling of DSSC
The DSSCs were fabricated with sensitized working electrodes and graphite coated counter electrodes. The cells were clipped with a binder clip, leaving the uncovered surfaces out of the sandwich. As the last step, the small quantity of electrolyte solution (0.05 M I2, 0.2 M KI) was filled between the internal space of two electrodes. The performance of DSSCs was checked through its electrical properties using I-V characterization.
The crystallinity and phases of the films were characterized by a wide-angle XRD (Philips X’pert MRD diffractor meter with high-intensity CuKα (λ = 1.5406 Å) radiations. The morphologies of the samples were carried out by scanning electron microscopy (Hitachi, S-4200). The UV–Vis absorption spectra were developed by the Perkin Elmer Lambda 11 Spectrophotometer. The photocurrent–voltage characteristics of the DSSCs were measured using (Oriel 69911, 1000W xenon lamp, AM 1.5) with an intensity of 100 mW cm−2.
3 Simulation and numerical analysis
Using first-principle calculations we have done band gap simulation and numerical calculations for ZnO, TiO2, ZnO + LC, and TiO2 + LC respectively by DFT framework as implemented in Atomistic Toolkit (ATK) (Elstner et al., 1998; Elstner et al., 1998) with generalized gradient approximations (GGA). Local density approximations (LDA) predict that the bandgap of semiconductors is poor; so, we are going to prefer GGA exchange-correlation functional for the comparative analysis of energy band structure and density of states (DOS) of ZnO, TiO2, ZnO + LC, and TiO2 + LC. The overlap-matrix elements can be calculated clearly from the known basis functions, which in turn can be used to evaluate the off-diagonal Hamiltonian matrix elements (Ahmad et al., 2020). GGA scheme is also better for physically adding LC in ZnO and TiO2 at the surface or doping in the inner or in the center. Using the Virtual Nano Lab Software, GGA is coupled with Non-equilibrium green function we have calculated the energy band structure of the materials as well as DOS for the possible applications of DSSCs.
To accomplish the task, we have selected ZnO and TiO2 from the software database to set up its cleavage surface to be oriented along the 〈1 0 1〉 plane for ZnO and ZnO + LC. Cleavage surfaces for TiO2 and TiO2 + LC oriented along 〈0 0 4〉 plane. For the first set of calculations, the k-point sampling was selected to be with GGA exchange-correlation potential (Kienle et al., 2006; Huang et al., 2009; Langreth and Mehl, 1983; Zhan et al., 2020; Ahmad et al., 2020). The grid mesh cut-off was 75 Hartree. We have done all calculations at 300 K (room) temperature. The tolerance force was 2 eV.
4 Results and discussions
4.1 Band gap and density of states
We have found the electronic band structure and DOS of ZnO, ZnO + LC, TiO2, and TiO2 + LC. In Fig. 4 (a) one can observe that the electronic bandgap of pure ZnO is 0.84 eV, the conduction band (CB) is near to the Fermi level as compared to the valence band (VB). The gap between Fermi energy (Ef) and VB is 0.44 eV and Ef to CB is 0.40 eV. After doping with LC results are shown in Fig. 4 (b), these results are as per our expectations because experimental results previously showed that by adding LC in ZnO/TiO2 electronic properties were increased. So, the electronic bandgap decreased with doping. After doping the band gap was 0.22 eV. The VB shifted toward the Ef, while the gap between VB and Ef was decreased from 0.44 eV to 0.02 eV. Image 4 (c) showed the electronic bandgap of TiO2, the bandgap between VB and CB was 2.21 eV before doping, the gap between Ef and VB was 0.6 eV, and the gap between Ef and CB was 1.5 eV. After doping with LC, a dramatic behavior was observed in TiO2, bandgap decreased from 2.1 eV to 0.02 eV. This huge change in the electronic bandgap is a good sign of electronic charge transport properties.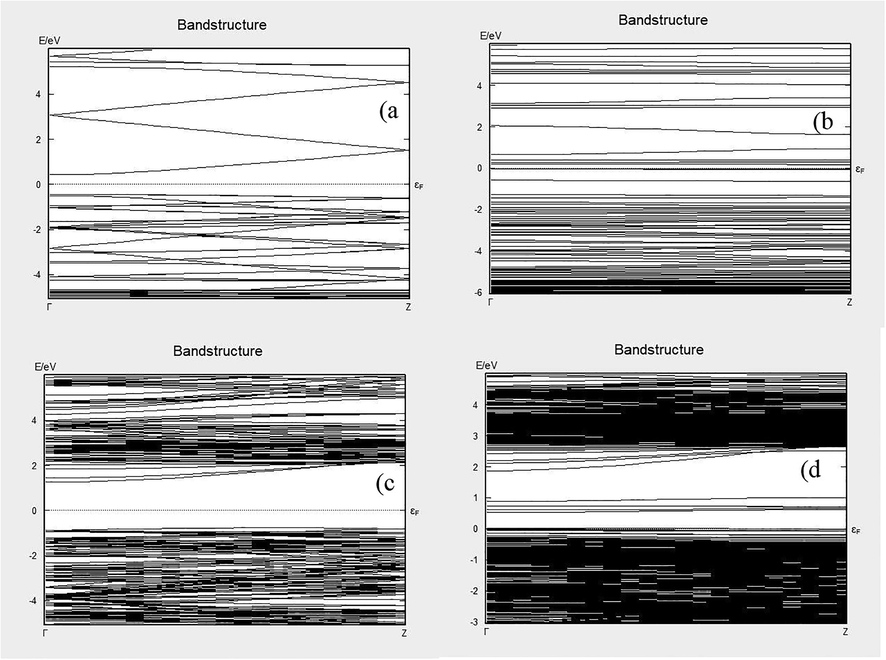
Band structures (a) ZnO, (b) ZnO + LC, (c) TiO2 and (d) TiO2 + LC.
Fig. 5 delineates the DOS results for all the samples which we have already used for band structures. In this Figure, image 5(a) results are well agreed with Fig. 4 (a) bandgap results of ZnO. On Ef, there were no available states as is cleared from the results.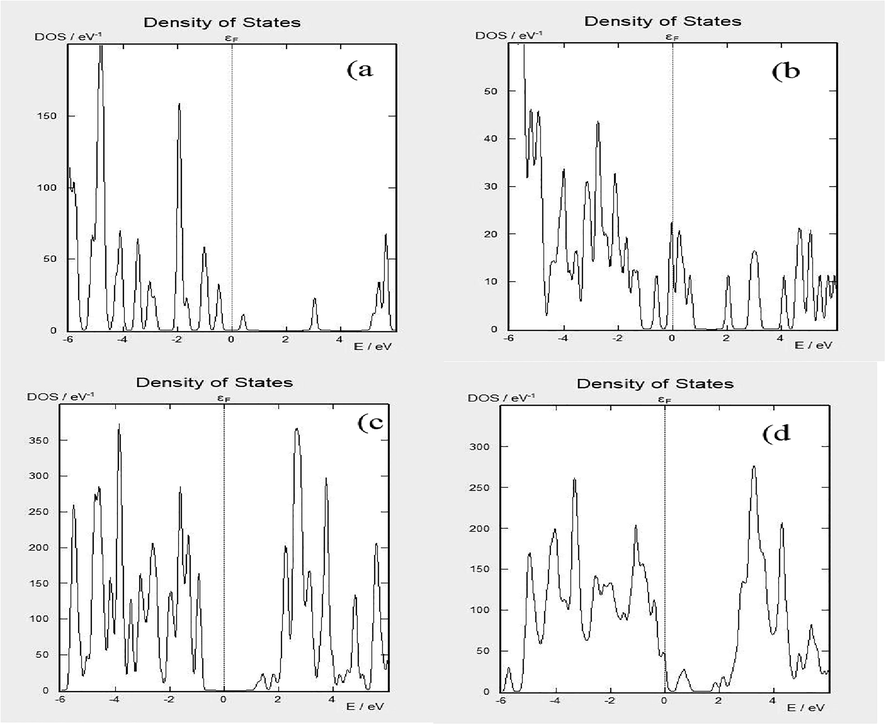
Density of state (a) ZnO (b) ZnO + LC (c) TiO2 and (d) TiO2 + LC.
In Fig. 5 (b) the results of ZnO + LC are shown. In this image, it can be seen that there are many existing states on Ef, and these results are confirmed with the results of the bandgap of ZnO + LC. Due to LC both the VB and CB have shifted towards Ef. This shifting of VB and CB towards Ef is good for enhancing the conductivity of the materials. Image 5(c) and (d) are the same as image 5(a) and (b). Pure materials peaks were on right and left sides of the Ef. After doping LC in ZnO/TiO2 both peaks were shifted towards Ef. As we have already discussed this shifting is the main cause of increasing the conductivity of the materials which would increase the efficiency of the DSSCs.
4.2 Structural characterization
Fig. 6 delineates the XRD pattern of ZnO, ZnO + LC, TiO2, and TiO2 + LC films. In Fig. 6, diffraction peaks clearly show the Wurtzite-structure of ZnO with its eight characteristic peaks (1 0 0), (0 0 2), (1 0 1), (1 0 2), (1 1 0), (1 0 3), (1 1 2), and (2 0 1). These peaks appeared at an angle of 2θ = 31.84°, 34.53°, 36.35°, 47.7°, 56.8°, 63.1°, 68.1°, 69.2°, respectively with the more noticeable intensity of (1 0 1) peak over other peaks (Brandbyge et al., 2002). The experimental XRD pattern of ZnO agrees with the standard JCPDS card no. 89-7102. There are no impurity peaks such as Zn (OH)2 or Zn metal. Meanwhile, the ZnO + LC film shows the same XRD pattern as the ZnO film with a small shift in peak position towards a higher angle as shown in Fig. 4. Probably this shifting is a result of internal stresses in the film. XRD patterns of TiO2 and TiO2 + LC films are shown in Fig. 6. The XRD pattern comprised of five characteristic peaks (1 0 1), (0 0 4), (2 0 0), (2 0 4), and (1 1 6). These peaks appeared at 2θ = 25.27°, 38.52°, 53.85°, 62.64o, and 66.52° with the highest intensity of (0 0 4) peak over the other peaks. These peaks confirm the anatase structure of TiO2 and in good arrangement with standards (JCPDS card no. 84-1286) (Saleem et al., 2015). Instead, there is no spurious peak found in the prepared sample of TiO2. Moreover, in the case of TiO2 + LC, the XRD peaks are the same as that of TiO2 with a small shift in peaks position towards higher angles as shown in Fig. 6 which may be due to the existence of tensile stress in the samples.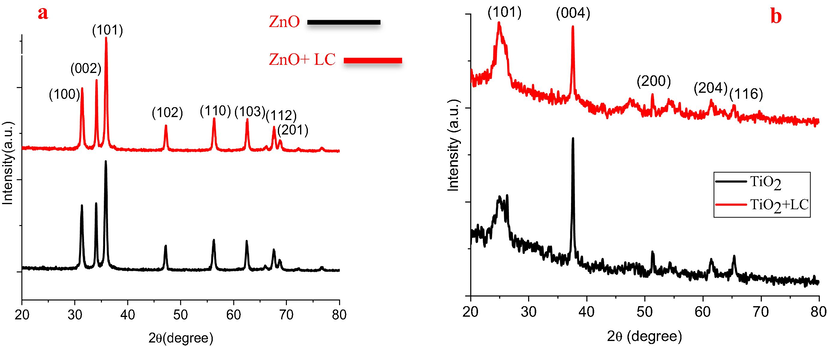
XRD images of (a) ZnO, ZnO + LC, TiO2, and (b) TiO2 + LC samples.
4.3 Morphological characterization
Fig. 7 shows the SEM micrographs of ZnO and ZnO + LC, TiO2, and TiO2 + LC thin films grown on FTO glass substrate using the doctor blade method. In Fig. 7 one can see the non-uniform growth of ZnO with different sizes of thickness at different sites. SEM micrographs show that ZnO thin film consists of round-shaped nanoparticles covering FTO glass in a non-uniform way and the size of nanoparticles is not the same over the complete film. In Fig. 7 the SEM micrograph of ZnO + LC film grown on FTO glass substrate show that by adding LC in ZnO the surface of the film gets smoother and the porosity of the film increased. From Fig. 7 it is clear that the growth of TiO2 film is even with no cracks. But from the SEM micrograph of TiO2 + LC film (Fig. 7), it can be seen that there are some cracks and the surface of the film is not much evener as compared with TiO2 film. However, the porosity of film consisting of TiO2 + LC is greater than TiO2 film because of the presence of aggregates and cracks which originates from the surface debris after mixing LC fibers in TiO2. The presence of aggregates and cracks improved dye and electrolyte diffusion into the film.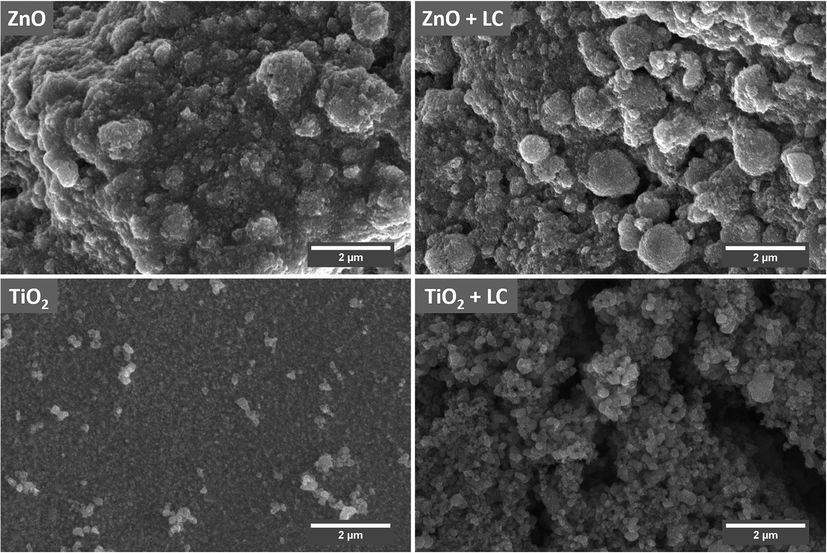
SEM images of ZnO, ZnO + LC, TiO2 and TiO2 + LC samples.
4.4 Optical properties
The absorption spectra of ZnO, ZnO + LC, TiO2, and TiO2 + LC films were observed in the wavelength range from 300 to 800 nm, as illustrated in Fig. 8. In general, without dye, the samples ZnO, ZnO + LC, TiO2, and TiO2 + LC can only absorb photons in the ultraviolet region of light in the wavelength range of 350–420 nm. Fig. 8 indicates that the absorbance of all the samples near the band edges is about 360 nm for ZnO and 380 nm for ZnO + LC, 385 nm for TiO2, and 390 nm for TiO2 + LC films respectively. After 400 nm, the absorbance of ZnO and ZnO + LC films decreases as compared to TiO2 and TiO2 + LC films. In the light spectrum, a strong absorption region of all the samples is the UV region; when the energy of photon given to the electron is equal to the bandgap energy of material then the electron is excited from VB to conduction band CB (Liu et al., 2015). There is an increase in maximum absorbance value and wavelength shift after dye loading on ZnO, ZnO + LC, TiO2, and TiO2 + LC thin films. There is a shift in wavelength of light absorption at 600–700 nm after the addition of dye, which is the area of visible red-light color. The energy gap of all samples is calculated using the following relation (Gopalakrishnan et al., 2011).
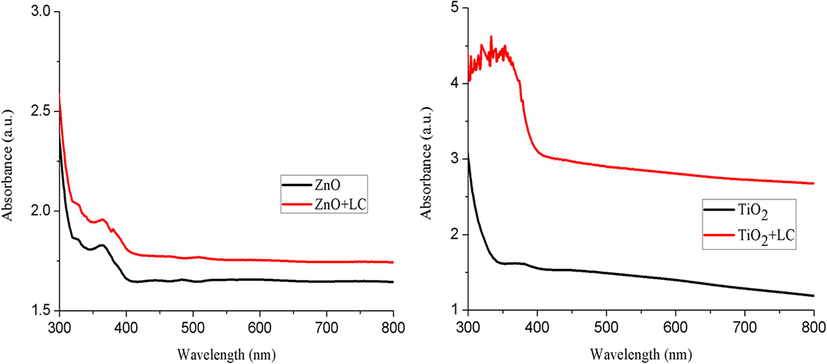
Absorbance spectra of ZnO, ZnO + LC, TiO2, and TiO2 + LC samples.
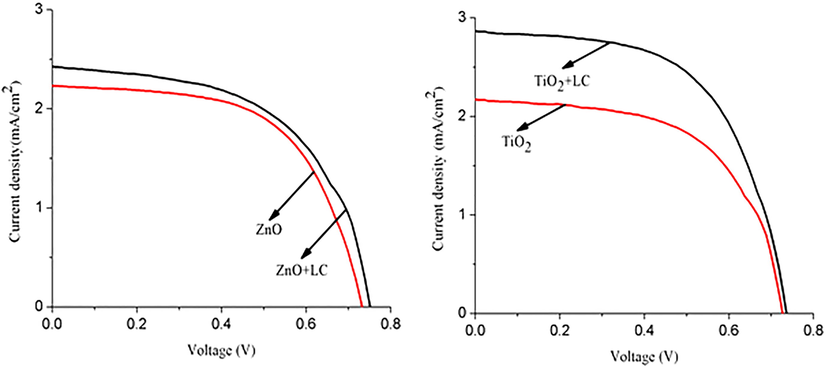
Current density–voltage characteristics of ZnO, ZnO + LC, TiO2, and TiO2 + LC samples.
4.5 Solar cell performance
All ZnO, ZnO + LC, TiO2, and TiO2 + LC working electrodes were used as photoanodes for the fabrication of dye-sensitized solar cells (DSSCs), and their measured performances were summarized in Table 1. The current–voltage (JV) characteristics of fabricated DSSCs are shown in Fig. 7. First, comparing ZnO + LC assembled DSSC with ZnO assembled DSSC exhibited a higher PCE of 1.31% than a PCE of 0. 95% (Table 1). This was mainly due to greater dye anchoring because of higher porosity, representing that by mixing LC fibers with ZnO nanoparticles a highly porous surface was obtained. We note that the DSSC fabricated by using the ZnO + LC working electrode is more efficient (Table 1) than that of the ZnO working electrode DSSC. This may be acknowledged to the presence of a smooth and more porous surface in the ZnO + LC sample as discussed above (in SEM), thus promoting more dye absorption. This confirmed a 38% increase in PCE as compared to the ZnO sample. A similar trend was observed for solar cells collected using the TiO2 + LC working electrode (PCE = 2.30%), which was higher than that of TiO2 of PCE = 1.12%, (Table 1). This described an increase of 105% PCE as compared to the TiO2 sample. Our results are in good agreement with that of 2.3% and 3.2% efficient organic solar cells fabricated by depositing a thin layer of conducting nanocellulose paper on ITO glass (Hu et al., 2013) and silver nanowires coated with conductive transparent nanofiber paper. This was ascribed to the presence of aggregates and cracks on the surface of the TiO2 + LC sample. These cracks were originated from the surface debris after mixing LC fibers in TiO2. The presence of cracks boosted dye and electrolyte diffusion into the DSSC. Moreover, a markedly enhanced DSSC performance was perceived via the use of LC fibers in ZnO or TiO2 nanocomposites. Hu et al. proposed that the porous structure often manipulates electrons/ photons in DSSCs and attenuates the backward scattering of electrons (Hu et al., 2013). A similar increasing trend was noticed for other parameters as is cleared from Table 1.This increasing fashion in all parameters of LC-based DSSCs is credited to the higher porous structure for more dye loading and light-harvesting.
Samples
JSC (mA.cm−2)
VOC (mV)
FF
Ƞ%
ZnO
2.16
718
0.57
0.95
ZnO + LC
2.45
728
0.60
1.31
TiO2
2. 23
617
0.59
1.12
TiO2 + LC
2.90
698
0.69
2.30
5 Conclusions
This study manufactured ZnO, ZnO + LC, TiO2, and TiO2 + LC nanocomposite photoanode by mixing LC fibers for DSSCs applications. DSSCs fabricated with ZnO + LC/TiO2 + LC nanocomposites were found to show superior light-harvesting performance than DSSCs containing ZnO/TiO2. Rather, ZnO + LC/TiO2 + LC nanocomposites exhibit a larger internal surface area for efficient dye loading and light anchoring. A greater porous surface lessened the backward scattering of electrons and enhanced the manipulation of electrons in DSSCs. These improvements harvest a 105% improvement in power conversion efficiency.
Acknowledgments
The authors would like to acknowledge Higher Education Commission Pakistan for providing research Grant No. 5336/Federal/NRPU/R&D/HEC/2016. Dr. M.S. Javed would like to thank the Postdoctoral Foundation of China (2018M633280) and Researchers Supporting Project Number (RSP-2020/267) King Saud University, Riyadh, Saudi Arabia.
Declaration of Competing Interest
The authors have no conflict of Interest.
References
- A novel study on synthesis of egg shell based activated carbon for degradation of methylene blue via photocatalysis. Arabian J. Chem. 2020
- [Google Scholar]
- Recent Advancement and development of chitin and chitosan-based nanocomposite for Drug Delivery: Critical approach to clinical research. Arabian J. Chem. 2020
- [Google Scholar]
- Advances in nanostructured thin film materials for solar cell applications. Renew. Sustain. Energy Rev.. 2016;59:726-737.
- [Google Scholar]
- Solarenergy and biowaste conversion into H2 on CuOx/TiO2 nanocomposites. Chem. Eng. Trans.. 2013;35:583-588.
- [Google Scholar]
- Melt-infiltration of spiro-OMeTAD and thermal instability of solid-state dye-sensitized solar cells. Phys. Chem. Chem. Phys.. 2014;16:4864-4870.
- [Google Scholar]
- Towards green, efficient and durable quasi-solid dye-sensitized solar cells integrated with a cellulose-based gel-polymer electrolyte optimized by a chemometric DoE approach. RSC Adv.. 2013;3:15993-16001.
- [Google Scholar]
- Density-functional method for nonequilibrium electron transport. Phys. Rev. B. 2002;65:165401
- [Google Scholar]
- Self-consistent-charge density-functional tight-binding method for simulations of complex materials properties. Phys. Rev. B. 1998;58:7260.
- [Google Scholar]
- Highly transparent and writable wood all-cellulose hybrid nanostructured paper. J. Mater. Chem. C. 2013;1:6191-6197.
- [Google Scholar]
- Influence of substrate and film thickness on structural, optical and electrical properties of ZnO thin films. Cryst. Res. Technol.. 2011;46:361-367.
- [Google Scholar]
- Transparent and conductive paper from nanocellulose fibers. Energy Environ. Sci.. 2013;6:513-518.
- [Google Scholar]
- First-principles study of diffusion of zinc vacancies and interstitials in ZnO. Solid State Commun.. 2009;149:199-204.
- [Google Scholar]
- Extended Hückel theory for band structure, chemistry, and transport. I. Carbon nanotubes. J. Appl. Phys.. 2006;100:043714
- [Google Scholar]
- Beyond the local-density approximation in calculations of ground-state electronic properties. Phys. Rev. B. 1983;28:1809.
- [Google Scholar]
- Synthesis of single-crystalline anatase TiO2 nanorods with high-performance dye-sensitized solar cells. J. Mater. Sci. Technol.. 2015;31:106-109.
- [Google Scholar]
- Cellulose nanofiber paper as an ultra flexible nonvolatile memory. Sci. Rep.. 2014;4:5532.
- [Google Scholar]
- A critical review of recent developments in nanomaterials for photoelectrodes in dye sensitized solar cells. J. Power Sources. 2016;317:120-132.
- [Google Scholar]
- Structural and photovoltaic characteristics of hierarchical ZnO nanostructures electrodes. Appl. Surf. Sci.. 2015;334:145-150.
- [Google Scholar]
- Electrical and optical properties of TiO2 anatase thin films. J. Appl. Phys.. 1994;75(4):2042-2047.
- [Google Scholar]
- Facet Controlled Polyhedral ZIF-8 MOF Nanostructures for Excellent NO2 Gas-Sensing Applications. Mater. Res. Bull.. 2020;111133
- [Google Scholar]
- Biodegradable transparent substrates for flexible organic-light-emitting diodes. Energy Environ. Sci.. 2013;6:2105-2111.
- [Google Scholar]


