

Translate this page into:
Experimental study on residue oil distribution after the supercritical CO2 huff-n-puff process in low permeability cores with Nuclear Magnetic Resonance (NMR)
⁎Corresponding author at: Geo-Energy Research Institute, College of Electromechanical Engineering, Qingdao University of Science and Technology, Gaomi 261550, China. liyingge@qust.edu.cn (Yingge Li)
-
Received: ,
Accepted: ,
This article was originally published by Elsevier and was migrated to Scientific Scholar after the change of Publisher.
Abstract
In this paper, two sandstone cores with permeabilities of 1.7mD and 2.6mD were employed and the ScCO2 huff-n-puff processes were carried out to check the oil recovery efficiency as well as the oil mobilization laws under the conditions of 50 °C and 25 MPa. Both cores were cut half after the completion of the process and the residue oil distribution in the entire core as well as the front half and back half of the core were scrutinized with help of the Nuclear Magnetic Resonance (NMR) measurements. It is found longer soaking time of 5 days leads to higher oil recovery rate of 17.2% in comparison with 15.2% after 1 day’s operation time. NMR measurement results show that more oil in the large pore spaces of the core is produced, while the oil in the small pore spaces is rarely mobilized after the ScCO2 huff-n-puff process. NMR results further show that the oil saturation in the large pores of the front part is obviously lower than that of the back part of the core, which indicates that a round of huff and puff operation mainly produced the oil in the large pore spaces from the front part of the core, while leave a considerable part of the oil undeveloped in the rear part of the core.
Keywords
ScCO2 Huff-n-Puff
Low permeability core
Residue oil distribution
NMR

1 Introduction
At present, human society is facing two challenging problems of the increasing demand on energy resources and the increasing discharge of greenhouse gas of CO2. In one hand, the newly exploited oil & gas resources consist of high proportion of low permeability reservoirs which are difficult to be developed with traditional technologies. (Tong et al., 2018) On the other hand, astonishing amount of CO2 is discharged into the atmosphere accompanying the fossil fuel consumptions in industrial activities, which results in the serious greenhouse effect and leads to an exciting research topic of Carbon Capture, Utilization and Storage (CCUS) in recent years. (Leonzio et al., 2020; Jiang et al., 2020; Jiang and Ashworth, 2021)
Under reservoir conditions, Supercritical CO2 (ScCO2) could dissolve with oil to reduce the oil viscosity, extract the low carbon component, decrease the interfacial tension, as well as supply the geological energy. Therefore, CO2 Enhanced Oil Recovery (CO2 EOR) has becoming one of the most competing technologies in the CCUS chain. (Cao and Gu, 2013; Zhou et al., 2019; Bachu, 2016; Yang et al., 2017; Peck et al., 2017; Zhang et al., 2019; Rognmo et al., 2020)
As an important CO2 EOR technique, CO2 huff-n-puff process has been developed in 1980s (Sayegh and Maini, 1984) and still prevails up to now for heavy oil productions. (Zhou et al., 2018; Li et al., 2017; Zhou et al., 2019; Li et al., 2020) With the increasingly explored unconventional oil resources in recent years, the ScCO2 huff-n-puff process has shown bright application perspective on enhancing oil recovery from low permeable reservoirs. (Yoosook et al., 2017; Janiga et al., 2018; Sheng, 2017; Zuloaga et al., 2017; Zhang et al., 2018; Lashgari et al., 2018) Among the plenty of laboratory works reported in recent years, Ma et al. (Ma et al., 2015) conducted CO2 huff-n-puff operation in the cores with average porosity of 9.6% and average permeability of 2.3mD and reported the cycle recovery factor up to 14.52%. Peng et al. (Peng et al., 2019) carried out a series of CO2 huff-n-puff experiments using a 1D sandpack model with analysis of the CO2 extraction effect on oil production. They found oil recovery factor is improved with increasing cycles while the CO2 utilization factor is reduced. Li et al. (Li et al., 2019) performed comparative studies of CO2 and N2 huff-n-puff EOR performance in shale oil production and reported the cumulative oil recovery factors up to 61.49% for CO2 injection and 34.85% for N2 injection at the end of six injection cycles. Wei et al. (Wei et al., 2020) designed and employed dual-permeability tight matrix-fracture models to mimic CO2 huff-n-puff and continuous injection scenarios and their results indicated that both processes could substantially recover the matrix oil with the final recovery factor up to 38–53%.
To reveal the mechanism behind the oil recovery effect of the CO2 huff-n-puff processes in low permeable cores, low field NMR has been widely employed in the laboratory works. (Gao and Li, 2015; Song and Kausik, 2019; Li et al., 2020; Liu et al., 2020; Chen et al., 2020) Ma et al. (Ma et al., 2019) analyzed the remaining oil distribution in different pore sizes with NMR tests to study the effects of cycle numbers, production pressure, and permeability in CO2 huff-n-puff process. They reported in the first cycle, the oil in macro to small pores (>10 ms) could be effectively mobilized, whereas oil in the micropores (<10 ms) is rarely produced. Bai et al. (Bai et al., 2019) employed NMR to investigate the oil distribution in fractured cores after CO2 huff-n-puff process and observed the oil is mainly produced from the macropores with unproduced oil remaining in the small and medium pores. Du et al. (Du et al., 2020) conducted CO2 huff-n-puff and CO2 flooding processes in tight conglomerate reservoirs with pore sizes ranging from 0.036 μm to 18.39 μm and reported the first cycle of huff-n-puff process could contribute 75% of the total recovered oil from the core. In addition, the 1D and 2D NMR measurement results indicated the crude oil in macro-pore contributed most to recovery factor, and spatial oil saturation distribution along the core was approximately uniform after the huff-n-puff processes. Zeng et al. (Zeng et al., 2020) studied a hybrid process of a chemical blend with CO2 huff-n-puff on oil recovery in shale cores based on evaluation of the fluid volumes inside cores with the NMR T2 spectra.
Based on above literature reviews, it is found most researchers employed NMR to show the oil distribution in pore scales, that is, the oil distribution in various size pores. Although some trials have been made on revealing spatial distributions of the residue oil for flooding processes (Wei et al., 2019; Wei et al., 2020) based on the signal amplitude of 1D NMR images, the pore scale along with core scale residue oil distributions for the CO2 huff-n-puff processes in low permeable cores, is still lack of in-depth investigations up to now.
Therefore in this paper, we carried out the laboratory studies of ScCO2 huff-n-puff process in low permeability cores. In addition to the oil recovery factors, the pore-scale as well as the core-scale oil distribution information in the low permeable cores was scrutinized based on NMR measurement on the entire core, front-half and back-half core respectively.
2 Experiment
2.1 Materials
The petrophysical properties of the two sample cores employed for ScCO2 huff-n-puff tests, numbered as E1 and E2 respectively, are listed in Table 1. The core porosity and permeability were measured with the high temperature high pressure porosity & permeability measuring instrument (Model TCKS-400, Jiangsu Tuochuang Scientific Research Instruments Co., Ltd.). The core porosity was determined with high pressure Nitrogen gas based on Boyle's law, and the permeability was measured with gas permeability approach based on Darcy’s law. According to the latest classification standard of low permeable reservoir with matrix permeability of 0.1–10 mD (Hu et al., 2018; Liang et al., 2019), the core samples employed in this paper are categorized as the low permeability cores.
No.
Length (cm)
Diameter (cm)
Porosity (%)
Permeability (mD)
E1
7.041
2.502
13.814
1.710
E2
6.955
2.502
14.023
2.692
Carbon dioxide with purity of 99.9% is employed in the huff-n-puff processes and the liquid paraffin oil (molar mass of 226, relative density of 0.835–0.855, viscosity of 8.94 mPa.s at 50 °C and impurity less than 0.005%) is employed as the oil phase. Fig. 1 displays the oil chemical compositions in terms of mole fractions of various carbon numbers, showing the main components of the oil is C18-C20. The Minimum Miscibility Pressure (MMP), which characterize the miscibility situation between oil and CO2, is an important parameter for CO2 EOR processes. Among all the popular methods on MMP determination (Hawthorne et al., 2014; Liu et al., 2016; Czarnota et al., 2017; Czarnota et al., 2017; Zheng et al., 2019), we employed the oil droplet volume measurement (ODVM) method (Zheng et al., 2019) to determine the MMPs of the system. The MMPs of CO2/liquid paraffin system, as reported by Zheng et al. (Zheng et al., 2019), are 9 MPa and 11.8 MPa at temperature of 40.6 °C and 61.2 °C respectively, which indicates a miscible CO2/oil system under the experimental condition of 25 MPa and 50 °C.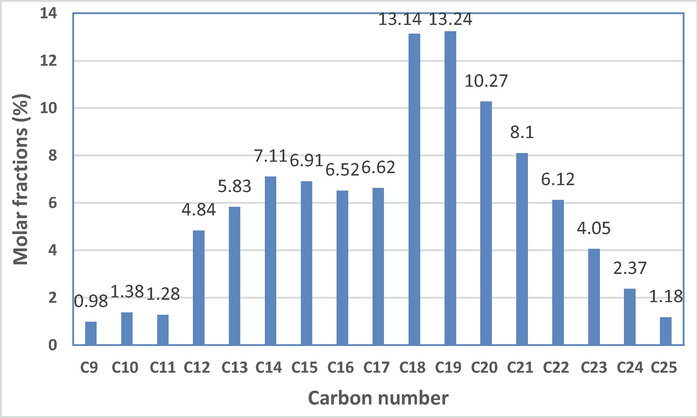
Oil composition in carbon numbers.
2.2 Apparutus
The huff-n-puff practices were performed with the high-temperature high-pressure multi-functional core displacement apparatus (Model TC-II, Jiangsu Tuochuang Scientific Research Instruments Co., Ltd.), which enables various types of core displacement tests under temperature & pressure conditions up to 150℃ and 50 MPa.
Fig. 2(a) and (b) depicte the picture and the schematic diagram of the experimental apparatus, which mainly consists of ScCO2 generation system (I), temperature control system (II) and back pressure system (III). In ScCO2 generation system, the CO2 fluid from the gas cylinder is firstly liquilized in the refrigeration unit under 4 °C and then is heated in preheating coil and pressurized to the supercritical state with high precision syringe pump under designed reservoir conditions, which is 50 °C and 25 MPa in this study. The temperature control system is the large volume incubator, containing displacement fluid containers and the 316L stainless steel core holder. In the core holder, the low permeability core is tightly wrapped by CO2-resistant rubber sleeve with highly pressurized confining water to prevent any fluid side leakage. In the huff-n-puff experiment, the core holder outlet is tightly sealed with a stainless steel blocker, both the injection (huff) and production (puff) of the fluids flow in and out through the inlet of the core holder. The system pressure is maintained with the back pressure system.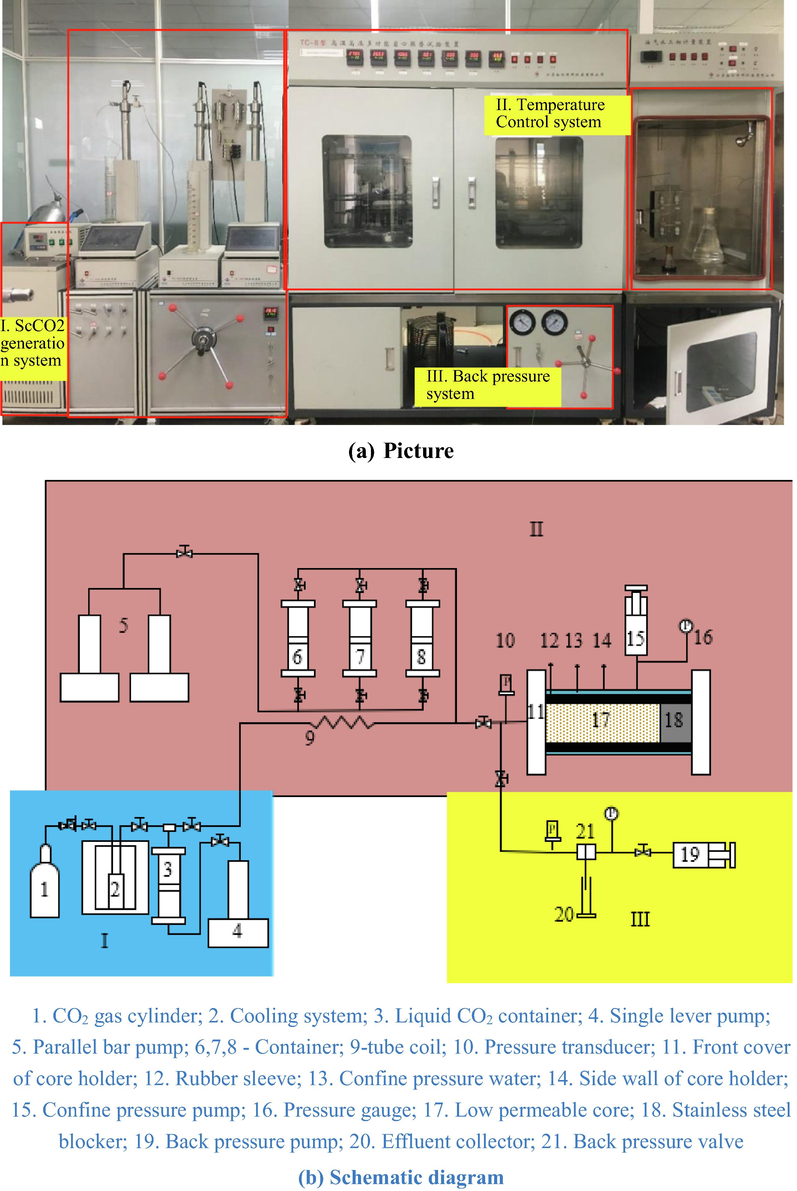
The experimental setup.
Oil recovery effect is obtained based on measurement of the weight loss the oil saturated core after the huff-n-puff process with Mettler Toledo balance (Model No. ME204E, with max measuring weight of 220 g and accuracy of 0.0001 g). Pore scale oil distributions in the core before and after the huff-n-puff process is monitored through the low field NMR Analysis and Imaging system (Model No. MesoMR23-060H-I, Suzhou Niumag Analytical Instrument Co.) with the characteristic magnetic intensity of 0.5 ± 0.05 T and frequency of 21.3 MHz.
2.3 Experimental procedure
-
(1)
Dry the clean core in the hot oven for continuous 24 h and obtain the weight of the dry core and perform NMR measurement of the dry core;
-
(2)
Vacuum the dry core for continuous 12 h in the core holder, then saturate the core with flooding oil at 0.05 mL/min under system temperature of 50 °C and backpressure of 25 MPa. Close the core holder outlet after effluent oil and pressure drop reaching stable, then maintain the system condition for another 12 h.
-
(3)
Take out the oil saturated core from the core holder, measure the weight and perform NMR measurement of the oil saturated core.
-
(4)
Perform ScCO2 huff-n-puff processes. Put the sample core in the core holder under the designated temperature of 50 °C, and then gradually pressurized the system with continuous injection of ScCO2 until the system pressure reaches to the designated level of 25 MPa. To check the effect of soaking time on oil recovery rates, the ScCO2 soaking time is set to 5 days for sample E1, while set to 1 day for sample E2. After the set soaking period, the system is de-pressurized in a rate of 1 MPa/5min until the system pressure decreases to the atmospheric condition to finish a cycle of huff-n-puff process.
-
(5)
Take out the core from the core holder, measure the weight loss of the core to obtain the oil recovery rate of the ScCO2 huff-n-puff cycle.
-
(6)
Perform the NMR measurement of the entire core. Then cut the core at the middle, and perform the NMR measurement again for the front half (the part contacting directly on ScCO2) and back half (the part contacting the core holder outlet) of core respectively. Fig. 3 shows the pictures of the initially oil saturated cores as well as the cut cores after the huff-n-puff processes.
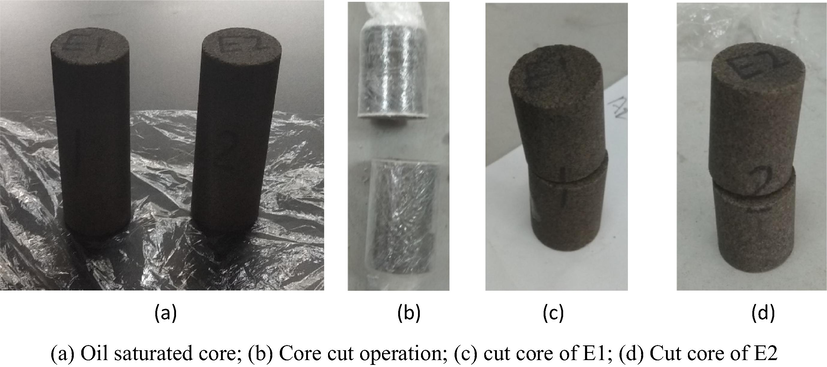
- Pictures on the core treatments before & after the huff-n-puff process.
3 Results and discussions
3.1 Oil recovery rate after various soaking period
Table 2 lists the oil recovery rate after the huff-n-puff process of 5 days for sample E1 and of 1 day for sample E2. Together listed in the Table are the original measurement data of the core weights at different stages of the experiment.
Sample No.
Dry core weight (g)
Oil saturated core Weight (g)
Core Weight after HnP process (g)
Recovered oil Weight (g)
Oil recovery rate (%)
E1
79.54
83.44
82.77
0.67
17.2
E2
78.15
82.14
81.52
0.62
15.5
It is clearly observed that the longer soaking time results in higher oil recovery efficiency, with 17.2% for 5 days’ soaking time versus 15.5% for 1 day’ soaking period. As the first round of huff-n-puff process contributing mostly to the final recovery rate of the huff-n-puff processes (Ma et al., 2015; Peng et al., 2019; Li et al., 2019; Wei et al., 2020; Chen et al., 2020; Ma et al., 2019; Bai et al., 2019; Du et al., 2020), the reasonably extended soaking time in the first round of the process is therefore recommended based on the research results.
3.2 Pore-size and core-size oil distrubitions through NMR measurement
3.2.1 Soaking time of 5 days
To reveal the oil recovery mechanism, the pore-size oil distribution in the low permeability core is analyzed with help of NMR tests. To further reveal the core-size oil distribution, namely, the pore-size oil distributions in various part of the core, NMR measurement are performed for the front half and back half of the core respectively. Fig. 4 shows the NMR results of the entire core of E1 under the dry, oil saturation, and after-process conditions. Together displayed in the figure are the NMR T2 signal intensities of the front half and back half of the oil-recovered core.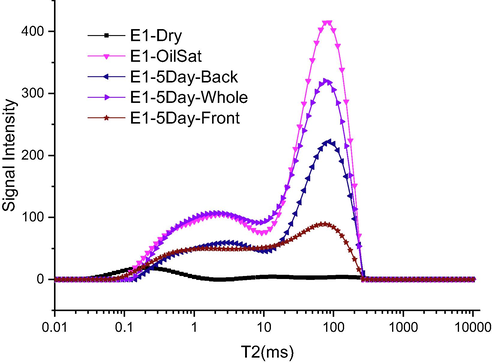
NMR test results for the entire core, front half and back half of the core after 5 days’ huff-n-puff process.
The high pressure mercury injection was performed in a core sample drilled from the same reservoir block to estimate the correspondence between T2 spectrum and the core pore sizes ranges. Mercury injection results indicates the lower T2 values of 0.1–10 ms corresponds to smaller pore sizes of ∼0.01 μm whereas higher T2 values of 10–300 ms corresponds to the larger pore sizes in the scale of 0.1 μm.
Among all the five curves in Fig. 4, the curve with the highest NMR signal intensity is for the oil saturated core, indicating the highest oil concent in the core. Whereas the curve with the lowest signal intensity is for the dry core, showing the negligible hydrogen content. The other three curves locating between the oil saturated core and the dry core are the curves for the entire core, back half and front half of the core after the huff-n-puff operation, in the sequence of decreasing maximum signal intensities. Detailed investigations shows the NMR signal difference between the oil saturated core and the entire core after the huff-n-puff process exists only in the higher T2 region, indicating the oil is recovered mostly from the large size pores (∼0.1 μm) of the core. The observation on oil mobilization mainly from large size pores are consistent with other reported NMR results. (Ma et al., 2019; Bai et al., 2019; Du et al., 2021) Further comparisons between the curves for the front half and back half of the core shows higher NMR peak value for rear part of the core, which indicates in comparison with the rear part, the oil in the front part is more obviously mobilized and produced through the huff-n-puff process.
To further support above qualitative observations, residue oil distributions in different pore sizes as well as in the front and back part of the core are quantitatively listed in Table 3 based on the NMR T2 amplitude results. It is clearly observed from the third line of the table that the T2 spectra amplitude for the entire core (7234.4) is accurately the sum of the values for the front part (2864.9) and the back part (4388.0) of the core with the deviation less than 0.2%, thereby validating accuracy of the NMR measurements. The core scale residue oil distribution could also be obtained based on the T2 amplitude sum data in the third line, showing the front part contains 39.6% while the back part of the core contains 61.4% of the residue oil amount. That is, more oil in the front part of the core is produced with the CO2 huff-n-puff processes.
Entire core
Front part of the core
Back part of the core
Small pores (0.1–10 ms)
Large pores (10–300 ms)
Small pores (0.1–10 ms)
Large pores (10–300 ms)
Small pores (0.1–10 ms)
Large pores (10–300 ms)
Sum of T2 amplitude (core scale residue oil percentage)
2617.4
4617.0
1395.9
1469.0
1353.7
3034.3
7234.4 (100%)
2864.9 (39.6%)
4388.0 (60.4%)
Pore scale residue oil Percentage
36.2%
63.8%
48.7%
51.3%
30.9%
69.1%
In addition, based on the T2 spectra values in small size pores (0.1–10 ms) and in large size pores (10–300 ms), the pore scale residue oil distribution could also be determined. As listed in the fourth line of the table, the percentage of residue oil in large pores in the front part of the core (51.3%) is obviously lower than that in back part of the core (69.1%), which indicates the oil in large pores in the front part of core is more effectively mobilized with one round of CO2 huff-n-puff process.
3.2.2 Soaking time of 1 day
Fig. 5 shows the NMR measurement test results for Sample E2, in which the huff-n-puff process was performed for a period of 1 day.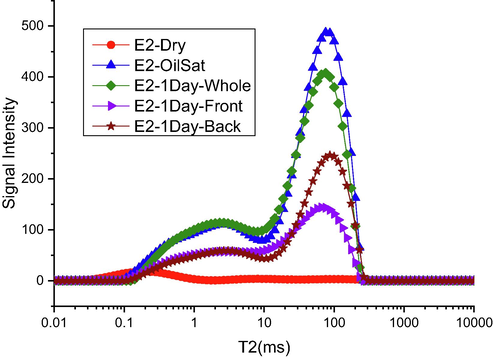
NMR test results for the entire core, front half and back half of the core after 1 day’s huff-n-puff process.
It is clearly seen from the figure that when the core is saturated with oil, the NMR signal is the strongest. When the huff and puff is over, the NMR signal decreases obviously in the area of higher T2 spectrum, which indicates that the crude oil in the large pore space of the core has been produced obviously. While the NMR signal in the area of smaller T2 spectrum is not significantly different from that in the saturated core, which indicates that a 1-day ScCO2 huff and puff operation does not extract the oil phase in the small pores of the low permeability core. Also shown in the figure are the NMR test results of the front half and the back half of the core. The higher NMR intensity values for the back half in comparison with the front half of the core indicates that the huff and puff operation has effectively produced the oil in the front core, while left a considerable part of the oil in the rear part of the core. This result is similar to the results displayed in Fig. 4 for the 5-day huff and puff process.
To quantitatively determine the residue oil distribution in various pore sizes as well as along the length scale, Table 4 lists the NMR T2 spectra analysis results. Again, the NMR measurement accuracy is validated based on the good agreement (with deviation less than 1.5%) of the T2 spectra amplitude for the entire core (8369.1) and the sum of the values for the front part (3629.0) and the back part (4620.2) of the core. The core scale residue oil distribution, which is obtained based on the T2 amplitude sum data in the third line, shows the front part contains 43.4% while the back part of the core contains 56.6% of the residue oil amount, indicating more oil in the front part of the core is produced with the CO2 huff-n-puff processes. The pore scale residue oil distribution is determined based on the T2 spectra values in small size pores (0.1–10 ms) and in large size pores (10–300 ms). As listed in the fourth line of the table, the percentage of residue oil in large pores in front part of the core (55.4%) is obviously lower than that in back part of the core (71.0%), indicating the oil in large pores in the front part of core is more effectively mobilized after 1 day’s CO2 huff-n-puff process.
Entire core
Front part of the core
Back part of the core
Small pores (0.1–10 ms)
Large pores (10–300 ms)
Small pores (0.1–10 ms)
Large pores (10–300 ms)
Small pores (0.1–10 ms)
Large pores (10–300 ms)
Sum of T2 amplitude (core scale residue oil percentage)
2678.6
5690.5
1457.7
2171.2
1338.0
3282.2
8369.1 (100%)
3629.0 (43.4%)
4620.2 (55.2%)
Pore scale residue oil Percentage
32.0%
68.0%
44.6%
55.4%
29.0%
71.0%
3.3 Discussions
Fig. 6 compares the NMR test results of the whole length of the core, the front half of the core and the back half of the core after 1-day and 5-days ScCO2 huff-n-puff processes. It is found the signal in front part of E1 core is the weakest after 5-day huff and puff process, indicating the extended huff and puff time can significantly improve the oil recovery efficiency from the front part of core.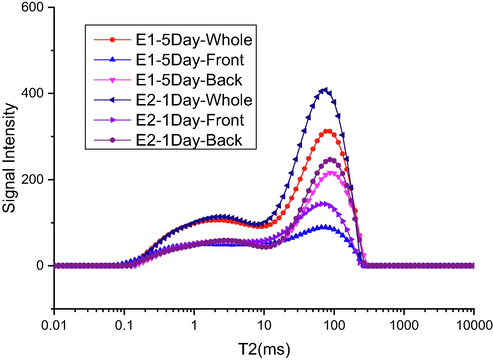
NMR result comparisons for 1-day and 5-days ScCO2 huff-n-puff processes.
Table 5 quantitatively lists the residue oil percentage in small size pores (0.1–10 ms) and in large size pores (10 ∼ 300 ms). It is deduced that after 5 days’ soaking period, more oil in large size pore are produced compared with 1 day’s soaking process in the entire core scale. In addition, as the residue oil percentage in large size pores in front part of the core after 5 days’ soaking time (51.3%) are obviously lower than that after 1 day’s soaking process, it could be concluded that more oil in large size pores in the front part of the core is mobilized with the extend soaking period.
Entire core
Front part of the core
Back part of the core
Small pores (0.1–10 ms)
Large pores (10–300 ms)
Small pores (0.1–10 ms)
Large pores (10–300 ms)
Small pores (0.1–10 ms)
Large pores (10–300 ms)
5 days’ soaking period
36.2%
63.8%
48.7%
51.3%
30.9%
69.1%
1 day’s soaking period
32.0%
68.0%
44.6%
55.4%
29.0%
71.0%
The mechanism behind the increased oil recovery rate for longer period of soaking time lies in the molecular diffusion which occurs between CO2 and the contact oil phase. The diffusion of CO2 into oil controls the rate of oil properties variations therefore particularly for CO2 Huff and Puff processes, the soaking time needs to be optimized properly. Accordingly, novel measurement techniques (Czarnota et al., 2018; Du et al., 2019) as well as the in-depth investigations on molecular diffusion, or mass transfer, characteristics between the oil and CO2 have attracted lots of research interests. Li et al. (Li et al., 2016) measured the diffusion coefficients of scCO2 in oil-saturated low permeability cores and found with pressure and temperature increase, the increase on CO2 diffusion rate gradually slowed down with the extended soaking time. Li et al. (Li et al., 2018) clarified the impact of the permeability on the CO2 diffusion coefficient, and declared the low permeability of the core could retard the molecular diffusion process at the range of 0.1–10 mD. Rezk et al. (Rezk and Foroozesh, 2019) studied the effect of CO2 mass transfer on oil properties change rates and reported the time for 30% oil swell rate decreased dramatically from 10 h to 2 h when the contact CO2 changed from gas state to supercritical state. Janiga et al. (Janiga et al., 2020) measured the oil-CO2 diffusion coefficient and found a larger concentration gradient of CO2 exists near CO2-oil interface at early stage of the test. Only after soaking for a certain period of time, the CO2 concentration curve becomes flat with the gradual CO2 dissolution in oil phase by molecular diffusion. Even under the miscible conditions, the soaking time still acts as an important parameter to the oil recovery efficiency. Wang et al. (Wang et al., 2021) studied the oil production performance in a miscible CO2 soaking-alternating-gas (CO2-SAG) flooding process in low permeability sandstone and they reported much higher oil recovery factor of 72.8% after the CO2-SAG flooding in comparison with 61.8% for the simple miscible CO2 flooding process. It is concluded, therefore, longer soaking time could lead to higher extent of molecular diffusion of ScCO2 to the oil phase, thus leads to higher oil recovery rate for ScCO2 huff-n-puff processes in low permeable cores.
4 Conclusion
In this paper, ScCO2 huff-n-puff processes were carried out in two low permeable sandstone cores of 1.7mD and 2.6mD under the conditions of 50 °C and 25 MPa. To understand the oil recovery mechanism of the huff-n-puff process, both cores were cut half after the completion of the process and the oil distribution in the entire core as well as the front half (the part close to the CO2 injection and discharge hole) and back half of the core were scrutinized with help of the NMR measurement. Lists as follows are the obtained conclusion marks,
-
(1)
The oil recovery rate after 5 days soaking time is 17.2%, which is higher than 15.2% after 1 day’s huff-n-puff process. It is found the longer soaking time could explore more oil from the low permeable cores at the first cycle of huff-n-puff process.
-
(2)
NMR measurement results show that more oil in the large pore space of the core is produced after the completion of ScCO2 huff-n-puff process, while the oil in the space with smaller pore-throat sizes is rarely mobilized. The NMR results further show that the oil content in the large pores in the front part is obviously lower than that of the back part of the core, indicating a round of huff and puff operation mainly produces the oil in the large pore spaces from the front part of the core, while leave a considerable part of the oil in the rear part of the core uneffectively mobilized
-
(3)
Extended huff and puff operation time can improve the oil recovery rate in the front part of the core, but shows little effect on oil recovery efficiency in the rear part of the core.
CRediT authorship contribution statement
Dongxing Du: Conceptualization, Methodology, Writing – original draft. Chaofan Li: Investigation. Xiakai Song: Investigation. Qingjie Liu: Conceptualization. Nianhao Ma: Writing – review & editing. Xinrong Wang: Investigation. Yinjie Shen: Investigation. Yingge Li: Conceptualization, Formal analysis, Writing – review & editing.
Acknowledgement
The paper is finished under the supports of Natural Science Foundation of Shandong Province (No. ZR2020ME179) and the research foundation from Research Institute of Petroleum Exploration and Development of China National Petroleum Company (RIPED.CN-2020-JS-255).
Declaration of Competing Interest
The authors declare that they have no known competing financial interests or personal relationships that could have appeared to influence the work reported in this paper.
References
- Identification of oil reservoirs suitable for CO2-EOR and CO2 storage (CCUS) using reserves databases, with application to Alberta, Canada. Int. J. Greenhouse Gas Control. 2016;44:152-165.
- [CrossRef] [Google Scholar]
- Effect of fracture on production characteristics and oil distribution during CO2 huff-n-puff under tight and low-permeability conditions. Fuel. 2019;246(November 2018):117-125.
- [CrossRef] [Google Scholar]
- Physicochemical Characterization of Produced Oils and Gases in Immiscible and Miscible CO2 Flooding Processes. Energy Fuels. 2013;27:440-453.
- [CrossRef] [Google Scholar]
- Effect of displacement rates on fluid distributions and dynamics during water flooding in tight oil sandstone cores from nuclear magnetic resonance (NMR) J. Petrol. Sci. Eng.. 2020;184(September 2019):106588.
- [CrossRef] [Google Scholar]
- Minimum miscibility pressure measurement for CO2 and oil using rapid pressure increase method. J. CO2 Util.. 2017;21(April):156-161.
- [CrossRef] [Google Scholar]
- Determination of minimum miscibility pressure for CO2 and oil system using acoustically monitored separator. J. CO2 Util.. 2017;17:32-36.
- [CrossRef] [Google Scholar]
- Acoustic investigation of CO2 mass transfer into oil phase for vapor extraction process under reservoir conditions. Int. J. Heat Mass Transf.. 2018;127:430-437.
- [CrossRef] [Google Scholar]
- Experimental study on EOR by CO2 huff-n-puff and CO2 flooding in tight conglomerate reservoirs with pore scale. Chem. Eng. Res. Des.. 2020;156:425-432.
- [CrossRef] [Google Scholar]
- Determination of diffusion coefficient of a miscible CO2/n-hexadecane system with Dynamic Pendant Drop Volume Analysis (DPDVA) technique. Int. J. Heat Mass Transf.. 2019;139:982-989.
- [CrossRef] [Google Scholar]
- Laboratory study on oil recovery characteristics of carbonated water huff-n-puff process in tight cores under reservoir condition. Arabian J. Chem.. 2021;14(6):103192
- [CrossRef] [Google Scholar]
- Determination of movable fluid percentage and movable fluid porosity in ultra-low permeability sandstone using nuclear magnetic resonance (NMR) technique. J. Petrol. Sci. Eng.. 2015;133:258-267.
- [CrossRef] [Google Scholar]
- A rapid method for determining CO2/oil MMP and visual observations of CO2/oil interactions at reservoir conditions. Energy Procedia. 2014;63:7724-7731.
- [CrossRef] [Google Scholar]
- Development of the theory and technology for low permeability reservoirs in China. Pet. Explor. Dev.. 2018;45(4):685-697.
- [CrossRef] [Google Scholar]
- Huff and puff process optimization in micro scale by coupling laboratory experiment and numerical simulation. Fuel. 2018;224:289-301.
- [CrossRef] [Google Scholar]
- Measurement of Oil-CO2 diffusion coefficient using pulse-echo method for pressure-volume decay approach under reservoir conditions. J. Petrol. Sci. Eng.. 2020;185:106636
- [CrossRef] [Google Scholar]
- The development of Carbon Capture Utilization and Storage (CCUS) research in China : A bibliometric perspective. Renew. Sustain. Energy Rev.. 2021;138(December 2019):110521.
- [CrossRef] [Google Scholar]
- China’s carbon capture, utilization and storage (CCUS) policy : A critical review. Renew. Sustain. Energy Rev.. 2020;119(November 2019) 109601
- [Google Scholar]
- Evaluation of carbon dioxide storage and miscible gas EOR in shale oil reservoirs. Fuel. 2018;241:1223-1235.
- [CrossRef] [Google Scholar]
- Optimization of CCUS supply chains in the UK : A strategic role for emissions reduction. Chem. Eng. Res. Des.. 2020;155:211-228.
- [CrossRef] [Google Scholar]
- Diffusion coefficients of supercritical CO2 in oil-saturated cores under low permeability reservoir conditions. J. CO2 Util.. 2016;14:47-60.
- [CrossRef] [Google Scholar]
- The effect of permeability on supercritical CO2 diffusion coefficient and determination of diffusive tortuosity of porous media under reservoir conditions. J. CO2 Util.. 2018;28(September):1-14.
- [CrossRef] [Google Scholar]
- New insight into CO2 huff-n-puff process for extraheavy oil recovery via viscosity reducer agents : An experimental study. Journal of CO2 Utilization. 2020;42(September):101312
- [CrossRef] [Google Scholar]
- A comparative study of CO2 and N2 huff-n-puff EOR performance in shale oil production. J. Petrol. Sci. Eng.. 2019;181(April):106174
- [CrossRef] [Google Scholar]
- Monitoring of CO2 and CO2 oil-based foam flooding processes in fractured low-permeability cores using nuclear magnetic resonance (NMR) Fuel. 2020;263(November 2019)
- [CrossRef] [Google Scholar]
- Enhanced heavy oil recovery via surfactant-assisted CO2 huff-n-puff processes. J. Petrol. Sci. Eng.. 2017;159(February):25-34.
- [CrossRef] [Google Scholar]
- Wettability characterization of low-permeability reservoirs using nuclear magnetic resonance : An experimental study. J. Petrol. Sci. Eng.. 2019;178(January 2018):121-132.
- [CrossRef] [Google Scholar]
- Estimation of minimum miscibility pressure (MMP) of CO2 and liquid n-alkane systems using an improved MRI technique. Magn. Reson. Imaging. 2016;34(2):97-104.
- [CrossRef] [Google Scholar]
- Application of nuclear magnetic resonance (NMR) in coalbed methane and shale reservoirs : A review. Int. J. Coal Geol.. 2020;218(August 2019)
- [CrossRef] [Google Scholar]
- Enhanced light oil recovery from tight formations through CO2 huff ‘ n ’ puff processes. Fuel. 2015;154:35-44.
- [CrossRef] [Google Scholar]
- Experimental investigation on the influence factors and oil production distribution in different pore sizes during CO2 huff-n-puff in an ultra-high- pressure tight oil reservoir. J. Petrol. Sci. Eng.. 2019;178(March):1155-1163.
- [CrossRef] [Google Scholar]
- Quantifying CO2 storage efficiency factors in hydrocarbon reservoirs: A detailed look at CO2 enhanced oil recovery. Int. J. Greenhouse Gas Control. 2017;69:41-51.
- [CrossRef] [Google Scholar]
- Experimental investigation on the operation parameters of carbon dioxide huff-n-puff process in ultra low permeability oil reservoirs. J. Petrol. Sci. Eng.. 2019;174(March 2018):903-912.
- [CrossRef] [Google Scholar]
- Effect of CO2 mass transfer on rate of oil properties changes : Application to CO2 -EOR projects. J. Petrol. Sci. Eng.. 2019;180(May):298-309.
- [CrossRef] [Google Scholar]
- Performance of Silica Nanoparticles in CO2 Foam for EOR and CCUS at Tough Reservoir Conditions. SPE J.. 2020;25(1):1-10.
- [CrossRef] [Google Scholar]
- Laboratory evaluation of the CO2 huff-n-puff process for heavy oil reservoirs. J. Can. Pet. Technol.. 1984;23:29-36.
- [CrossRef] [Google Scholar]
- Critical review of field EOR projects in shale and tight reservoirs. J. Petrol. Sci. Eng.. 2017;159(February):654-665.
- [CrossRef] [Google Scholar]
- Progress in Nuclear Magnetic Resonance Spectroscopy NMR application in unconventional shale reservoirs – A new porous media research frontier. Prog. Nucl. Magn. Reson. Spectrosc.. 2019;112–113:17-33.
- [CrossRef] [Google Scholar]
- Distribution and potential of global oil and gas resources. Pet. Explor. Dev.. 2018;45(4):779-789.
- [CrossRef] [Google Scholar]
- Oil production performance and reservoir damage distribution of miscible CO2 soaking-alternating-gas (CO2-SAG) flooding in low permeability heterogeneous sandstone reservoirs. J. Petrol. Sci. Eng.. 2021;204(February):108741
- [Google Scholar]
- Pore-scale monitoring of CO2 and N2 flooding processes in a tight formation under reservoir conditions using nuclear magnetic resonance (NMR): A case study. Fuel. 2019;246(December 2018):34-41.
- [CrossRef] [Google Scholar]
- Oil recovery and compositional change of CO2 huff-n-puff and continuous injection modes in a variety of dual-permeability tight matrix-fracture models. Fuel. 2020;276(May):117939
- [CrossRef] [Google Scholar]
- Nuclear Magnetic Resonance (NMR) mapping of remaining oil distribution during sequential rate waterflooding processes for improving oil recovery. J. Petrol. Sci. Eng.. 2020;190:107102
- [CrossRef] [Google Scholar]
- Evaluation of CO2 enhanced oil recovery and CO2 storage potential in oil reservoirs of Bohai Bay Basin, China. Int. J. Greenhouse Gas Control. 2017;65:85-98.
- [CrossRef] [Google Scholar]
- CO2 Utilization for Enhance Oil on Recovery with CO2 Utilization for Enhance Oil Recovery with Process in Depleting Heterogeneous Reservoir. Energy Procedia. 2017;141:184-188.
- [CrossRef] [Google Scholar]
- Combination of a chemical blend with CO2 huff-n-puff for enhanced oil recovery in oil shales. J. Petrol. Sci. Eng.. 2020;194(June):107546
- [CrossRef] [Google Scholar]
- Identification of CO2 sequestration opportunities : CO2 miscible flooding guidelines. Fuel. 2019;241(July 2018):459-467.
- [CrossRef] [Google Scholar]
- Simulation study of factors affecting CO2 Huff-n-Puff process in tight oil reservoirs. J. Petrol. Sci. Eng.. 2018;163:264-269.
- [CrossRef] [Google Scholar]
- Determination of the multiple-contact minimum miscibility pressure of CO2/oil system using oil droplet volume measurement method. J. Petrol. Sci. Eng.. 2019;August:106578
- [CrossRef] [Google Scholar]
- A critical review of the CO2 huff ‘n’ puff process for enhanced heavy oil recovery. Fuel. 2018;215(August 2017):813-824.
- [CrossRef] [Google Scholar]
- Performance evaluation of CO2 flooding process in tight oil reservoir via experimental and numerical simulation studies. Fuel. 2019;236(September 2018):730-746.
- [CrossRef] [Google Scholar]
- Feasibility study of CO2 huff ‘n’puff process to enhance heavy oil recovery via long core experiments. Appl. Energy 2019
- [CrossRef] [Google Scholar]
- Performance evaluation of CO2 Huff-n-Puff and continuous CO2 injection in tight oil reservoirs. Energy. 2017;134:181-192.
- [CrossRef] [Google Scholar]


