

Translate this page into:
Exploring the mechanism and key active components of Gegen Qinlian decoction combined with XELOX in the treatment of ulcerative colitis-associated colorectal cancer based on network pharmacology and multi-omics analysis
⁎Corresponding author. lqyxm@hotmail.com (Qing Li)
-
Received: ,
Accepted: ,
This article was originally published by Elsevier and was migrated to Scientific Scholar after the change of Publisher.
Abstract
Abstract
Ulcerative colitis (UC) is an autoimmune disease with a steady increase in global prevalence and long-term susceptibility to colorectal cancer (CRC). CRC is often treated with XELOX regimen (oxaliplatin and capecitabine), which is limited by the high toxicity, many adverse reactions and intolerance of patients, thus often leading to termination of chemotherapy. Traditional Chinese medicine is effective in improving patients' clinical symptoms. Gegen Qinlian decoction (GQD) is frequently utilized in the management of UC and has the potential to treat CRC. Whereas, there are few studies on GQD in the treatment of UC-associated CRC, and the therapeutic mechanism of GQD combined with XELOX has not been fully reported. Herein, HPLC-Q-TOF-MS/MS technique was used to analyze the main chemical components of GQD. Network pharmacology was performed to unveil the critical genes and components of GQD against UC and UC-associated CRC. The detection of TNF-α, IL-1β, IL-6, VEGF, SOD, MDA and immune factors revealed that GQD played a key role in improving immune function, reducing inflammation and resisting oxidative stress. 16S rDNA sequencing technology results showed that GQD could maintain gastrointestinal homeostasis by increasing beneficial bacteria and decreasing harmful bacteria. Then, metabolomics based on HPLC-Q-TOF-MS/MS found that the combination of GQD and XELOX could significantly restore the disturbance of metabolites. Particularly, the compound-reaction-gene-enzyme network was first constructed to realize the combination of network pharmacology and metabolomics. The results showed that GQD may assist XELOX to play a synergistic anti-tumor role by regulating the key enzymes ALOX15, CYP1B1 and PTGS2 in unsaturated fatty acid metabolism. Finally, the mechanism was verified by western blot, and the key pharmacodynamic components were found by molecular docking. Overall, the current study offered fresh perspectives on both the prevention and treatment of UC to CRC as well as fresh concepts for the therapeutic application of GQD with XELOX to lessen the side effects of chemotherapy and enhance patients' quality of life.
Keywords
Ulcerative colitis
Colorectal cancer
XELOX
Gegen Qinlian decoction
Theraputic mechanism

1 Introduction
Ulcerative colitis (UC) is an autoimmune disease that mostly affects the mucosal layer of the colon and rectum (Loftus, 2005, Ordas et al., 2012). In recent years, UC is recognized as a disease that poses a threat to global health due to its recurrence (Zhu et al., 2019). Notably, prolonged UC is a risk factor of colorectal cancer (CRC) (Grivennikov, 2013, Rutter and Riddell, 2014). According to prior studies, individuals with UC had a 2.4 times higher risk of getting CRC compared to healthy population, and the risk for CRC in UC patients was around 30 % after 35 years (Eaden et al., 2001, Rogler, 2014). With a huge global prevalence (approximately 1.9 million new cases in 2020) and high mortality (0.9 million deaths in 2020), CRC is the second most common cancer in women and the third most prevalent cancer in men (Siegel et al., 2022). The transformation of UC into CRC may impose more heavy economic burden on families and society (Zhu et al., 2017). Therefore, a full understanding of the pathogenesis of UC-induced CRC is essential for the prevention and treatment of progression of disease as well as the optimization of existing treatments.
The combination therapy of oxaliplatin and capecitabine (also known as XELOX method) is one of the most commonly used chemotherapy regimens in the treatment of CRC (Shinji et al., 2022). However, XELOX therapy can produce multiple adverse reactions such as nausea, vomiting, immune function decline, and dose involvement may cause serious neurotoxicity, thereby reducing patients' tolerance and compliance, and eventually leading to the termination of chemotherapy and affecting chemotherapy efficacy (Rodriguez et al., 2017, Quidde et al., 2018). Consequently, there remains an urgent need for exploring a new chemotherapeutic synergistic drug, reducing the dose of chemotherapy drugs or shortening the chemotherapy cycle on the premise of maintaining the chemotherapy effect, in order to enhance patients' quality of life and reduce toxicity and harmful effects brought by XELOX. In clinical practice, traditional Chinese medicine is frequently used in conjunction with chemotherapy medications because of its invaluable benefits for symptom relief, immune system regulation, and overall quality of life (Luo et al., 2019, Sun et al., 2021). As a traditional Chinese medicine, Gegen Qinlian decoction (GQD) contains the following ingredients: Pueraria lobata (Willd.) Ohwi (Gegen), Scutellaria baicalensis Georgi (Huangqin), Coptis chinensis French (Huanglian) and Glycyrrhiza uralensis Fisch (Gancao). The properties of GQD include anti-inflammatory, analgesic, antiviral, antibacterial, antioxidant, and intestinal mucosa protection (Liu et al., 2019, Cao et al., 2021, Li et al., 2021a, Li et al., 2021b). For thousands of years, this conventional medication has been extensively used to treat UC and diarrhea (Xu et al., 2021). In modern research, it has also been used to treat CRC with satisfactory results (Wang et al., 2021). However, although the therapeutic effect of GQD has been reported, its molecular mechanism of action and pharmacological are still not clearly understood. Moreover, the therapeutic effect and mechanism of GQD combined with XELOX therapy have rarely been elucidated.
Network pharmacology provides potent tools for exploring the action mechanism of conventional Chinese formulations (Shi et al., 2022). In order to identify the crucial genes and components that contribute to the pathogenesis of GQD against UC and UC-associated CRC, network pharmacology was performed in the current investigation. TNF-α, IL-1β, IL-6, VEGF, SOD, MDA and immune factors detected by Elisa and flow cytometry revealed that GQD may treat UC and CRC by enhancing the immunomodulatory functions, anti-inflammatory and anti-tumor. As gastrointestinal diseases, UC and CRC can not only cause significant changes in the above indicators, but also cause disturbances in the structure of gut microbiota. Gut microbiota is a general term of microorganisms in the gut of organisms (Miyauchi et al., 2020, Zheng et al., 2020), which participate in the physiological processes such as immune and metabolic regulation and energy supply (Nishida et al., 2018). The structural imbalance of intestinal microflora often leads to numerous gastrointestinal diseases, so maintaining normal intestinal microflora is of great significance to body health (Khan et al., 2019). Accordingly, in the prevention and treatment of UC-associated CRC, altering gut microbiota and metabolites might be a promising therapeutic approach. 16S rDNA sequencing results revealed that widespread dysbiosis in the gut microbiota resulted from the development of UC to CRC, and inflammatory pathology was reduced by GQD through modifying the gut microbiota. After GQD intervention, the abundance of beneficial bacteria such as Lactobacillus was significantly increased, while the abundance of harmful bacteria such as Escherichia-Shigella was effectively inhibited, which confirmed the hypothesis that GQD could regulate body health by maintaining the homeostasis of intestinal microflora. Metabolomics studies evaluated changes in the metabolic pathway during the evolution of UC to CRC, the intervention of GQD combined with XELOX could enhance the rollback effect on differential metabolite concentrations. Spearman correlation analysis found that the changes of different bacteria genera were correlated with the improvement of metabolic indexes. This finding indicated that GQD improved the metabolic disorders such as unsaturated fatty acids by regulating intestinal microflora. Moreover, integrated analysis of metabolomics and network pharmacology predicted that GQD might assist XELOX in playing an anti-tumor role by regulating the metabolic pathway of unsaturated fatty acids through ALOX15, CYP1B1 and PTGS2, and the reliability of this hypothesis were then proved by western blot and molecular docking. Ononin, genistein, puerarin, daidzein, skullcapflavone II, baicalin, wogonoside, p-coumaric acid, coptisine, isoliquiritigenin and glyasperin A were the key active ingredients of GQD.
Taken together, network pharmacology, molecular pharmacology, high-throughput sequencing technology and metabolomics data were integrated in our study to fully confirm that GQD can prevent the transition from UC to CRC. The most important thing is that the action mechanism, pharmacodynamic effect and pharmacodynamic compositional basis of XELOX with GQD in the treatment of UC-associated CRC were systematically and deeply studied for the first time. Our current study not only paved the way for the prevention and treatment from UC to CRC, but also provided scientific basis for new clinical therapies to against CRC based on GQD.
2 Materials and methods
2.1 Reagents and drug preparation
1,2-dimethylhydrazine (DMH), 2,4,6-trinitrobenzenesulfonic acid (TNBS) were obtained from Sigma-Aldrich (St. Louis, MO, USA). Distilled water was got from Wahaha Group Co. Ltd. (Hangzhou, China). Ethanol, pentobarbital sodium and physiological saline were obtained from Yuwang Co. Ltd (Shandong, China). Methanol, formic acid and acetonitrile were purchased from Fisher Scientific (Newd Jersey, USA). The ELISA kit (TNF-α, VEGF, IL-6, SOD, IL-10, MDA, IL-1β) was purchased from Shanghai MLBio Biotechnology Co., Ltd. (Shanghai, China). Oxaliplatin and capecitabine was obtained from Qilu Pharmaceutical Co., Ltd (Shandong, China). Protein for Western blot: ALOX15 (ab244205, Abcam), CYP1B1 (ab185954, Abcam), PTGS2 (ab179800, Abcam); Secondary antibody (bs-40295G-HRP; Biomass), rapid blocking solution (Genefist, Oxfordshire, UK).
According to the prescription ratio (8:3:3:2), Pueraria lobata (Willd.) Ohwi (Gegen), Scutellaria baicalensis Georgi (Huangqin), Coptis chinensis French (Huanglian) and Glycyrrhiza uralensis Fisch (Gancao) were immersed in 8 times amount of water for 30 min. First, Pueraria lobata (Willd.) Ohwi (Gegen) was boiled for 20 min. Next, the remaining medicine was boiled (40 min) for twice and filtered through a 200-mesh screen. Then, the two filtrates were combined and concentrated under pressure at 50 ℃. GQD was administered to rats at 2.16 g/kg (low dose, equivalent to half of the dose of GQD commonly used in clinical patients) and 8.64 g/kg (high dose, equivalent to the twice dosage of GQD commonly used in clinical patients).
2.2 Animals experiment
Six-week-old Sprague-Dawley rats (n = 86, males, weighing 180–220 g) were purchased from the Laboratory Animal Center of Shenyang Pharmaceutical University. The animals were raised in a dedicated SPF standard room with a temperature of 22 ± 2 ℃, humidity of 40–60 %, and natural light and dark cycles from 7 am to 7 pm. All 86 rats were free to eat and drink for 7 days, and were deprived of water for 12 h before the experiment. The animal procedures were executed according to the SYPU Ethics Committee and carried out in line with the SYPU Guidelines for Animal Experimentation (SYPU-IACUC-S2022-07.28-201).
-
After 7 days of adaptive feeding, 6 rats were randomly selected to collect blank plasma in the EDTA tube (orbital blood collection). Then GQD was given intragastric administration (8.64 g /kg) once a day for 7 days. Plasma samples were collected (orbital blood collection) at 0.5 h, 1 h, 2 h and 4 h after the last administration for subsequent analysis.
-
The remaining rats were randomly divided into 10 groups (n = 8): (1) control; (2) UC (after anesthesia with 30 mg/kg pentobarbital sodium, rats were given enema by injecting TNBS (100 mg/kg)-50 % ethanol mixture into the anuses of the rats); (3) UL (low-dose GQD to treat UC); (4) UH (high-dose GQD to treat UC); (5) CRC (Intraperitoneal injection of 30 mg/kg DMH once a week for 13 weeks, continued to induce cancer based on UC); (6) RL (low-dose GQD for the treatment of CRC); (7) RH (high-dose GQD for the treatment of CRC); (8) XELOX (4 mg/kg Oxaliplatin intraperitoneal injection once a week and 150 mg/kg capecitabine intragastric injection once a day for CRC rats); (9) RXL (low-dose GQD combined with XELOX for the treatment of CRC); (10) RXH (high-dose GQD combined with XELOX for the treatment of CRC).
After 12 h of fasting, rats were given TNBS (100 mg/kg)-50 % ethanol enema to induce UC, UL and UH rats were given GQD intragastric administration for 7 days, and daily weight was registered. On the 7th day after modeling, the disease activity index (DAI) score was recorded. For specific scoring criteria, please refer to Table S1.
After the last dose, orbital venous blood of each group was collected in coagulant tubes and centrifuged at 4000 rpm for 10 min to collect serum samples. After the colon contents were collected, the colon was cleaned with physiological saline. Then, the colonic mucosal damage index (CMDI) was scored by observing the gross morphology of colon tissues. The scoring criteria and results were shown in Table S1. Part of colon tissues were clipped for Hematoxylin-eosin (HE) staining, and the remaining were immediately frozen at −80 ℃.
Then, CRC, RL, RH, XELOX, RXL and RXH groups were given DMH (30 mg/kg) by intraperitoneal injection once a week for 13 weeks to continue to induce CRC. The rats in RL, RH, RXL and RXH groups were given GQD, while the rats in XELOX group were given the XELOX continuously for 6 weeks. Sample collection methods were the same as above.
2.3 HE staining
Colon tissues were fixed with paraformaldehyde (4 %). More than 24 h later, paraffin was adopted for embedding and section. After dewaxing, hydration and HE staining were carried out successively. Ultimately, the slices were observed under a 200-fold microscope and photographed.
2.4 Component identification experiment
-
Preparation of GQD for the analysis of vitro components: GQD was prepared according to the prescription ratio (8:3:3:2), and the filtrate was concentrated at 50 ℃ to the relative density of 1.05. A certain volume was taken and diluted with an appropriate amount of methanol, which was equivalent to 0.1 g crude drug per 1 mL. The liquid was filtered by 0.22 μm for instrumental use.
-
Preparation of plasma samples for the analysis of components in vivo: 1 mL plasma sample mixed with 3 mL methanol, then vortexed for 3 min and centrifugated at 12,000 rpm (5 min, 4 ℃). The supernatant was dry by placed under nitrogen flow and then added with 50 μL methanol, followed by vortexed for 3 min, ultrasound and centrifugated (5 min, 12,000 rpm, 4 ℃). After that, the supernatant was separated for instrumental analysis.
The chromatographic and mass spectrum conditions were shown in Table S2-3. Then, the chemical composition of GQD were analyzed and identified using PeakView 1.2.1 (SCIEX, Framingham, MA, USA) software.
2.5 Network pharmacology analysis
The target of the components in plasma was predicted based on SwissTargetPrediction website (https://www.swisstargetprediction.ch). To obtain the key targets of components in plasma, SMILES strings of these components in vivo were entered into SwissTargetPrediction (https://www.swisstargetprediction.ch), from which possible targets for these compounds were returned based on predicted probability ranking order. Meanwhile, the genes of UC and CRC were obtained on Therapeutic Target Database (TTD, https://db.idrblab.net/ttd/) and GeneCards (https://www.genecards.org), with “Ulcerative colitis” and “Colorectal cancer” as keywords. Venny (https://www.liuxiaoyuyuan.cn/) website was used to compare the differential genes of diseases and the targets of the components of GQD in plasma, and the intersection targets were selected. A protein–protein interaction (PPI) network was draw through String database (https://cn.string-db.org/). Finally, the “herb-component-target” network was constructed by Cytoscape 3.10.0 (UC, San Diego, La Jolla, CA, USA).
2.6 Elisa assay
The expression levels of VEGF, SOD, TNF-α, IL-1β, MDA, IL-6 and IL-10 in colon and serum were quantitatively determined by ELISA kit according to the product description. First, 50 μL standard products in kit with different concentrations and 50 μL samples to be tested were added in each hole, and nothing is added to the blank hole. Next, each standard and sample holes were added with 100 μL of HRP labeled detection antibody and incubated in a 37 ℃ incubator for 60 min, and then washed with washing buffer for 3 times. 50 μL substrate A and 50 μL B were added to each hole. After incubation at 37 ℃ for 15 min, 50 μL termination solution was added to each hole successively. Finally, OD value of each hole was measured at 450 nm by enzyme-labeled instrument.
2.7 Flow cytometry detected of T lymphocytes (CD4+ and CD8+)
First, 0.5 mL blood was diluted to 3 mL and placed on 3 mL lymphocyte separation solution, and centrifuge at 400 g (20 min). The lymphocyte layer was cleaned with cleaning solution centrifuged for 10 min (250 g). Next, the precipitation was mixed with RBC lysate (3 mL) and incubated on ice (10 min), followed by terminated with PBS. The underlying cells were retained after centrifugation. PBS was used for suspending the cells, and then 0.5 μg FITC-CD3+, 0.25 μg APC-CD4+ and 0.25 μg PE-CD8+ were added and stained at 4 ℃ for 1 h away from light. 500 μL PBS was added and centrifuged 250 g for 10 min for cleaning. The underlying cells were re-suspended with PBS and transferred to the flow tube. Flow cytometry was adopted for detecting and calculating the proportions of CD4+ and CD8+ T lymphocytes.
2.8 Intestinal microflora detection and data processing methods
DNA was extracted from every 0.1 g of frozen colon contents and genomic DNA integrity (including purity and concentration) was examined by 1 % agar-gel electrophoresis. The PCR amplification system was 20 μL, and the V3-V4 region was amplified using the universal primers 338F (5′-ACTCCTACGGGAGGCAGCAG-3′) and 806R (5′-GGACTACHVGGGTWTCTAAT-3′). Next, the products were identified, purified and quantified. Sequencing was then performed on the Illumina MiSeq PE250 system. Trimmomatic (v0.33) was used to filter the sequenced Raw Reads. And cutadapt 1.9.1 software was used to identify and remove primer sequences, then Clean Reads without primer sequences were obtained. After a series of preprocessing, the original data were obtained with high quality sequences, and then OUT clustering and species annotation were carried out. According to the annotation results, distribution histogram of the top 10 community in abundance at different levels were drawn by QIIME2 (https://qiime2.org/). In addition, linear discriminant analysis (LDA, https://huttenhower.sph.harvard.edu/lefse/) was used to estimate the influence of microflora abundance on the difference effect. Finally, the significance analysis of inter-group differences (Metastats, https://metastats.cbcb.umd.edu/) was used to measure the differences in microflora abundance composition in disease group, control group and drug intervention groups, and to find biomarkers with statistical differences.
2.9 Metabolomics detection and data processing methods
1 mL of physiological saline and 100 mg of colon tissue were combined and homogenized for 3 min. Then, 500 μL of homogenate supernatant was measured and added with 10 μL internal standard solution (10 µg/mL of L-2-Chlorophenylalanine and heptadecanoic acid) and 1.5 mL methanol. The mixture was vortexed for 3 min before being centrifuged (12,000 rpm for 10 min at 4 °C). The residue dried by nitrogen was then redissolved with 100 μL methanol, swirled for 3 min, ultrasonically for 3 min, then centrifuged (5 min, 12,000 rpm). The supernatant was collected for instrument analysis and detailed chromatographic and mass spectrum conditions were presented in the Table S4-5.
The original data was imported into XCMS (https://xcmsonline.scripps.edu/) platform for peak identification, peak matching and other processing. Principal component analysis (PCA) was performed on the processed data using SIMCA-P 14.0 (Umetrics, Malmo, Sweden), followed by orthogonal partial least squares discriminant analysis (OPLS-DA) and 200 permutation tests. Subsequently, a combination of multiple indicators was used to determine the differential metabolites. Subsequently, based on the precise mass/charge ratio and MS/MS information provided by HPLC-Q-TOF-MS/MS, the differential metabolites were identified using HMDB (https://hmdb.ca/), MetDNA (https://metdna.zhulab.cn/) and Mzcloud (https://www.mzcloud.org) databases. Then, MetaboAnalyst (https://www.metabo-analyst.ca/) platform was used for the analysis of KEGG pathway enrichment of differential metabolites. In addition, Spearman analysis between differential microflora and metabolites were conducted and visualized by heatmap. Finally, Metscape was used to obtain compound-reaction-enzyme-gene interaction networks to realize integrated analysis of network pharmacology and metabolomics.
2.10 Western blot analysis of crucial target proteins
Using the Pierce™BCA Protein Quantification Kit (Thermo, San Jose, CA, USA), the total proteins in the colon tissues were measured. Colon samples were diluted and added to 5 × protein loading buffer (Epizyme, Shanghai, China) to achieve a final protein concentration of 4 g/L (the volume ratio of samples to loading buffer was 4:1). For further examination, all samples were then denatured for 10 min (100 °C). After adding 2.5 μL of marker (Fisher, San Jose, CA, USA), 40 μg samples were added, sodium dodecyl sulfate–polyacrylamide gel electrophoresis from 60 V to 110 V were carried out. Then, the electric transfer was performed at 240 mA. Membranes were then blocked for 30 min using blocking solution (Genefist, Oxfordshire, UK), and then eluted for 3 times with TBST (Solarbio, Beijing, China). Next, the bands were incubated in ALOX15 (1:1000), CYP1B1 (1:5000), PTGS2 (1:1000) and β-actin (colon loading control, 1:1000) primary antibodies overnight at 4 ℃. Then, the protein bands were re-elution of TBST for 3 times, followed by incubated with 1:5000 secondary antibodies (bs-40295G-HRP; Biomass) away from light for 1 h. After coated with ECL developer solution evenly (US Everbright, Suzhou, China), the target bands were visualized by Tanon 5200 Multi fully automated chemiluminescence image analysis system (Tanon, Shanghai, China). Finally, ImageJ (Rawak Software Inc., Stuttgart, Germany) software was utilized for the purpose of quantification.
2.11 Molecular docking
The protein files of ALOX15 (PDB: 2p0m), CYP1B1 (PDB: 3 pm0) and PTGS2 (5kir) were acquired from the RCSB PDB protein Crystal Structure database (https://www.pdbus.org/). PyMOL 2.4 (PyMOL software, Schrödinger, NewYork, NY, USA) was applied to remove water and ligands. AutoDock 4.2.6 (AutoDock software, Scripps Research, La Jolla, CA, USA) was used for hydrogenation and charging. Mol2 structures of key pharmacodynamic ingredients were then obtained from TCMSP (https://old.tcmsp-e.com/tcmsp.php), and the two receptors were semi-flexibly docked with the active ingredients by AutoDock 4.2.6 (AutoDock software, Scripps Research, La Jolla, CA, USA). In the end, PyMOL 2.4 (PyMOL software, Schrodinger, NY, USA) was used to visualize the molecular docking results.
2.12 Statistical analysis
All calculated experimental values were presented as mean ± SD. Statistical analysis was conducted with Student’s t-test using SPSS 26.0 (SPSS software, SourceForge, San Diego, CA, USA).
3 Results
3.1 Composition identification results of GQD in vitro and in vivo
Through analysis of the fragmentation pathways obtained from literature sources and public data, as well as database matching, comparison of mass accuracy, isotope patterns, and retention times of reference standards, 93 and 34 compounds in GQD were preliminarily identified in the positive and negative ion mode, respectively. And a total of 35 components in vivo were detected in GQD. The total ion chromatograms (TICs) were shown in Fig. S1. The specific information of each chemical component was shown in Table 1.
Components in vitro of GQD
No.
Identification
Formula
Found At Mass (m/z)
Ion adduction
Error/ppm
Rt (min)
Main product Ions (m/z, Da)
1
L-tryptophan
C11H12N2O2
205.0962
[M + H]+
−4.6
11.57
91.0546, 188.0697
2
Sucrose
C12H22O11
365.1046
[M+Na]+
−2.2
4.00
185.0406, 203.0513
3
Daidzein
C15H10O4
255.0649
[M + H]+
−1.1
39.22
91.0545, 137.0218, 199.0735, 227.0681, 237.0523
4
7,8,4′-Trihydroxyisoflavone
C15H10O5
271.05972
[M + H]+
−1.4
45.89
169.0119, 253.0483
5
daidzein-4′-O-glucuronide
C21H18O10
431.09562
[M + H]+
−3.8
40.32
255.0538, 269.0766
6
Puerarin
C21H20O9
417.11726
[M + H]+
−1.8
25.70
267.0634, 297.0739, 351.0849, 381.0953, 399.1055
7
3′-Methoxypuerarin
C22H22O10
447.12684
[M + H]+
−3.9
26.45
411.1020, 429.1116
8
Mirificin
C26H28O13
549.15779
[M + H]+
−4.5
26.71
297.0735, 399.1048, 417.1150
9
Chrysin
C15H10O4
255.0649
[M + H]+
−1.1
39.22
137.0218, 153.0684
10
Norwogonin
C15H10O5
270.0528
[M + H]+
−1.0
36.93
123.0068, 169.0119, 253.0483
11
Baicalein
C15H10O5
271.0594
[M + H]+
−0.7
31.31
169.0119, 253.0483
12
2′,3,5,6′,7-Pentahydroxyflavone
C15H10O7
302.0427
[M + H]+
0.0
22.75
153.0158, 207.0275, 229.0476
13
quercetin
C15H10O7
303.0499
[M + H]+
0.0
22.75
229.0925, 257.0797
14
Baicalein II
C16H12O6
301.07003
[M + H]+
−2.1
45.87
286.0458, 301.0686
15
Dihydrooroxylin A
C16H14O5
287.0907
[M + H]+
−2.4
41.31
168.0044, 183.0280, 287.0895
16
Scutellaria flavonoids I
C17H14O6
315.0855
[M + H]+
−2.6
50.38
286.0784, 285.0748
17
5,7,2′,5′-Tetrahydroxy-8,6′-dimethoxyflavone
C17H14O8
347.07529
[M + H]+
−2.5
38.43
314.0404, 332.0511
18
Tenaxin I
C18H16O7
345.09596
[M + H]+
−2.7
49.97
315.0483, 330.0719
19
Skullcapflavone II
C19H18O8
375.10594
[M + H]+
−4.0
50.48
327.0474, 345.0571, 360.0815
20
Chrysin-7-O-glucuronide
C21H18O10
431.09562
[M + H]+
−3.8
40.32
255.0685, 308.9824
21
Baicalin
C21H18O11
447.09054
[M + H]+
−3.7
36.31
271.0583, 271.0379, 271.0594
22
Dihydrobaicalin
C21H20O11
449.10608
[M + H]+
−3.9
36.68
131.0481, 169.0119, 273.0734
23
Chrysin-8-C-glucoside
C21H20O9
417.11726
[M + H]+
−1.8
25.70
267.0740, 293.1011,307.0919
24
Wogonoside
C22H20O11
461.10572
[M + H]+
−4.6
41.54
285.0746, 270.0501, 285.0739
25
5,7,2′-trihydroxy-6-methoxyflavone 7-O-glucuronide
C22H20O12
477.10107
[M + H]+
−3.5
39.11
286.0485, 301.0688
26
Isoscutellarein8-O-D-glucuronate
C24H24O12
505.13272
[M + H]+
−2.6
35.35
127.0376, 137.0221, 257.0791
27
Tetracosane
C24H5O
310.0413
[M + H]+
−0.1
23.86
71.0188
28
Amoenin A
C27H34O14
583.19985
[M + H]+
−3.9
30.59
85.0281, 105.0697, 133.0634, 151.0365, 193.0488, 259.0946, 367.1162
29
Mullein glycoside
C29H36O15
625.21013
[M + H]+
−4.1
32.47
163.0374, 273.0742, 607.1372
30
Keratoside D
C31H40O15
653.24124
[M + H]+
−4.2
38.05
85.0304, 485.1510, 653.2460
31
P-hydroxybenzoic acid
C7H6O3
139.0387
[M + H]+
−2.0
14.54
56.9658, 65.0382, 80.0493
32
2,3-dihydrobenzofuran
C8H8O
121.06443
[M + H]+
−3.0
5.56
91.0557, 92.0242, 119.0349
33
2-methoxy-4-vinyl phenol
C9H10O2
151.07479
[M + H]+
−3.8
6.64
77.0400, 137.0430
34
5-hydroxycoumarin
C9H6O3
163.03883
[M + H]+
−0.9
19.14
51.0273, 135.0409, 163.0396
35
Transcaffeic acid
C9H8O4
181.04958
[M + H]+
0.2
38.77
153.0570, 181.0465
36
Ferulic acid
C10H10O4
195.06469
[M + H]+
−2.5
24.90
145.0367, 177.0530
37
Noroxyhydrastinine
C10H9NO3
192.06562
[M + H]+
0.5
31.41
134.0586, 149.0574
38
Cinnamic acid, 3,4-dimethoxy- (8CI)
C11H12O4
209.08102
[M + H]+
0.9
35.17
69.9853, 129.9953, 148.9615
39
Corydaldine
C11H13NO3
208.09661
[M + H]+
−1.0
30.96
77.0386, 91.0518, 105.0702
40
Moupinamide
C18H19NO4
314.13852
[M + H]+
−0.5
40.84
117.0325, 121.0640, 145.0275, 177.0518
41
Coptisine
C19H13NO4
320.09133
[M + H]+
−1.3
35.85
262.0833, 292.0926, 291.0888
42
Thalifendine
C19H15NO4
322.10664
[M + H]+
−2.3
32.89
251.0888, 279.0838, 307.0808
43
Groenlandicine
C19H15NO4
322.10664
[M + H]+
−2.3
32.89
279.0867, 307.0811
44
DeMethyleneberberine
C19H17NO4
324.12201
[M + H]+
−3.2
32.44
280.0948, 294.0736, 309.0963
45
Berberine
C20H17NO4
336.12194
[M + H]+
−3.2
39.68
278.0783, 292.0939, 306.0732, 320.0886
46
8-O-Berberine
C20H17NO5
352.11678
[M + H]+
−3.3
33.30
308.0901, 322.0695, 336.0844
47
Jatrorrizine
C20H19NO4
338.13732
[M + H]+
−4.0
35.66
294.1100, 308.0900, 322.1048
48
(R)-Canadine
C20H21NO4
340.15343
[M + H]+
−2.7
30.70
308.1263, 309.0980, 325.1284
49
Palmatine
C21H21NO4
352.15339
[M + H]+
−2.7
39.40
294.1087, 309.1295, 336.1092, 337.1239
50
Limonin
C26H30O8
471.20235
[M + H]+
2.1
19.85
274.1142, 471.1838
51
Acaciin
C28H32O14
593.18412
[M + H]+
−4.0
30.69
365.1005, 575.1720, 593.1236
52
p-coumaric acid
C9H8O3
165.05429
[M + H]+
−2.0
5.56
77.0393, 91.0537, 95.0498, 119.0476
53
Cis-Caffeic acid
C9H8O4
181.04958
[M + H]+
0.2
38.77
147.0654, 163.0591
54
Glyzaglabrin
C16H10O6
299.05517
[M + H]+
0.5
39.00
91.0540, 119.0511, 245.0380, 271.0580
55
HMO/isoformononetin
C16H12O4
269.08029
[M + H]+
−2.0
47.71
237.0524, 254.0555
56
Vestitol
C16H16O4
273.11186
[M + H]+
−1.0
19.85
137.0587, 149.0601
57
Glabranin
C20H20O4
325.14245
[M + H]+
−3.0
52.59
123.0455, 189.0912, 325.1167
58
Sigmoidin-B
C20H20O6
357.1332
[M + H]+
−0.2
51.01
127.0379, 147.0437, 175.0380, 357.1324
59
Vitexin
C21H20O10
433.11183
[M + H]+
−2.5
21.44
283.0586, 313.0686, 337.0691
60
Astragalin
C21H20O11
449.10608
[M + H]+
−3.9
36.68
273.0740, 274.0778, 449.1052, 450.1101
61
Gancaonin I
C21H22O5
355.15282
[M + H]+
−3.3
52.46
271.0479, 299.0538
62
Liquiritin
C21H22O9
419.13211
[M + H]+
−3.7
37.09
137.0226, 147.0431, 239.0680, 257.0790
63
Isoononin
C22H22O9
431.13225
[M + H]+
−3.3
35.65
256.0621, 269.0794
64
Isoschaftoside
C26H28O14
565.15327
[M + H]+
−3.4
29.40
447.1256, 565.1514, 566.1551
65
Kanzonol H
C26H32O5
425.23265
[M + H]+
0.9
55.69
351.1212, 369.1290, 425.1926
66
Liquiritigenin
C15H12O4
257.08015
[M + H]+
−2.7
31.98
91.0538, 119.0474, 137.0212
67
Isoliquiritigenin
C15H12O4
257.08015
[M + H]+
−2.7
31.98
137.0218
68
Naringenin
C15H12O5
273.07556
[M + H]+
−0.7
36.68
131.0477, 271.0497, 273.0755
69
Formononetin
C16H12O4
269.08029
[M + H]+
−2.0
47.71
197.0578, 237.0542, 254.0555
70
Medicarpin
C16H14O4
271.09577
[M + H]+
−2.6
49.25
123.0435, 137.0529, 271.0981
71
12-Methyltetradecanoate
C16H32O2
257.24735
[M + H]+
−0.6
61.07
69.0696, 81.0691
72
Odoratin
C17H14O6
315.0855
[M + H]+
−2.6
50.38
282.0493, 285.0366, 300.0589, 315.0821
73
Licoisoflavone B
C20H16O6
353.10112
[M + H]+
−2.4
53.82
283.0598, 299.0545
74
Licoisoflavone
C20H18O6
355.11731
[M + H]+
−0.9
52.15
121.0608, 149.0563, 353.1354
75
Corylifolinin
C20H20O4
325.14245
[M + H]+
−3.0
52.59
149.0578, 171.0780, 325.1408
76
Glycyrrhizol
C21H18O6
367.11636
[M + H]+
−3.4
53.19
283.0572, 311.0533, 309.0360, 339.1181
77
Isoliquiritin
C21H22O9
419.13211
[M + H]+
−3.7
37.09
239.0680, 257.0790
78
Ononin
C22H22O9
431.13225
[M + H]+
−3.3
35.65
256.0621, 269.0794, 270.0823
79
Glyasperins D
C22H26O5
371.18419
[M + H]+
−3
54.48
235.1320, 303.1208, 315.1212
80
8-Methoxyformononetin
C23H24O10
461.14303
[M + H]+
−2.6
29.86
253.0850, 281.0788, 299.0905
81
Glyasperin A
C25H26O6
423.17831
[M + H]+
−4.5
55.97
311.0534, 367.1150
82
Glabrol
C25H28O4
393.20453
[M + H]+
−3.8
55.21
205.0892, 321.1366
83
3-Hydroxyglabrol
C25H28O5
409.19911
[M + H]+
−4.5
56.13
353.1361, 409.1983
84
Schaeffertoside
C26H28O14
565.15327
[M + H]+
−3.4
29.40
397.0894, 415.0997, 433.1095
85
Glycyroside
C27H30O13
563.17391
[M + H]+
−3.6
31.69
413.1213, 431.1316, 563.1726
86
Vicenin-2
C27H30O15
595.16363
[M + H]+
−3.6
18.04
383.0697, 403.1316, 565.1693
87
Isoglycyrrhizinate and its isomers
C30H44O4
469.32961
[M + H]+
−3.5
45.69
405.3087, 433.3086, 451.3179
88
beta-Glycyrrhetinic acid
C30H46O4
471.34557
[M + H]+
−2.8
47.70
317.2114, 407.3257, 471.3422
89
Ursolic acid
C30H48O3
457.3662
[M + H]+
−3.1
48.02
123.1165, 375.1123, 457.2111
90
Glycyrrhizin
C42H62O16
823.40714
[M + H]+
−4.8
47.70
453.3319, 454.3382, 471.3436, 647.3734
91
Licorice-saponin G2
C42H62O17
839.40276
[M + H]+
−3.8
46.72
469.3271, 487.3378, 645.3599
92
(L)-alpha-Terpineol
C10H18O
155.14285
[M + H]+
−1.2
49.32
81.0764, 95.0848, 109.0981, 127.1112
93
Licochalcone B
C16H14O5
287.0907
[M + H]+
−2.4
41.31
168.0042, 183.0277
94
Chrysin
C15H10O4
253.04986
[M−H]-
−3.1
34.34
254.0520, 253.0492
95
Daidzein
C15H10O4
253.04986
[M−H]-
−3.1
34.34
91.0183, 133.0252, 209.0481, 224.0474
96
Genistein
C15H10O5
269.0452
[M−H]-
−1.3
47.26
195.0387, 225.0443
97
3′-methoxydaidzein
C16H12O5
283.06031
[M−H]-
−3.1
51.42
239.0337, 268.0369, 283.0611
98
puerol B
C18H16O5
311.09172
[M−H]-
−2.5
37.69
93.0344, 119.0503, 267.1033
99
Genistin
C21H20O10
431.09809
[M−H]-
−0.6
24.48
255.0666, 283.0610, 311.0560, 431.0991
100
Puerarin
C21H20O9
415.1027
[M−H]-
−1.8
27.61
267.0666, 295.0618, 308.0643
101
3′- Methoxy Puerarin
C22H22O10
445.11334
[M−H]-
−1.5
27.87
282.0518, 297.0763, 325.0706
102
Ononin
C22H22O9
429.11865
[M−H]-
−1.1
33.09
266.0581, 281.0816, 309.0768
103
Genistein-8-C-xylosyl-(1–6) -glucoside
C26H28O14
563.1401
[M−H]-
−0.9
30.66
283.0613, 311.0557, 563.1403
104
Baicalein
C15H10O5
269.0452
[M−H]-
−1.3
47.26
223.0416, 241.0522, 269.0447
105
Chrysin-7-O-glucuronide
C21H18O10
429.08142
[M−H]-
−3.0
42.53
209.0593, 252.2539, 253.0509
106
Baicalin
C21H18O11
445.07733
[M−H]-
−0.7
38.20
159.0326, 269.0450, 275.0253
107
Darendroside B
C21H32O12
475.18183
[M−H]-
−0.6
23.47
267.0665, 295.0617, 415.1032
108
Wogonoside
C22H20O11
459.09134
[M−H]-
−4.2
43.53
175.0244, 268.0485, 283.0598, 459.0946
109
Chrysin 6-C-glucoside 8-C-arabinoside
C26H28O13
547.1453
[M−H]-
−0.8
27.99
267.0656, 295.0604, 547.1451
110
Chrysin 7-O-Beta-Gentiobioside
C27H30O14
577.15679
[M−H]-
0.9
21.04
294.0530, 429.1193, 457.1129
111
Martynoside
C31H40O15
651.229
[M−H]-
−0.7
38.88
475.1835, 605.2107
112
Protocatechuic acid
C7H6O4
153.0191
[M−H]-
−1.5
16.55
91.0200, 109.0301, 153.0200
113
3,4-Dimethoxycinnamic acid
C11H12O4
207.0660
[M−H]-
−1.4
30.75
149.0554, 192.0361
114
3-Carboxy-4-hydroxy-phenoxy glucoside
C13H16O9
315.07188
[M−H]-
−0.9
13.27
101.0288, 108.0221, 109.0305, 123.0441
115
Luteolin
C15H10O6
285.03954
[M−H]-
−3.2
46.53
151.0045, 175.0388, 199.0410, 267.0295
116
Rosmarinie acid
C18H16O8
359.07592
[M−H]-
−3.7
50.29
344.0530, 359.0763
117
Pinoresinol glucoside
C26H32O11
519.18673
[M−H]-
−0.9
33.21
151.0375, 309.0671
118
(+)-lariciresinol gluciside
C26H34O11
521.20243
[M−H]-
−0.8
30.78
299.1417, 329.1391
119
Malic acid
C4H6O5
133.01417
[M−H]-
−0.6
4.63
71.0287, 115.0033, 133.0121
120
Danshensu
C9H10O5
197.04533
[M−H]-
−1.1
12.29
123.0454, 135.0450, 179.0281, 179.040, 197.0502
121
Isoliquiritigenin
C15H12O4
255.06548
[M−H]-
−3.2
45.23
91.0216, 119.0514, 135.0102
122
Carthamidin
C16H12O6
299.05521
[M−H]-
−3.0
47.07
284.0325, 299.0554
123
Liquiritin
C21H22O9
417.11814
[M−H]-
−2.3
33.64
91.0203, 119.0506, 135.0088, 255.0657
124
Isoliquiritin
C21H22O9
417.11814
[M−H]-
−2.3
33.64
119.0505, 135.0088, 255.0665
125
Narcissoside
C28H32O16
623.16207
[M−H]-
0.5
24.33
415.1018, 416.1060, 623.1650
126
Glycyrrhizin
C42H62O16
821.39572
[M−H]-
−1.0
47.53
351.0554, 822.3965
127
Darendoside A
C19H28O11
431.15585
[M−H]-
−0.1
20.80
191.0572, 233.0653, 311.0557
Components in vivo of GQD
No.
Identification
Formula
Found At Mass (m/z)
Ion adduction
Error/ppm
Rt (min)
Main product Ions (m/z, Da)
1
Daidzein
C15H10O4
255.06507
[M + H]+
−0.5
39.86
91.0548, 137.0245, 199.0747, 227.0704, 237.0556
2
7,8,4′-Trihydroxyisoflavone
C15H10O5
271.06021
[M + H]+
0.4
45.98
215.0764, 243.0605
3
Puerarin
C21H20O9
417.11698
[M + H]+
−2.5
26.11
267.0645, 297.0745, 351.0846, 381.0953, 399.1050
4
3′-Methoxypuerarin
C22H22O10
447.12707
[M + H]+
−3.4
26.71
297.0771, 411.1061, 429.1152
5
Mirificin
C26H28O13
549.15845
[M + H]+
−3.3
26.93
297.0758, 399.1067, 417.1177
6
Chrysin
C15H10O4
255.06507
[M + H]+
−0.5
39.86
152.0614, 227.0704
7
Dihydrooroxylin A
C16H14O5
287.09119
[M + H]+
−0.7
42.03
69.0743, 168.0046
8
Skullcapflavone II
C19H18O8
375.10734
[M + H]+
−0.3
50.73
227.0544, 327.0400, 345.0609
9
Baicalin
C21H18O11
447.09137
[M + H]+
−1.8
32.73
271.0596
10
Chrysin-8-C-glucoside
C21H20O9
417.11698
[M + H]+
−2.5
26.11
267.0645, 297.0745, 417.1166
11
Wogonoside
C22H20O11
461.10681
[M + H]+
−2.2
42.09
270.0516, 285.0752
12
Coptisine
C19H13NO4
320.09171
[M + H]+
−0.1
37.04
262.0860, 277.0731, 292.0963
13
Thalifendine
C19H15NO4
322.10701
[M + H]+
−1.2
33.29
250.0866, 279.0906
14
Groenlandicine
C19H15NO4
322.10701
[M + H]+
−1.2
33.29
207.0833
15
DeMethyleneberberine
C19H17NO4
324.12271
[M + H]+
−1.0
32.72
280.0961, 309.0979
16
Berberine
C20H17NO4
336.1227
[M + H]+
−1.0
41.49
292.0973, 306.0769, 320.0915
17
Jatrorrizine
C20H19NO4
338.13847
[M + H]+
−0.6
35.97
279.0884, 294.1113, 323.1140
18
Palmatine
C21H21NO4
352.15399
[M + H]+
−1.0
40.89
308.1276, 336.1225, 337.1306
19
p-coumaric acid
C9H8O3
165.05409
[M + H]+
−3.2
5.58
91.0545, 119.0495, 123.0440, 147.0399
20
Astragalin
C21H20O11
449.1061
[M + H]+
−3.9
34.51
273.0721, 449.1996
21
Isoononin
C22H22O9
431.13329
[M + H]+
−0.9
35.96
269.0805, 431.1117
22
Liquiritigenin
C15H12O4
257.08059
[M + H]+
−1.0
32.72
91.0568, 119.0498, 137.0228
23
Isoliquiritigenin
C15H12O4
257.08059
[M + H]+
−1.0
32.72
137.0228, 147.0413
24
Ononin
C22H22O9
431.13329
[M + H]+
−0.9
35.96
213.0971, 254.0557, 269.0805, 431.1117
25
Glyasperin A
C25H26O6
423.18008
[M + H]+
−0.3
58.82
327.2220, 367.2001
26
Glycyrrhizin
C42H62O16
823.40792
[M + H]+
−3.8
47.72
453.3350, 471.3325, 647.3756
27
Licorice-saponin G2
C42H62O17
839.40909
[M + H]+
3.7
47.32
839.4986
28
(L)-alpha-Terpineol
C10H18O
155.1427
[M + H]+
−1.2
49.64
156.7057, 157.0821
29
Licochalcone B
C16H14O5
287.0911
[M + H]+
−0.7
41.03
69.0743, 168.0046
30
Genistein
C15H10O5
269.0454
[M−H]-
−0.5
47.68
63.0251, 157.0377, 224.0498
31
3′-methoxydaidzein
C16H12O5
283.06096
[M−H]-
−0.8
51.48
239.0340, 268.0383, 283.0592
32
Puerarin
C21H20O9
415.10221
[M−H]-
−3.0
27.39
267.0651, 295.0590, 307.0558
33
3′- Methoxy Puerarin
C22H22O10
445.11259
[M−H]-
−3.2
27.71
297.0774, 325.0689, 430.0994
34
Baicalin
C21H18O11
445.07668
[M−H]-
−2.2
34.35
85.0298, 113.0247, 269.0440
35
Wogonoside
C22H20O11
459.09206
[M−H]-
−2.7
43.68
175.0256, 268.0366, 283.0605
36
Chrysin 6-C-glucoside 8-C-arabinoside
C26H28O13
547.14423
[M−H]-
−2.7
27.82
277.0519, 295.0606, 325.0709
37
Chrysin 7-O-Beta-Gentiobioside
C27H30O14
577.15547
[M−H]-
−1.4
20.62
457.0922, 508.9563
38
Isoliquiritin
C21H22O9
417.11796
[M−H]-
−2.7
35.98
119.0520, 135.0450
39
Glycyrrhizin
C42H62O16
821.39558
[M−H]-
−1.1
47.64
351.0540, 822.4001
40
Baicalein
C15H10O5
269.0454
[M−H]-
−0.5
47.68
63.0251, 169.0649, 224.0498, 268.7776
3.2 Network pharmacology predictive analysis
43 targets were obtained in total from the intersection of 35 in vivo component targets (the top 5 targets with the highest Probability value) and disease targets. Then, PPI network diagram of 43 targets was constructed through String database (Fig. 1A). With the degree value > 4 as the standard, 31 key targets were screened out and the interaction network diagram was drawn (Fig. 1B). The list of targets was shown in Table S6. Finally, using Cytoscape 3.9.1 (UC, San Diego, La Jolla, CA, USA) software, a network diagram of 4 herb, 35 components and 31 targets was constructed (Fig. 1C). The top 4 components with the highest degree of each herb were identified as the key active components that might play important roles in drug efficacy. As a result, Ononin, genistein, puerarin, daidzein were the key components in Pueraria lobata (Willd.) Ohwi (Gegen); Skullcapflavone II, chrysin 7-O-beta-gentiobioside, baicalin, wogonoside were the key components in Scutellaria baicalensis Georgi (Huangqin); DeMethyleneberberine, p-coumaric acid, coptisine, berberine were the key components in Coptis chinensis French (Huanglian); Isoliquiritigenin, glyasperin A, isoononin and glycyrrhizin were the key components in Glycyrrhiza uralensis Fisch (Gancao).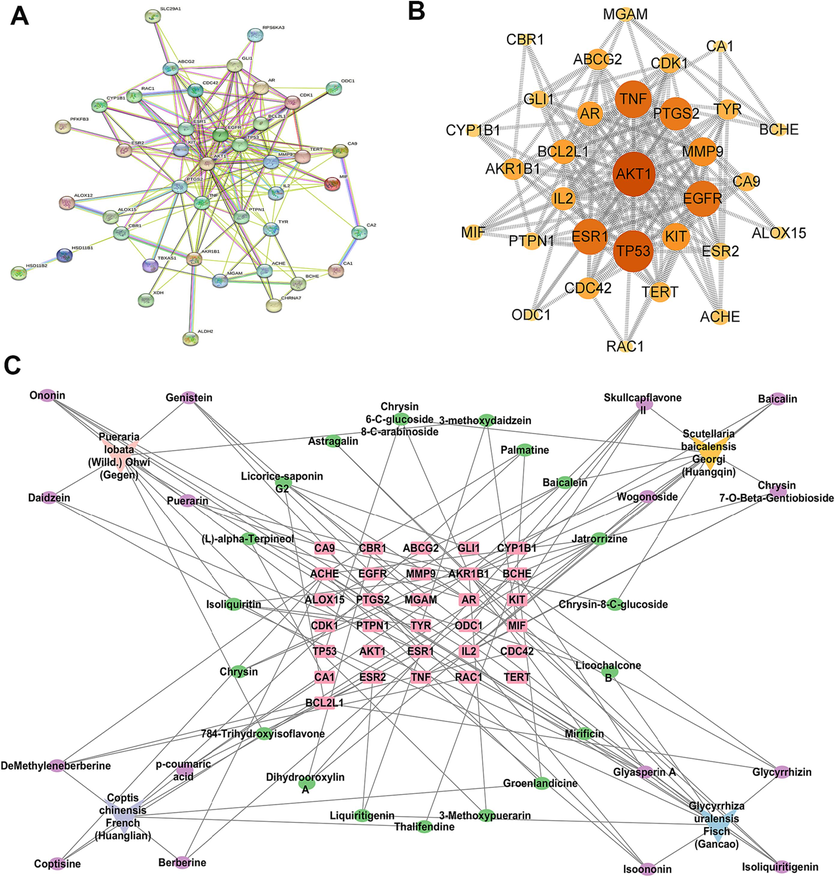
Prediction results of network pharmacology study. PPI diagram network (A); Network diagram of 31 key targets (B); “Herb-component-target” multivariate network (C).
3.3 GQD intervention mitigated histopathologic injury in colon tissue caused by UC and CRC and reduce gastrointestinal adverse reactions of XELOX
The colon structure of control group was complete, and goblet cells were arranged neatly (Fig. 2A). However, colonic mucosa ulceration was serious in UC group, and pathological phenomena such as absence of colonic mucosal epithelial cells, destruction of glandular structure and disappearance of crypt structure were found. Severe colon erosion was observed in CRC group, and the pathological features were more obvious than UC group. After GQD treatment, the pathological phenomena of colonic tissue were recovered to a certain extent. Moreover, the colonic lesions of rats treated with GQD combined with XELOX were more improved than those treated with XELOX alone, indicating that GQD could effectively reduce colonic mucosal injury, assist XELOX to enhance the effect of improving intestinal lesions and reduce gastrointestinal adverse reactions of chemotherapy drugs.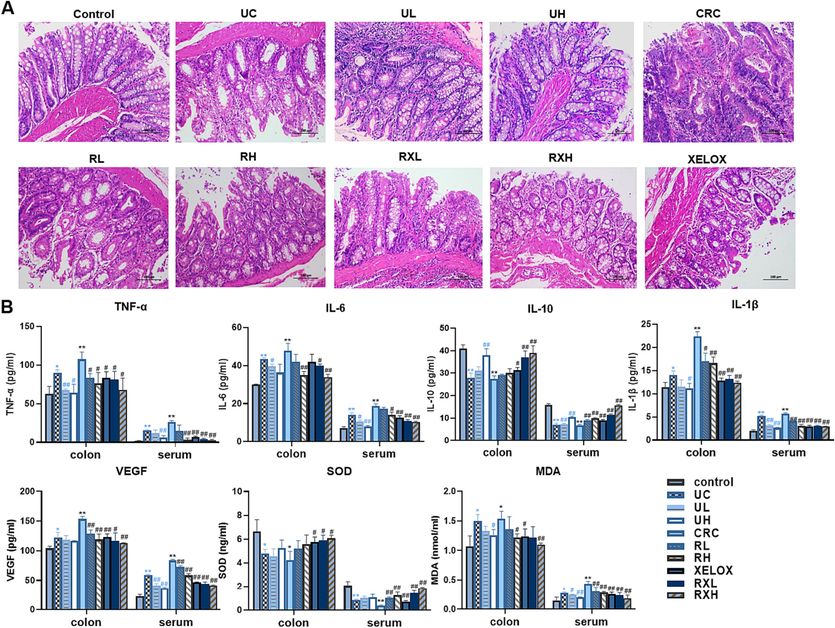
H&E staining results of colon tissues (200 × magnification) (A); Bar chart of ELISA kit results for inflammatory factors, tumor factors and antioxidant indicators (B). Values shown are means ± SD. *p < 0.05, **p < 0.01 UC vs Control group; *p < 0.05, **p < 0.01 CRC vs Control group; #p < 0.05, ##p < 0.01 vs UC group; #p < 0.05, ##p < 0.01 vs CRC group.
3.4 GQD intervention enhanced anti-inflammatory, antitumor and antioxidant activities
The activities of anti-inflammatory, anti-tumor as well as anti-oxidative of GQD were evaluated by ELISA. As shown in Fig. 2B, the pro-inflammatory factors TNF-α, IL-6 and IL-1β in colon and serum increased substantially in the development of UC to CRC. After GQD treatment, significant callback effect was observed in both UC and CRC period. Meanwhile, the inflammatory factors in RXL and RXH groups were more significantly decreased than those in XELOX group. In addition, GQD also greatly increased the content of IL-10, the anti-inflammatory factor. And there was a more significant correction trend in the RXL and RXH groups than that in the XELOX group, which declared that GQD had a very strong anti-inflammatory effect, and combined treatment with XELOX might enhance the anti-inflammatory effect. Moreover, the detection results of tumor factor VEGF, antioxidant factor SOD and MDA also proved that GQD had excellent anti-tumor and antioxidant effects, and might assist chemotherapy drugs to enhance its anti-tumor and antioxidant activities. Inflammation and oxidative stress are the key factors in the toxicity and side effects of XELOX. The results above indicated that GQD had great potential in alleviating the toxicity and side effects of XELOX.
3.5 GQD intervention regulated immune response to resist the adverse reactions of XELOX
It is well known that the balance of the CD4+/CD8+ is essential for immunomodulatory effects. In this study, CD4+ and CD8+ positive cells in T lymphocytes were detected by flow cytometry (Fig. 3). The proportion of CD4+/CD8+ cell subsets in UC and CRC groups were prominently reduced compared with the control group (p<0.05), indicating that inflammation and tumor could damage immune function. However, after GQD intervention, the ratio of CD4+/CD8+T lymphocytes showed a dose-dependent correction and was similar to that of the control group, enunciating that GQD treatment could normalize the immune system’ balance and facilitate to play an anti-tumor role. In addition, after treatment of GQD combined with XELOX, a further reversed trend in the T lymphocytes proportion (CD4+/CD8+) was found refer to the XELOX treatment group. The data above manifested that the intervention of GQD combined with XELOX could have a positive effect on the immune system's ability to fend off unfavorable reactions.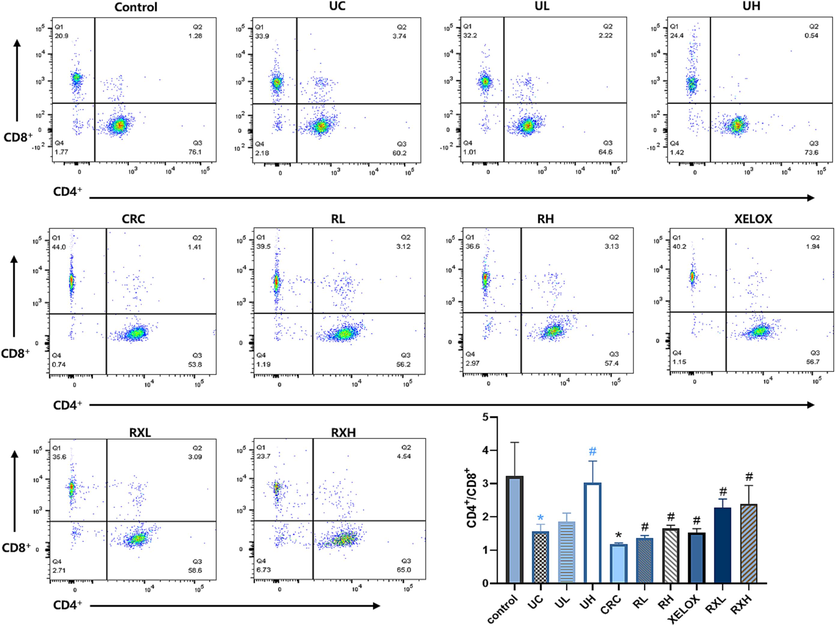
Flow cytometric analysis of CD4+ and CD8+ cells in each group of rats. *p < 0.05 UC vs control group; *p < 0.05 CRC vs Control group; #p < 0.05 vs UC group; #p < 0.05 vs CRC group.
3.6 Intestinal microflora analysis
To study the impacts and molecular underpinnings of the microbial consortia on colorectal carcinogenesis, 16S rDNA sequencing technology was applied to detect the gut microbial community of rats in each group. As shown in Fig. 4A, the community distribution histogram of each group at various levels was drawn. Moreover, LDA distribution histogram and cladogram of dominant microorganisms in different groups were displayed both in Figs. 4 and 5. It could be seen from the diagram that during the evolution from UC to CRC, the intestinal microflora was obviously disturbed, manifested with Firmicutes' abundance dramatically dropped, while Proteobacteria's abundance dramatically grew at the phylum level. The microflora with high abundance were Escherichia_Shigella and Lactobacillus, and the two bacteria were common beneficial bacteria and harmful bacteria in vivo, respectively (genus level). The results showed that from UC to CRC, the abundance of Escherichia_Shigella gradually increased, and that of Lactobacillus gradually decreased. After GQD intervention, the abundance of various microflora including the above microflora was regulated towards normal levels, indicating that GQD could treat UC and CRC by remodeling intestinal microflora homeostasis and inhibit the progression of UC to CRC. What’s more, the decline trend of Escherichia_Shigella in RXL and RXH groups was more than that in XELOX group, the lactobacillus’ abundance in the RXL and RXH groups was much greater than that in XELOX group, suggesting that GQD could help restore the balance of intestinal microflora on the basic of XELOX treatment.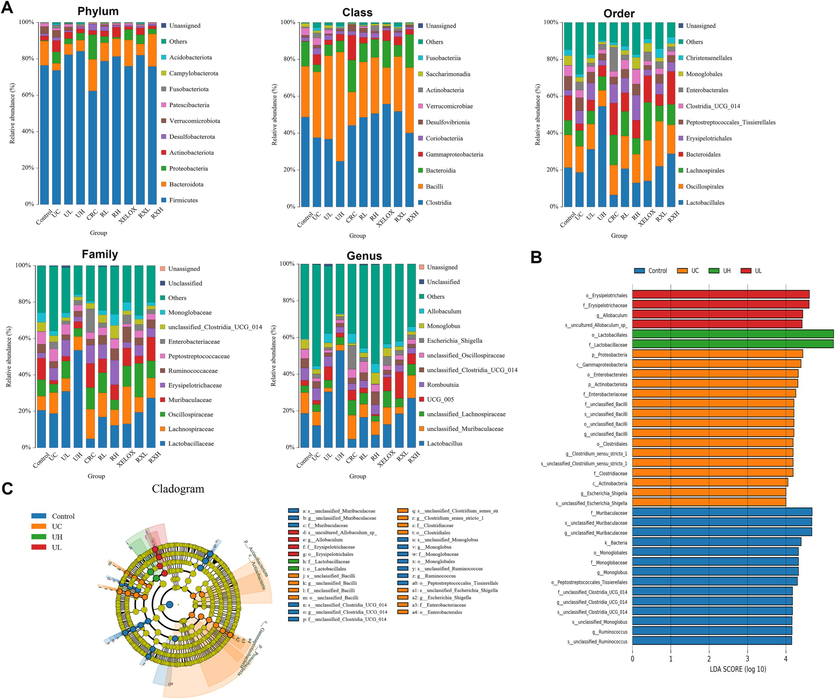
Distribution histogram of the top 10 community in abundance at the level of phylum, class, order, family and genus (A); Distribution histogram based on LDA of dominant microorganisms in the control, UC, UL, UH groups (B); Cladogram of dominant microorganisms in the control, UC, UL, UH groups (C).
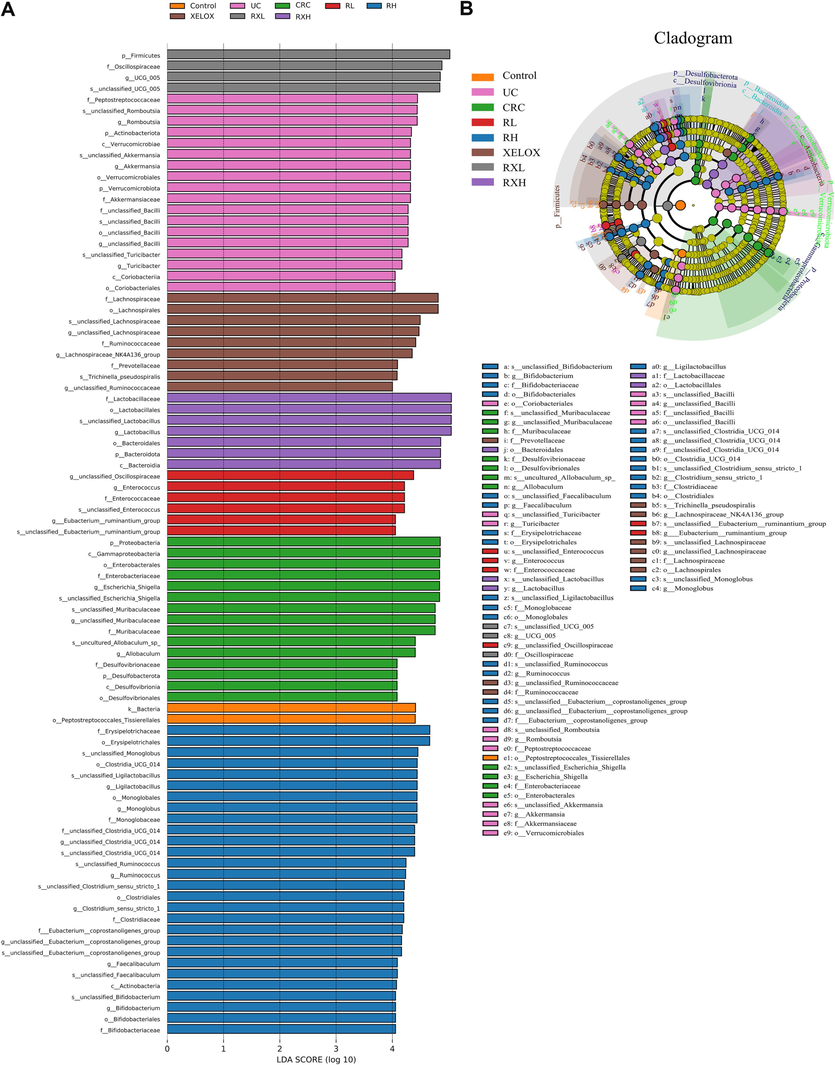
Distribution histogram based on LDA of dominant microorganisms in different groups (A); Cladogram of dominant microorganisms in different groups (B).
3.7 Non-targeted metabolomics analysis and correlation analysis with intestinal microflora
To further explore the mechanism of GQD regulation of disease at the small-molecule level, non-targeted metabolomics study was performed on colon samples by HPLC-Q-TOF-MS/MS, with.
proven precision, stability, and reproducibility (Table S7). The Control, UC and CRC groups showed significant separation without overfitting (Fig. S2). Subsequently, metabolites satisfying multiple conditions were screened out (P<0.05, FC>2.0 or FC<0.5, VIP > 1.0) as potential biomarkers. In the end, 45 biomarkers were screened in the Control and UC groups, and 38 biomarkers were examined in the Control and CRC groups, among which 21 biomarkers were examined in both the UC and CRC groups. The detailed information of each biomarker was shown in Table 2. Then, the abundance of these metabolites in each group was visualized using heat maps (Figs. 6 and 7) to intuitively investigate the variation of metabolites after GQD intervention. Moreover, among the 21 metabolites associated with UC and CRC, linoleic acid, 7-ketodeoxycholic acid and other metabolites showed obvious trend of correction after treatment (p < 0.05), and the changes of these metabolites were shown in Fig. 8. UC: ulcerative colitis group, CRC: colorectal cancer group, Con.: control group, FC: Fold change. Fold1: control group/UC group, Fold 2: control group/CRC group. VIP1: control group/UC group, VIP2: control group/CRC group. ↑: increased, ↓: decrease.
No.
t(R)
ESI mode
m/z
Identification
Fomular
FC1
VIP1
FC2
VIP2
Change trend
UC/Con.
CRC/Con.
CRC/UC
1
3.3
+
130.0855
Pipecolic acid
C6H11NO2
0.42
1.17
↑
2
7.2
+
134.0593
Indoxyl
C8H7NO
0.35
1.07
↑
3
7.0
+
243.1005
Equol
C15H14O3
0.02
2.58
↑
4
3.0
+
258.1090
Glycerophosphocholine
C8H20NO6P
0.30
1.18
↑
5
9.2
+
300.2883
Sphingosine
C18H37NO2
0.23
1.53
0.24
1.21
↑
↑
↓
6
12.3
+
301.2149
(6Z,9Z,12Z)-Octadecatrienoic acid
C18H30O2
0.35
1.28
↑
7
12.9
+
303.2306
9-cis,11-trans-Octadecadienoate
C18H32O2
0.40
1.20
↑
8
10.7
+
375.2868
Murideoxycholic acid
C24H40O4
0.48
1.13
0.13
1.49
↑
↑
↑
9
11.3
+
375.2871
3-Oxo-5beta-cholanate
C24H38O3
0.26
1.55
0.07
1.68
↑
↑
↑
10
9.6
+
380.2539
S1P(d18:1)
C18H38NO5P
4.12
1.20
↓
11
9.9
+
389.2660
7-Oxodeoxycholate
C24H38O5
0.06
1.75
↑
12
10.8
+
391.2816
3alpha,12alpha-Dihydroxy-5beta-chol-6-enoate
C24H38O4
0.34
1.32
0.01
2.23
↑
↑
↑
13
10.1
+
393.2978
Chenodeoxycholic acid
C24H40O4
0.34
1.04
↑
14
11.4
+
393.2984
Hyodeoxycholic acid
C24H40O4
0.11
1.56
↑
15
9.0
+
407.2765
7-Ketodeoxycholic acid
C24H38O5
0.33
1.46
0.01
2.32
↑
↑
↑
16
8.8
+
409.2911
omega-Muricholic acid
C24H40O5
0.48
1.16
0.11
1.55
↑
↑
↑
17
9.5
+
409.2918
Ursocholic acid
C24H40O5
0.27
1.55
0.16
1.44
↑
↑
↑
18
8.6
+
450.3178
Glycodeoxycholic acid
C26H43NO5
0.21
1.58
0.32
1.12
↑
↑
↑
19
9.8
+
450.3179
Glycochenodeoxycholic acid
C26H43NO5
0.12
1.92
↑
20
8.3
+
466.3130
Glycocholic acid
C26H43NO6
0.13
1.85
↑
21
10.7
+
482.3208
LPC(15:0)
C23H48NO7P
0.33
1.33
22
8.5
+
484.3046
Taurolithocholic acid
C26H45NO5S
0.34
1.04
↑
23
10.0
+
489.2569
Cholic acid 7-sulfate
C24H40O8S
0.02
2.04
↑
24
7.8
+
498.2848
Taurohyocholate
C26H45NO7S
0.04
1.83
↑
25
8.1
+
500.2995
Taurodeoxycholic acid
C26H45NO6S
0.23
1.69
0.50
1.07
↑
↑
↓
26
12.1
+
510.3520
LPC(17:0/0:0)
C25H52NO7P
0.35
1.29
↑
27
7.5
+
516.2942
Tauro-gamma-muricholic acid
C26H45NO7S
0.42
1.09
↑
28
8.2
+
516.2947
Taurocholic acid
C26H45NO7S
0.39
1.26
↑
29
8.1
+
569.3261
Chenodeoxycholic acid 3-glucuronide
C30H48O10
0.00
2.68
↑
30
5.1
–
117.0200
Succinate
C4H6O4
2.28
1.02
↓
31
2.9
–
124.0080
Taurine
C2H7NO3S
2.75
1.12
↓
32
3.1
–
130.0627
Creatine
C4H9N3O2
2.73
1.16
↓
33
6.6
–
158.0824
Isovalerylglycine
C7H13NO3
23.16
1.96
6.81
1.64
↓
↓
↑
34
7.2
–
172.9914
Phenylsulfate
C6H6O4S
5.58
1.43
3.12
1.23
↓
↓
↑
35
3.3
–
173.0934
N-Acetylornithine
C7H14N2O3
0.15
1.48
↑
36
6.6
–
181.0507
Hydroxyphenyllactic acid
C9H10O4
0.22
1.37
↑
37
7.5
–
187.0975
Azelaic acid
C9H16O4
0.24
1.37
↑
38
4.5
–
191.0197
Citric acid
C6H8O7
0.21
1.29
0.19
1.42
↑
↑
↑
39
3.0
–
195.0511
Gluconic acid
C6H12O7
0.28
1.26
↑
40
7.2
–
206.0822
N-Acetylphenylalanine
C11H13NO3
6.21
1.47
↓
41
6.9
–
216.9809
5-Sulfosalicylate
C7H6O6S
0.07
1.82
↑
42
7.3
–
233.0426
S-(4-Methylthiobutylthiohydroximoyl)-L-cysteine
C8H16N2O3S2
0.35
1.09
0.15
1.60
↑
↑
↑
43
15.1
–
253.2167
cis-9-Palmitoleic acid
C16H30O2
0.23
1.26
↑
44
16.1
–
255.2323
Palmitic acid
C16H32O2
0.37
1.03
↑
45
14.2
–
271.2271
2-Hydroxypalmitic acid
C16H32O3
2.95
1.15
↓
46
14.9
–
277.2165
alpha-Linolenic acid
C18H30O2
0.25
1.24
0.17
1.55
↑
↑
↑
47
15.5
–
279.2320
Linoleic acid
C18H32O2
0.36
1.07
0.26
1.32
↑
↑
↑
48
16.4
–
281.2477
Oleic acid
C18H34O2
0.37
1.05
0.29
1.28
↑
↑
↑
49
17.4
–
283.2634
Stearic acid
C18H36O2
0.25
1.14
↑
50
12.6
–
295.2268
13(S)-HODE
C18H32O3
0.18
1.41
0.13
1.63
↑
↑
↑
51
17.8
–
297.2426
9-Oxooctadecanoic acid
C18H34O3
0.11
1.54
↑
52
15.7
–
299.2584
2-Hydroxystearic acid
C18H36O3
0.22
1.28
↑
53
16.0
–
305.2476
cis-8,11,14-Eicosatrienoic acid
C20H34O2
0.16
1.44
0.17
1.54
↑
↑
↓
54
16.7
–
307.2632
cis-11.14-Eicosadienoic acid
C20H36O2
0.26
1.22
0.41
1.06
↑
↑
↓
55
17.6
–
309.2788
trans-11-Eicosenoic acid
C20H38O2
0.14
1.39
↑
56
8.8
–
351.2166
Prostaglandin E2 (PGE2)
C20H32O5
0.17
1.43
↑
57
19.7
–
365.3408
Nervonic acid
C24H46O2
0.18
1.37
↑
58
10.1
–
391.2835
Ursodeoxycholic acid
C24H40O4
2.66
1.09
3.26
1.27
↓
↓
↓
59
9.6
–
448.3047
Glycodeoxycholic acid
C26H43NO5
0.37
1.07
↑
60
8.2
–
464.2993
Glycocholic acid
C26H43NO6
0.39
1.06
↑
61
12.3
–
464.3121
PE(P-18:0/0:0)
C23H48NO6P
0.19
1.36
↑
62
10.9
–
478.2916
LPE(18:1(9Z)/0:0)
C23H46NO7P
0.31
1.16
↑
63
8.9
–
495.2937
Pregnanediol 3-O-glucuronide
C27H44O8
10.37
1.68
4.41
1.40
↓
↓
↑
64
11.7
–
522.2813
LPS(18:1)
C24H46NO9P
0.07
1.80
↑
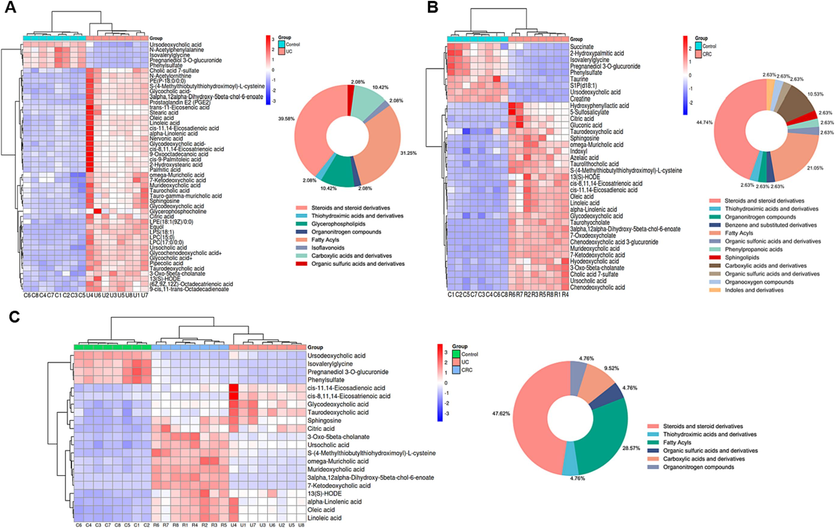
Heat maps of differential metabolites between the control and UC groups (A); Heat maps of differential metabolites between the control and CRC groups (B); Heat maps of differential metabolites in both the UC and CRC groups (C); circle graphs represented the classification and proportion of differential metabolites.
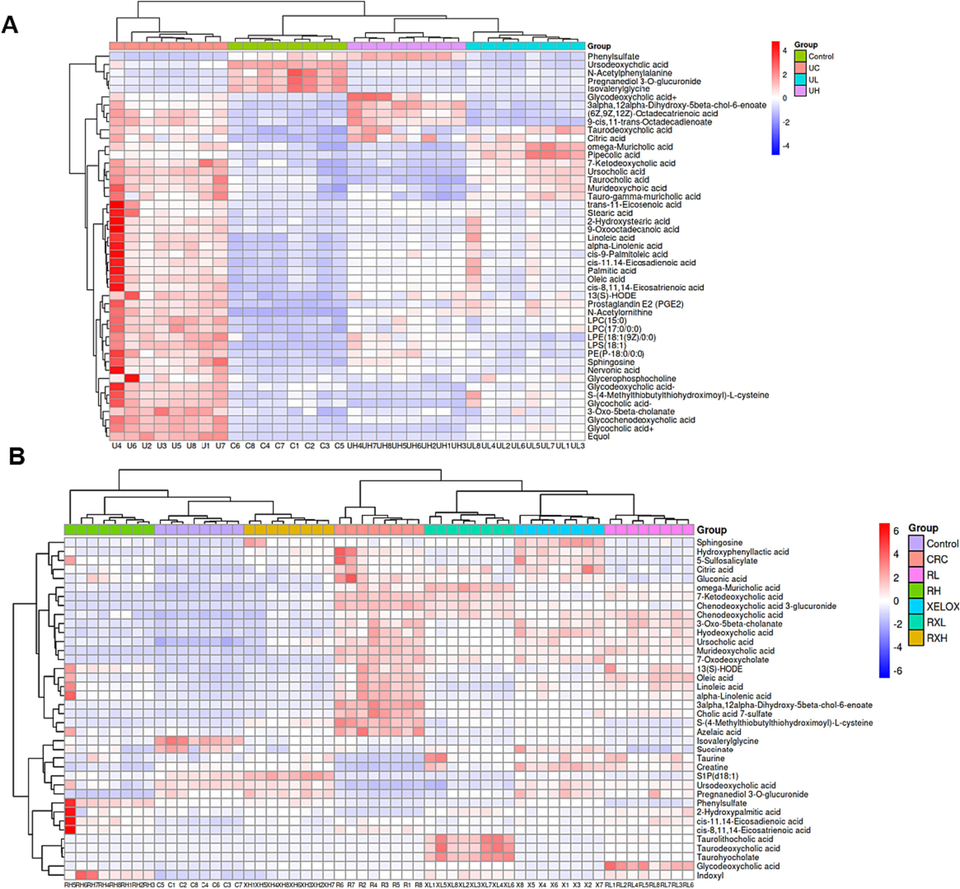
Heat maps of differential metabolites between the control and UC groups after treatment (A); Heat maps of differential metabolites between the control and CRC groups after treatment (B).
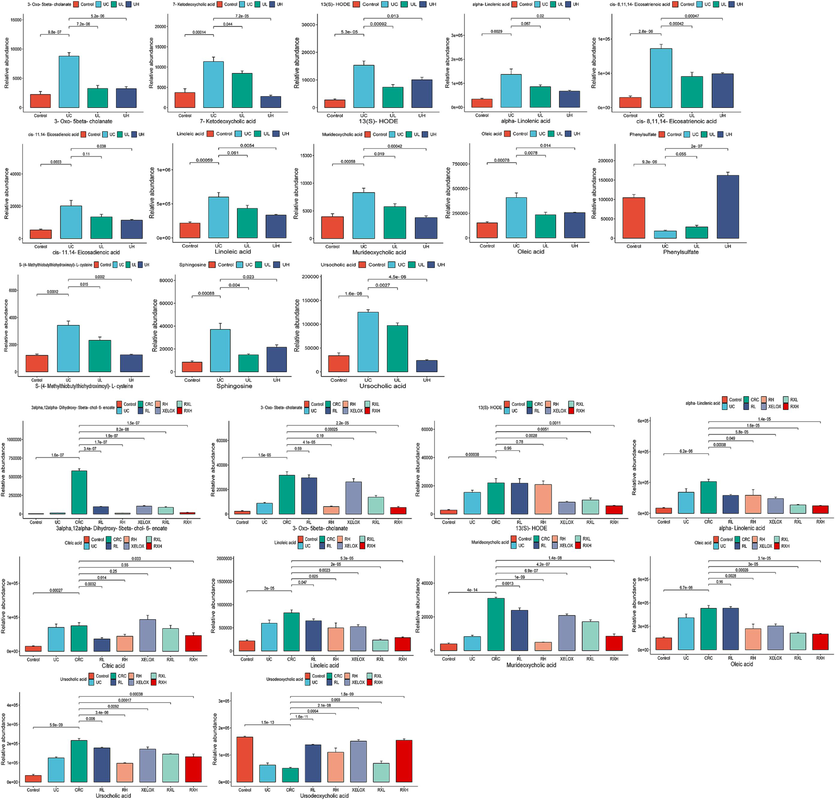
Column chart of different metabolite concentrations in the control, UC, UL and UH groups (A); Column chart of different metabolite concentrations in the control, UC, CRC, RL, RH, XELOX, RXL and RXH groups (B).
Furthermore, the MetaboAnalyst (https://www.metabo-analyst.ca/) platform was used to enrich the KEGG pathway (Fig. 9). The results showed that 15 metabolic pathways were significantly enriched during UC development. 14 metabolic pathways were significantly enriched during CRC development. 7 pathways might be affinitive to the transition from UC to CRC.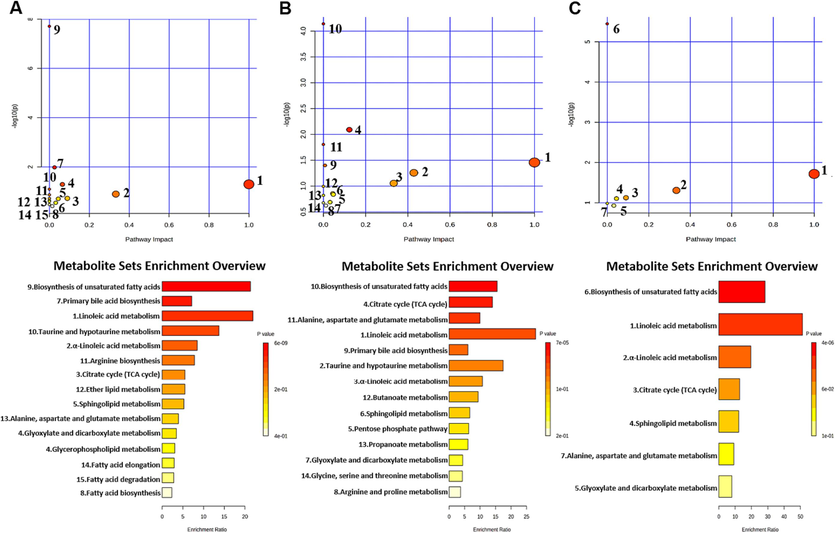
KEGG enrichment pathway maps of differential metabolites between the control and UC groups (A); KEGG enrichment pathway maps of differential metabolites between the control and CRC groups (B); KEGG enrichment pathway maps of differential metabolites related to UC and CRC (C).
Whereafter, Spearman correlation analysis was adopted to evaluate the interaction between altered metabolites and microflora, in order to find out the key microflora and metabolites (Fig. 10). According to the Metastats analysis, among the differential microflora in control vs UC and control vs CRC, there were 22 differential microflora both in the UC and CRC groups at phylum and genus level, including Enterococcus, Allobaculum, Escherichia_Shigella, Dubosiella, Ligilactobacillus, Lactobacillus etc. And the correlation analysis was performed between them and 21 differential metabolites. The abundance of Proteobacteria, Enterococcus, Allobaculum, Escherichia_Shigella, Dubosiella and uncultured_Clostridiales_bacterium showed a gradually increasing change pattern in the development process from UC to CRC. On the contrary, the abundance of Marvinbryantia, Monoglobu, Lachnospiraceae_UCG_006, [Bacteroides]_pectinophilus_group, Gordonibacter, Ligilactobacillus and Lactobacillus showed a gradual decrease. The above bacteria were considered to have connections to the evolution of UC into CRC. Correlation analysis showed that Proteobacteria, Escherichia_Shigella and several bacteria had a significant positive correlation with unsaturated fatty acids (oleic acid, alpha-linoleic acid, linoleic acid, etc.). Ligilactobacillus, Lactobacillus and other bacteria showed significant negative correlation with unsaturated fatty acids.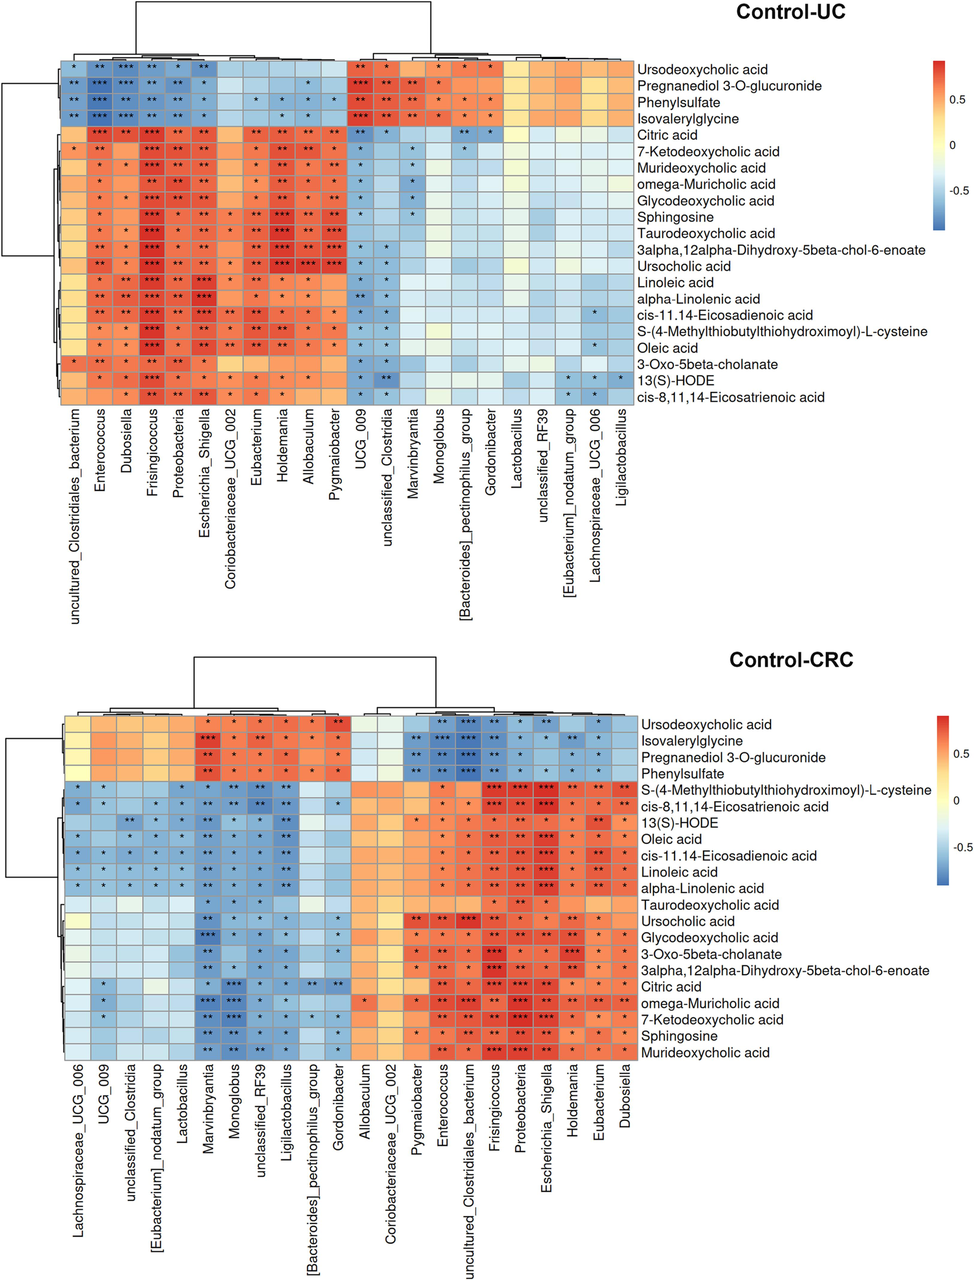
Correlation heat map of key differential microflora and differential metabolites. *p < 0.05, **p < 0.01, ***p < 0.001.
3.8 Integrated analysis of network pharmacology and metabolomics
Using the Metscape plug-in to form compound-reaction-enzyme-gene networks, 31 crucial targets from network pharmacology results and 21 distinct metabolites from metabolomics results were imported to the Cytoscape 3.10.0 (UC, San Diego, La Jolla, CA, USA) software, to visually related genes and metabolites of interaction (Fig. 11). Six metabolites (linoleic acid, cis-8,11,14-eicosatrienoic acid, sphingolipid, α-linoleic acid, oleic acid, citric acid) as well as three targets (ALOX15, CYP1B1, and PTGS2) were identified in the network. Among them, linoleic acid and cis-8,11,14-eicosatrienoic acid were key metabolites that had metabolic relationship with the targets of components in vivo. ALOX15 and CYP1B1 were core genes involved in the metabolism of linoleic acid, while ALOX15 and PTGS2 were important genes involved in the metabolism of cis-8,11,14-eicosatrienoic acid. These distinct targets and metabolites were chosen as the main metabolites and targets.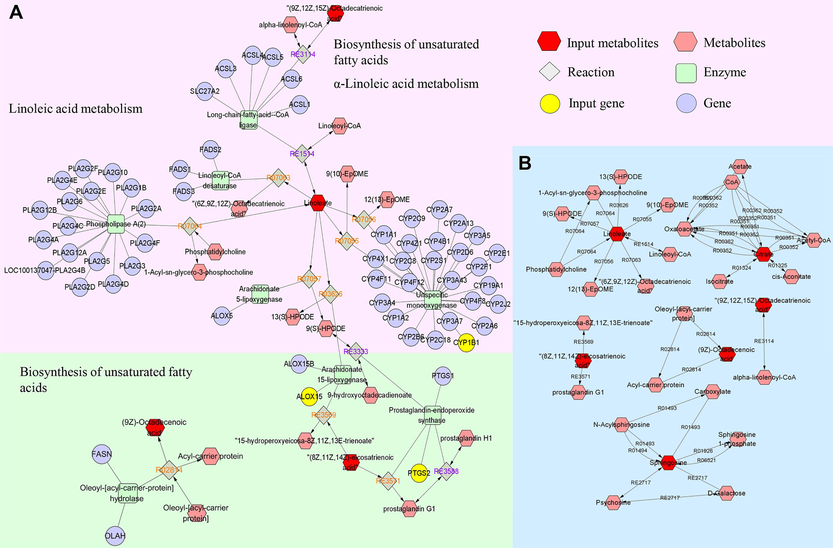
The compound-reaction-enzyme-gene networks of the key metabolites and targets (A); the network of interactions between key metabolites (B).
3.9 Western blot analysis of ALOX15, CYP1B1 and PTGS2 proteins
As shown in Fig. 12A, ALOX15, CYP1B1, and PTGS2 were all activated (p < 0.05) in UC and CRC groups, and each protein in CRC group was expressed more than the UC group. In addition, the expression of ALOX15, CYP1B1, and PTGS2 proteins were effectively inhibited by different concentrations of GQD (p < 0.05), especially the higher doses of GQD. Particularly, the administration of GQD combined with XELOX showed a stronger advantage in reversing the expression level of the above proteins than that of XELOX administration alone. These results indicated that the pathogenesis of UC and CRC might be accompanied by the activation of ALOX15, CYP1B1, and PTGS2 proteins, GQD exerted anti-inflammatory and anti-tumor effects by down-regulating these proteins, which was also a key mechanism for GQD to enhance the efficacy of XELOX.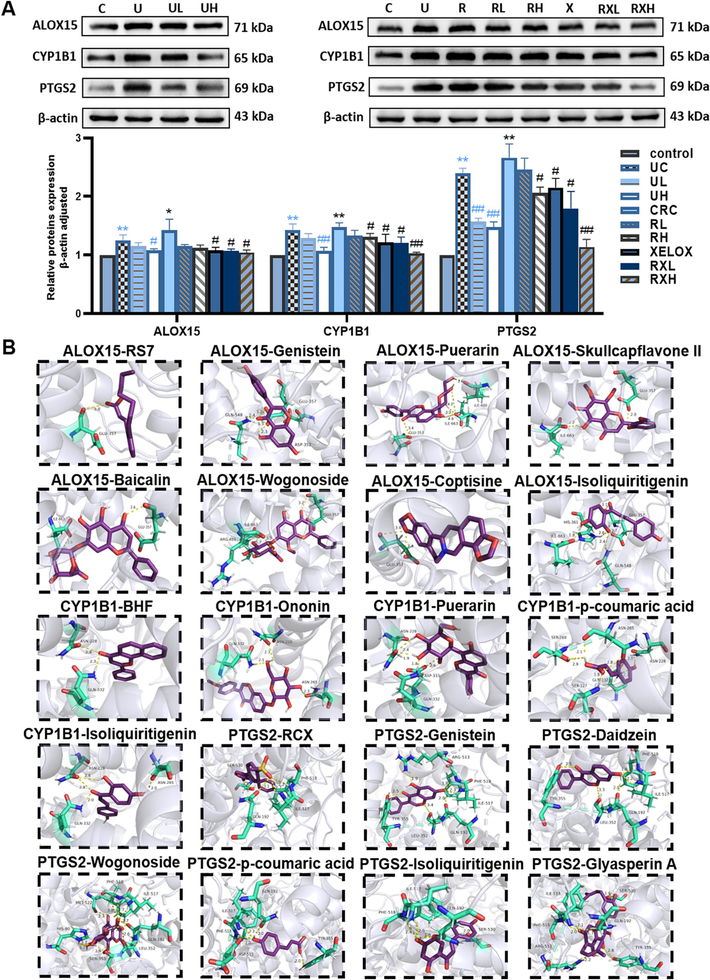
Typical protein bands and relative expression of ALOX15, CYP1B1 and PTGS2 proteins in western blot analysis; Values shown are means ± SD. *p < 0.05, **p < 0.01 UC vs Control group; *p < 0.05, **p < 0.01 CRC vs Control group; #p < 0.05, ##p < 0.01 vs UC group; #p < 0.05, ##p < 0.01 vs CRC group (A); Molecular docking interaction diagrams of key active components with macromolecular ligands (B).
3.10 Molecular docking result
In order to explore the pharmacodynamic substance basis of GQD in the therapy of UC and CRC, molecular docking was conducted between ALOX15, CYP1B1, PTGS2 and active components, respective. Firstly, the macromolecular ligands of ALOX15 (2p0m), CYP1B1 (3 pm0) and PTGS2 (5kir) were downloaded from the PDB database (https://www.pdbus.org/), respectively. Then, the potential active components were semi-flexible docked with the receptor proteins respectively. RS7, BHF and rofecoxib (RCX) were the positive drug of ALOX15, CYP1B1 and PTGS2, which were semi-flexible docked to 2p0m, 3 pm0 and 5kir, respectively. The results showed that GLU357 was the main active sites of 2p0m, GLN332, ASN228 were the main active sites of 3 pm0, and PHE518, ILE517, GLN192, SER530 were the main active sites of 5kir. Moreover, the binding energies to proteins of ononin, genistein, puerarin, daidzein, skullcapflavone II, baicalin, wogonoside, p-coumaric acid, coptisine, isoliquiritigenin, glyasperin A were less than −5 kcal/mol and the binding sites were similar to positive drugs, so that the above components were identified as key active components. Details of binding energy were shown in Table S8, and the results of protein–ligand interaction profile were presented in Fig. 12B and Fig. S3-5.
4 Discussion
GQD has been utilized to resist UC and other IBD since ancient times. Although several scholars have explored its therapeutic effect on CRC in recent years, the specific mechanism of action is not very clear (Fan et al., 2020, Liu et al., 2021). Furthermore, as one of the commonly used clinical treatment methods for CRC, XELOX may have certain harmful side effects and lower patients' compliance and quality of life. In clinical practice, Chinese medicine is frequently used in conjunction with chemotherapy drugs to reduce patients' adverse reactions. Our current study was the first to deeply study the pharmacodynamic effect, mechanism of action as well as pharmacodynamic material basis of XELOX combined with GQD in the treatment of CRC. HE staining results suggested that GQD combined with XELOX could effectively reduce intestinal mucosal injury and reduce gastrointestinal adverse reactions. Particularly, the contents of TNF-α, IL-6, IL-1β, IL-10, VEGF, SOD and MDA were significantly recovered after GQD treatment compared with the disease group (p<0.05), and were close to that of the control group. Therefore, the excellent performance of GQD in assisting XELOX in enhancing anti-inflammatory, antioxidant, anti-tumor and regulating immune function was fully confirmed in this study. Inflammation and oxidative stress are major factors in nerve damage, and the low immune function is the adverse factor that leads to a series of adverse reactions. Therefore, this study suggested that GQD might counteract the toxic side effects and pain response of XELOX by controlling inflammation, oxidative stress, and boosting the immune system.
Altered microflora and metabolites is regarded as one of the most significant hallmarks of gastrointestinal disease (Lanis et al., 2017). 16S rDNA sequencing is a key technology that helps us fully understand the abundance of gut microbiome and its composition. Major advances in metabolomics technology provide us with tools to reveal the dynamic changes of endogenous metabolites at the level of small molecules in different stages of disease progression (Wu et al., 2020). The results showed that among several bacteria groups with significant increases, Proteobacteria, Allobaculum, Escherichia_Shigella, Dubosiella etc. were proved to be potential pathogenic bacteria (Hu et al., 2022, Otake-Kasamoto et al., 2022), and abnormal increases in abundance were detected in a variety of IBD and CRC groups. While Ligilactobacillus and Lactobacillus are two common beneficial bacteria, which showed a gradual decline in the evolution of inflammation into cancer. The above results indicated that the possible mechanism of UC development into CRC was to destroy the dynamic equilibrium of intestinal microecological environment, decrease the composition of helpful bacteria and increase the composition of harmful bacteria. The abundance of harmful bacteria was sensibly inhibited after GQD intervention, and the abundance of beneficial bacteria was also substantially reversed. In particular, the abundance of Escherichia_Shigella and Lactobacillus decreased and got higher even more respectively after combined administration. Linoleic acid, oleic acid, 13(S)-HODE and other 21 metabolites were different metabolites found in UC and CRC groups, and the concentrations of these substances showed a trend of gradual increase or decrease from UC to CRC. It is worth noting that after GQD combined with XELOX intervention, the correction trend is stronger than XELOX intervention. The results of correlation analysis showed that several harmful bacteria had strong positive correlation with linoleic acids and unsaturated fatty acid metabolites, but showed opposite relationship with beneficial bacteria such as Lactobacillus. It is suggested that the above bacteria and metabolites were deeply related to the development of UC and CRC, and might be used as potential targets for the prevention and control of UC-associated CRC, as well as key targets for the synergistic effect of GQD and XELOX.
The rise of network pharmacology has brought light to the exploration of the mechanism actions of TCM compounds and the development of new therapeutic methods (Qi et al., 2021). The construction of compound-reaction-enzyme-gene network realized the combination of metabolomics and network pharmacology, thus to find the key components that play the drug effect and speculate the possible mechanism of action. Molecular docking technique is a kind of simulation method that can visually show the interaction between receptor and drug molecule, which can predict binding patterns and affinity. In recent years, this technique has been widely used by many researchers (Raja et al., 2022, Vennila et al., 2023). In our study, the reliability of the mechanism of action was further verified by western blot and molecular docking, and the core targets and components of the drug effect were clarified. Lipoxygenase arachidonic acid 15 (ALOX15) and Cytochrome P450 1B1 (CYP1B1) are two key lipoxygenase enzymes in the linoleic acid metabolic pathway (Ruparel et al., 2012). Recent research has revealed a link between aberrant ALOX15 expression and a higher risk of multiple tumors and inflammatory disorders. Arachidonic acid was converted to 12-HPETE and 15-HPETE by protease, and 12-HPETE can further be metabolized into a factor with pro-inflammatory properties (Kulkarni et al., 2021). In addition, ALOX15 can also oxidize arachidonic acid and increase lipid peroxidation, resulting in oxidative cell death (Xu et al., 2021). Linoleic acid and arachidonic acid are two examples of polyunsaturated fatty acids that are extensively processed by the cytochrome P450 (CYP) family (Luo and Liu, 2020). Previous studies have shown that CYP1B1 protein has been overexpression in cancer cells, and this process was closely related to tumor growth (Chen et al., 2023). Down-regulating the expression of CYP1B1 could prohibit the multiplication and migration of CRC cells (Patel et al., 2014). Prostaglandin endoperoxide synthase2 (PTGS2), also known as COX-2, is involved in controlling of pathological reactions like inflammation and tumor (Kunzmann et al., 2013). PTGS2 can catalyze the metabolic process of arachidonic acid, thus producing proinflammatory prostaglandin E2 and other substances, thereby enhancing the invasion potential of tumor cells, etc (Vene et al., 2020). Therefore, PTGS2 is usually highly expressed in inflammatory and malignant tumor tissues (Hidalgo-Estevez et al., 2020). Western blot results showed that the expressions of ALOX15, CYP1B1 and PTGS2 proteins of UC and CRC groups were abnormally increased, and their expressions were inhibited by GQD. After combined treatment with XELOX and GQD, the expression levels of the three proteins were more reversed to those of the control group. These trends confirmed that ALOX15, CYP1B1 and PTGS2 proteins played a major role in the pathogenesis of UC and CRC. Abnormal increase in the expression level of these proteins can lead to increased inflammation and thus increase the risk of CRC. Moreover, GQD regulated linoleic acid and unsaturated fatty acids metabolism by inhibiting overexpression of ALOX15, CYP1B1 and PTGS2. The changes of metabolites might adjust the structure of the microflora and thus affect the progression of the disease, which is also the key mechanism of the synergistic anti-tumor effect of GQD and XELOX. And ononin, genistein, puerarin, daidzein, skullcapflavone II, baicalin, wogonoside, p-coumaric acid, coptisine, isoliquiritigenin, glyasperin A were the key active components of GQD. All these results served as a crucial benchmark for the creation of novel, efficient, and secure therapy regimens in clinic.
5 Conclusions
Taken together, network pharmacology technology was applied to analyze the components, targets, biological functions of GQD in our study. As a result, the mechanism of prevention and therapy of UC to CRC as well as the ways in which GQD assisting XELOX to treat diseases were excavated. Our outcomings showed that the regulatory effects of XELOX on inflammation, tumor, immune and oxidative stress could be enhanced by GQD. In addition, 16S rDNA sequencing technology and metabolomics results also revealed that GQD combined with XELOX had a unique advantage over XELOX therapy alone in regulating changes in intestinal microbiota and metabolic profile induced by UC and CRC. Ultimately, the key targets and primary ways of GQD were predicted by association analysis of metabolomics with network pharmacology, and the hypothesized mechanism of action was verified by western blot and molecular docking. According to our research, the efficacy of XELOX in the treatment of CRC was effectively increased by GQD. This means that it is possible to reduce the dose of XELOX on the basis of maintaining or even enhancing the efficacy of XELOX, thereby reducing the toxic side effects caused by chemotherapy intervention. Overall, our research offered a fresh perspective on the application of GQD in combination with XELOX to improve patients' quality of life and compliance.
Funding
This work was supported by the National Natural Science Funds of China (Grant No. 81973464/H3203; 8210142956/H3203; 8210132176/H3410), Liaoning Distinguished Professor Project for Qing Li (2017), Shenyang Science and Technology Innovation Project for Young and Middle-aged Talents (RC190505), the project is sponsored by Liaoning BaiQianWan Talents Program in 2019 (A-37), Basic Research Project of Colleges and Universities of Education Department of Liaoning Province (LJKZ0929), Basic Research Project of Colleges and Universities of Education Department of Liaoning Province (LJKQZ2021033).
CRediT authorship contribution statement
Qi Tang: Writing – original draft, Data curation. Juan Xie: Writing – original draft, Data curation. Xinran Jiang: Writing – original draft, Data curation. Mingming Wang: Investigation, Methodology. Wei Guo: Investigation, Methodology. Chen Liang: Validation, Data curation. Xin Jiang: Investigation, Methodology. Qing Li: Resources.
Declaration of competing interest
The authors declare that they have no known competing financial interests or personal relationships that could have appeared to influence the work reported in this paper.
References
- Identification of potential bioactive compounds and mechanisms of GegenQinlian decoction on improving insulin resistance in adipose, liver, and muscle tissue by integrating system pharmacology and bioinformatics analysis. J. Ethnopharmacol.. 2021;264:113289
- [CrossRef] [Google Scholar]
- Chen, C. C., Yang, Y. B., Guo, Y. G., He, J. S., Chen, Z. Y., Qiu, S. H., Zhang, Y. R., Ding, H., Pan, J. H. and Pan, Y. L., 2023. CYP1B1 inhibits ferroptosis and induces anti-PD-1 resistance by degrading ACSL4 in colorectal cancer. Cell Death Dis. 14, 271. https://doi.org/ARTN 271 10.1038/s41419-023-05803-2.
- The risk of colorectal cancer in ulcerative colitis: a meta-analysis. Gut. 2001;48:526-535.
- [CrossRef] [Google Scholar]
- Network pharmacology-based study on the mechanism of gegen qinlian decoction against colorectal cancer. Evid. Based Complement. Alternat. Med.. 2020;2020:8897879.
- [CrossRef] [Google Scholar]
- Inflammation and colorectal cancer: colitis-associated neoplasia. Semin. Immunopathol.. 2013;35:229-244.
- [CrossRef] [Google Scholar]
- Hidalgo-Estevez, A. M., Stamatakis, K., Jimenez-Martinez, M., Lopez-Perez, R., Fresno, M., 2020. Cyclooxygenase 2-regulated genes an alternative avenue to the development of new therapeutic drugs for colorectal cancer. Front. Pharmacol. 11, 533. https://doi.org/ARTN 533 10.3389/fphar.2020.00533.
- Hu, J., Cheng, S. J., Yao, J. Y., Lin, X. T., Li, Y. C., Wang, W. X., Weng, J. R., Zou, Y. F., Zhu, L. X. and Zhi, M., 2022. Correlation between altered gut microbiota and elevated inflammation markers in patients with Crohn's disease. Front Immunol. 13, 947313. https://doi.org/ARTN 947313 10.3389/fimmu.2022.947313.
- Alteration of gut microbiota in inflammatory bowel disease (IBD): cause or consequence? IBD treatment targeting the gut microbiome. Pathogens.. 2019;8:126.
- [CrossRef] [Google Scholar]
- Kulkarni, A., Nadler, J. L., Mirmira, R. G. and Casimiro, I., 2021. Regulation of tissue inflammation by 12-lipoxygenases. Biomolecules. 11, 717. https://doi.org/ARTN 717 10.3390/biom11050717.
- PTGS2 (Cyclooxygenase-2) expression and survival among colorectal cancer patients: a systematic review. Cancer Epidem. Biomar.. 2013;22:1490-1497.
- [CrossRef] [Google Scholar]
- Tissue metabolism and the inflammatory bowel diseases. J. Mol. Med.. 2017;95:905-913.
- [CrossRef] [Google Scholar]
- Effect of Gegenqinlian decoction on intestinal mucosal flora in mice with diarrhea induced by high temperature and humidity treatment. 3. Biotech. 2021;11:83.
- [CrossRef] [Google Scholar]
- Network pharmacology-based analysis of Gegenqinlian decoction regulating intestinal microbial activity for the treatment of diarrhea. Evid. Based Complement. Alternat. Med.. 2021;2021:5520015.
- [CrossRef] [Google Scholar]
- In Silico and in vivo studies on the mechanisms of Chinese medicine formula (Gegen Qinlian decoction) in the treatment of ulcerative colitis. Front. Pharmacol.. 2021;12:665102
- [CrossRef] [Google Scholar]
- Gegen Qinlian decoction treats diarrhea in piglets by modulating gut microbiota and short-chain fatty acids. Front. Microbiol.. 2019;10:825.
- [CrossRef] [Google Scholar]
- Inflammatory bowel disease extending its reach. Gastroenterology. 2005;129:1117-1120.
- [CrossRef] [Google Scholar]
- Pleiotropic functions of cytochrome P450 monooxygenase-derived eicosanoids in cancer. Front. Pharmacol.. 2020;11 https://doi.org/ARTN 580897 10.3389/fphar.2020.580897
- [Google Scholar]
- Naturally occurring anti-cancer compounds: shining from Chinese herbal medicine. Chin. Med.. 2019;14:48.
- [CrossRef] [Google Scholar]
- Gut microorganisms act together to exacerbate inflammation in spinal cords. Nature. 2020;585:102-106.
- [CrossRef] [Google Scholar]
- Gut microbiota in the pathogenesis of inflammatory bowel disease. Clin. J. Gastroenterol.. 2018;11:1-10.
- [CrossRef] [Google Scholar]
- Lysophosphatidylserines derived from microbiota in Crohn's disease elicit pathological Th1 response. J. Exp. Med.. 2022;219 10.1084/jem.20211291. <https://doi.org/ARTN e20211291>
- [Google Scholar]
- Interleukin-6 mediated upregulation of CYP1B1 and CYP2E1 in colorectal cancer involves DNA methylation, miR27b and STAT3. Brit. J. Cancer.. 2014;111:2287-2296.
- [CrossRef] [Google Scholar]
- Investigating the mechanism of scutellariae barbata herba in the treatment of colorectal cancer by network pharmacology and molecular docking. Evid. Based Complement. Alternat. Med.. 2021;2021:3905367.
- [CrossRef] [Google Scholar]
- Preventing adverse events of chemotherapy by educating patients about the nocebo effect (RENNO study) - study protocol of a randomized controlled trial with gastrointestinal cancer patients. BMC Cancer. 2018;18:916.
- [CrossRef] [Google Scholar]
- Raja, G., Venkatesh, G., Al-Otaibi, J. S., Vennila, P., Mary, Y. S., Sixto-López, Y., 2022. Synthesis, characterization, molecular docking and molecular dynamics simulations of benzamide derivatives as potential anti-ovarian cancer agents. J. Mol. Struct. 1269. https://doi.org/ARTN 133785 10.1016/j.molstruc.2022.133785.
- Oral chemotherapy adherence: a novel nursing intervention using an electronic health record workflow. Clin. J. Oncol. Nurs.. 2017;21:165-167.
- [CrossRef] [Google Scholar]
- Chronic ulcerative colitis and colorectal cancer. Cancer Lett.. 2014;345:235-241.
- [CrossRef] [Google Scholar]
- Ruparel, S., Green, D., Chen, P., Hargreaves, K. M., 2012. The cytochrome P450 inhibitor, ketoconazole, inhibits oxidized linoleic acid metabolite-mediated peripheral inflammatory pain. Mol. Pain. 8, p. 73. https://doi.org/Artn 73 10.1186/1744-8069-8-73.
- Colorectal dysplasia in inflammatory bowel disease: a clinicopathologic perspective. Clin. Gastroenterol. Hepatol.. 2014;12:359-367.
- [CrossRef] [Google Scholar]
- Identifying the molecular basis of Jinhong tablets against chronic superficial gastritis via chemical profile identification and symptom-guided network pharmacology analysis. J. Pharm. Anal.. 2022;12:65-76.
- [CrossRef] [Google Scholar]
- Recent advances in the treatment of colorectal cancer: a review. J. Nippon Med. Sch.. 2022;89:246-254.
- [CrossRef] [Google Scholar]
- Traditional Chinese Medicine and colorectal cancer: implications for drug discovery. Front. Pharmacol.. 2021;12:685002
- [CrossRef] [Google Scholar]
- Vene, R., Costa, D., Augugliaro, R., Carlone, S., Scabini, S., Pattacini, G. C., Boggio, M., Zupo, S., Grillo, F., Mastracci, L., Pitto, F., Minghelli, S., Ferrari, N., Tosetti, F., Romairone, E., Mingari, M. C., Poggi, A. and Benelli, R., 2020. Evaluation of glycosylated PTGS2 in colorectal cancer for NSAIDS-based adjuvant therapy. Cells-Basel. 9, p. 683. https://doi.org/ARTN 683 10.3390/cells9030683.
- Structural, Spectral, Molecular Docking, and Molecular Dynamics simulations of phenylthiophene-2-carboxylate compounds as potential anticancer agents. Polycycl. Aromat. Comp. 2023
- [CrossRef] [Google Scholar]
- The efficacy and safety of modified Gegenqinlian Fomular for advanced colorectal cancer (damp heat accumulation type): a multicenter randomized controlled trial. Medicine (Baltimore). 2021;100:e27850.
- [CrossRef] [Google Scholar]
- Rhein modulates host purine metabolism in intestine through gut microbiota and ameliorates experimental colitis. Theranostics.. 2020;10:10665-10679.
- [CrossRef] [Google Scholar]
- Arachidonic acid 15-lipoxygenase: effects of its expression, metabolites, and genetic and epigenetic variations on airway onflammation. Allergy Asthma Immun.. 2021;13:684-696.
- [CrossRef] [Google Scholar]
- Uncovering the mechanism of Ge-Gen-Qin-Lian decoction for treating ulcerative colitis based on network pharmacology and molecular docking verification. Biosci. Rep.. 2021;41 BSR20203565 10.1042/BSR20203565
- [Google Scholar]
- Interaction between microbiota and immunity in health and disease. Cell Res.. 2020;30:492-506.
- [CrossRef] [Google Scholar]
- Protective effects of berberine hydrochloride on DSS-induced ulcerative colitis in rats. Int. Immunopharmacol.. 2019;68:242-251.
- [CrossRef] [Google Scholar]
- Epidemiological trends in colorectal cancer in China: an ecological study. Digest Dis. Sci.. 2017;62:235-243.
- [CrossRef] [Google Scholar]
Appendix A
Supplementary material
Supplementary data to this article can be found online at https://doi.org/10.1016/j.arabjc.2024.105625.
Appendix A
Supplementary material
The following are the Supplementary data to this article:Supplementary data 1
Supplementary data 1


