

Translate this page into:
Extraction and purification of total flavonoids from Gnaphalium affine D. Don and their evaluation for free radicals’ scavenging and oxidative damage inhabitation potential in mice liver
⁎Corresponding authors. shenybin412@gmail.com (Yingbin Shen), amabbasi@cuiatd.edu.pk (Arshad Mehmood Abbasi), shansharui@126.com (Sharui Shan)
-
Received: ,
Accepted: ,
This article was originally published by Elsevier and was migrated to Scientific Scholar after the change of Publisher.
Abstract
The parameters for pressurized microwave-assisted extraction (PMAE) of total flavonoids (TFs) from Gnaphalium affine D. Don were investigated and the effect of PMAE on its cell wall and tissue structure was analyzed via scanning electron microscopy (SEM). Afterwards, its extraction effect was compared with that of microwave-assisted extraction (MAE), soxhlet extraction (SE) and heat reflux extraction (HRE). After purifying by AB-8 macroporous resin, the in vitro and in vivo antioxidant activities of purified TFs were evaluated by five different chemical assays and alcohol-induced model, respectively. Our findings revealed that an ethanol volume fraction of 81.3%, a L/S ratio of 25.4 mL/g and an extraction time of 138 s, give maximum yield of TFs (1.35 ± 0.02%). PMAE was more efficient and rapid in extracting TFs from G. affine because it cracked the cell wall and disrupted the tissue structure, as observed by SEM. Compared with microwave-assisted extraction (MAE), soxhlet extraction (SE) and heat reflux extraction (HRE), PMAE was more efficient and rapid technique for the extraction of TFs from G. affine. TFs from G. affine showed notable free radical, including 2,2-diphenyl-1-picrylhydrazyl (DPPH), superoxide anion, 2,2′-azinobis-(3-ethylbenzothiazoline-6-sulfonic acid)-diammonium salt (ABTS) cation, scavenging abilities and reduction ability in vitro. It could also significantly reduce the level of malondialdehyde (MDA), enhance the activity of superoxide dismutase (SOD) and total antioxidant capacity (T-AOC), and increase the level of glutathione (GSH) in the liver of mice with oxidative damage in a dose-dependent manner. Therefore, it showed good antioxidant capacity in vivo. TFs from G. affine indicated good in vitro and in vivo antioxidant activities, which suggests their potential in functional foods and pharmaceuticals as natural antioxidants agents.
Keywords
PMAE
Purified flavonoids
SEM
Free radicals
Oxidative damage
Gnaphalium affine

1 Introduction
Gnaphalium affine D. Don (cud weed), belonging to Asteraceae, is consumed as a vegetable and traditional herbaceous plant in many Asian countries (Huang et al., 2015; Zeng et al., 2013). G. affine has been reported to possess many pharmacological properties, such as anti-inflammatory activity (Seong et al., 2016), anti-complementary activity (Xi et al., 2012), xanthine oxidase (Lin et al., 2014) and human neutrophil elastase (Ryu et al., 2016) inhibitory effects as well as demonstrate positive effects against hyperuricemia and acute gouty arthritis (Zhang et al., 2017). The aforementioned properties of G. affine are mainly attributed to its abundance in functional constituents which had been well studied. Many constituents have been isolated from G. affine, especially flavonoids, including apigenin, luteolin, and quercetin (Xi et al., 2012), and to date research efforts keep contributing to the discovery of new natural flavonoids from different parts of this plant species (Itakura et al., 1975). Compared with artificial antioxidants which are related to certain toxic and side effects, natural antioxidants are gaining more popularities. Therefore, G. affine could be considered as a good source for research scholar who are exploring new sources of healthy natural antioxidants. To date only traditional methods had been used to study polyphenolics and bioactivities of G. affine, however, application of pressurized microwave-assisted extraction (PMAE) and optimizing the parameters of extraction of bioactive compounds, specifically total flavonoids (TFs) in G. affine have rarely reported.
PMAE is a relatively novel extraction method that boosts the faster rupture of plant tissue and release of phytochemicals by microwaves and high pressures (Al-Harahsheh and Kingman, 2004; Wang et al., 2008). Compared with conventional extraction methods, PMAE offers various advantages including high speed, low consumption, low solvent usage, and less impurities (Alupului et al., 2012). And it has widely been applied in environmental, food and drug extraction, such as the extraction of benzotriazole, benzothiazole and benezenesulfonamide compounds from soil samples (Speltini et al., 2016) and triazines in infant nutrient cereal-based foods (You et al., 2007).
In this context, this study intended to confirm the efficacy of PMAE as a rapid method of extraction of TFs from G. affine. The extraction effect of PMAE was compared with microwave-assisted extraction (MAE), soxhlet extraction (SE) and heat reflux extraction (HRE). Subsequently, the in vitro antioxidant activities of the purified TFs were evaluated using the free radical scavenging assays and reduction assays, and the in vivo antioxidant activities were assessed by alcohol-induced mice model, in order to obtain an effective and non-toxic natural antioxidant source for functional foods and pharmaceuticals.
2 Materials and methods
2.1 Plant material
G. affine D. Don was collected from Baichuan Pharmaceutical Co., Ltd. (Bozhou, Anhui, China) and identified by Prof. Weidong Wang, Department of Food Sciences, Xuzhou University of Technology on 25th March 2018, which was authenticated and deposited with voucher number NO. 20180325-1 at the separation and purification laboratory of Food Department, Xuzhou University of Technology, Xuzhou. It was dried at 50 °C in an oven (GZX-9070MBE, Boxun, Shanghai, China) with air circulation, and ground to the fine, homogeneous powder using a grinder (WKX-160, Jingcheng, Qingzhou, Shandong, China), then sieved through an 80 mesh sieve and kept in a sealed plastic bag at room temperature prior to use.
2.2 Chemicals
Rutin (≥98%) and ascorbic acid (≥98%) were purchased from Hefei biobomei biotechnology Co., Ltd. (Hefei, Anhui, China). 2,2-diphenyl-1-picrylhydrazyl (DPPH, ≥98.0%) was purchased from Sigma-Aldrich Chemical Co., Ltd. (St. Louis, MO, USA). 2,2′-azinobis-(3-ethylbenzothiazoline-6-sulfonic acid) diammonium salt (ABTS, ≥98.0%) and 2,4,6-tripyridyl-s-triazine (TPTZ), ≥98%) were purchased from Sinopharm Chemical Reagent Co., Ltd. (Shanghai, China). Malondialdehyde (MDA) assay kit (A003-4), Glutathione (GSH) assay kit (A006-2), Superoxide dismutase (SOD) assay kit (A001-3), Total antioxidant capacity (T-AOC) assay kit (A015-1) and Total protein assay kit (A045-3) were purchased from Nanjing Jiancheng Bioengineering Institute (Nanjing, Jiangsu, China). Bifendatatum was purchased from Shanghai Bide Pharmaceutical Technology Co., Ltd. (Shanghai, China). All other chemicals used were of analytical grade and procured from Sinopharm Chemical Reagent Co., Ltd. (Shanghai, China). AB-8 macroporous resin was purchased from Anhui Sanxing Resin Technology Co., Ltd. (Bengbu, Anhui, China).
2.3 Pressurized microwave-assisted extraction (PMAE)
G. affine powder (0.5 g) was transferred into a liner vessel (60 mL, modified polytetrafluoroethylene) and suspended in ethanol solution. The liner vessel was put into a vessel body, and the closed control vessel and extraction vessel were put into a microwave digestion/extraction system with a pressure, temperature and time control (XT-9900, Xintuo, Shanghai, China). Upon reaching the preset pressure, extraction time was counted, and the extraction was carried out continuously at the preset pressure. After extraction, the vessel was cooled to room temperature. Finally, the extracts were collected, filtrated, concentrated, freeze-dried and stored at −20 °C for the further research.
2.4 Experimental design
The effects of ethanol volume fraction, liquid to solid ratio (L/S ratio), microwave power, extraction time and extraction pressure on the extraction yields of TFs from G. affine were firstly investigated. And then, on the basis of the above results, the Box-Behnken design (Bayar et al., 2018) with three independent variables at three levels was used to optimize the conditions of PMAE. For these experiments, the microwave power was kept at 800 W and the extraction pressure 0.6 MPa. The levels of the three factors were as follows: ethanol volume fraction (x1) of 70%, 80%, and 90%; L/S ratio (x2) of 20, 25, and 30 mL/g; and extraction time (x3) of 120, 150, and 180 s. The extraction yields were taken as the dependent variable. The generalized second-order polynomial model used in the response surface analysis was as follows:
2.5 Estimation of extraction yields
The extraction yields of TFs was calculated according to the following equation:
2.6 Scanning electron microscopy analysis
Scanning electron microscopy (SEM) was applied to investigate the effect of microwaves on the structure of G. affine (Y. Chen et al., 2020; Tchinda et al., 2018). Briefly, G. affine samples before and after extraction were collected and dried in air. SEM images of samples were obtained using a low vacuum scanning electronic microscope (SEM, TM3000, Hitachi Ltd., Japan). Dried sample was placed on a specimen holder using double-sided adhesive tapes and then sputtered with gold powder to a thickness of approximately 100 nm using a sputter coater. The sample was observed with magnifications of 1200 at an accelerating potential of 10 kV under a low vacuum condition.
2.7 Other extraction methods
2.7.1 Microwave-assisted extraction (MAE)
G. affine powder (0.5 g) was suspended in 15 mL 80% ethanol in a 50 mL triangular flask. Then the triangular flask was placed in a MAE apparatus (CW-2000, Xintuo, Shanghai, China). The extraction was carried out at 400 W with a frequency of 2450 MHz for 360 s. Finally, the extracts were treated as Section 2.3.
2.7.2 Soxhlet extraction (SE)
G. affine powder (0.5 g) was placed in a Soxhlet extractor, which was fitted with a 100 mL round-bottom flask containing 60 mL 80% ethanol. Then the extractant was heated to reflux for 5 h in a water bath under nitrogen. Finally, the extracts were treated as Section 2.3.
2.7.3 Heat reflux extraction (HRE)
G. affine powder (0.5 g) was mixed with 50 mL 80% ethanol in a 100 mL round-bottom flask fitted with a cooling condenser. Then the mixture was refluxed for 2.5 h. Finally, the extracts were treated as Section 2.3.
2.8 Determination of total flavonoid, flavonol, flavanol and anthocyanin contents
The content of TFs was determined according to the colorimetric method (Chen et al., 2019a,b) with some modifications. Briefly, rutin (16 mg) was dissolved in 100 mL 60% (w/v) ethanol and 0.0, 0.5, 1.0, 1.5, 2.0, 2.5, 3.0, 3.5 and 4.0 mL concentrations were prepared and precisely transferred to 10 mL colorimetric tubes. After mixing, 60% (v/v) ethanol was added to the volume of 5 mL. Subsequently, to each tube, 0.3 mL 5% (w/v) sodium nitrite was added, and the solution was kept for 6 min at room temperature under the dark. Then, 0.3 mL 10% (w/v) aluminum nitrate was added and mixed. After 6 min at room temperature under the dark, 4 mL 1 M sodium hydroxide was added to each colorimetric tube. The solution was allowed to stand for 10 min at room temperature under the dark, and the absorbance at 510 nm was measured using a UV–Vis spectrophotometer (Shanghai Spectrum Instrument Co. Ltd., China) against a blank solution. The contents of TFs the samples were expressed as rutin equivalents (mg RE/g).
The content of total flavonols was determined according to the colorimetric method (Y. ChenWang et al., 2019) with some modifications. Briefly, 1.0 mL of varying concentrations of rutin and 1.0 mL 2% (w/v) aluminium chloride were mixed with 3.0 mL 5% (w/v) sodium acetate in a 10 mL colorimetric tube. Then, the mixture was shaken vigorously and incubated at 20 °C in the dark for 2.5 h. Subsequently, the absorbance at 440 nm was measured, and the result was expressed as mg rutin equivalents per gram of freeze-dried sample (mg RE/g).
The content of total flavanols was determined according to the colorimetric method (Chen et al., 2017) with some modifications. Briefly, 1.0 mL of varied concentrations of catechin and 3.0 mL 0.1% (w/v) p-DMACA were mixed in a 10 mL colorimetric tube. After 20 min of incubation at 37 °C under dark conditions, the absorbance was read at 640 nm. Standard curve was drawn using catechin against its absorbance and the results were expressed as mg catechin equivalents per gram of freeze-dried sample (mg CE/g).
The content of total anthocyanin was determined according to the colorimetric method (Chen et al., 2017) with some modifications. Briefly, 25 mM potassium chloride (pH 1.0) and 400 mM sodium acetate (pH 4.5) were used as buffer solutions. After 1 mL of the samples were diluted with 9 mL of either pH 1.0 or pH 4.5 buffer solution in a 10 mL colorimetric tube, the mixture was incubated for 20 min in the dark at room temperature. Subsequently, the absorbances at 520 nm and 700 nm were measured. The anthocyanin content of the samples were calculated as follows:
2.9 Purification of total flavonoids
TFs from G. affine were purified by AB-8 macroporous resin (Anhui Sanxing Resin Technology Co., Ltd, Anhui, China) was the sample flow rate 2 BV/h, the concentration of TFs 1.7 mg/mL, the sample solution pH 4.5, with 60% ethanol as eluent controlling elution flow rate 1 BV/h, elution amount 2.5 BV. At last, the elution solution was collected, concentrated and lyophilized for exploring its phytochemical properties and biological activities, respectively.
2.10 Determination of antioxidant activities in vitro
2.10.1 DPPH radical scavenging assay
The DPPH radical scavenging potential was evaluated using the method of Chen et al. (2016) with some modifications. Briefly, 50 µL of different concentrations of sample solution was mixed with 150 µL of 0.15 mM DPPH (in ethanol) in 96-well plates. After the mixture was incubated for 60 min in the dark at 37 °C, the absorbance of the mixture at 517 nm was measured using a microplate reader (Synergy H1, Bio-Tek, Winooski, VT, USA). Ascorbic acid was used as a positive control. The scavenging rate was calculated as:
2.10.2 Superoxide anion radical scavenging assay
The superoxide anion radical scavenging activity of the samples was evaluated using the method with some modifications (Hu et al., 2019). Briefly, 20 µL of sample solutions and 100 µL of Tris-HCl buffer (50 mM, pH 8.20) were added in 96-well plates. Subsequently, the mixture was incubated in the dark at 37 °C for 20 min. Next, 8 µL of pyrogallol (3 mM of pyrogallol in 10 mM of HCl), which was also pre-incubated at 37 °C for 5 min, was injected to 96-well plates. And then, the mixture was incubated in the dark at 37 °C for 5 min. After incubation, 32 µL of HCl (1 M) was added into the mixture promptly to terminate the reaction. Finally, the absorbance of the mixture was measured at 320 nm using a microplate reader. Ascorbic acid was used as a positive control. The scavenging rate was calculated as Eq. (4).
2.10.3 ABTS+ radical scavenging assay
The ABTS+ radical scavenging activity of the samples was evaluated using the method with some modifications (Ghane et al., 2018). Briefly, the ABTS+ radicals were generated by the reaction of 5 mL of 7 mM ABTS and 88 μL of 140 mM potassium persulphate. After the ABTS solution was left to stand for 12–16 h in the dark at room temperature, its absorbance was adjusted to 0.85 ± 0.02 at room temperature at 734 nm. Subsequently, 40 μL of varying concentrations of sample solution and 160 μL of ABTS+ radical solution were mixed in 96-well plates. After the mixture was incubated at 37 °C in the dark for 60 min, the absorbance of the mixture at 734 nm was measured using a microplate reader. Ascorbic acid was used as a positive control. The scavenging rate was calculated as Eq. (4).
2.10.4 Ferric reducing/antioxidant power assay
The ferric reducing/antioxidant power (FRAP) assay was conducted following the method by (Alcântara et al., 2019) with some modifications. Briefly, the FRAP reagent was prepared by mixing 10 mM TPTZ (in 40 mM HCl), 20 mM ferric chloride and acetate buffer (0.3 M, pH 3.6) at 1:1:10 (v/v/v). Then, 185 µL of freshly prepared FRAP reagent and 15 µL of varying concentrations of sample solution were mixed in 96-well plates. After the plates were incubated at 37 °C in the dark for 10 min, the absorbance at 593 nm was measured using a microplate reader. Ascorbic acid was used as a positive control. The ferric reducing antioxidant power (Afrap) was calculated as follows:
2.10.5 Reducing power assay
The reducing power (RP) assay was conducted following the method by (Borah et al., 2019) with some modifications. Briefly, 10 µL of varying concentrations of sample solution, 25 µL of 0.2 M phosphate buffer (PBS, pH 6.6) and 25 µL of 1% (w/v) potassium ferricyanide were mixed in 96-well plates. After the mixture was incubated at 37 °C in the dark for 30 min, 25 µL of 10% (w/v) trichloroacetic acid was added to terminate the reaction. Subsequently, 85 µL of distilled water and 17 µL of 0.1% (w/v) ferric chloride were added to the above mixture, and the absorbance of the mixture at 700 nm was measured using a microplate reader. Ascorbic acid was used as a positive control. Arp was the reducing power, which was calculated as Eq. (5).
2.11 Determination of antioxidant activities in vivo
2.11.1 Experimental animals
Experiment animal, Kunming mice (No. 171518345492, 18–22 g body weight), were purchased from Peng Yue Laboratory Animal Breeding Co., Ltd (Shandong, China). The mice were maintained in an environmental controlled room (24 ± 1 °C, 55 ± 5% relative humidity) under a 12 h light–dark cycle with standard chow diet and water ad libitum. All methods were carried out in accordance with the technical specification for welfare operation of laboratory animals published by Chinese Association for Laboratory Animal Sciences. All experimental protocols were approved by the Institutional Animal Ethics of local Committee for Animal Care and Use.
2.11.2 Experimental design
Sixty Kunming mice were randomly divided into six groups with ten mice in each group. The mice in normal control group and model control group were orally administered with saline alone, positive control group were administered with bifendate at the doses of 150 mg/kg/day body weight and the treatment groups were administered with TFs at the doses of 75, 150 and 300 mg/mg/kg/day, respectively. All administrations were conducted once a day for 30 consecutive days. On the last day, after a 16-hour fasting period, all mice except for the normal control group were orally administered with a 50% solution of ethanol at a dose of 12 mL/kg body weight to induce oxidative stress.
2.11.3 Liver sample preparation
Liver samples of Kunming mice were homogenized in an ice-cold saline solution (0.9%, w/v) and then centrifuged (4000 g, 10 min, 4 °C). The supernatants were collected and assayed for the measurement of MDA, GSH, SOD and T-AOC. The total protein content was determined based on coomassie blue method using assay kit following the manufacturer's instructions.
2.11.4 Assessment of oxidative damage biomarkers of liver homogenate
The level of MDA as the marker of lipid oxidation, the level of GSH as the non-enzymatic antioxidant, the activity of SOD as the enzymatic antioxidant and T-AOC as the estimator of total antioxidant capacity in defense system were determined using commercial assay kits following the manufacturer's instructions.
2.12 Statistical analysis
The data from experiments run in triplicate are reported as means ± standard deviation (SD). Statistical analysis was performed by using Duncan's multiple range test. All statistical analyses of data were performed using PASW Statistics V18.0 (IBM Co., Armonk, NY, USA). The statistical analysis of the experimental results of Box-Behnken design was carried out, and 2-D contour plots and 3-D response surface plots were plotted using Design-Expert 8.0.6 software (State-Ease, Inc., Minneapolis, MN, USA).
3 Results and discussion
3.1 The optimization of pressurized microwave-assisted extraction
A regression analysis was carried out to fit the mathematical model to the experimental data (Table 1), aiming at an optimal region for the responses studied. The predicted model could be described using the following equation in terms of actual values:
No.
x1
x2
x3
EY (Actual Value %)
EY (Predicted Value %)
1
70
20
150
1.08
1.08
2
90
20
150
1.11
1.10
3
70
30
150
1.06
1.07
4
90
30
150
1.17
1.17
5
70
25
120
1.18
1.17
6
90
25
120
1.24
1.24
7
70
25
180
1.15
1.15
8
90
25
180
1.19
1.20
9
80
20
120
1.21
1.21
10
80
30
120
1.23
1.23
11
80
20
180
1.17
1.17
12
80
30
180
1.21
1.21
13
80
25
150
1.32
1.33
14
80
25
150
1.35
1.33
15
80
25
150
1.33
1.33
16
80
25
150
1.32
1.33
17
80
25
150
1.34
1.33
The significance of each coefficient was determined using the F-test and P-value in Table 2. The corresponding variables are more significant if the absolute F-value becomes greater and the P-value becomes smaller. It could be observed that the linear terms of x1 and x3 as well as the quadratics term of x12, x22, and x32 were significant at 0.01 level and that the linear term of x2 and the interaction term of x1x2 were significant at 0.05 level. As Table 2 showed that the model was of great significance (P < 0.0001), the lack of fit (P > 0.05) was not significant as the coefficient of determination (R2) of the predicted model was 0.9927 and the S/N was 29.15 (much larger than 4). Hence, the predicted model represented the observed values, and the response was sufficiently explained by the model.
Source
Sum of squares
df
Mean square
F-value
P-value
Significance
Model
0.13
9
0.015
105.11
<0.0001
***
x1
7.200 × 10⁻³
1
7.200 × 10⁻³
51.43
0.0002
***
x2
1.250 × 10⁻³
1
1.250 × 10⁻³
8.93
0.0203
*
x3
2.450 × 10⁻³
1
2.450 × 10⁻³
17.5
0.0041
**
x1x2
1.600 × 10⁻³
1
1.600 × 10⁻³
11.43
0.0117
*
x1x3
1.000 × 10⁻⁴
1
1.000 × 10⁻⁴
0.71
0.4260
x2x3
1.000 × 10⁻⁴
1
1.000 × 10⁻⁴
0.71
0.4260
x12
0.062
1
0.062
440.33
<0.0001
***
x22
0.047
1
0.047
337.92
<0.0001
***
x32
1.857 × 10⁻³
1
1.857 × 10⁻³
13.26
0.0083
***
Residual
9.800 × 10⁻⁴
7
1.400 × 10⁻⁴
Lack of Fit
3.000 × 10⁻⁴
3
1.000 × 10⁻⁴
0.59
0.6543
Pure Error
6.800 × 10⁻⁴
4
1.700 × 10⁻⁴
Cor Total
0.13
16
R2 = 0.9927
S/N = 29.15
The regression model allowed the prediction of the effects of the three factors on the extraction yields of TFs from G. affine. The relationship between the independent and dependent variables was illustrated in a three-dimensional representation of the response surfaces generated by the model for TFs (Fig. 1). Two variables were depicted in each of the three-dimensional surface plots. The shape of contour reflects the degree of the mutual effect. An oval suggests that the effect is significant, whereas a circle indicates that it is insignificant. As shown in Fig. 1, the mutual effect between ethanol volume fraction and L/S ratio was significant. In contrast, the mutual effects between ethanol volume fraction and extraction time and between L/S ratio and extraction time were insignificant.
Response surface and contour of effect of two factors on extraction yields of total flavonoids. A. Ethanol volume fraction and L/S ratio, B. Ethanol volume fraction and extraction time, C. L/S ratio and extraction time.
The optimal extraction conditions for achieving the maximal extraction yield of TFs from G. affine obtained by the regression Eq. (6) were as follows: ethanol volume fraction 81.3%, L/S ratio 25.4 mL/g and extraction time 138 s. The predicted extraction yield was 1.34%. Under these conditions, the experimental extraction yield was 1.35 ± 0.02% (n = 3), which was well-matched with the predicted value, indicating the model’s reliability for the extraction process.
3.2 Effect of PMAE on cell wall and tissue structure
The high efficiency of PMAE results from cracking cell wall and disrupting tissue structure under microwave radiation and high pressure, enabling a fast transfer of phytochemicals to the solvent. SEM was used to record the change in the fine structures of G. affine tissue cell wall before and after PAME extraction at a magnification factor of 1200 × are shown in Fig. 2. As shown, surface of the sample cells before PMAE was compact and smooth without ceases and cracks (Fig. 2A). In stark contrast, 138 s of PMAE led to the significant damage of the sample cells surface, which broke completely into irregular pieces (Fig. 2B). After the exposure to PAME, collapse of the cell wall and membrane leads to the irreversible leakage of cellular cytosolic fluids and this process is accompanied by the diffusion of TFs in cytosolic fluids into the extract solvent. SEM images obtained are the visual representation of the morphological changes occurred in G. affine cells. The breakdown of the cell wall and membranes is attributed by microwave and high pressure and the synergy between them as suggested by previous studies (S. S. Chen et al., 1995; Yuan et al., 2019). Microwave leads to the vibration of water and other polar molecules in the cell wall and membrane of G. affine cells as well as extract solvent, generates heat and rises temperature. Consequently, the physiological function of cell wall and membrane is confused (Luo et al., 2008). High pressure could easily affect the fluidity and permeability of cell membrane by disrupting the balance of inner ion concentration (Braganza and Worcester, 1986). In addition, cells are more sensitive to heat due to damage to ribosomes and DNA protective proteins caused by high pressure (Almirón et al., 1992).
SEM micrograph of G. affine D. Don powder. A. G. affine D. Don powder before PMAE, B. G. affine D. Don powder after PMAE.
3.3 Comparison of PMAE with other extraction methods
As shown in Fig. 3A, the classical method, SE, exhibited the highest extraction yield (1.48 ± 0.03%), followed by PMAE (1.35 ± 0.02%), MAE (1.22 ± 0.03%), and HRE had the lowest yield with 1.16 ± 0.04%. The extraction yield of PMAE was 91.22% of that of SE, and 10.66% and 16.38% higher than those of MAE and HRE, respectively. The extraction time of PMAE was only 138 s, whereas MAE required 360 s, and SE and HRE required several hours (Fig. 3B). Therefore, it can be judged that the time and energy consumption of MAE, SE or HRE processes was significantly higher than that of PMAE. Furthermore, this also showed the higher efficiency of PAME than that of MAE and provides evidence of the role of high pressure plays in the extraction process. Consequently, after taking the extraction time and energy consumption into consideration, PAME could be regarded as an efficient method with practical value in the extraction of TFs from G. affine. These results were generally in agreement with the report by L. Chen et al. (2008).
Comparison between different extraction methods. A. Extraction time of different extraction methods, B. Total flavonoids extraction yields of different extraction methods, C. Purities of total flavonoids before and after purification by AB-8 macroporous resin.
AB-8 macroporous resin, a type of weak polar resin, has been extensively applied in the purification of plant flavonoids, because of its physicochemical stability, adsorption/desorption selectivity and recyclability (Hamed et al., 2019; Wu et al., 2019). In Fig. 3C, compared with the purity before purification, the purity after purification was increased by 9.21–10.49 times, which showed that AB-8 macroporous resin had outstanding performance in purifying the flavonoids from G. affine. Similar results was also reported previously (Cui et al., 2018).
3.4 Physicochemical properties of TFs from G. affine
Total flavonoids in plant are important secondary metabolites corresponding to polyphenols with high antioxidant, anti-inflammatory and anticancer properties, which include many classes of subgroups, such as total flavonol, flavanol and anthocyanin and etc. (Gan et al., 2019; Hernández-Rodríguez et al., 2019). Therefore, the determination of their contents in samples is of great significance for the development of related products. In the present study, the total flavonoid, flavonol, flavanol and anthocyanin contents in the purified TFs were evaluated, and the results were 352.26 ± 10.84 mg RE/g, 139.56 ± 2.93 mg RE/g, 2.59 ± 0.02 mg CE/g and 3.23 ± 0.26 mg CGE/g, respectively.
3.5 In vitro antioxidant activities of TFs from G. affine
DPPH radical scavenging assay, based on the reduction of DPPH solution in the presence of a hydrogen-donating substance, has been extensively employed to evaluate the free radical scavenging ability of antioxidants (G.-t. Chen et al., 2012). The superoxide anion is a weak free radical, generated by the mitochondrial electron transport system. However, importantly, it can create other strong free radicals that increase the risk of various types of disease (Siriwardhana and Shahidi, 2002). ABTS+ radical scavenging activity reflects the hydrogen donating and the chain-breaking capacity of the samples (Pérez-Jiménez et al., 2008). FRAP ability is based on the antioxidants’ capacity of reducing Fe3+ to Fe2+ in the presence of TPTZ, forming Fe2+-TPTZ complex with an intense blue color maximum absorbance (λmax) at 593 nm (Dave, 2009). The antioxidant activity is in proportion to the absorbance (Benzie and Strain, 1996). The reducing power of substances was related to the electron donating ability, which served as an indicator of its potential antioxidant activity. Higher absorbance value means stronger reducing power (Hu et al., 2019).
As shown in Fig. 4, the DPPH, superoxide anion and ABTS+ radical scavenging activities, and FRAP and RP ability of TFs from G. affine were evident and positively correlated with increasing concentrations. The scavenging effect on DPPH, superoxide anion and ABTS+ radicals increased the maximum (79.08 ± 2.65%, 79.42 ± 1.33% and 80.89 ± 1.06%) with the TFs concentration up to 50, 50 and 45 μg/mL, respectively. Similarly, the highest FRAP and RP ability were 0.601 ± 0.007 and 0.654 ± 0.006 at the highest concentration at 10 and 80 μg/mL, respectively. Although the antioxidant activities were weaker than ascorbic acid, they still showed good antioxidant activities.
Antioxidant activities in vitro of total flavonoids from G. affine D. Don. A, DPPH radical scavenging assay, B. Superoxide anion radical scavenging assay, C. ABTS+ radical scavenging assay, D. Ferric reducing/antioxidant power (FRAP) assay, E. Reducing power (RP) assay.
3.6 Antioxidant activities in vivo of TFs from G. affine
Body liver metabolizes the majority of ingested alcohol, however an excess of alcohol consumption can induce liver injury and liver disease. To explore the protective effect of TFs from G. affine against alcohol-induced liver injury, the MDA and GSH level, SOD activities, as well as T-AOC were determined. Fig. 5 showed the effects of TFs from G. affine pretreatment on alcohol-induced hepatic MDA and GSH level, SOD activities, and T-AOC in mice. Obviously, there was a significant increase in the MDA level in the model control group when compared with the normal control group, indicating the well-established alcohol-induced hepatotoxicity (Fig. 5A). The elevated MDA level decreased significantly in a concentration-dependent manner in mice pretreated with TFs from G. affine. Compared with the model control group, the MDA levels significantly decreased by 23.3%, 34.3%, and 44.2% in low, medium, and high dose groups, respectively. Similarly, significant decreases were recorded in the GSH level and SOD activities in the model control group when compared with the normal group, further confirming the establishment of the hepatotoxicity (Fig. 5B and C). The administration of TFs from G. affine enhanced both GSH level and SOD activities in a dose-dependent manner. Particularly, compared with the model control group, the GSH level and SOD activities tripled and doubled, respectively, in the high dose group. The T-AOC was also increased after the treatment with TFs from G. affine (Fig. 5D). When comparing the model control group, the T-AOC significantly increased by 39.3% and 51.1%, respectively, in medium and high dose groups. Overall, the results suggested that TFs from G. affine possessed significant hepatoprotective effects on alcohol-induced liver injury and the underlying mechanism may be the regulation of reactive oxygen species (Nordmann et al., 1992). Alcohol-induced liver injury is closely related to oxidative stress (Das and Vasudevan, 2007). In this study, the activities of, non-enzyme antioxidant systems (MDA and GSH), enzyme antioxidant systems (SOD) and T-AOC in the TFs treated groups showed significant differences compared with the model control group. The present results are consistent with the previous reports (Kang et al., 2012; M. Wang et al., 2012) and the protective effect of TFs from G. affine may come from the reduction of oxidative stress.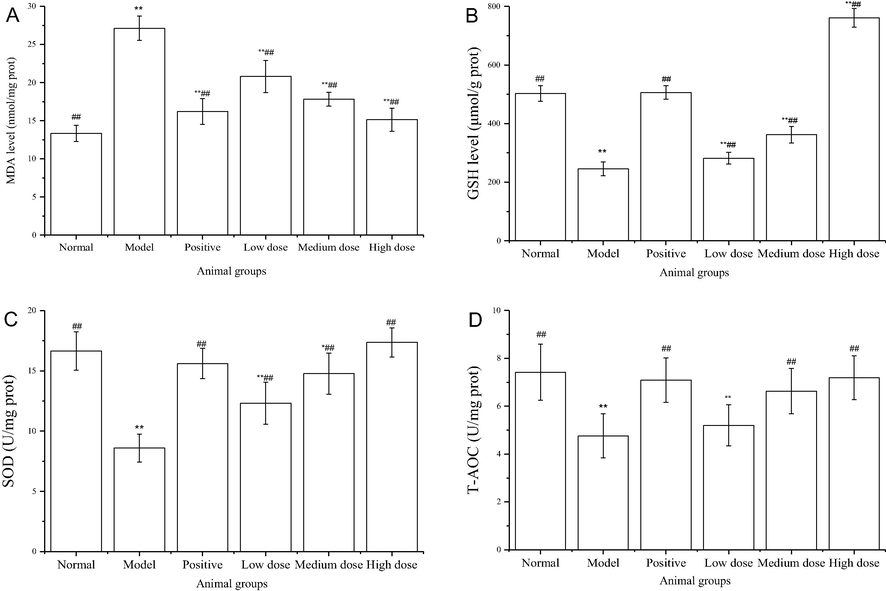
Antioxidant activities in vivo of total flavonoids from G. affine D. Don. A Malondialdehyde (MDA) level in liver samples of Kunming mice, B. Glutathione (GSH) level in liver samples of Kunming mice, C. Superoxide dismutase (SOD) activities of liver samples of Kunming mice, D. Total antioxidant capacity (T-AOC) of liver samples of Kunming mice.
4 Conclusion
The optimal conditions for the extraction yield of TFs were: an ethanol volume fraction of 81.3%, a L/S ratio of 25.4 mL/g and an extraction time of 138 s; under these conditions, the experimental extraction yield would reach 1.35 ± 0.02%. By comparing the two SEM images of “before” and “after” PMAE, it could be concluded that the cell wall was cracked and that the tissue structure was disrupted under microwave irradiation in the high-pressure environment. This enabled TFs to dissolve in the solvent more easily, leaving less TFs in the cell. By comparing the extraction yield and extraction time of PMAE with those of MAE, SE and HRE, it could be concluded that the PMAE is more suitable for the extraction of TFs from G. affine than other extraction methods. The evaluation of the antioxidant activities in vitro and in vivo of the purified TFs suggested that they may be developed as naturally potential antioxidants agents for nutraceuticals and pharmaceuticals. Since this is the first report of antioxidant activities of purified TFs from G. affine, thorough phytochemical analyses need to be performed to identify the possible flavonoid antioxidant components with antioxidant activities.
Acknowledgements
The authors extend their appreciation to the Researchers Supporting Project number (RSP-2020/173) King Saud University Riyadh Saudi Arabia. This research was funded by Six Talent Peaks project in Jiangsu Province (NY-167), “333” Project of Jiangsu Province (2016), the Xuzhou Institute of Technology Project (XKY2018137), Guangdong Pharmaceutical University “Innovation and Strengthening School Project” young innovative talents project (2017KQNCX109) and Talent Project of Guangzhou University (RP2020078).
Declaration of Competing Interest
The authors declare that they have no known competing financial interests or personal relationships that could have appeared to influence the work reported in this paper.
References
- Alcântara, M.A., Polari, I.d.L.B., de Albuquerque Meireles, B.R.L., de Lima, A.E.A., da Silva Junior, J.C., de Andrade Vieira, É., Dos Santos, N.A., de Magalhães Cordeiro, A.M.T., 2019. Effect of the solvent composition on the profile of phenolic compounds extracted from chia seeds. Food Chem., 275, 489-496.
- A novel DNA-binding protein with regulatory and protective roles in starved Escherichia coli. Genes Dev.. 1992;6(12b):2646-2654.
- [Google Scholar]
- Microwave extraction of active principles from medicinal plants. UPB Science Bulletin, Series B. 2012;74(2):129-142.
- [Google Scholar]
- Optimization of enzymatic extraction of pectin from Opuntia ficus indica cladodes after mucilage removal. Food Chem.. 2018;241:127-134.
- [Google Scholar]
- The ferric reducing ability of plasma (FRAP) as a measure of “antioxidant power”: the FRAP assay. Anal. Biochem.. 1996;239(1):70-76.
- [Google Scholar]
- Chemical composition, antioxidant, anti-inflammatory, anti-microbial and in-vitro cytotoxic efficacy of essential oil of Curcuma caesia Roxb. leaves: An endangered medicinal plant of North East India. Ind Crop Prod. 2019;129:448-454.
- [Google Scholar]
- Braganza, L.F., Worcester, D.L., 1986. Structural changes in lipid bilayers and biological membranes caused by hydrostatic pressure. Biochemistry-Us, 25(23), 7484-7488.
- Isolation, purification and antioxidant activities of polysaccharides from Grifola frondosa. Carbohydr. Polym.. 2012;89(1):61-66.
- [Google Scholar]
- Dynamic microwave-assisted extraction of flavonoids from Herba Epimedii. Sep. Purif. Technol.. 2008;59(1):50-57.
- [Google Scholar]
- Kinetics of microwave extraction of rosemary leaves in hexane, ethanol and a hexane+ ethanol mixture. Flavour Frag J.. 1995;10(2):101-112.
- [Google Scholar]
- Comparative study on the phytochemical profiles and cellular antioxidant activity of phenolics extracted from barley malts processed under different roasting temperatures. Food Funct.. 2019;10(4):2176-2185.
- [Google Scholar]
- Phytochemical content, cellular antioxidant activity and antiproliferative activity of Adinandra nitida tea (Shiyacha) infusion subjected to in vitro gastrointestinal digestion. RSC Adv.. 2017;7(80):50430-50440.
- [Google Scholar]
- Steam flash explosion pretreatment enhances soybean seed coat phenolic profiles and antioxidant activity. Food Chem.. 2020;319:10.
- [Google Scholar]
- Phytochemical analysis, cellular antioxidant and alpha-glucosidase inhibitory activities of various herb plant organs. Ind. Crop Prod.. 2019;141
- [Google Scholar]
- Enhancing antioxidant activity and antiproliferation of wheat bran through steam flash explosion. J. Food Sci. Tech. Mys.. 2016;53(7):3028-3034.
- [Google Scholar]
- Sustainable deep eutectic solvents preparation and their efficiency in extraction and enrichment of main bioactive flavonoids from sea buckthorn leaves. J. Cleaner Prod.. 2018;184:826-835.
- [Google Scholar]
- In vitro models for antioxidant activity evaluation and some medicinal plants possessing antioxidant properties: An overview. Afr. J. Microbiol. Res.. 2009;3(13):981-996.
- [Google Scholar]
- Gan, R.-Y., Chan, C.-L., Yang, Q.-Q., Li, H.-B., Zhang, D., Ge, Y.-Y., Gunaratne, A., Ge, J., Corke, H., 2019. 9 - Bioactive compounds and beneficial functions of sprouted grains. In H. Feng, B. Nemzer & J. W. DeVries (Eds.), Sprouted Grains, (pp. 191-246): AACC International Press.
- Antioxidant, anti-diabetic, acetylcholinesterase inhibitory potential and estimation of alkaloids (lycorine and galanthamine) from Crinum species: An important source of anticancer and anti-Alzheimer drug. Ind. Crop Prod.. 2018;125:168-177.
- [Google Scholar]
- Extraction, purification by macrospores resin and in vitro antioxidant activity of flavonoids from Moringa oliefera leaves. S. Afr. J. Bot.. 2019;124:270-279.
- [Google Scholar]
- Hernández-Rodríguez, P., Baquero, L.C.P., Larrota, H.R. 2019. Flavonoids: Potential Therapeutic Agents by Their Antioxidant Capacity. In)
- Enzymolysis-ultrasonic assisted extraction of flavanoid from Cyclocarya paliurus (Batal) Iljinskaja: HPLC profile, antimicrobial and antioxidant activity. Ind. Crop Prod.. 2019;130:615-626.
- [Google Scholar]
- Anti-inflammatory effects of the extract of Gnaphalium affine D. Don in vivo and in vitro. J. Ethnopharmacol.. 2015;176:356-364.
- [Google Scholar]
- Flavonoids in the Flowers of Gnaphalium affine D. Don. Agric. Biol. Chem.. 1975;39(11):2237-2238.
- [Google Scholar]
- Hepatoprotective effects of dieckol-rich phlorotannins from Ecklonia cava, a brown seaweed, against ethanol induced liver damage in BALB/c mice. Food Chem. Toxicol.. 2012;50(6):1986-1991.
- [Google Scholar]
- Inhibition of xanthine oxidase activity by gnaphalium affine extract. Chin. Med. Sci. J.. 2014;29(4):225-230.
- [Google Scholar]
- Current applications of sterilization with microwave in food industry. Jiangsu Condiment and Subsidiary Food. 2008;3(011)
- [Google Scholar]
- Implication of free radical mechanisms in ethanol-induced cellular injury. Free Radical Bio. Med.. 1992;12(3):219-240.
- [Google Scholar]
- Updated methodology to determine antioxidant capacity in plant foods, oils and beverages: Extraction, measurement and expression of results. Food Res. Int.. 2008;41(3):274-285.
- [Google Scholar]
- Application of response surface methodology to acidified water extraction of black soybeans for improving anthocyanin content, total phenols content and antioxidant activity. Food Chem.. 2018;261:260-266.
- [Google Scholar]
- The constituent, anti-inflammation, and human neutrophil elastase inhibitory activity of Gnaphalium affine. J. Funct. Foods. 2016;27:674-684.
- [Google Scholar]
- The anti-inflammatory effect of Gnaphalium affine through inhibition of NF-κB and MAPK in lipopolysaccharide-stimulated RAW264. 7 cells and analysis of its phytochemical components. Cell Biochem. Biophys.. 2016;74(3):407-417.
- [Google Scholar]
- Antiradical activity of extracts of almond and its by-products. J. Am. Oil Chem. Soc.. 2002;79(9):903-908.
- [Google Scholar]
- Fast low-pressurized microwave-assisted extraction of benzotriazole, benzothiazole and benezenesulfonamide compounds from soil samples. Talanta. 2016;147:322-327.
- [Google Scholar]
- Inhibition of fungi with wood extractives and natural durability of five Cameroonian wood species. Ind. Crop Prod.. 2018;123:183-191.
- [Google Scholar]
- Preliminary characterization, antioxidant activity in vitro and hepatoprotective effect on acute alcohol-induced liver injury in mice of polysaccharides from the peduncles of Hovenia dulcis. Food Chem. Toxicol.. 2012;50(9):2964-2970.
- [Google Scholar]
- Analysis of ginsenosides in Panax ginseng in high pressure microwave-assisted extraction. Food Chem.. 2008;110(1):161-167.
- [Google Scholar]
- Green and efficient extraction of total glucosides from Paeonia lactiflora Pall. ‘Zhongjiang’ by subcritical water extraction combined with macroporous resin enrichment. Ind. Crop Prod.. 2019;141 111699
- [Google Scholar]
- Anti-complementary activity of flavonoids from Gnaphalium affine D. Don. Food Chem.. 2012;130(1):165-170.
- [Google Scholar]
- Determination of triazines in infant nutrient cereal-based foods by pressurized microwave-assisted extraction coupled with high-performance liquid chromatography–mass spectrometry. J. Chromatogr. B. 2007;856(1–2):278-284.
- [Google Scholar]
- Research on the high hydrostatic pressure and microwave combined inactivation process and the application to boiled bamboo shoots. J. Food Safety. 2019;39(2):e12616
- [CrossRef] [Google Scholar]
- The antioxidant activity and active component of Gnaphalium affine extract. Food Chem. Toxicol.. 2013;58:311-317.
- [Google Scholar]
- Effects of Gnaphalium affine D. Don on hyperuricemia and acute gouty arthritis. J. Ethnopharmacol.. 2017;203:304-311.
- [Google Scholar]


