

Translate this page into:
Fabrication of hydrophilic luminescent zinc oxide quantum dots for selective detection of copper ions and efficient inhibition of harmful fungi
⁎Corresponding authors. sunqi2017@cqnu.edu.cn (Qi Sun), yongxie88@163.com (Yong Xie)
-
Received: ,
Accepted: ,
This article was originally published by Elsevier and was migrated to Scientific Scholar after the change of Publisher.
Peer review under responsibility of King Saud University.
Abstract
In this study, we have successfully prepared surface modified zinc oxide quantum dots (M-ZnO QDs) with ultra-stable fluorescence and excellent hydrophilicity through introducing (3-aminopropyl)triethoxysilane (APTES). The as-prepared M-ZnO QDs under the optimum condition presented strong yellow fluorescence emission under 355 nm excitation and showed satisfied reproducibility. Physical and chemical properties of the synthesized ZnO QDs were further studied by various characterization techniques. Transmission electron microscopy showed homogeneous distribution of spherical M-ZnO QDs with the average particle size of 4.03 nm. According to the characteristic that metal ions can quench fluorescence, M-ZnO QDs-based fluorescence sensor for the detection of Cu2+ in aqueous solution is developed in this work, which has the advantages of excellent selectivity, good sensitivity and a wide linear range. The limit of detection was 0.51 μM and the linear detection range was 1–200 μM for Cu2+ determination. The practicability of the fluorescent probe is further validated in the lake water and the satisfactory spiked recoveries of Cu2+ ranges from 99.1 % to 108.8 %. Besides, M-ZnO QDs displayed concentration inhibition effect and strain effect on the growth of fungi. Thus, the as-prepared M-ZnO QDs are demonstrated to be promising for Cu2+ determination and anti-fungal applications.
Keywords
Surface modification
Hydrophilic quantum dots
Fluorescence detection
Copper ion
Antifungal effect

1 Introduction
While copper ions (Cu2+) are an essential microelement necessary for keeping normal hematopoietic function and biological enzyme activity, the excessive uptake of Cu2+ may be a great risk to human health through the food chain (Shi et al., 2011a,b). Its concentration levels above tolerance limits can cause adverse effects on aquatic ecosystems. Thus, the World Health Organization recommends an upper limit of 2 mg/L (∼31 μM) for Cu2+ in drinking water (Sánchez et al., 2021), but the maximum allowable limits restricted by the United States of Environmental Protection Agency and the Chinese national standard are 1.3 mg/L (∼20 μM) and 1 mg/L (∼16 μM), respectively (Ding et al., 2014). Most approaches for Cu2+ detection, such as flame atomic absorption spectrometry, inductively coupled plasma-atomic emission spectrometry, and inductively coupled plasma-mass spectrometry (Procházková and Halko 2016, Trinta et al., 2020), have advantages of high sensitivity and accuracy. However, these methods demonstrate drawbacks of a complex operation, high costs and long detection time, which greatly limit their widespread applications.
As a new kind of zero-dimensional nanomaterial, quantum dots (QDs) have drawn much attention in recent years because of their excellent optical, electrical characteristics and unique quantum size effect (Arquer et al., 2021). They have been developed fast in many fields such as bioimaging, optoelectronic devices, medical diagnosis and chemical sensing (Lu et al., 2017, McHugh et al., 2018, Zhou et al., 2021). They have also been widely applied in the evaluation of heavy metal ions in environmental samples (especially to aqueous systems) due to their excellent luminous performance, narrow emission spectra and photobleaching resistance. Capped or functionalized QDs like CdS (Kumar and Dutta, 2017) and CdSe/ZnS QDs (Vasudevan et al., 2015) have been considered as an effective fluorescence probe Cu2+ detection. In addition to the above semiconductor QDs, carbon QDs (Wang et al., 2019) and black phosphorus QDs (Xu et al., 2020) have also been examined to detect metal ions. However, these proposed QDs still have some drawbacks: some species containing toxic element like CdSe and CdTe QDs, etc (Sharma et al., 2017). Some QDs are always prepared under high temperature thermal treatment or complex reaction conditions. Considering most detection systems of metal ions are aqueous solutions, low water solubility is also the main limitation for many QDs-based fluorescent sensors. In contrast, ZnO QDs are deemed better candidates as they do not contain toxic elements and have a promising photoluminescence and inexpensive cost (Sahoo et al., 2018). Moreover, ZnO QDs have been reported to be good antimicrobial activity against Klebsiella pneumoniae strain MB45, Straphylococcus aureus and pathogenic yeast Candida auris (Kumar et al., 2011, Gangadoo et al., 2022). However, pure ZnO QDs prepared by the traditional sol–gel method usually tend to agglomerate resulting in decreased stability and fluorescence, which in turn influence the detection performance and antimicrobial activity of QDs. Although several polymer-stabilized ZnO QDs have been demonstrated, these modified ZnO QDs were generally hydrophobic and the luminescence intensity may decrease by polymer-capping (Abdullah et al., 2003, Li et al., 2007, Xiong et al., 2007).
Herein, we introduced (3-aminopropyl) triethoxysilane (APTES) as the surface modifier for obtaining hydrophilic ZnO QDs. The APTES-modified ZnO QDs (namely M-ZnO QDs) with highly photostable and excellent water solubility were realized through a layer of silica nanonetwork around the core of QDs. Meanwhile, M-ZnO QDs can act as “turn-off” fluorescent switch probes for Cu2+ detection in aqueous solution with excellent selectivity, good sensitivity and a wide linear range. Moreover, it exhibited concentration effect and strain effect against the growth of Aspergillus niger and Verticillium dahlia. Therefore, the obtained results can provide a promising hydrophilic QDs for Cu2+ detection and anti-fungal applications.
2 Materials and methods
2.1 Materials and chemicals
Zinc acetate dihydrate, APTES, potassium hydroxide, n-hexane, absolute ethanol and other chemicals were bought from Aladdin Co., ltd (Shanghai, China) and analytically pure. Potato dextrose agar (PDA) medium was obtained from Hope Biol-Technology Co., ltd (Qingdao, China). The fungal strain Aspergillus niger CGMCC 3.1454 was purchased from China General Microbiological Culture Collection Center (CGMCC, Beijing, China). The Verticillium dahlia wild-type strain V991 was provided by the Institute of Plant Protection, Chinese Academy of Agricultural Sciences (CAAS, Beijing, China).
2.2 Characterization methods
The morphology and particle size of ZnO QDs were examined by a Tecnai G2-F20 transmission electron microscopy (TEM, FEI, USA). X-ray diffraction (XRD) and Fourier transform infrared (FT-IR) spectra were recorded using Rigaku D/Max-2400 X-ray diffractometer (Rigaku, Japan) and IFS120HR Fourier transform infrared spectroscopy (Bruker, German), respectively. The ultraviolet–visible (UV–vis) absorption spectra were tested with a UH5300 UV–vis spectrophotometer (Hitachi, Japan) with a standard 1.0 cm path length quartz cell. All fluorescence (FL) spectra were evaluated using a F-7100 fluorescence spectrophotometer (Hitachi, Japan). The fluorescence lifetime curves for both ZnO QDs were recorded using Hamamatsu compact fluorescence lifetime spectrometer C11367 configuring a LED light source with λex = 365 nm.
2.3 Synthesis of ZnO QDs
To obtain hydrophilic QDs, the first step was to obtain pure ZnO QDs. In a typical synthesis, 5.0 g zinc acetate dihydrate was dissolved in 150 mL of absolute ethanol and the obtained solution was refluxed at 80℃ for 2 h to allow for complete solubilization. After the prepared solution was cooled to room temperature, potassium hydroxide-ethanol solution (20 mL, 1.75 mol/L) was slowly poured into the above-mentioned solution. It clearly can be noted that the mixed solution turns into a milky white and gradually becomes colorless and transparent. For ZnO QDs without surface modification (namely U-ZnO QDs), the obtained colorless reaction solution was mixed in a 1:3 ratio with n-hexane. For APTES-modified ZnO QDs (denoted as M-ZnO QDs), 25 % (vol/vol) APTES aqueous solution was added drop by drop to the above reaction solution while stirring. During the mixing of the reaction solutions in two different ways, the white precipitates formed were collected by centrifugation for 10 min at 5500 rpm. After some washes with ethanol, the both precipitations were dried at 80 ℃ for 6 h to obtain the pure U-ZnO QDs and M-ZnO QDs, respectively, as white powders.
2.4 Detection of Cu2+ using M-ZnO QDs
The determination of Cu2+ using M-ZnO QDs as fluorescent probe was performed as follows: a certain amount of Cu2+ aqueous solution was introduced into 1 mg/mL M-ZnO QDs solution in equal volume at room temperature. The final concentration of Cu2+ above mixed solution was from 1 μM to 200 μM. The fluorescence emission spectrum was detected in the range of 400 to 700 nm (λex = 355 nm) at room temperature. Fluorescence quenching efficiency can be described as F0/F, where F0 represents the fluorescence intensity of M-ZnO QDs and F represents the fluorescence intensity of M-ZnO QDs with different concentrations of Cu2+. In order to evaluate the selectivity of the synthesized QDs fluorescent probe to Cu2+, other common ions stock solutions were measured instead of Cu2+ in a similar way. To check the feasibility, the proposed measurement system was applied to detect Cu2+ in real samples following the standard addition method. The lake water gathered from Sanchunhu Lake (Chongqing Normal University, Chongqing, China) was centrifuged at 12, 000 rpm to remove accumulated sediment and boiled for 10 min. And then, the lake water was used to prepare authentic samples containing different concentrations of Cu2+ in the above method. All measurements were conducted at a minimum of 3 times using a minimum of triplicates on each occasion.
2.5 Fungal growth inhibition
The antifungal activities of M-ZnO QDs were evaluated against Aspergillus niger and Verticillium dahlia using agar plate method as described previously (Sun et al., 2016). Briefly, spore suspension was firstly prepared by flooding and suspending sporified mycelium under aseptic conditions, and the number of spores in the suspension was counted to 1 × 10⁷ spores/mL using hemacytometer. Twenty-five milliliters of PDA medium with different concentrations of M-ZnO QDs (0, 50, 100, 200, 300, 400 μg/mL) for each experiment were poured into Petri-dishes (9 cm in diameter) after autoclaving at 121 ℃ for 20 min. Following solidification of the fungal growth medium, a sterile paper disc in 10 mm diameter was placed on the center and 5 μL spore suspension was spotted on it. All samples were sealed with Parafilm and at least three replicates were used for each experiment. The fungal growth was estimated after 5 days of incubation at 30℃ by detecting the diameter of the colonies in two perpendicular directions. The mycelial growth inhibition rate was calculated based on the colony size relative to the control.
3 Results and discussion
3.1 Structure characterizations
As observed from TEM images, U-ZnO QDs displayed significantly agglomeration (Fig. 1A), but M-ZnO QDs exhibited well monodispersed, spherical in shape and dispersed uniformly without much agglomeration (Fig. 1B). From this we could deduce that the silane surface modification by APTES during the growth process of QDs could dramatically reduce the agglomeration and would thus greatly enhance the effective surface luminescence centers (Shi et al., 2011a,b). After being pretreated by APTES, hydroxyl groups on the ZnO nanoparticles surface react with silane groups of APTES to form a layer of silica nanonetwork around the ZnO core, which can facilitate the stability and solubility of ZnO QDs in aqueous solution. The synthesis route of ZnO QDs functionalized with APTES can be found in Supplementary Information (Fig. S1). At a higher resolution TEM in Fig. S2, the interplanar spacing was estimated to be 0.26 nm, corresponding to the lattice distance of the (1 0 0) lattice plane of ZnO crystal. The size distribution of ZnO QDs has been determined from TEM results using ImageJ software. It was found that M-ZnO QDs with APTES modification is much more uniform than that of pure ZnO QDs as displayed in the inset and its average size was estimated about 4.03 nm in diameter. XRD is performed to examine the crystalline structures of the synthesized ZnO QDs further. For U-ZnO QDs, no other impurity phase is found in Fig. 1C and all diffraction peaks can be well assigned to the hexagonal wurtzite ZnO crystal structure (JCPDF: 36-1451). After APTES-modified treatment, the diffraction peaks at the same positions can be detected for M-ZnO QDs and have sharper intensity, indicating an improved crystal quality (Handa et al., 2019). FT-IR spectroscopy was then carried out to determine the functional groups coated on the surface of ZnO QDs. As illustrated in Fig. 1D, the absorption peaks of the U-ZnO QDs located at around 3375, 1574 and 460 cm−1 can be assigned to O—H stretching vibration, the symmetric C⚌O stretching vibration and the Zn-O bond in ZnO, respectively. But for M-ZnO QDs, the bands around 2900–3300 cm−1 could indicate the overlap of the peaks relating to the —NH2 groups of APTES and —OH groups of the ZnO QDs. Moreover, the absorption peak at about 992 cm−1 is contributed to Si—O stretching vibration from APTES (Moghaddam et al., 2015).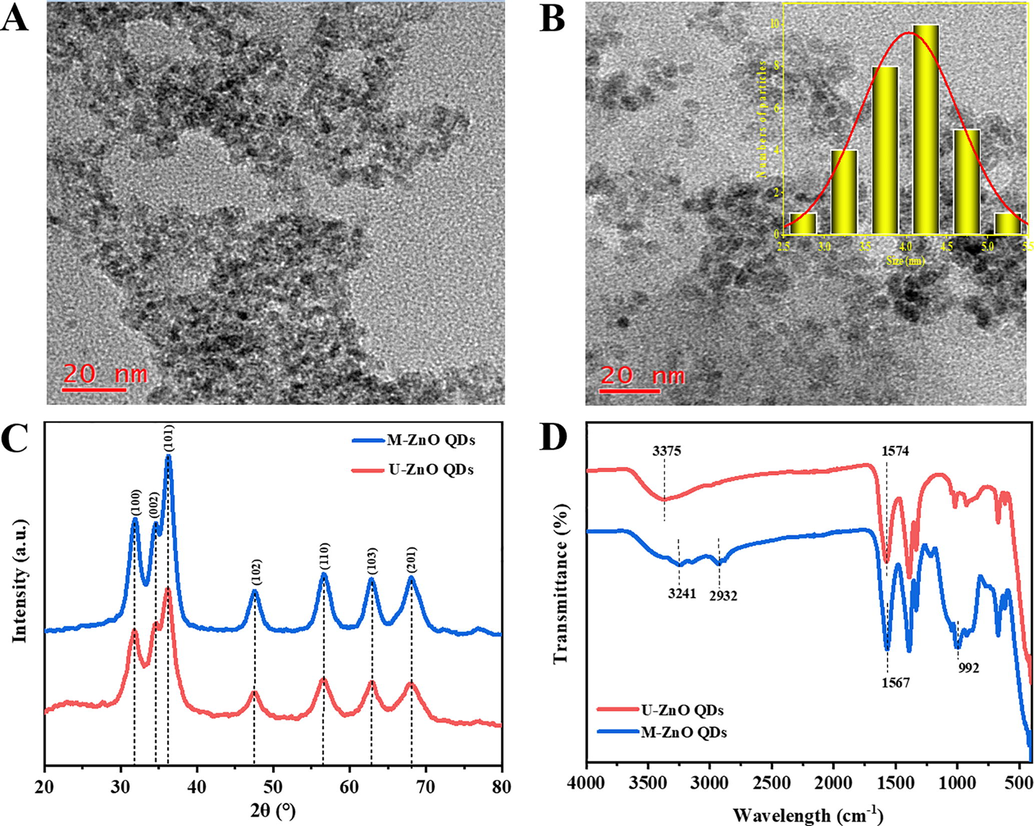
Representative TEM images of (A) unmodified and (B) APTES-modified ZnO QDs. Inset: Size distributions of M-ZnO QDs. (C) X-ray diffraction pattern and (D) FT-IR spectra of U-ZnO QDs and M-ZnO QDs.
3.2 Optical properties
The UV–vis and FL spectra of as-prepared QDs were conducted to further investigate their optical properties. As exhibited in Fig. 2A, the UV–vis absorption spectra of M-ZnO QDs shows a pronounced blue-shifted absorption peak compared to U-ZnO QDs, which could be due to the crystalline size decreases and leading to the quantum confinement effect (Li et al., 2016). As shown in Fig. 2B, APTES alone did not bring fluorescence intensity and the optimal excitation and emission wavelengths were 365 and 526 nm for M-ZnO QDs, respectively. By comparing fluorescence spectra and photos (Fig. 2C), it is obvious that fluorescence intensity of M-ZnO QDs in aqueous solution is significantly higher than U-ZnO QDs. Moreover, the precipitation can be clearly observed due to the growth and aggregation of U-ZnO QDs during the period of storage. But there is no similar phenomenon for M-ZnO QDs which can be protected by silane stabilizer bonded covalently on the surface of the ZnO core (Shi et al., 2011a,b). The experiment described above can confirm the successfully preparation of M-ZnO QDs with excellent water-solubility and favorable fluorescence intensity, which could be appropriate for detecting metal ion in aqueous solution.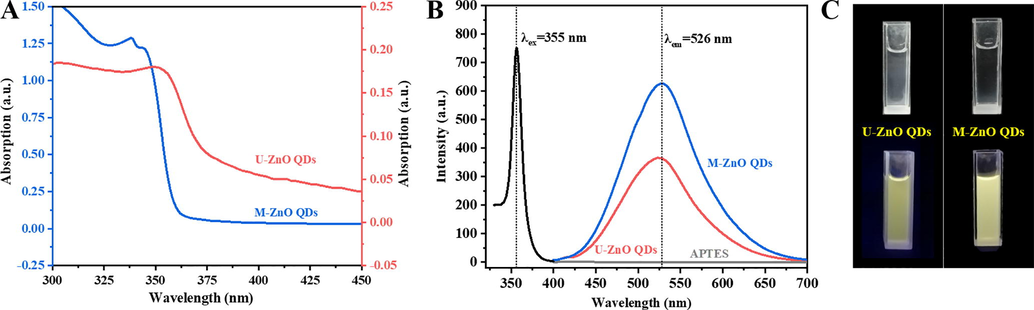
(A) UV–vis absorption spectra of U-ZnO QDs (pink line) and M-ZnO QDs (blue line) in the ultrapure water. (B) Fluorescence excitation and emission spectra of M-ZnO QDs, emission spectra of U-ZnO QDs and APTES aqueous solution under excitation at 355 nm. (C) Photograph of (left) U-ZnO QDs and (right) M-ZnO QDs under visible light and 365 nm UV lamp.
3.3 Feasibility and optimization study
The response of fluorescence of M-ZnO QDs for selectively detecting Cu2+ was investigated as shown in Fig. 3A. When compared to the blank control, the fluorescence intensity of M-ZnO QDs exhibited different reduced levels by the addition of metal ions with the same concentrations (100 μM). It can be obviously observed that the fluorescence intensity of M-ZnO QDs declined dramatically by the addition of Cu2+ and its quenching ratio is the highest among all the added metal ions. The distinct fluorescence quenching of M-ZnO QDs could also be shown in Fig. 3B, in which different quenching effect on the fluorescence intensity of M-ZnO QDs happened with the addition of 10 μM and 100 μM Cu2+ ions. That is, the higher the concentration of Cu2+, the more noticeable the fluorescence quenching effect of M-ZnO QDs was. Therefore, the above results demonstrated that M-ZnO QDs can be used to selectively detect Cu2+ in aqueous solution. To optimize the detection conditions for Cu2+, the solution pH effect was additionally studied and the result was presented in Fig. 3C. In this study, the F0/F value obviously enhanced with the increase of solution pH value. Especially, the maximum fluorescence quenching efficiency can be found at solution pH point of 7.5, and the quenching rate then decreased. Considering the convenience of actual detection, the optimal pH value for the determination of Cu2+ is determined to be 7.5. To test how quenching is influenced by the reaction time, we also found that the quenching efficiency of Cu2+ on M-ZnO QDs did not change significantly in 5 min (Fig. 3D). Therefore, the optimal detection time for Cu2+ ions was determined to be not more than 5 min.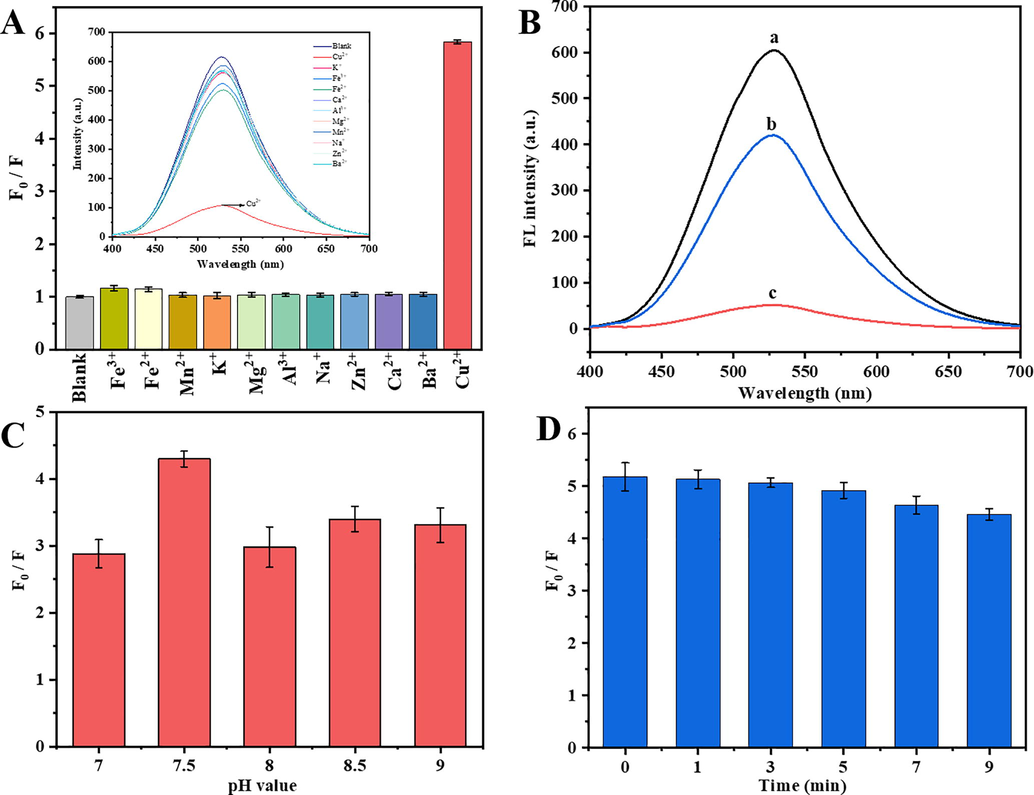
(A) Relative fluorescent intensity and fluorescence emission spectra as shown in inset of M-ZnO QDs with different metal ions (100 μM). (B) Fluorescence emission spectra of M-ZnO QDs with different concentrations of Cu2+ (a-0 μM, b-10 μM and c-100 μM). (C) Effect of pH on the relative fluorescent intensity (F0/F) of M-ZnO QDs with 100 μM Cu2+. (D) Effect of mixing time on the fluorescence quenching percentage of M-ZnO QDs after addition of 100 μM Cu2+.
3.4 Determination of Cu2+ in aqueous solution
The response of fluorescence of M-ZnO QDs for detecting Cu2+ was studied as illustrated in Fig. 4A. It was noted that the fluorescence intensity of M-ZnO QDs decreased gradually with increasing concentrations of Cu2+ under excitation at 355 nm. The fluorescence quenching appeared and displayed a good linear relationship in a wide range from 1 to 200 μM of Cu2+ (Fig. 4B). The linear equation of Cu2+ concentration can be described as F0/F = 0.3451 + 0.0957C (where F0 and F presented the fluorescence intensities of the reaction system at 355 nm in the absence and presence of metal ion, C is the concentration of Cu2+, respectively, R2 = 0.9945). The method limit of detection, calculated using the rule of 3σ/s (where σ is the standard deviation for the blank solution, and s is the slope of the calibration curve), can be calculated to be 0.51 μM. A summary of recently reported fluorescence methods for the determination of Cu2+ in aqueous solution is provided in Table 1. It can be found that the linear range of the assay in our study was wider than those of reported methods. Although the detection limit of the proposed method was higher than those of some published methods, both the preparation of M-ZnO QDs and the operation of Cu2+ detection is very simple and fast. And the detection limit of this fluorescence assay is substantially lower than the WHO guideline for copper ions. To evaluate the anti-interference performance of the fluorescent probe, Cu2+ was added to M-ZnO QDs in the existence of other metal ions. These results were displayed in Fig. 4C and the fluorescence quenching of M-ZnO QDs with interfering metal ions showed little change compared with those of blank and adding Cu2+ only. Therefore, the as-prepared M-ZnO QDs has good specificity for Cu2+. In order to further validate the practical application of our method, the as-synthesized M-ZnO QDs fluorescent probe was used to detect Cu2+ in lake water samples following the standard addition method. The obtained recoveries and RSD values are summarized in Table 2. When known amounts of Cu2+ were added to the tap water, the recovery percentages are in the range of 99–108.8 % with RSDs less than 1.6 %, indicating that the method in this study exhibited an acceptable accuracy. The above experimental data definitely demonstrated that the as-prepared M-ZnO QDs can be used to be a promising fluorescent probe for Cu2+ detection in in real environmental water samples.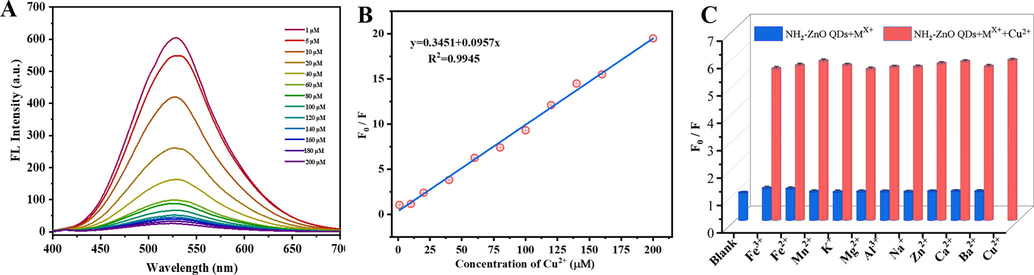
(A) Fluorescence emission spectra of the APTES-modified ZnO QDs at various concentrations of Cu2+ under excitation at 355 nm. (B) The linear calibration curve of the relative fluorescence intensity (F0/F) versus copper ions. (C) The effect of different metal ions on the relative fluorescence intensity (F0/F) of M-ZnO QDs in the presence of 100 μM Cu2+.
Method
Materials
Linear range
Limit of detection
Reference
Colorimetry
Curcumin
0–12 μM
2.54 μM
(Xu et al., 2016)
Colorimetry
Hexamethylbenzene
0–40 μM
1.57 μM
(Kim et al., 2020)
Colorimetry
(6-methoxyquinoline-2-carbaldehyde)
0–18 μM
0.53 μM
(Wu et al., 2017)
Fluorescence
Copper nanoparticles
15–35 μM
5.6 μM
(Qing et al., 2016)
Fluorescence
Rhodamine fluorophore CdTe@SiO2 QDs
0–1.8 μM
8.4 nM
(Chen et al., 2017)
Fluorescence
Graphene QDs
0.5–25 μM
0.5 μM
(Yeh et al., 2021)
Fluorescence
CdTe nanowires
0–30 μM
78 nM
(Tang et al., 2005)
Fluorescence
Nitrogen-doped carbon dots and gold nanoclusters
10–150 μM
3.5 μM
(Yang et al., 2019)
Fluorescence
N-acetyl-l-cysteines modified CdS QDs
1–25 μM
0.48 μM
(Zhao et al., 2021)
Fluorescence
APTES modified ZnO QDs
1–200 μM
0.51 μM
This work
3.5 Fluorescence detection mechanism
As shown in Fig. 4C, the fluorescence intensity of M-ZnO QDs probe can be quenched prominently by Cu2+ compared with other metal ions. This was likely driven by the ligands of QDs that would affect the quenching selectivity of QDs toward metal ions. It has been confirmed the Cu2+ is prone to bind with nitrogen-containing ligands and has shown high tendency to form complexation with the amino groups (—NH2) (Wu et al., 2014, Bhamore et al., 2018). Thus, after APTES modification, —NH2 groups on the surface of ZnO QDs have strong ability to bind selectively with Cu2+, leading to the aggregation of M-ZnO QDs and Cu2+. TEM results as depicted in Fig. S3A and Fig. S3B can confirm this conclusion. As a result, this may be beneficial to the transmission of electrons from the excited state of QDs to the unfilled d-orbital of Cu2+, which leads to the nonradiative electron/hole recombination and fluorescence quenching of QDs (Wang et al., 2014). Further, the fluorescence lifetime of M-ZnO QDs with 0 and 80 μM are calculated to be 14.16 ns and 11.47 ns (Fig. S4A), respectively, suggesting dynamic quenching effect may be the one of the quenching mechanisms of M-ZnO QDs by Cu2+. As shown in Fig. S4B, the absorption spectral peaks of M-ZnO QDs with and without Cu2+ are all located at 359 nm. And the change of UV–visible absorption spectrums of M-ZnO QDs and M-ZnO QDs@Cu2+ is negligible, demonstrating that the quenching of M-ZnO QDs by Cu2+ may not involve static quenching process. Over all, the detection mechanism of Cu2+ in aqueous solution by APTES-modified ZnO QDs fluorescent probe could be ascribed to the synergetic effect of electron transfer induced by the aggregation and the dynamic quenching existing energy transfer between M-ZnO QDs and Cu2+.
3.6 Antifungal activities
For the sake of exploring the application of M-ZnO QDs fluorescent probe in the biological field, the fungicidal efficiency of the APTES modified ZnO QDs was also studied according to the diameter of the inhibition zone. As presented in Fig. 5A, it was found that the M-ZnO QDs treatment appeared a clear dose–response effect against Aspergillus niger and Verticillium dahlia, and the corresponding diameter of the inhibition zone showed a significant decline with increased M-ZnO QDs concentrations. Comparing the fungicidal results in Fig. 5B and C, it can be established that the antifungal effect of M-ZnO QDs was rapid and exhibited a significantly stronger antifungal effect on A. niger than V. dahlia. For A. niger, when the M-ZnO QDs concentration increased from 0 μg/mL to 50 μg/mL, the growth rate of pathogenic fungi decreased from 100 % to 84.5 %. But for V. dahlia, the same antifungal effect can be achieved when the M-ZnO QDs was used at a concentration of 100 μg/mL, implying that this pathogenic fungus was responsive to high M-ZnO QDs concentrations. As a consequence, when the M-ZnO QDs concentration increased from 100 to 400 μg/mL, the average inhibition rates of two pathogenic fungi were in the range of 27.8–90.2 % (A. niger) and 15.1–63.3 % (V. dahlia), respectively.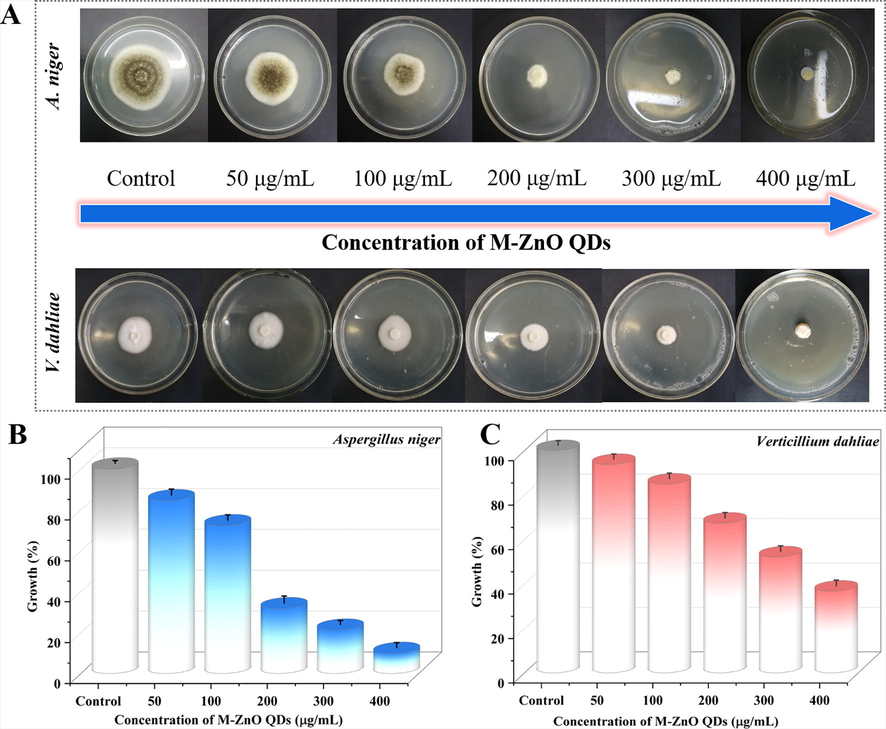
(A) The mycelial radial growth of Aspergillus niger and Verticillium dahlia under dark condition with increasing concentrations of M-ZnO QDs (0, 50, 100, 200, 300 and 400 μg/mL). Growth inhibition calculated from radial growth measurements for (B) Aspergillus niger and (C) Verticillium dahlia.
4 Conclusion
In this work, ZnO QDs with ultra-stable luminescence and excellent water solubility were successfully synthesized through silane surface modification using APTES. The as-prepared APTES-modified ZnO QDs (M-ZnO QDs) exhibited strong yellow fluorescence emission under 355 nm excitation, which can be specifically quenched by Cu2+. Taken into account this property we have developed M-ZnO QDs-based fluorescence sensor for the detection of Cu2+ in aqueous solution. The established fluorescent method under the optimum conditions exhibited an excellent selectivity for Cu2+, a good sensitivity with a limit of detection of 0.51 μM and a wide linear range from 1 to 200 μM, which can be used to detecting Cu2+ in natural water. Furthermore, M-ZnO QDs have provided an excellent antifungal activity against Aspergillus niger and Verticillium dahlia with a positive concentration–response effect. Altogether, the as-prepared APTES-modified ZnO QDs can be recognized as a viable fluorescent sensing material and a promising antimicrobial agent for controlling environmental pollution.
Acknowledgements
This research was supported by the Science and Technology Research Program of Chongqing Municipal Education Commission (No. KJQN202100516; KJQN202103104), Natural Science Foundation of Chongqing (No. cstc2021jcyj-msxmX0314) and Chongqing Innovative teams in Colleges and Universities (No. CXQT20031).
Declaration of Competing Interest
The authors declare that they have no known competing financial interests or personal relationships that could have appeared to influence the work reported in this paper.
References
- Generating Blue and Red Luminescence from ZnO/Poly(ethylene glycol) Nanocomposites Prepared Using an In-Situ Method. Adv. Funct. Mater.. 2003;13:800-804.
- [CrossRef] [Google Scholar]
- Semiconductor quantum dots: Technological progress and future challenges. Science.. 2021;373:eaaz8541.
- [CrossRef] [Google Scholar]
- Fluorescence sensing of Cu2+ ion and imaging of fungal cell by ultra-small fluorescent carbon dots derived from Acacia concinna seeds. Sens. Actuators, B. 2018;277:47-54.
- [CrossRef] [Google Scholar]
- Highly selective and sensitive determination of copper ion based on a visual fluorescence method. Sens. Actuators, B. 2017;240:66-75.
- [CrossRef] [Google Scholar]
- Synthesis of l-glutathione-capped-ZnSe quantum dots for the sensitive and selective determination of copper ion in aqueous solutions. Sens. Actuators, B. 2014;203:35-43.
- [CrossRef] [Google Scholar]
- Probing Nanoscale Interactions of Antimicrobial Zinc Oxide Quantum Dots on Bacterial and Fungal Cell Surfaces. Adv. Mater. Interfaces. 2022;9:2101484.
- [CrossRef] [Google Scholar]
- Large negative thermo-optic coefficients of a lead halide perovskite. Science advances.. 2019;5 eaax0786-eaax0786
- [CrossRef] [Google Scholar]
- A colorimetric chemosensor for selective detection of copper ions. Coloration Technol.. 2020;136:459-467.
- [CrossRef] [Google Scholar]
- Rapid Photoluminescence Quenching Based Detection of Cu2+ in Aqueous Medium by CdS Quantum Dots Surface Passivated by Thiourea. Anal. Sci.. 2017;33:565-571.
- [CrossRef] [Google Scholar]
- A multiple antibiotic and serum resistant oligotrophic strain, Klebsiella pneumoniae MB45 having novel dfrA30, is sensitive to ZnO QDs. Ann Clin Microbiol Antimicrob.. 2011;10 19-19
- [CrossRef] [Google Scholar]
- Bulk Synthesis of Transparent and Homogeneous Polymeric Hybrid Materials with ZnO Quantum Dots and PMMA. Adv. Mater.. 2007;19:4347-4352.
- [CrossRef] [Google Scholar]
- Size-dependent phase transition in methylammonium lead iodide perovskite microplate crystals. Nat. Commun.. 2016;7:11330.
- [CrossRef] [Google Scholar]
- A fluorescence aptasensor based on semiconductor quantum dots and MoS2 nanosheets for ochratoxin A detection. Sens. Actuators, B. 2017;246:61-67.
- [CrossRef] [Google Scholar]
- Biocompatible Semiconductor Quantum Dots as Cancer Imaging Agents. Adv. Mater.. 2018;30:1706356.
- [CrossRef] [Google Scholar]
- Preparation of surface-modified ZnO quantum dots through an ultrasound assisted sol–gel process. Appl. Surf. Sci.. 2015;346:111-114.
- [CrossRef] [Google Scholar]
- Determination of Copper in Human Urine by Cloud Point Extraction and Flame Atomic Absorption Spectrometry. Anal. Lett.. 2016;49:1656-1668.
- [CrossRef] [Google Scholar]
- In situ formation of fluorescent copper nanoparticles for ultrafast zero-background Cu2+ detection and its toxicides screening. Biosens. Bioelectron.. 2016;78:471-476.
- [CrossRef] [Google Scholar]
- Nanosensing of Pesticides by Zinc Oxide Quantum Dot: An Optical and Electrochemical Approach for the Detection of Pesticides in Water. J. Agric. Food. Chem.. 2018;66:414-423.
- [CrossRef] [Google Scholar]
- Bio-Based Hydrogels With Ion Exchange Properties Applied to Remove Cu(II), Cr(VI), and As(V) Ions From Water. Front Bioeng. Biotechnol.. 2021;9 656472-656472
- [CrossRef] [Google Scholar]
- Assessment of toxicity of selenium and cadmium selenium quantum dots: A review. Chemosphere. 2017;188:403-413.
- [CrossRef] [Google Scholar]
- Synthesis of silane surface modified ZnO quantum dots with ultrastable, strong and tunable luminescence. Chem. Commun.. 2011;47:11921-11923.
- [CrossRef] [Google Scholar]
- Enhancement of copper availability and microbial community changes in rice rhizospheres affected by sulfur. Molecules (Basel, Switzerland). 2011;16:1409-1417.
- [CrossRef] [Google Scholar]
- Cinnamaldehyde inhibits fungal growth and aflatoxin B1 biosynthesis by modulating the oxidative stress response of Aspergillus flavus. Appl. Microbiol. Biotechnol.. 2016;100:1355-1364.
- [CrossRef] [Google Scholar]
- Highly luminescent water-soluble CdTe nanowires as fluorescent probe to detect copper(II) Chem. Commun.. 2005;4184–4186
- [CrossRef] [Google Scholar]
- Total metal content and chemical speciation analysis of iron, copper, zinc and iodine in human breast milk using high-performance liquid chromatography separation and inductively coupled plasma mass spectrometry detection. Food Chem.. 2020;326:126978
- [CrossRef] [Google Scholar]
- Fluorescent heavy metal cation sensing with water dispersible 2MPA capped CdSe/ZnS quantum dots. J. Lumin.. 2015;166:88-92.
- [CrossRef] [Google Scholar]
- Graphene quantum dots as a fluorescent sensing platform for highly efficient detection of copper(II) ions. Sens. Actuators, B. 2014;190:516-522.
- [CrossRef] [Google Scholar]
- A novel ratiometric fluorescent probe for detection of iron ions and zinc ions based on dual-emission carbon dots. Sens. Actuators, B. 2019;284:186-192.
- [CrossRef] [Google Scholar]
- A colorimetric quinoline-based chemosensor for sequential detection of copper ion and cyanide anions. Tetrahedron. 2017;73:5715-5719.
- [CrossRef] [Google Scholar]
- Semicondutor quantum dots-based metal ion probes. Nanoscale. 2014;6:43-64.
- [CrossRef] [Google Scholar]
- Water-stable blue-emitting ZnO@polymer core–shell microspheres. J. Mater. Chem.. 2007;17:2490-2496.
- [CrossRef] [Google Scholar]
- A Fluorescence Probe for Metal Ions Based on Black Phosphorus Quantum Dots. Adv. Mater. Interfaces. 2020;7:1902075.
- [CrossRef] [Google Scholar]
- A novel highly selective chemosensor based on curcumin for detection of Cu2+ and its application for bioimaging. Sens. Actuators, B. 2016;230:684-689.
- [CrossRef] [Google Scholar]
- Dual-emission ratiometric nanoprobe for visual detection of Cu(II) and intracellular fluorescence imaging. Spectrochim. Acta Part A Mol. Biomol. Spectrosc.. 2019;223:117300
- [CrossRef] [Google Scholar]
- Unraveling the Fluorescence Quenching of Colloidal Graphene Quantum Dots for Selective Metal Ion Detection. ACS Appl. Nano Mater.. 2021;4:5636-5642.
- [CrossRef] [Google Scholar]
- Excellent fluorescence detection of Cu2+ in water system using N-acetyl-L-cysteines modified CdS quantum dots as fluorescence probe. Nanotechnology. 2021;32:405707
- [CrossRef] [Google Scholar]
- Near-Infrared Photoactive Semiconductor Quantum Dots for Solar Cells. Adv. Energy Mater.. 2021;11:2101923.
- [CrossRef] [Google Scholar]
Appendix A
Supplementary material
Supplementary data to this article can be found online at https://doi.org/10.1016/j.arabjc.2022.104266.
Appendix A
Supplementary material
The following are the Supplementary data to this article:Supplementary data 1
Supplementary data 1


