

Translate this page into:
Fabrication of ZiF-8 metal organic framework (MOFs)-based CuO-ZnO photocatalyst with enhanced solar-light-driven property for degradation of organic dyes
⁎Corresponding author at: Chemical Engineering Faculty, Sahand University of Technology, P.O.Box 51335-1996, Sahand New Town, Tabriz, Iran. ahmad.najafidoust@gmail.com (Ahmad Najafidoust)
-
Received: ,
Accepted: ,
This article was originally published by Elsevier and was migrated to Scientific Scholar after the change of Publisher.
Abstract
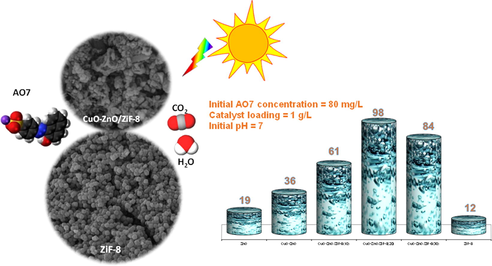
In this study, CuO-ZnO/ZiF-8 was successfully synthesized with different percentages of ZiF-8 Metal-organic Framework (MOF) via ultrasound assisted precipitation method. The physic-chemical properties of the samples were studied by XRD, FESEM, EDX, BET-BJH, FTIR, DRS, and pHpzc techniques. The results showed that the CuO-ZnO/ZiF-8 (20) sample possesses high photocatalytic activity with 98.1% removal of 80 ppm AO7 in 100 min. It could be attributed to the increases the surface area, the pore volume, and pore diameter, as well as efficient homogenous distribution of active sites due to the use of ultrasound irradiation. Furthermore, the presence of ZiF-8 increases light absorption and reduces the recombination rate of electron-hole pairs.
Abstract
Successfully synthesis of CuO-ZnO/ZiF-8 by ultrasonic assisted precipitation method. Promising physicochemical and optical properties of the synthesized nanocomposites. High photocatalytic activity of CuO-ZnO/ZiF-8 (20) (98.1% degradation of AO7) Investigation of the effective operating parameters on AO7 photodegradation performance.
Abstract
In this research, novel CuO-ZnO/ZiF-8 metal–organic frameworks (MOFs) photocatalyst with different mass percentages of ZiF-8 were prepared for water purification applications under visible light. The precipitation method was used to synthesize CuO-ZnO/ZiF-8 photocatalysts. Some techniques, including XRD, FESEM, EDX, BET-BJH, FTIR, DRS, and pHpzc, were performed to determine the structural, chemical, and optical properties of the prepared samples. DRS analysis represented that CuO-ZnO/ZiF-8(20) had narrower band gap energy compared to CuO-ZnO and ZiF-8. Also, BET-BJH analysis results showed that CuO-ZnO had a low surface area that impeded the absorption of pollutant molecules. In contrast, the CuO-ZnO/ZiF-8(20) sample, due to the presence of ZiF-8, had a high specific surface area which enabled higher pollutant adsorption on the photocatalyst surface.
Moreover, the synthesized samples were evaluated for the solar-light-driven removal of different organic dyes, such as Acid Orange 7, Methylene blue, and Malachite green. The tremendously enhanced photocatalytic activity under the simulated solar light with 98.1% removal of AO7 was observed over CuO-ZnO/ZiF-8(20) sample. Then, the effect of initial solution pH as an essential factor on photocatalytic activity was investigated. Finally, the reaction mechanism of AO7 degradation over CuO-ZnO/ZiF-8(20) was proposed.
Keywords
CuO-ZnO/ZiF-8 Heterostructure
MOF-based Nanophotocatalyst
Sono-precipitation
Photodegradation
Acid Orange 7

1 Introduction
Due to the rapid population growth, and the increasing spread of pollutants, clean water resources as one of our daily life necessities are deeply needed (Najafidoust et al., 2019; Najafidoust et al., 2021; Abbasi Asl et al., 2020; Abbasi Asl et al., 2019; Sarani et al., 2021; Kazemi Hakki et al., 2021). Organism lives and the environment are extremely at risk of irreversible damages due to the release of industrial contaminants (Wang, 2021; Gu et al., 2021; Shen et al., 2022). To remove these contaminants, scientists have employed various procedures, including biological, physical adsorption, electrochemical methods, yet most of them have some drawbacks such as high cost, complication, poor efficiency. So, it is necessary to develop economical, simple, and eco-friendly methods to remove pollutants in water and wastewater (Ahmad Najafidoust and Hakki, 2019; Najafidoust et al., 2020; Hamidian et al., 2021). In recent decades, researchers pay great attention to photocatalysis technology, one of the advanced oxidation processes (AOPs), in which semiconductors employ as photocatalysts to solve the as-mentioned problems and just need solar energy as a clean, available, and renewable energy resource (Miri et al., 2020; Abdollahi et al., 2018; Khataee et al., 2015). ZnO has been widely used in photocatalytic applications because of its non-toxicity, low cost, and high photocatalytic performance (Faisal et al., 2021; Senasu et al., 2021) . However, ZnO has a wide band gap and low specific surface area, restricting its photocatalyst usage. To overcome this drawback, some methods like the formation of heterojunctions, doping metal and non-metals, composition with materials that have high specific surface area could be employed (Abd-Elrahim and Chun, 2021); (Jiang et al., 2021) . Metal-organic frameworks (MOFs) are porous materials consisting of metal oxides in which rigid or semi-rigid organic linkers are connected to them. MOFs have received significant attention in recent years due to their extremely high surface area (Xiao et al., 2021; Hu et al., 2021; Zhang et al., 2021).
Among several kinds of MOFs, Zinc-based ones have demonstrated great performance for various organic reactions due to their unsaturated open copper metal sites (Zhang et al., 2021; Tran et al., 2021; Karuppasamy et al., 2021; Li et al., 2021). Compared to other MOFs, ZIF-8 metal–organic frameworks (MOFs) have higher chemical and thermal stability. However, recombination of excited electron holes competes with photocatalytic performance. Accordingly, the combination of ZIF-8 with appropriate semiconductors reduces the recombination rate of charge carriers and enhances photocatalytic activity (Faraji et al., 2021; Liu et al., 2021; Tuncel and Ökte, 2021; Cui et al., 2021).
In this study, to tackle the drawbacks of ZnO and CuO photocatalysts, novel CuO-ZnO/ZiF-8 with a different mass percentage of ZiF-8 was prepared by ultrasound-assisted precipitation method as a convenient and fast synthesis. The synthesized samples were studied in the photocatalytic removal of organic dyes like Acid Orange 7, Methylene blue, and Malachite green. XRD, FESEM, EDX, BET-BJH, DRS, and pHpzc techniques were employed to characterize the physicochemical and optical properties of the as-prepared samples. Also, the influence of some parameters like initial solution pH, photocatalyst loading, and initial pollutant concentration was investigated. Finally, photocatalytic stability and reusability as crucial factors in industrial applications of semiconductors were examined.
2 Materials and methods
2.1 Materials
Materials used to prepare the photocatalysts were: 2-Methylimidazole (C4H6N2, 99%; Sigma-Aldrich), Methanol (CH3OH, 99.5%; Merck), Zinc nitrate hexahydrate (Zn(NO3)2·6H2O; 98%; Sigma-Aldrich), Sodium hydroxide (NaOH; 97%; Merck), Zinc acetate dihydrate (CH3COO)2Zn·2H2O; 99%; Merck), Copper(II) acetate monohydrate (CH3COO)2Cu·H2O; 99%; Merck), Methylene blue (C16H18ClN3S), Malachite green (C23H25N2), Acid orange 7 (C16H11N2NaO4S).
2.2 Nanophotocatalysts preparation and procedure
The synthesis process of CuO-ZnO-ZiF-8 is shown in Fig. 1. The ultrasonic-assisted precipitation method was employed to synthesize ZiF-8 and CuO-ZnO/ZiF-8 composite. First, the required amount of 2-Methylimidazole and Zinc nitrate were dissolved into 100 ml Methanol and mixed for 30 min. Then, the resulting mixture was rested for 2 h at room temperature. In the post-treatment step, the sample was washed with Methanol and dried at 60 °C for 12 h. For the synthesis of CuO-ZnO/ZiF-8 photocatalyst with different mass percentages of ZiF-8, Zinc acetate, Copper acetate, and ZiF-8 was dissolved in de-ionized water and mixed for 30 min at 70 °C, after that, under irradiation of ultrasound waves at a power of 70 W, sodium hydroxide solution was added drop-by-drop to the solution until the pH was reached to 10. The mixture was washed and filtered with distilled water and dried at 80 °C for 12 h in ambient air. Afterward, the obtained powders were calcined at 350 °C for 3 h. Finally, the CuO-ZnO, CuO-ZnO/ZiF-8(10), CuO-ZnO/ZiF-8(20), CuO-ZnO/ZiF-8(30), and ZiF-8 nanophotocatalyst powders were obtained.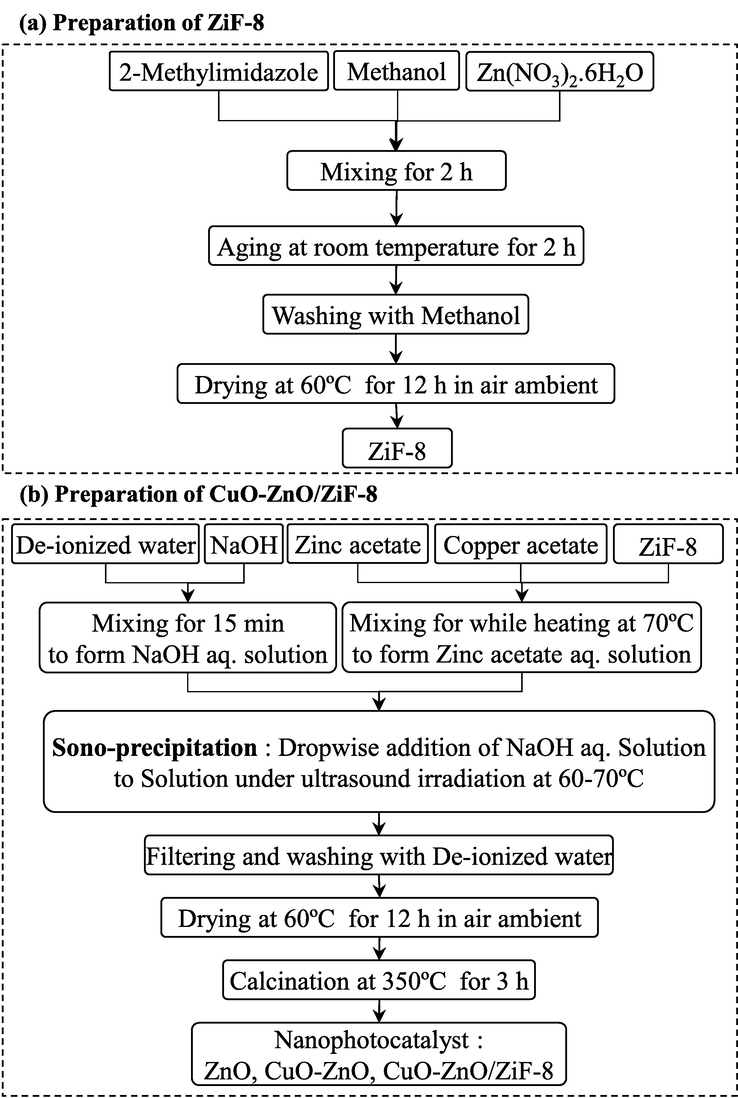
Fabrication of CuO-ZnO/ZiF-8 photocatalysts.
2.3 Nanophotocatalysts characterization techniques
X-ray powder diffraction (XRD) analysis was conducted by D5000 diffractometer (Siemens, Germany) utilizing Cu-Kα radiation with a wavelength of 1.54178 Å in 2θ range of 5–65°to identify the crystalline structure and phase purity of the prepared samples. The synthesized samples' morphology and surface particle size distribution were investigated by field emission scanning electron microscopy (FESEM) analysis (Hitachi, Japan). Surface elemental dispersion of the prepared samples was studied by energy-dispersive X-ray (EDX dot mapping) analysis (BSE detector, VEGA/TESCAN, Czech Republic). Surface functional groups of prepared samples were studied by Fourier-Transform Infrared spectroscopy (FTIR, UNICAM 4600) in 400–4000 cm−1 wavenumbers. N2 adsorption/desorption (BET-BJH) analysis was used to determine the samples' specific surface area and pore specifications on a Chembet-3000 (Quantachrome, USA). The optical properties of as-synthesized nanophotocatalysts were evaluated by the ultraviolet–visible (UV–Vis) diffuse reflectance spectra (DRS) analysis from wavelengths of 300 to 700 nm (Scinco 4100 spectrophotometer, Shimadzu, Japan).
2.4 Experimental setup for photocatalytic performance test
The synthesized samples’ performance was evaluated under simulated sunlight by degradation of Acid Orange7 from water. The procedure was conducted as follows: 0.1 g of the photocatalyst was added to a 100 ml aqueous solution containing 80 mg/L AO7 in a Pyrex photoreactor at ambient temperature. To reach adsorption/desorption equilibrium the resultant suspension stirred magnetically was located in the dark for 40 min. Then, the photoreactor was exposed to a simulated sunlight source using a 400 W halogen lamp for 100 min. The photocatalytic reaction container was placed into an ice bath to maintain the temperature at 25 °C. During the photocatalytic reaction, sampling was performed at 20 min intervals. After nanophotocatalyst powder separation by a centrifuge for 15 min, the remained concentration of the AO7 was measured by UV–Vis spectrophotometer (UV-1800, BRAIC, China), and degradation efficiency was calculated as below:
C and C0 are final dye concentrations after simulated sunlight exposure and initial dye concentration after the dark test, respectively. The mentioned procedure was conducted for all the samples.
3 Results and discussions
3.1 Nanophotocatalysts characterization
3.1.1 XRD Analysis
Fig. 2 shows XRD patterns of CuO-ZnO, CuO-ZnO/ZiF-8(10), CuO-ZnO/ZiF-8(20), CuO-ZnO/ZiF-8(30), and ZiF-8. As can be seen from patterns, the characteristic peaks at around 2θ = 31, 34, 36, 47, and 56° correspond to ZnO crystals (JCPDS no. 00–036-1451) (Senasu et al., 2021); (Saini et al., 2020)). The characteristic peaks of cubic ZiF-8 were observed at around 2θ = 7, 11, 13, and 18° that is in good agreement with the literature (Thanh et al., 2018); (Jing et al., 2014). Also, no additional peaks of impurity were observed in all patterns. As can be seen in the XRD patterns, by increasing the ZiF-8 mass percentage in the samples, the intensity of ZiF-8 characteristic peaks increases, which indicates the formation of ZiF-8 crystalline phase over or into the lattice of CuO-ZnO. These results are proved by FESEM, EDX, BET-BJH, and FTIR analyses which will be discussed below.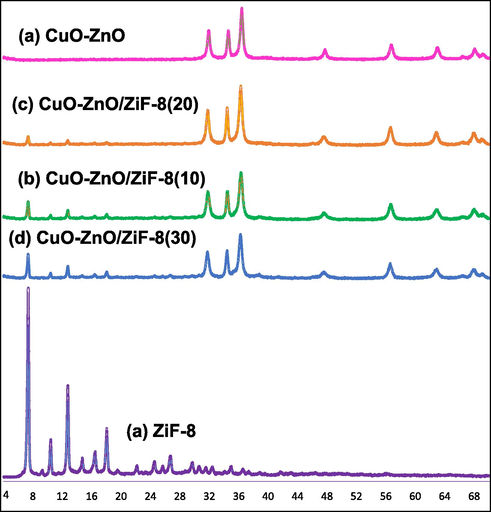
XRD patterns of CuO-ZnO/ZiF-8 photocatalysts: (a) CuO-ZnO, (b) CuO-ZnO/ZiF-8 (10), (c) CuO-ZnO/ZiF-8 (20), (d) CuO-ZnO/ZiF-8 (30), and (e) ZiF-8.
3.1.2 FESEM analysis
Scanning Electron Microscopy (FESEM) analysis was used to study the surface morphology of the synthesized samples, and the results are displayed in Fig. 3 and Fig. 4. As shown, bare ZnO has a grain-like structure and is willing to aggregate, whereas ZiF-8 has clearly distinctive morphology and accumulates a cubic structure. As seen from the images, with the presence of ZiF-8 in the structure of photocatalysts, CuO-ZnO particles are formed on the ZiF-8 cubes. Also, it is obvious that the particles are well distributed on the surface of ZiF-8, which can be attributed to the use of ultrasound irradiation in the synthesis procedure. Proper distribution of CuO-ZnO not only led to the high specific surface area but also increased the samples' light absorption ability, which is explained in the BET-BJH and UV–Vis DRS sections, respectively. In order to more accurate evaluations of the FESEM results, detailed images of CuO-ZnO/ZiF-8(20) and ZiF-8 are shown in Fig. 4. As it can be seen, the regular distribution of CuO-ZnO particles over the surface of ZiF-8 will result in the easy accessibility of the AO7 molecules to photocatalytic active sites and a great performance in the degradation of it. These results are consistent with the observations of EDX and BET-BJH analyses.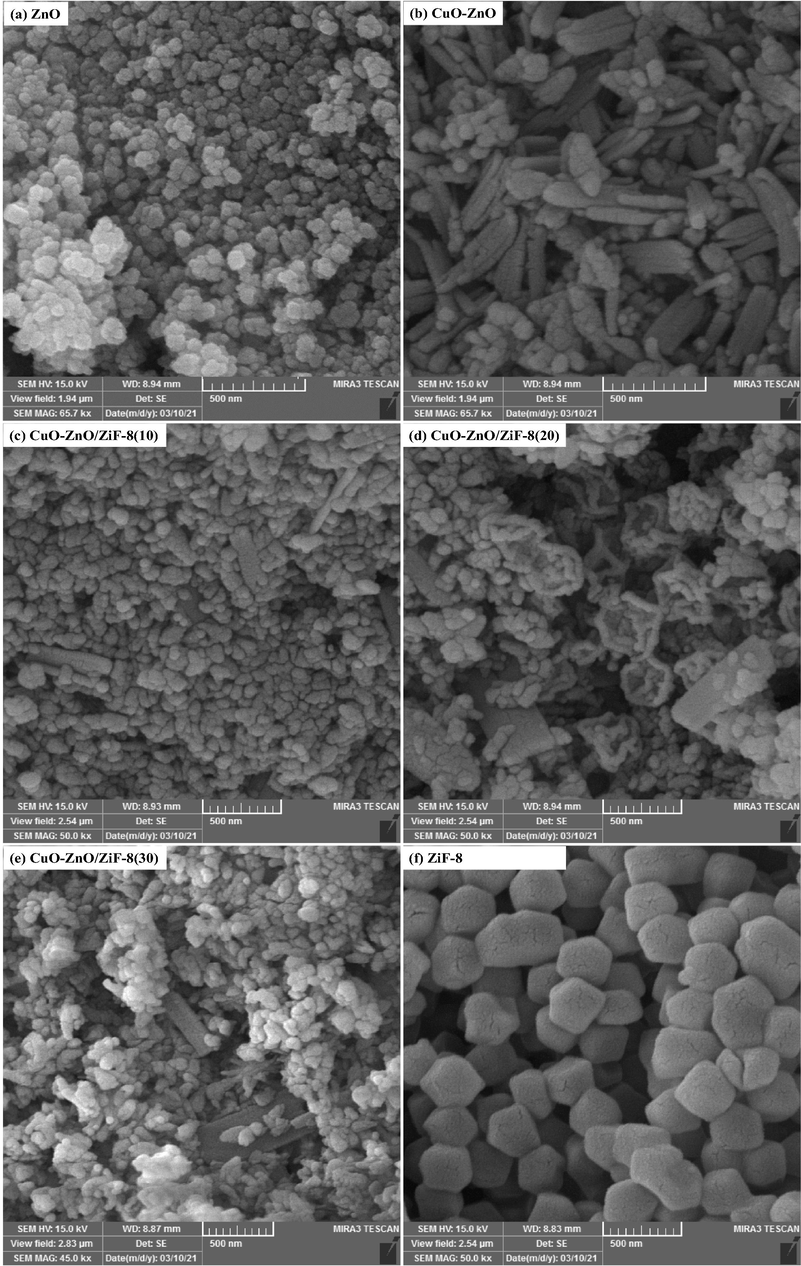
FESEM images of CuO-ZnO/ZiF-8 photocatalysts: (a) ZnO, (b) CuO-ZnO, (c) CuO-ZnO/ZiF-8 (10), (d) CuO-ZnO/ZiF-8 (20), (e) CuO-ZnO/ZiF-8 (30), and (f) ZiF-8.
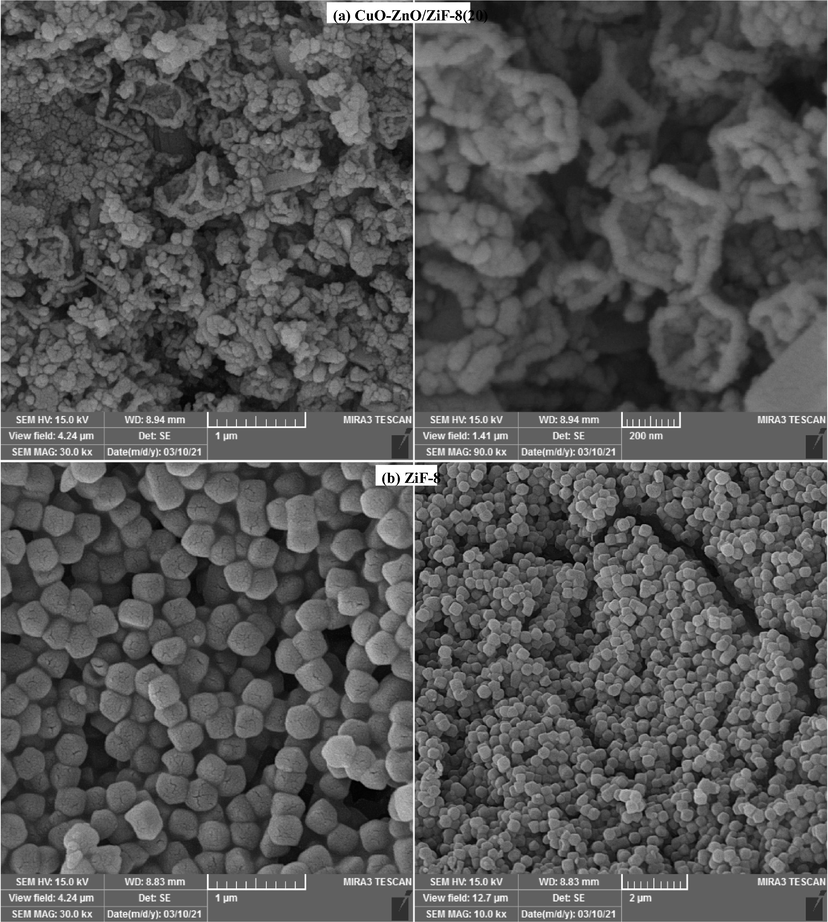
Detail FESEM images of CuO-ZnO/ZiF-8 photocata lysts:(a)CuO-ZnO/ZiF-8 (20), and (b)ZiF-8.
3.1.3 EDX analysis
Fig. 5 displays the results of the EDX-dot mapping analysis for CuO-ZnO/ZiF-8(20) and ZiF-8. The existence of all used elements, including C, N, O, Cu, and Zn, over the surface of the mentioned nanophotocatalysts and also the absence of any impurity was proved by EDX analysis. Furthermore, there are proportional relations between the peak intensity of each surface element and the value of existing elements in the sample. So, according to this statement, these obtained results indicate that the synthesized nanophotocatalysts have high purities and their compositions are in good agreement with the proposed mass percentages. This observation approves the XRD results. Besides, the dispersion of the surface elements is uniform since utilizing ultrasound radiation during the synthesis procedure. Thanks to the high purity and uniform dispersion of elements without any agglomeration of CuO-ZnO/ZiF-8(20), the effective separation of excited charge carriers, enhanced availability of photocatalytic active sites, and consequently, excellent photocatalytic performance under simulated sunlight irradiation are expected over this nanophotocatalyst.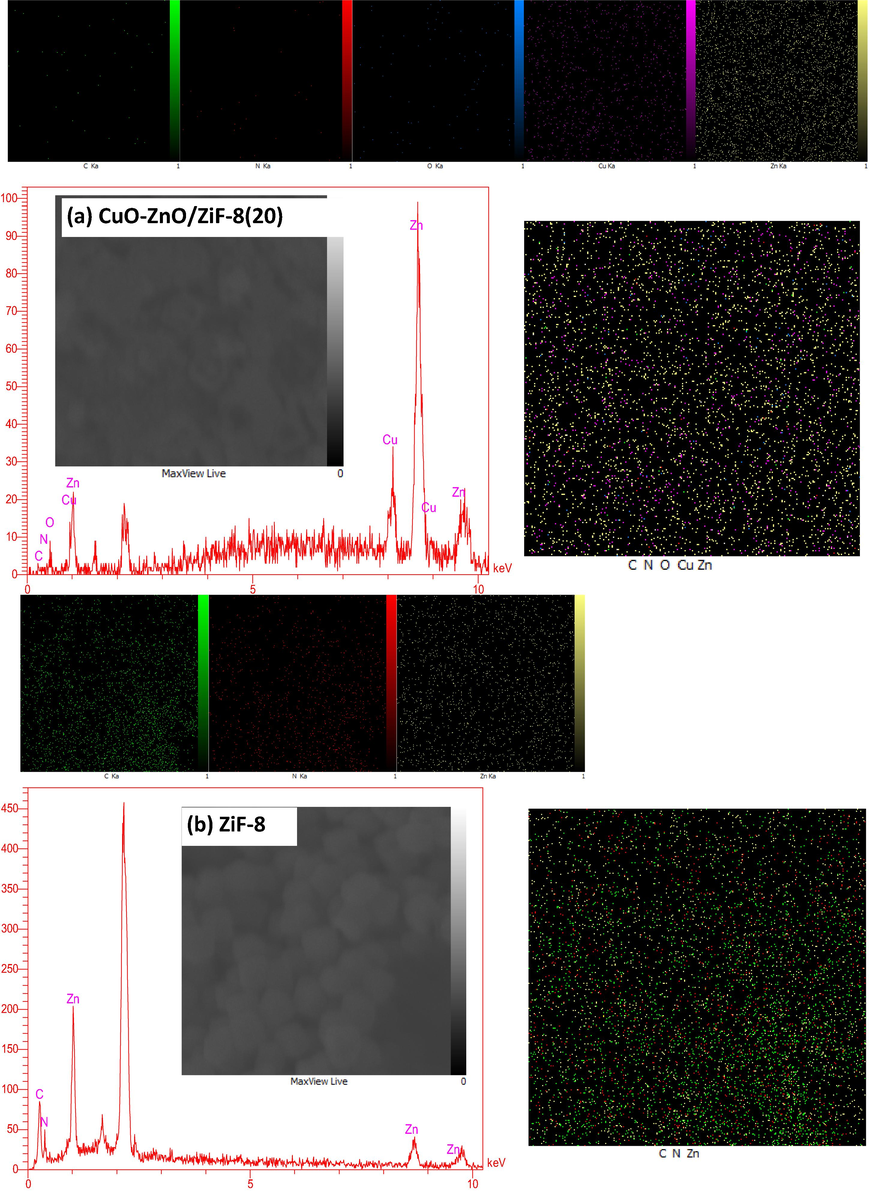
EDX analysis of CuO-ZnO/ZiF-8 photocatalysts: :(a)CuO-ZnO/ZiF-8 (20), and (b)ZiF-8.
3.1.4 BET-BJH analysis
Fig. 6 exhibits the N2 adsorption/desorption isotherms and the pore size distribution graphs of the CuO-ZnO, CuO-ZnO/ZiF-8(20), and ZiF-8 samples, and the results are shown in Table 2. The isotherms of the prepared samples belong to the type I with H4-type hysteresis loop. This isotherm confirms that samples have microporous structures with approximately slit-shaped pores (plates or edged particles like cubes). As shown in the figure, by using BJH theory, all the samples possess uniform distributions of the pores with an average diameter of more than 3 nm, which clarifies the formation of meso-structure in all samples. The specific surface area of CuO-ZnO, CuO-ZnO/ZiF-8(20), and ZiF-8 were 12.3, 22.2, and 234.5 m2/g, respectively. As expected, the addition of ZiF-8 increased the specific surface area, which is proportional to the improved dispersion of active catalytic sites. Also, the pore volumes of 0.287, 0.240, and 0.103 cm3/g were obtained for the mentioned samples, respectively. It is worthy of mentioning here that the high specific surface area of the photocatalysts will lead to more light absorption, high adsorption ability of pollutant molecules. So, it is expected that the obtained structural properties of the synthesized samples will be proper for the penetration and adsorption of large dye molecules.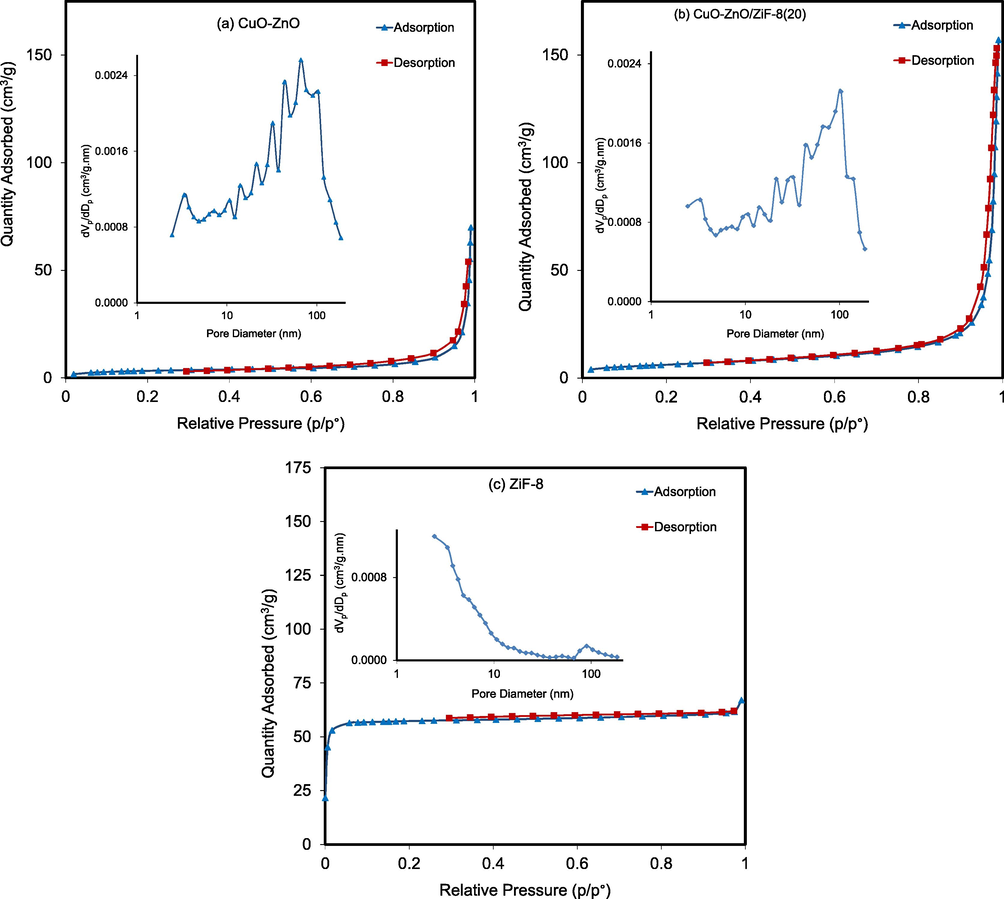
Adsorption/Desorption isotherms and pore size distribution of CuO-ZnO/ZiF-8 photocatalysts: (a) CuO-ZnO, (b) CuO-ZnO/ZiF-8 (20) and (c) ZiF-8.
Organic Dye
Chemical Formula
Chemical Structure
Molecular Weight (g/mol)
Solubility in Water (g/L)
λmax
(nm)
Methylene Blue
C16H18ClN3S
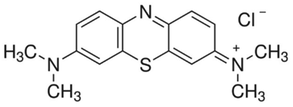
319.85
43.6
665
Malachite Green
C23H25N2
364
40
616
Acid orange 7
C16H11N2NaO4S
350.32
116
485
Nanocatalyst
CuO (wt.%)
ZnO
(wt%)ZiF-8 (wt.%)
Ultrasound Irradiation
SBET (m2/g)
VP (cm3/g)
DP (nm)
λ0 (nm)
Band Gap (eV)
Time (min)
Power (W)
ZnO
–
100
–
30
60
–
–
–
–
–
CuO-ZnO
5
95
–
30
60
12.3
0.287
48.7
428
2.89
CuO-ZnO/ZiF-8(10)
5
85
10
30
60
–
–
–
–
–
CuO-ZnO/ZiF-8(20)
5
75
20
30
60
22.2
0.240
43.2
630
1.96
CuO-ZnO/ZiF-8(30)
5
65
30
30
90
–
–
–
–
–
ZiF-8
–
–
100
–
–
234.5
0.103
1.7
232
5.34
3.1.5 FTIR analysis
Fig. 7 shows FT-IR spectra of CuO-ZnO, CuO-ZnO/ZiF-8(20), and ZiF-8. The peak at 3445 cm−1 corresponds to water molecules and hydroxyl groups or chemically adsorbed water 1–3. The peak at 450 cm−1 is related to Zn–N stretch mode (Jing et al., 2014); (Gadipelli et al., 2014) . The peaks at wavenumber around 950–1200 cm−1 are originated from C–N stretch mode (Chen et al., 2014). Also, the bands at 1500–1600 cm−1 are correspond to vibrations of the phenyl ring. The peak observed at wave numbers about 3000 cm−1 is attributed to the C = N stretch mode (Ordoñez et al., 2010). So, the results of FTIR analysis are in consistence with XRD analysis.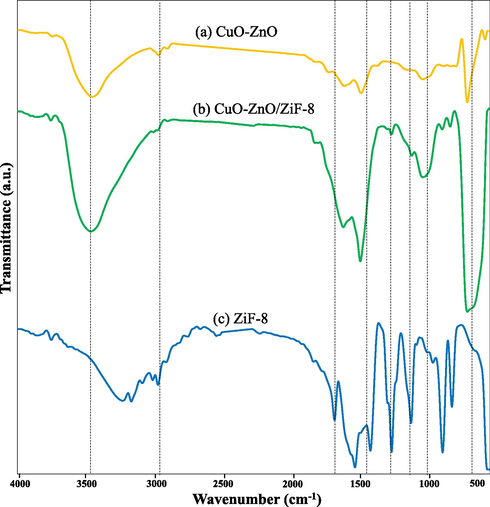
FTIR analysis of CuO-ZnO/ZiF-8 photocatalysts: (a) CuO-ZnO, (b) CuO-ZnO/ZiF-8 (20) and (c) ZiF-8.
3.1.6 DRS analysis
Fig. 8 the results of UV–Vis DRS analysis for CuO-ZnO, CuO-ZnO/ZiF-8(20), and ZiF-8. As can be seen, bare ZiF-8 has low light absorption, while the light absorption amount of CuO-ZnO/ZiF-8(20) due to the presence of CuO-ZnO is increased, and its maximum absorption edge has a red shift at 630 nm. The band gap energies of the samples are calculated using equation (2):
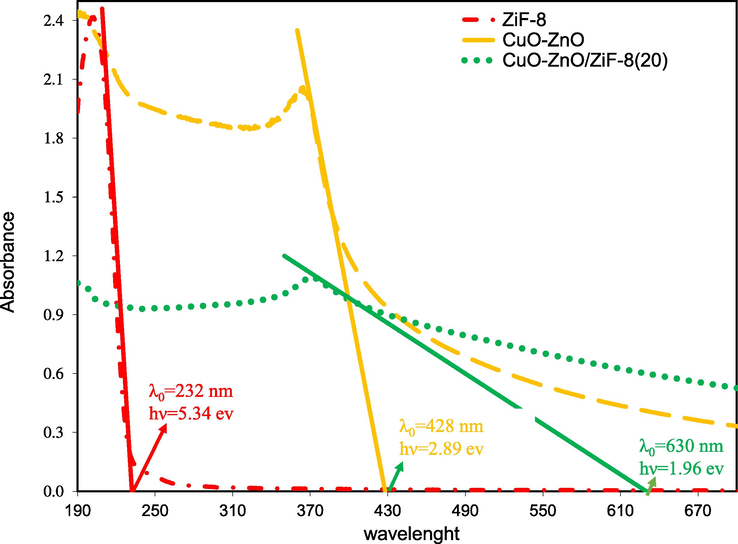
DRS analysis of CuO-ZnO/ZiF-8 photocatalysts: CuO-ZnO, CuO-ZnO/ZiF-8 (20) and ZiF-8.
Eg and λ0 are band gap energy and the wavelength of the maximum absorption edge. The band gap energies for CuO-ZnO, CuO-ZnO/ZiF-8(20), and ZiF-8 are 2.89, 1.96, and 5.34 eV, respectively. So, the composition of CuO-ZnO with ZiF-8 increases light absorption amount and reduces the band gap energy. Also, it leads to a decrease in the recombination rate of induced electron-hole pairs; the schematic is shown in Fig. 9. It is necessary to mention that the photo-absorption ability of the photocatalyst shifts to the visible light region by reduction of band gap energy. Therefore, regarding the major part of the light source is in the visible light region, it is anticipated that dye degradation from the aqueous solution will be improved over CuO-ZnO/ZiF-8(20) sample.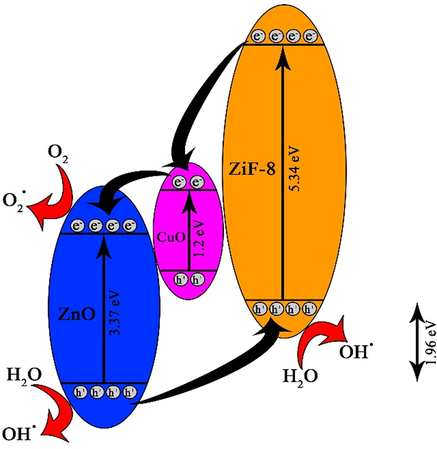
Schematic between charge generation and transfer for CuO-ZnO/ ZiF-8 (20).
3.1.7 pHpzc analysis
pHpzc is an important parameter in determining the surface charge of solid materials. It should be noted that the pHpzc value of the catalyst is significantly altered by changing the synthesis method and the type of photocatalyst. In this study, pHpzc of CuO-ZnO/ZiF-8(20) is measured using the drifting method, and the result is presented in Fig. 10. As can be seen, pHpzc was found to be 7.5. When the initial solution pH is lower than pHpzc, the surface charge of the semiconductor is positive, and when it is higher than pHpzc, it has a negative surface charge.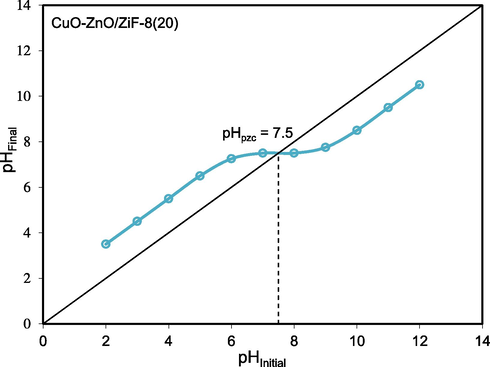
pHpzc of CuO-ZnO/ZiF-8 (20) photocatalyst.
3.2 Photocatalytic degradation of organic dyes
3.2.1 Catalytic performance toward various dyes
Acid Orange 7, Methylene blue, and Rhodamine B dyes were chosen as target pollutants which the physicochemical properties are listed in Table 1. Fig. 11 illustrates the adsorption ability and photo-degradation of mentioned dyes over CuO-ZnO/ZiF-8(20). As shown in Fig. 11 a, the AO7 adsorption over this nanocomposite was the highest compared to MB and MG. According to Fig. 11 b, this nanophotocatalyst has the ability to remove various dye pollutants, and the removal rate of AO7, MB, and MG was found to be 98.1, 59, and 51%, respectively.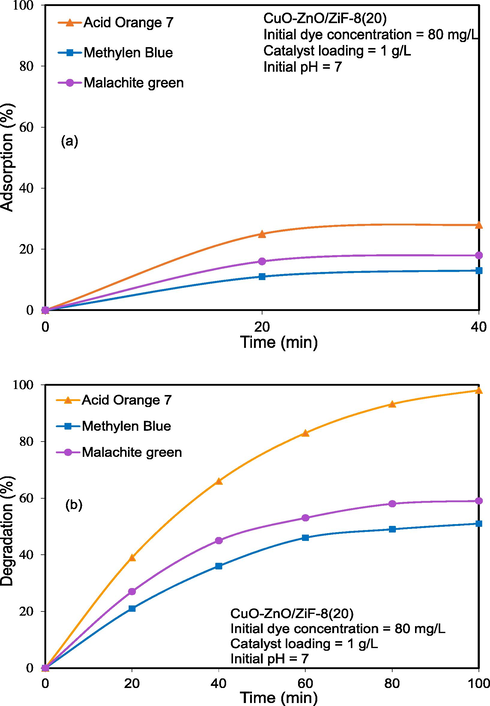
Photocatalytic performance of CuO-ZnO/ZiF-8 photocatalyst on solar-light-driven photocatalytic degradation of organic dyes: (a) adsorption and (b) degradation.
3.2.2 Influence of composition
Fig. 12 shows the results of photocatalytic activity of ZnO, CuO-ZnO, CuO-ZnO/ZiF-8(10), CuO-ZnO/ZiF-8(20), CuO-ZnO/ZiF-8(30), and ZiF-8. According to Fig. 12 (a), the amounts of AO7 adsorption capability were 5, 13, 22, 28, 36 and 53%, respectively. As can be seen, bare ZnO adsorbed only 5% of AO7, and by increasing ZiF-8 weight percentages, AO7 absorption capability was enhanced. As mentioned above, the low adsorption rate of AO7 over ZnO can be assigned to the low specific surface area. According to Fig. 12 (b), removal rates of AO7 over ZnO, CuO-ZnO, CuO-ZnO/ZiF-8(10), CuO-ZnO/ZiF-8(20), CuO-ZnO/ZiF-8(30), and ZiF-8 were 19, 35, 60, 98.1, 84 and 12%, respectively. As it is evident, CuO-ZnO/ZiF-8(20) has the highest removal rate of AO7 in accordance with the result DRS analysis. The presence of ZiF-8 causes the uniform distribution of the active phase and higher surface accessibility toward the pollutant molecules.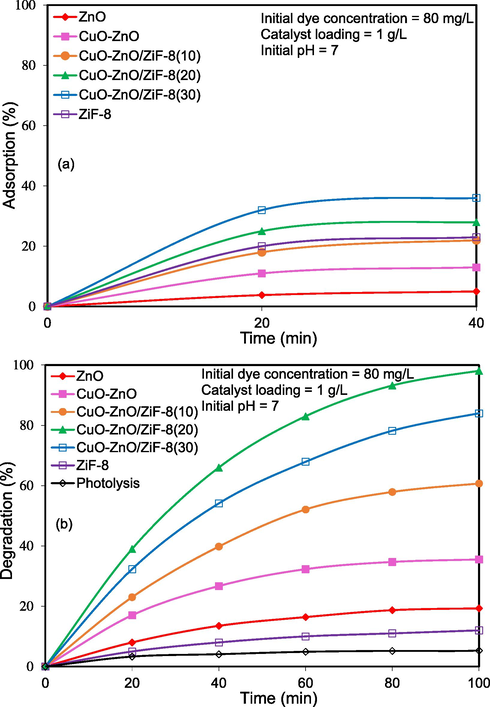
Influence of composition on solar-light-driven photocatalytic degradation of Acid Orange 7 over CuO-ZnO/ZiF-8 photocatalyst: (a) adsorption and (b) degradation.
3.2.3 Influence of pH
Effect of initial solution pH on photocatalytic activity of CuO-ZnO/ZiF-8(20), was investigated and the results are shown in Fig. 13. As shown, the AO7 degradation over this sample was higher at initial solution pH = 7 compared to other pH values. This observation can be explained by the result of pHpzc, which was obtained in the corresponding section (pHpzc = 7.5). As AO7 is an anionic dye and since in the pH = 4 the photocatalyst surface is positive, they excessively attract each other. In pH = 10, the photocatalyst surface is negative, so it repels AO7 molecules, resulting in a significantly reduced contaminant adsorption in these pHs, and photocatalytic activity decreases. Hence, in pH values near pHpzc, the degradation of the pollutants reached to its maximum value due to proper hydroxyl radical adsorption on the catalyst surface, where a major part of degradation occurs.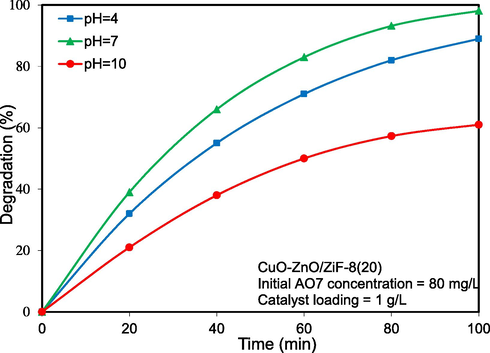
Influence of pH on solar-light-driven photocatalytic degradation of Acid Orange 7 over CuO-ZnO/ZiF-8 (20) photocatalyst.
3.2.4 Influence of photocatalyst loading
Photocatalyst loading is one of the vital parameters on the photocatalytic activity and pollutant removal rate. As can be seen from Fig. 14, the effect of photocatalyst loading as one of the most important parameters on the photodegradation of AO7 was scrutinized. Three different amounts of 0.5 gr/Lit, 1gr/Lit, 2gr/Lit of CuO-ZnO/ZiF-8(20) were investigated in the photocatalytic removal of AO7 and photo removal efficiency of AO7 was obtained 40, 98.1, and 79, respectively. According to the obtained results, by increasing the photocatalyst dosage from 0.5 to 1 gr/L, the photodegradation rate was enhanced due to the increase in active sites. However, photocatalytic activity was decreased when the photocatalyst raised to 2 g/L degradation rate was decreased, which can contribute to the photocatalyst particles agglomeration.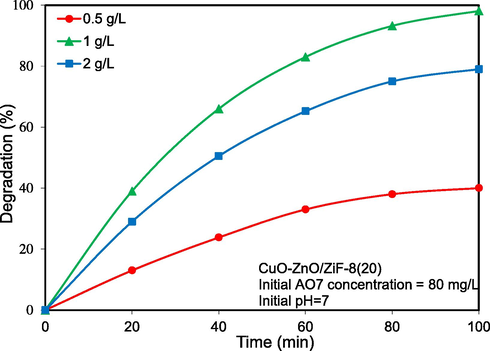
Influence of catalyst loading on solar-light-driven photocatalytic degradation of Acid Orange 7 over CuO-ZnO/ZiF-8 (20) photocatalyst.
3.2.5 Effect of acid orange 7 concentration
As shown in Fig. 15, the effect of the different initial concentrations of AO7 on the photocatalytic activity of CuO-ZnO/ZiF-8(20) was evaluated. According to the results, the degradation rate in 60, 80,100 and 120 mg/L of AO7 solution using CuO-ZnO/ZiF-8(20) was obtained 87.1, 98.1, 80.2 and 56.1%, respectively. As it can be seen, the results imply that., by increasing AO7 concentration, the photocatalytic performance of CuO-ZnO/ZiF-8(20) was decreased due to the saturation of photocatalyst surface with AO7 and water transparency reduction.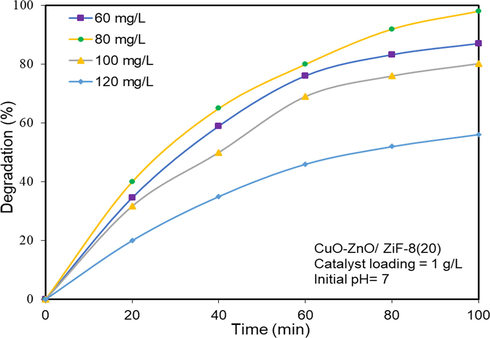
Influence of pollutant concentration on solar-light-driven photocatalytic degradation of Acid Orange 7 over CuO-ZnO/ZiF-8 (20) photocatalyst.
3.2.6 Reusability study
Photocatalytic stability and reusability are some of the key factors in the industrial applications of semiconductors. Most photocatalysts undergo photo-corrosion when exposed to high-energy photons. Hence, this phenomenon should be examined in the synthesized nanophotocatalysts. To investigate the optical and chemical stability of CuO-ZnO/ZiF-8(20) nanocomposite, it was exposed to simulated sunlight irradiation under the mentioned conditions for 100 min. Then, the photocatalysts were separated by centrifugation, washed with distilled water, and dried at 100 °C for 3 h. The dried photocatalyst was used again. This procedure was repeated four times, and photocatalytic degradation was measured at each stage. The results are shown in Fig. 16. As can be seen, at the end of the fourth cycle, the AO7 degradation amount was decreased by 16%. This decrease in adsorption rate is maybe because of the accumulation of AO7 molecules on the surface of photocatalyst, which affects the absorption of pollutants and reduces the photocatalytic activity of catalyst.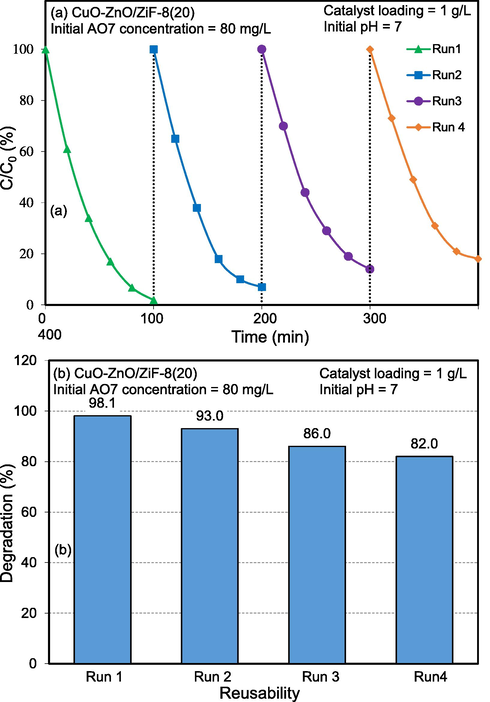
Reusability of CuO-ZnO/ZiF-8 (20) photocatalyst toward solar-light-driven photocatalytic degradation of Acid Orange 7.
3.3 Kinetic study
In order to scrutinize the decomposition reaction kinetics of AO7 over the synthesized nanophotocatalysts, the apparent pseudo-first-order degradation reaction rate contents using the equation (2) were estimated:
In this equation, C0, C, t, and k are the initial concentrations of the organic dye, the concentration of the dye at each time of the reaction, radiation time of the visible light, and the rate constants of reaction, respectively. The graph gradient can be used to determine the value of k. According to Fig. 17, the graph of ‘t’ is very close to the straight line in terms of ln(C0/C), and these results prove that the photocatalytic degradation of AO7 is consistent with the first-order reaction. According to the figure, the initial reaction rate constants for the ZnO, CuO-ZnO, CuO-ZnO/ZiF-8(10), CuO-ZnO/ZiF-8(20), CuO-ZnO/ZiF-8(30), and ZiF-8 were obtained 0.003, 0.0065, 0.0123, 0.0295, 0.0190, and 0.0046 respectively. The higher performance of the CuO-ZnO/ZiF-8(20) sample can be attributed to proper morphology and structure, high surface area, large pore volume and diameter, high light absorption ability, and low recombination rate of excited electron-hole pairs, which were proven by FESEM, BET-BJH, and DRS analyses.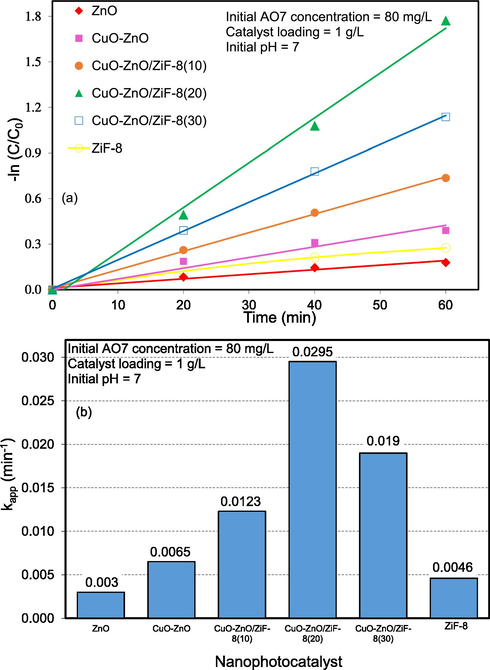
Kinetic consideration of CuO-ZnO/ZiF-8 (20) photocatalyst toward removal of Acid Orange 7 under simulated solar light: (a) -ln(C/C0) and (b) rate constant.
4 Conclusions
In this study, CuO-ZnO/ZiF-8 was used to remove organic dyes from water. ZnO has a wide band gap, and low specific surface area that affects its photocatalytic activity. In this regard, various percentages (10, 20, and 30%) of ZiF-8 were applied with CuO-ZnO. CuO-ZnO/ZiF-8(20) showed the highest photocatalytic activity by removal of 98.1% AO7 80 mg/L in 100 min under simulated solar light irradiation. As a result, 20 % W/W is a suitable composition of CuO-ZnO/ZiF-8 because of improved physicochemical and optical properties. The influence of some operation parameters, such as initial pH, photocatalyst dosage, and pollutant concentration, were investigated. According to the results, the highest photocatalytic activity of CuO-ZnO/ZiF-8(20) was achieved in the initial pH = 7, 1 g/L photocatalyst loading, and 80 mg/L AO7. Also, dropping only 16% in the activity under the optimum conditions after four cycles proved photocatalyst's high stability. Therefore, the novel CuO-ZnO/ZiF-8 photocatalyst can be a promising solution in removing organic dyes.
Acknowledgements
The authors gratefully acknowledge the University of Tabriz and the Sahand University of Technology for the financial support of the research, as well as the Iran Nanotechnology Initiative Council and Water and wastewater Company of Tabriz for complementary financial supports.
Declaration of Competing Interest
The authors declare that they have no known competing financial interests or personal relationships that could have appeared to influence the work reported in this paper.


