

Fast simultaneous determination of 23 veterinary drug residues in fish, poultry, and red meat by liquid chromatography/tandem mass spectrometry
⁎Corresponding author. vet.abdullah@gmail.com (Abdullah M. Alowaifeer)
-
Received: ,
Accepted: ,
This article was originally published by Elsevier and was migrated to Scientific Scholar after the change of Publisher.
Peer review under responsibility of King Saud University.
Abstract
The misuses of veterinary drugs can result in the accumulation of residues in food of animal origin that can make its way to the final consumer. Herein we describe a simple method for the accurate determination of beta-lactams, quinolones, sulphonamides, and tetracyclines in fish, poultry, and red meat. No extraction cartridges were used; instead, the extraction process consisted of the addition of an organic solvents, shaking, centrifugation, and dilution. An extensive validation process demonstrated an excellent linearity (R2 ≥ 0.99) for 23-drug residues. The recovery of drugs in different matrices at two concentration levels (n = 6) was in the range of 82–119%. The method was proved to be repeatable and reproducible with intra/inter-day measurements (RSDs lower than 20%). The quantification limits of drug residues were in the range of 0.8 to 45.3 ug/kg, which is well below the maximum residue limits set by most regulatory authorities. This method was successfully applied to the routine analysis of 20 fish, poultry, and red meat samples (n = 60).
Keywords
Multi-residue
Veterinary drugs
Fish
Poultry
Red meat
LC-MS/MS

- ACN
-
acetonitrile
- DAD
-
diode array detection
- DCM
-
Dichloromethane
- HPLC
-
high performance liquid chromatography
- LC-MS/MS
-
Liquid chromatography/tandem mass spectrometry
- LOD
-
limit of detection
- LOQ
-
limit of quantification
- TOF
-
time of flight
- SPE
-
solid- phase extraction
- UV
-
ultraviolet
Abbreviations
1 Introduction
Veterinary drugs, like most drugs, are a potential group of chemicals designed to exert biological effects at very low concentrations (Arnold et al., 2013). Such effect can be exerted either by the parent form of the chemical or by metabolic precursors (Drewes, 2007). Veterinary drugs can include but not limit antimicrobials (antibiotics including growth promoters and antiseptics), antiparasitic (Ectoparasiticides, endectocides, endoparasiticides including antiprotozoal and anthelmintic), antifungals, anti-inflammatory and bronchodilators (Boxall, Kolpin, Halling-Sørensen, & Tolls, 2003). Due to their countless benefits, they are likely to be exploited by animal producers in order to satisfy demand and increase profit. As a result, many negative impacts on the animal and final consumer may occur. For example, microbes can develop resistance against veterinary drugs, which may lead to future treatment failures and an increase in animal morbidity and mortality rates. Additionally, drug residues may be present in edible animal products, making its way to the final consumer. It has been documented that animal’s muscles, kidneys and liver accumulate the highest concentration of residues after the systemic administration of drugs (Farré & Barceló, 2013).
Exposure to drug residue from food can have significant toxicological effects (Florea & Nightingale, 2004). Human pathogens can become drug resistant over time, making it harder to treat future infections. In addition, certain drugs can cause allergic reactions to susceptible individuals, and the immune compromised may suffer adverse health effects. Accumulating drug residue affects the composition of intestinal microflora as well, leading to digestive complications.
In view of this great concern for human health, many competent authorities have set maximum residue levels (MRLs) for veterinary drugs in different commodities, including meat, poultry, honey, milk, and eggs (European Commission, 2010; Codex Alimentarius Commission, 2018). Generally, the levels vary between 100 and 1000 µg/kg depending on the drug and food matrix. Therefore, developing highly sensitive analytical methods for the determination of veterinary drug residues is required (Masiá, Suarez-Varela, Llopis-Gonzalez, & Picó, 2016).
Several methods have been developed to detect veterinary drug residue in multiple food matrices. The use of high-performance liquid chromatography (HPLC) coupled with ultraviolet (UV) (Juhel-Gaugain, Anger, & Laurentie, 1999; Leal, Codony, Compañó, Granados, & Prat, 2001) and fluorescence (FLD) (Eng, Maxwell, Cohen, Piotrowski, & Fiddler, 1998; Yorke & Froc, 2000) is excessively reported in the literature because of its low cost. However, HPLC methods have poor sensitivity, high interferences, and are unsuitable for detecting traces. Liquid chromatography (LC) coupled with tandem mass spectrometry is the preferable technique to detect veterinary drug residue in food (Alcántara-Durán, Moreno-González, Gilbert-López, Molina-Díaz, & García-Reyes, 2018; Kang et al., 2017; Kaufmann, Butcher, Maden, & Widmer, 2008) due to its ability to detect a wide range of compounds with high sensitivity and selectivity (Biselli, Schwalb, Meyer, & Hartig, 2013; Nebot et al., 2012; Zhao, Lucas, Long, Richter, & Stevens, 2018; Zhu et al., 2016). LC methods usually involve a prerequisite sample pre-treatment, such as the use of solid phase extractions (SPE) (Peters, Bolck, Rutgers, Stolker, & Nielen, 2009), liquid-liquid clean-up (Nebot et al., 2012), micro-filtration (Ortelli, Cognard, Jan, & Edder, 2009), QuEChERS procedure (Desmarchelier et al., 2018; Gressler et al., 2016; Lopes, Reyes, Romero-González, Frenich, & Vidal, 2012) nanoflow (Alcántara-Durán et al., 2018) or turbo flow (Zhu et al., 2016). Each of those approaches has shortcomings and may only be effective in extracting specific groups of veterinary drugs. With the advancement of LC instruments that have higher sensitivity and can tolerate higher interferences, some have resorted to developing methods without a clean-up step in order to save cost and time (Robert et al., 2013). These methods are still premature and are limited to the detection of some drugs in certain food matrices. In addition, the matrix effect (ME) of eliminating the clean-up step on the instrument response is still to be investigated.
In this study, we have developed and validated a one-step extraction method for the multi residue analysis of 23 veterinary drugs in fish, poultry, and red meat. The validation procedure was conducted according to ISO/IEC 17025:2017 criteria. In addition, the ME of each compound in each meat type was investigated to ensure the accuracy and trueness of the results. The objective of this study was to offer a simple and rapid sample preparation method for the detection of veterinary drugs in food that food control laboratories can adopt. The presented method is able to confirm and quantify: 4-epi-chlorotetracycline, 4-epi-tetracycline, benzylpenicillin, chlortetracycline, ciprofloxacin, cloxacillin, dapsone, doxycycline, enrofloxacin, flumequine, oxytetracycline, sulfabenzamide, sulfadiazine, sulfadimethoxine, sulfadoxine, sulfamerazine, sulfamethazine, sulfamethizole, sulfamethoxazole, sulfamethoxypyridazine, sulfapyridine, sulfathiazole and tetracycline using a regular HPLC coupled with a quadrupole-trap mass analyzer. These drugs were selected because of their frequency of detection in food of animal origin and their widespread use in veterinary medicine. To our best knowledge, this is the first method that demonstrates the extraction and detection of 4-epi-chlorotetracycline, 4-epi-tetracycline, sulfabenzamide, and sulfamethoxypyridazine in food without the use of any clean-up procedure.
2 Material and methods
2.1 Chemicals and reagents
All reagents were of high-performance liquid chromatography (HPLC) grade. Acetonitrile (ACN), water, methanol, and formic acid (≥98%) were purchased from Merck (Darmstadt, Germany).
2.2 Analytical standards
4-epi-chlorotetracycline, 4-epi-tetracycline were obtained from Across Organic (NJ, USA), while benzylpenicillin, chlortetracycline, ciprofloxacin, cloxacillin, dapsone, doxycycline, enrofloxacin, flumequine, oxytetracycline, sulfabenzamide, sulfadiazine, sulfadimethoxine, sulfadoxine, sulfamerazine, sulfamethazine, sulfamethizole, sulfamethoxazole, sulfamethoxypyridazine, sulfapyridine, sulfathiazole, and tetracycline were purchased from Dr. Ehrenstorfer GmbH (Augsburg, Germany).
A stock standard solution of individual drugs was prepared by dissolving 50 g of each compound in 50 mL methanol to achieve a final concentration of 1000 µg/mL (1000 ppm). Stock solutions were further diluted with methanol to obtain an intermediate standard for each compound at a concentration of 100 µg/mL (100 ppm), then they were stored at −20 °C. On the day of the analysis, fresh working standard solutions were prepared by diluting the intermediate standard with HPLC water /ACN (10:1, v/v). It has been stated in the literature that tetracyclines are unstable in light; thus, in order to avoid photolysis, it is recommended to prepare and store them in the dark (Werner, Arnold & Mcneill, 2006).
2.3 Sample preparation and extraction
Three different meat matrices were selected (fish, poultry, and red meat) and purchased from different local markets. Samples were screened to confirm the absence of veterinary drug residues. Blank samples were employed for preparing ME calibration curves and for the validation study. Each sample was thoroughly homogenized using a STEPHAN machinery model UM 5–12. Afterward, 1 g of sample material was weighed into a 15 mL polypropylene centrifuge tube, and 5 mL of ACN was added. The sample was then vortexed for 1 min and placed in an overhead shaker for 10 min. After, the sample was centrifuged at 4000 rpm for 10 min at 5 °C, and 4 mL of the upper organic layer was transferred into an evaporation tube. The extract was evaporated to dryness using a rotary vacuum evaporator at 50 °C. Afterward, the extract was dissolved in mobile phase A and transferred to an LC vial for analysis.
2.4 Liquid chromatography tandem mass spectrometry
Analyses was conducted using Agilent 1290 series LC systems (Santa Clara, CA, USA) equipped with a Binary Solvent Manager, Sample Manager - Flow-Through-Needle, and a column heater with active pre-heating. The chromatography Separation was carried outperformed on a Phenomenex Aqua C18 (3 µm, 125 Å, 150 mm) with a guard column (Phenomenex, Torrance, CA, USA). Mobile phases A and B were HPLC grade water and ACN, both with 0.1% (v/v) formic acid, respectively. The linear gradient elution was as follows: 90% A (initial), 90% A (from 0 to 1 min), 40% A (1 to 12 min), 40% A (12 to 15 min), 90% A (15 to 16 min), 90% A (16 to 18 min). The column temperature was 40 ◦C, the flow rate was set at 250 µL/min, and the injection volume was 20 µL.
The LC was coupled with a 6500 Qtrap mass analyzer (AB Sciex, Canada) with a Turbo V ion source. The ionization source was an electrospray (ESI) probe that was operated in a positive mood. The Turbo Ion source operated at 450 °C with the electrode voltage at 5500 V. Nitrogen was used as curtain gas, nebulizer gas, and collision gas on the MS. Other MS parameters were as follows: ion source gas 1(GS1), 45 psi; ion source turbo gas 2(GS2), 55 psi; curtain gas, 30 psi; collision gas, 12 psi; entrance potential, 10 V. Multiple reactions monitor mode was applied for quantitative and qualitative analysis. Veterinary drugs were identified by matching the retention time and fragmentation with their corresponding standard under the same experimental conditions. Quantification was conducted by selecting two characteristic ions with the most intensity in relation to noise (See Table 1).
| Analyte | Precursor | Product | Retention | Declustering | Entrance | Cell Exit Potential (CXP) |
|---|---|---|---|---|---|---|
| 4-epi-chlortetracycline | 479.1 | 444 | 6.2 | 60 | 10 | 45 |
| 479.1 | 303 | 60 | 10 | 27 | ||
| 4-epi-tetracycline | 445.1 | 410.1 | 4.96 | 70 | 7 | 45 |
| 445.1 | 392.1 | 70 | 7 | 42 | ||
| Benzylpenicillin | 335.2 | 176.1 | 9.9 | 85 | 10 | 35 |
| 335.2 | 160 | 85 | 10 | 37 | ||
| Chlortetracycline | 479.1 | 444 | 6.88 | 80 | 10 | 45 |
| 479.1 | 462 | 80 | 10 | 48 | ||
| Ciprofloxacin | 332 | 288.2 | 5.39 | 60 | 10 | 30 |
| 332 | 314.1 | 60 | 10 | 35 | ||
| Cloxacillin | 436.1 | 160 | 11.92 | 90 | 8 | 20 |
| 436.1 | 276.9 | 90 | 8 | 25 | ||
| Dapsone | 248.9 | 108 | 7.05 | 60 | 6 | 13.24 |
| 248.9 | 156 | 60 | 6 | 16 | ||
| Doxycycline | 445.101 | 154.101 | 5.57 | 60 | 8 | 32 |
| 445.101 | 321.101 | 60 | 8 | 32 | ||
| Enrofloxacin | 360.2 | 316.1 | 5.78 | 100 | 8 | 35 |
| 360.2 | 342.1 | 100 | 8 | 40 | ||
| Flumequine | 262 | 244.1 | 10.55 | 60 | 9 | 25 |
| 262 | 202 | 60 | 9 | 25 | ||
| Oxytetracycline | 461.1 | 426 | 5.18 | 100 | 10 | 45 |
| 461.1 | 337.1 | 100 | 10 | 30 | ||
| Sulfabenzamide | 277 | 156 | 8.67 | 50 | 10 | 20 |
| 277 | 108 | 50 | 10 | 15 | ||
| Sulfadiazine | 249.9 | 92 | 4.99 | 80 | 10 | 43 |
| 249.9 | 156 | 80 | 10 | 18 | ||
| Sulfadimethoxine | 311.001 | 156.101 | 8.95 | 80 | 10 | 15 |
| 311.001 | 108 | 80 | 10 | 10 | ||
| Sulfadoxine | 311.1 | 156 | 7.55 | 60 | 10 | 15 |
| 311.1 | 92 | 60 | 10 | 42 | ||
| Sulfamerazine | 264.9 | 108 | 5.34 | 80 | 10 | 15 |
| 264.9 | 92 | 80 | 10 | 40 | ||
| Sulfamethazine | 278.9 | 186 | 6.02 | 60 | 10 | 15 |
| 278.9 | 124.1 | 60 | 10 | 15 | ||
| Sulfamethizole | 271 | 155.9 | 6.17 | 60 | 10 | 15 |
| 271 | 92 | 60 | 10 | 15 | ||
| Sulfamethoxazole | 253.9 | 156.1 | 7.65 | 80 | 10 | 15 |
| 253.9 | 92 | 80 | 10 | 10 | ||
| Sulfamethoxypyridazine | 281.9 | 92 | 6.23 | 60 | 10 | 11 |
| 281.9 | 108 | 60 | 10 | 15 | ||
| Sulfapyridine | 249.9 | 92 | 4.99 | 80 | 10 | 43 |
| 249.9 | 156.1 | 80 | 10 | 18 | ||
| Sulfathiazole | 255.8 | 92 | 4.88 | 80 | 10 | 40 |
| 358.1 | 255 | 90 | 8 | 30 | ||
| Tetracycline | 445.1 | 410 | 5.58 | 80 | 7 | 22 |
| 455.1 | 427.1 | 80 | 7 | 22 |
2.5 Validation procedure
Various parameters were evaluated to determine the appropriateness of the developed method. Overall, the procedure specified by ISO/IEC 17025:2017 to validate non-standard methods was followed. The evaluated performance characteristics were: selectivity, linearity, accuracy (trueness, intra- day repeatability and inter-day reproducibility), ME, limit of detection (LOD), limit of quantification (LOQ), and uncertainty. Selectivity was assessed using fish, poultry, and red meat samples obtained from different sources (n = 10) to confirm the absence of interfering peaks at the retention time of each drug in the solvent and blank samples. Linearity was generated by analyzing four concentrations (20, 50, 100, and 200 ng /mL) of all drugs in triplicates prepared in blank fish, poultry, and red meat samples. Evaluation of linearity was conducted by linear regression analysis, and acceptable curves were those with a correlation coefficient (R2) > 0.99. Precision and trueness (Accuracy) were evaluated by spiking 50 and 100 µg/m of each drug into blank fish, poultry, and red meat samples. Six readings were done intra- day and three readings inter-day for each matrix, and the recovery was calculated using equation (1).
Where C1: observed concentration and C2: spiked concentration.
Limits of detection (LOD) and limits of quantification (LOQ) of this method were measured in ME and calculated by following equations (2) and (3), respectively.
Where: Sd is the standard deviation of residuals (Sy.x) and b is the slope of the calibration function.
The estimation of ME was done using equation (4) . When ME is < ±10% then signal change due to ME is considered negligible; if ME is between ± 10% and ± 20% ME is deemed soft; and when ME is between ± 20% and ± 50% it is considered medium; while ME above ± 50% is presumed strong. Overall, ME above 100% is considered a signal enhancement, while an ME below 100% is considered signal suppression (Gosetti et al., 2010).
The measurement of uncertainty for the determination of veterinary drugs in different matrices was estimated using the Nordtest approach following equations (5), 6, 7, and 8. This approach relies on a single laboratory validation (intra-laboratory data) and accounts for the random effects of residual and the systematic effects (bias) Magnusson, B. M., Näykki, T., Hovind, H., & Krysell, M. (2003).
Where: uc is the uncertainty of residual concentration; u(Rw) is within-laboratory reproducibility; RMSbias is the average (root mean square) bias; and n is the number of bias measurements. In addition, the expanded uncertainty was calculated by multiplying the uncertainty with a coverage factor of 2, which gives a confidence level of approximately 95% (equation (9)) (Magnusson et al., 2003).
3 Results and discussion
3.1 Sample preparation
The determination of veterinary drug residues in meat has been studied for several years (Heitzman, 1994; Reig, & Toldrá, 2008; Falowo, & Akimoladun, 2019). However, the majority use a combination of SPE and other cleaning techniques to obtain adequate extracts suitable for injection into the MS (Casado, Pérez-Quintanilla, Morante-Zarcero, & Sierra, 2017). The focus of this study was to establish a simple and affordable protocol for routine laboratory analysis, balancing between speed and quality. Therefore, the use of SPE, large volumes of hazardous solvents, evaporation, and other pricey, labor intensive steps were avoided as possible. ACN was selected as the extraction solvent with water. Using ACN and water is advantageous since it promotes protein precipitation and minimizes the co-extraction of lipids (Liu et al., 2019). The extractant was acidified with formic acid to facilitate quinolones solubility due to its amphoteric characteristics (OuYang et al., 2014). During our trial and error, methanol was used as an extraction solvent, and it provided adequate recoveries, but the extractant was turbid, possibly due to excessive protein.
3.2 Optimization of sample extraction
While using SPE as a clean-up is convenient, extracting large batches of samples is costly. Hence, it was necessary to develop an efficient extraction protocol that is short, inexpensive, and recovers the maximum number of veterinary drugs in a short period with low consumption of organic solvent. After trying a wide range of organic solvents, it was found that ACN coupled with centrifugation at low temperature offers the most reproducible results. Furthermore, this method requires a small sample quantity of around 1g to achieve acceptable recovers ranges. Overall, the recovery ranged from 82% to 119% for all veterinary drugs and the coefficient of variation percentage of most drugs was below 13.5%, except for benzylpenicillin (16%) and doxycycline (19%) (Table 2).
| Analyte | Fish | Poultry | Red Meat | |||
|---|---|---|---|---|---|---|
| 50 μg/kg | 100 μg/kg | 50 μg/kg | 100 μg/kg | 50 μg/kg | 100 μg/kg | |
| 4-epi-Chlortetracycline | 115.83 (5.74) | 104.48 | 98.33 (5.33) | 108.66 (3.27) | 105.13 (13.46) | 89.83 (5.96) |
| (6.23) | ||||||
| 4-epi-tetracycline | 118.17 (6.41) | 106.83 | 100.2 (2.34) | 113.16 (4.08) | 97.28 (10.57) | 101.41 (3.05) |
| (4.33) | ||||||
| Benzylpenicillin | 118.83 (7.68) | 102.13 | 106.53 (11.23) | 108.66 (4.68) | 82.77 (16.81) | 97.2 (3.43) |
| (4.87) | ||||||
| Chlortetracycline | 117.17 (7.58) | 105.07 | 99.1 (5.83) | 110.33 (4.81) | 99.27 (10.52) | 99.65 (6.12) |
| (6.36) | ||||||
| Ciprofloxacin | 112.50 (6.15) | 104.28 | 103.53 (2.73) | 107.28 (4.45) | 100.2 (7.46) | 101.43 (2.1) |
| (5.28) | ||||||
| Cloxacillin | 119.17 (4.61) | 110.83 | 101.06 (4.85) | 114.66 (6.15) | 93.02 (9.60) | 99.41 (5.27) |
| (2.31) | ||||||
| Dapsone | 118.67 (3.65) | 112 | 99.13 (6.91) | 109.41 (5.01) | 99.48 (12.54) | 111.66 (3.42) |
| (6.8) | ||||||
| Doxycycline | 98.25 | 99.05 | 98.9 (9.57) | 110 (2.29) | 94.75 (19.63) | 100.46 (5.19) |
| (5.95) | (9.64) | |||||
| Enrofloxacin | 112.33 (3.89) | 103.5 | 101.83 (2.89) | 103.8 (3.73) | 103.45 (8.04) | 103.16 (2.07) |
| (4.13) | ||||||
| Flumequine | 119.50 (6.92) | 118.17 | 113.9 (2.59) | 109.83 (3.42) | 101.07 (6.67) | 101.8 (3.23) |
| (4.95) | ||||||
| Oxytetracycline | 119.50 (5.61) | 107.38 | 104.33 (1.41) | 106.96 (5.5) | 96.97 (11.95) | 98.51 (2.96) |
| (5.79) | ||||||
| Sulfabenzamide | 119.50 (4.64) | 112.17 | 105.3 (10.69) | 112.83 (4.35) | 98.3 (9.30) | 101 (4.14) |
| (3.54) | ||||||
| Sulfadiazine | 117.17 (3.07) | 110.5 | 104.23 (5.35) | 114.16 (1.5) | 99.65 (9.37) | 111.16 (1.54) |
| (5.08) | ||||||
| Sulfadimethoxine | 119.67 (5.58) | 117.17 | 107.4 (5.32) | 104.5 (2.54) | 100.13 (7.92) | 109 (2.24) |
| (3.03) | ||||||
| Sulfadoxine | 114.83 (2.78) | 111.17 | 107.53 (5.94) | 108.83 (3.45) | 102.28 (9.16) | 113.16 (2.26) |
| (2.87) | ||||||
| Sulfamerazine | 114.33 (3.21) | 112.17 (2.95) | 104.66 (4.67) | 112.5 (1.92) | 101.23 (9.99) | 111.83 (1.64) |
| Sulfamethazine | 118.67 (7.57) | 109.17 | 104.26 (5.58) | 112.5 (1.46) | 103.75 (9.02) | 111.83 (1.64) |
| (4.03) | ||||||
| Sulfamethizole | 118 (7.52) | 110.67 | 104.83 (6.86) | 112.33 (2.43) | 102.22 (8.57) | 108.66 (1.5) |
| (2.66) | ||||||
| Sulfamethoxazole | 117.83 | 113.67 | 105.83 (6.01) | 112.5 (1.84) | 101.83 (9.05) | 106.16 (3.39) |
| (3.54) | (2.82) | |||||
| Sulfamethoxypyridazine | 117.83 (7.15) | 113.5 | 102.3 (4.75) | 109.5 (2.98) | 101.6 (9.43) | 112.83 (3.14) |
| (4.41) | ||||||
| Sulfapyridine | 118.50 (4.43) | 110.5 (5.08) | 104.23 (5.35) | 112 (3.38) | 99.65 (9.37) | 112.33 (2) |
| Sulfathiazole | 118.33 (3.37) | 109.5 | 105.03 (5.02) | 111.66 (2.86) | 100.67 (9.24) | 111.5 (1.47) |
| (2.75) | ||||||
| Tetracycline | 119.50 (8.35) | 111.33 (5.98) | 101.06 (4.85) | 112 (3.65) | 99.38 (11.47) | 98.36 (2.7) |
3.3 Liquid chromatography - mass spectrometry analysis
Chromatographic separation using acidified water and ACN offered the best resolution with a retention duration ranging from 4.8 to 11.9 min. Methanol was tested as a mobile phase, which led to high background due to the high pressure caused by the high viscosity of methanol. On the other hand, ACN was more suitable as peaks emerged clearly. A mobile phase composed of ACN/water has a lower viscosity than methanol/water, therefore generating lower backpressures across the LC column, which puts less strain on the LC system, and provides a scope to increase flow and reduce run times. Phenomenex Aqua 3 µm C18 125 Å (150 × 2 mm) was our column of choice due to the presence of end capping, which allowed the separation of the tetracycline group. Lower injection volume was found to give satisfactory resolutions of the targeted peaks. Although certain analytes had similar retention times, they were differentiated using multiple reaction monitoring (MRM), which allows for independent analysis of each analyte due to the high selectivity of the tandem mass spectrometry. For each compound, the analysis was performed by monitoring at least two conforming transitions (European Commission, 2002).
3.4 Selectivity
The chromatographic profiles of fish, poultry, and red meat were similar. There were no visible interference peaks in any of the samples. Additionally, the method selectivity was deemed acceptable because the LC-MS/MS system is a highly sensitive technique and all identification points (IPs) were achieved using two precursor ions (1.0 IP) and two qualifier ions (1.5 IPs). According to Commission Decision 2002/657/EC, a minimum of four identification points is required for confirmatory analysis.
3.5 Linearity
The linearity of an analytical method can be explained as its capability to show “results that are directly proportional to the concentration of the analyte in the sample”. Linearity is important for confirming the method’s sensitivity for analyzing the analyte’s concentration within a defined range. As per the method validation ICH Q2 (R1) guideline, the linearity of a given response must be evaluated using a minimum of five concentrations (multi-point calibration), and data must be statistically analyzed. In our study, calibration curves were generated in the solvent and using each matrix. ME calibrations were prepared by mixing known volumes of the working solutions with a homogenized blank sample. The two calibration curves were studied over a concentration range of 20, 50, 100, and 200 µg/kg for each drug. The regression equations and their coefficient (R2) are reported in Table 3. Excellent linearity was observed for 4-epi-chlortetracycline, 4-epi-tetracycline, chlortetracycline, ciprofloxacin, enrofloxacin, oxytetracycline, sulfabenzamide, sulfadimethoxine, sfamethizole, sulfathiazole, and tetracycline in poultry (R2) > 0.999.
| Analyte | Solvent | R2 | Linear range (ng/mL) | ||
|---|---|---|---|---|---|
| Fish | Poultry | Red Meat | |||
| 4-epi-Chlortetracycline | 0.9975 | 0.9889 | 0.9996 | 0.9945 | 20–200 |
| 4-epi-tetracycline | 0.9987 | 0.9934 | 0.9993 | 0.993 | 20–200 |
| Benzylpenicillin | 0.9955 | 0.9822 | 0.9953 | 0.9997 | 20–200 |
| Chlortetracycline | 0.9948 | 0.9893 | 0.999 | 0.99 | 20–200 |
| Ciprofloxacin | 0.9914 | 0.9929 | 0.9997 | 0.9956 | 20–200 |
| Cloxacillin | 0.9868 | 0.9895 | 0.9983 | 0.9959 | 20–200 |
| Dapsone | 0.9983 | 0.9989 | 0.997 | 0.9981 | 20–200 |
| Doxycycline | 0.9993 | 0.982 | 0.9927 | 0.9861 | 20–200 |
| Enrofloxacin | 0.9904 | 0.9956 | 0.9993 | 0.9949 | 20–200 |
| Flumequine | 0.9889 | 0.9962 | 0.9974 | 0.9946 | 20–200 |
| Oxytetracycline | 0.9982 | 0.9922 | 0.9997 | 0.9964 | 20–200 |
| Sulfabenzamide | 0.999 | 0.9954 | 0.9994 | 0.9963 | 20–200 |
| Sulfadiazine | 0.9927 | 0.998 | 0.9984 | 0.9974 | 20–200 |
| Sulfadimethoxine | 0.9991 | 0.9931 | 0.9991 | 0.9942 | 20–200 |
| Sulfadoxine | 0.9994 | 0.9971 | 0.9965 | 0.9964 | 20–200 |
| Sulfamerazine | 0.9947 | 0.9977 | 0.9959 | 0.9928 | 20–200 |
| Sulfamethazine | 0.9949 | 0.9982 | 0.9956 | 0.9943 | 20–200 |
| Sulfamethizole | 0.9984 | 0.9979 | 0.9991 | 0.995 | 20–200 |
| Sulfamethoxazole | 0.9989 | 0.9964 | 0.9973 | 0.9951 | 20–200 |
| Sulfamethoxypyridazine | 0.999 | 0.9965 | 0.9972 | 0.9959 | 20–200 |
| Sulfapyridine | 0.9927 | 0.998 | 0.9984 | 0.9974 | 20–200 |
| Sulfathiazole | 0.9975 | 0.9979 | 0.9995 | 0.996 | 20–200 |
| Tetracycline | 0.9988 | 0.9867 | 0.9995 | 0.9958 | 20–200 |
3.6 Accuracy (Trueness, repeatability and within-laboratory reproducibility)
The accuracy was evaluated by spiking blank samples with standards at concentration levels of 50 and 100 µg/kg. The spiked samples were left for at least 5 min at room temperature to ensure the appropriate distribution of the analytes in the matrices. To assess the trueness, recovery of spiked samples was measured. The recovery test values obtained for all analytes in different matrices at 2 spiked levels were between 82 and 119%. In the fish matrix, the lowest recovery was observed for doxycycline (98%), and the highest was for sulfadimethoxine with (119 %). As for poultry, 4-Epi-chlortetracycline had the lowest recovery (98 %), while cloxacillin (114 %) and sulfadiazine (114 %) were the highest. Finally, low recovery values for benzylpenicillin (82 %) were observed in red meat, while the highest recovery in the same matrix was for sulfadoxine (113 %). Overall, we noticed that sulfa containing compounds presented the highest recovery in all matrixes. These findings are similar to those reported in other methods (Avdeef, 2014; Takebayashi, Sue, Furuya, & Yoda, 2021). The solubility of sulfa compounds is known to increase in acidic conditions, while the opposite is true for other compounds that exhibited lower recoveries such as 4-epi-chlortetracycline, benzylpenicillin, and doxycycline (Ren et al., 2010).
The precision of the methods was assessed by repeatability and reproducibility with intra- and inter-day measurements. The intra and inter day results were expressed in RSD from six replicates. The RSD of inter-day values for all substances were within 2 to 16 %, while intra-day RSD values were between 5 and 19% (Table 2). Thus, the method was deemed accurate according to the criteria reported in the Decision 2002/657/EC (European Commission, 2021).
3.7 Matrix effect (ME)
To estimate the ME for the targeted analytes, blank controls and standard solutions were measured in the mobile phase and the matrix in parallel at four different concentrations (20, 50, 100, 200 ng/mL). Overall, poultry samples had the highest ratio of ion enhancement in comparison to the solvent (65.2%) followed by fish and red meat (43.4%, and 30.4%, respectively) (Table 4). Interestingly, chlortetracycline, dapsone, doxycycline, sulfadimethoxine, sulfadoxine, sulfamerazine, sulfamethizole, sulfathiazole, and tetracycline had strong ME in all matrices. On the other hand, beta lactam and quinolones compounds were suppressed by all matrices (Fig. 1); therefore, extra care is recommended when preparing their standards. Although benzylpenicillin did not display ME in poultry, it showed an ion enhancement in the meat matrix. On the other hand, benzylpenicillin ions were suppressed in fish, possibly due to the high fat content of fish (Baesu, Audet & Bayen, 2021, Parab & Amritkar, 2012). ME calculated in this study were found to be similar to those reported by Hoff et al., 2015 and Freitas et al., 2015 in their methods.
| Compound | Fish | Poultry | Red Meat |
|---|---|---|---|
| 4-epi-Chlortetracycline | −17 | −14 | −24 |
| 4-epi-tetracycline | −1.1 | −2.2 | 0.4 |
| Benzylpenicillin | −9 | −34 | −50 |
| Chlortetracycline | 84 | 73 | 98 |
| Ciprofloxacin | −39 | −38 | −31 |
| Cloxacillin | 9 | 5 | −14 |
| Dapsone | 104 | 52 | 83 |
| Doxycycline | −58 | −60 | −55 |
| Enrofloxacin | −31 | −25 | −20 |
| Flumequine | −14 | −14 | −24 |
| Oxytetracycline | 25 | 14 | 23 |
| Sulfabenzamide | −13 | −27 | –22 |
| Sulfadiazine | 23 | −1 | 7 |
| Sulfadimethoxine | −97 | −97 | −97 |
| Sulfadoxine | 107 | 67 | 64 |
| Sulfamerazine | 211 | 151 | 163 |
| Sulfamethazine | 35 | 24 | 33 |
| Sulfamethizole | 84 | 73 | 98 |
| Sulfamethoxazole | −39 | −38 | −31 |
| Sulfamethoxypyridazine | 9 | 5 | −14 |
| Sulfapyridine | −7 | −13 | −4 |
| Sulfathiazole | 104 | 52 | 83 |
| Tetracycline | −58 | −60 | −55 |
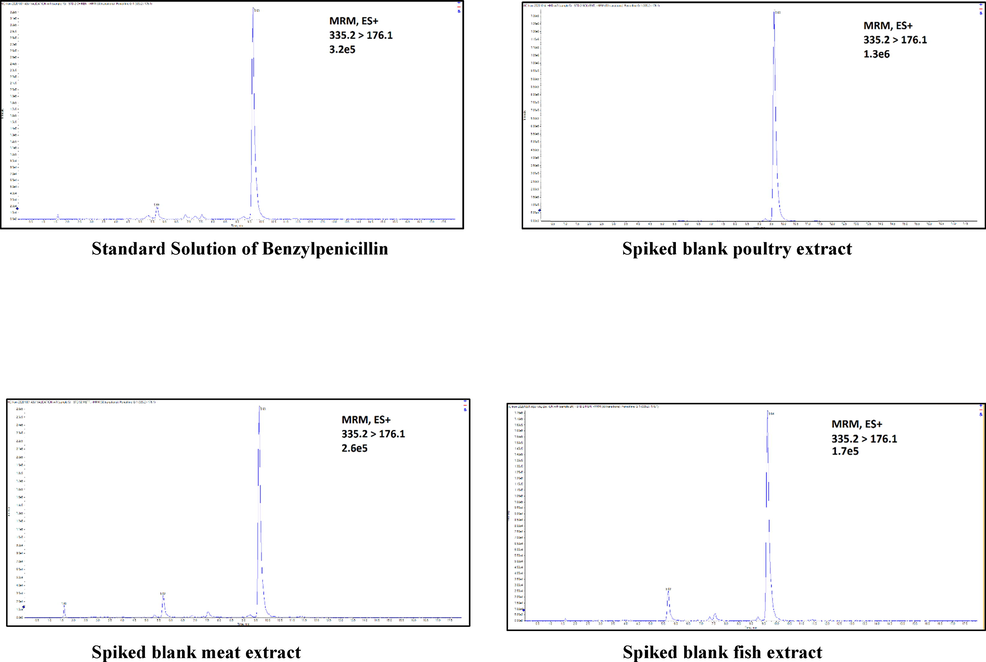
- Example of matrix effect observed in the analysis of Benzylpenicillin: all matrixes show ion suppression.
Several observations were noticed when comparing the ME of antibiotics within the same family. Tetracycline, chlortetracycline, and doxycycline show strong ion enhancement, while oxytetracycline shows the opposite in all matrices. Inconsiderable ion suppression was observed in all matrices for both epimers 4-epi-chlortetracycline and 4-epi-tetracycline. As for sulfonamides, six compounds show ion enhancement across all matrices, while three exhibit suppressions in all matrices. There were certain variations in the signal responses of antibiotics depending on the matrix; for example, sulfamethazine ions were suppressed in poultry, while there was no such suppression in meat or fish. To the best of our knowledge, this study is the only one that investigated ME of sulfonamides in more than one matrix. Overall, 39.13% of antibiotics had ion enhancement in all matrices, while 30.4% of compounds represented ion suppression, 21.7% exhibited differences across matrices, and 8.6% showed no matrix effect at all (See Fig. 2.)
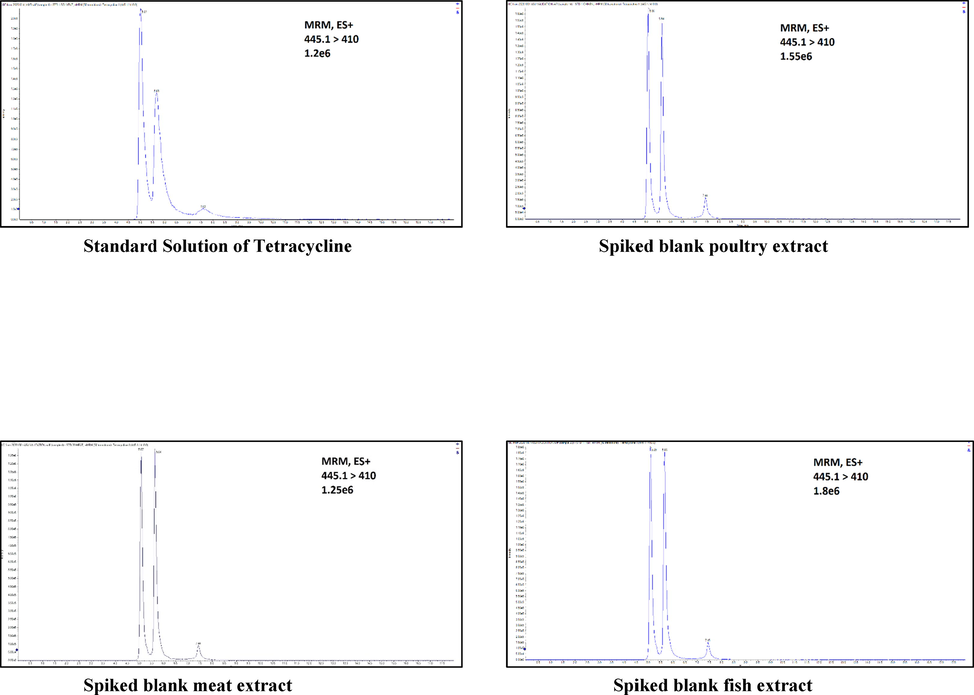
- Example of significant matrix effect observed in the analysis of Tetracycline, all matrixes show ion enhancement.
3.8 LOD, LOQ and uncertainty
The obtained LOD of veterinary drugs ranged from 0.3 to 15 µg/kg, whereas the LOQ was found to range from 0.8 to 45.3 µg/kg (Table 5). The calculated LOQs for all drug residues were below the MRL set by Codex and the European Union (EU), demonstrating the suitability of the developed method for compliance programs (Codex Alimentarius Commission, 2018). Acceptable expanded uncertainty was achieved for all veterinary drugs in three different matrices that did not exceed 28%.
| Analyte | Red Meat | Poultry | Fish | ||||||
|---|---|---|---|---|---|---|---|---|---|
| U % | LOD (μg/kg) | LOQ (μg/kg) | U % | LOD (μg/kg) | LOQ (μg/kg) | U % | LOD (μg/kg) | LOQ (μg/kg) | |
| 4-epi-Chlortetracycline | 7.5 | 2.5 | 19 | 23.8 | 7.9 | 14 | 14.9 | 4.9 | 28 |
| 4-epi-Tetracycline | 14.9 | 4.9 | 17 | 5.9 | 2 | 17 | 12.2 | 4 | 8 |
| Benzylpenicillin | 6.3 | 2.1 | 13 | 16.5 | 5.4 | 11 | 21.8 | 7.2 | 11 |
| Chlortetracycline | 24.9 | 8.2 | 17 | 4.9 | 1.6 | 16 | 16.4 | 5.4 | 16 |
| Ciprofloxacin | 26.7 | 8.8 | 16 | 18.8 | 6.2 | 17 | 38.4 | 12.7 | 6 |
| Cloxacillin | 1.55 | 0.51 | 18 | 4.89 | 1.62 | 27 | 5.95 | 1.97 | 14 |
| Dapsone | 22.7 | 7.5 | 18 | 9.7 | 3.2 | 22 | 0.8 | 0.3 | 22 |
| Doxycycline | 25.3 | 8.3 | 19 | 8.7 | 2.9 | 18 | 28.6 | 9.4 | 14 |
| Enrofloxacin | 21.5 | 7.1 | 8 | 5 | 1.6 | 11 | 22.9 | 7.6 | 8 |
| Flumequine | 19.8 | 6.5 | 26 | 28.9 | 9.5 | 17 | 16.6 | 5.5 | 11 |
| Oxytetracycline | 20.3 | 6.7 | 17 | 23.8 | 7.9 | 15 | 9.2 | 3.1 | 8 |
| Sulfabenzamide | 12 | 4 | 17 | 1.1 | 0.4 | 23 | 10.7 | 3.5 | 13 |
| Sulfadiazine | 39.5 | 13.1 | 13 | 4.2 | 1.4 | 23 | 3.2 | 1 | 20 |
| Sulfadimethoxine | 33.5 | 11 | 27 | 20.1 | 6.6 | 10 | 5.6 | 1.9 | 17 |
| Sulfadoxine | 23.4 | 7.7 | 17 | 23.3 | 7.7 | 16 | 6.4 | 2.1 | 24 |
| Sulfamerazine | 35.2 | 11.6 | 21 | 38.6 | 12.7 | 21 | 23.9 | 7.9 | 24 |
| Sulfamethazine | 34.4 | 11.4 | 23 | 27.8 | 9.2 | 17 | 14 | 4.6 | 20 |
| Sulfamethizole | 27 | 9 | 20 | 10.3 | 3.4 | 19 | 35 | 11.5 | 16 |
| Sulfamethoxazole | 14.7 | 4.9 | 18 | 15.2 | 5 | 21 | 15 | 5 | 14 |
| Sulfamethoxypyridazine | 45.3 | 15 | 19 | 36.2 | 12 | 16 | 13.1 | 4.3 | 24 |
| Sulfapyridine | 39.5 | 13.1 | 13 | 4.2 | 1.4 | 13 | 3.2 | 1 | 22 |
| Sulfathiazole | 19.8 | 6.5 | 16 | 5.1 | 1.7 | 19 | 8.2 | 2.7 | 20 |
| Tetracycline | 8.1 | 2.7 | 16 | 5.3 | 1.8 | 22 | 27.3 | 9 | 8 |
3.9 Application to real samples
Applicability is an important evaluation step for any newly developed analytical method. Therefore, this method was applied to the routine analysis of 20 samples of fish, poultry, and red meat (n = 60). The workflow was found to be convenient and time saving for our analysts. Fortunately, veterinary drug residues in all analyzed samples were found to be below the LOQ.
3.10 Proficiency testing
To test the reliability of the developed method, the laboratory participated in a proficiency test provided by Fapas (York, UK) to quantify ciprofloxacin a fish sample (PT 02397). The laboratory successfully passed the proficiency test with a Z-score ≤ 2 (see supplementary materials).
4 Conclusion
The key goal of the present study was to develop a practical method for analyzing veterinary drug residues in different food matrices, which can support large-scale food surveillance programs. The method presented herein is capable of simultaneously detecting and quantifying 23 veterinary drug residues in fish, poultry, and red meat. This method requires only 1 g of sample and does not involve a clean-up step. The selection of two fragment ions on the LC-MS/MS provides high sensitivity and accuracy. During our effort to demonstrate the reliability of this method, we utilized the ISO/IEC 17025:2017 specifications for method validation. The developed method displayed excellent recovery, repeatability, and reproducibility with low detection limits and acceptable uncertainty.
Acknowledgments
This research was financially supported by the Saudi Food and Drug Authority (SFDA). The authors are grateful to the Executive Department of Reference Laboratories and the Research and Laboratories Sector in SFDA for their keen interest in the study and instrumental support.
Disclaimer
Conclusions reached in this article are based on the personal scientific interpretations of the authors and do not necessarily represent the opinion of SFDA.
Declaration of Competing Interest
The authors declare that they have no known competing financial interests or personal relationships that could have appeared to influence the work reported in this paper.
References
- Matrix-effect free multi-residue analysis of veterinary drugs in food samples of animal origin by nanoflow liquid chromatography high resolution mass spectrometry. Food Chem.. 2018;245:29-38.
- [Google Scholar]
- Assessing the exposure risk and impacts of pharmaceuticals in the environment on individuals and ecosystems. The Royal Society; 2013.
- Anomalous solubility behavior of several acidic drugs. ADMET DMPK. 2014;2(1):33-42.
- [Google Scholar]
- Application of non-target analysis to study the thermal transformation of malachite and leucomalachite green in brook trout and shrimp. Curr. Res. Food Sci.. 2021;4:707-715.
- [CrossRef] [Google Scholar]
- A multi-class, multi-analyte method for routine analysis of 84 veterinary drugs in poultry muscle using simple extraction and LC-MS/MS. Food Addit. Contamin.: Part A. 2013;30(6):921-939.
- [Google Scholar]
- Peer reviewed: are veterinary medicines causing environmental risks? ACS 2003 Publications
- [Google Scholar]
- Evaluation of bi-functionalized mesoporous silicas as reversed phase/cation-exchange mixed-mode sorbents for multi-residue solid phase extraction of veterinary drug residues in meat samples. Talanta. 2017;165:223-230.
- [Google Scholar]
- European Commission. (2002). Decision (2002/657/EC) of 12 August 2002 implementing council directive 96/23/EC concerning the performance of analytical methods and interpretation of results. Official Journal of the European Communities,8e36.
- European Commission. (2010). Commission Regulation (EU) 37/2010, on pharmacologically. Retrieved from https://eur-lex.europa.eu/legal-content/EN/TXT/?uri=CELEX%3A32010R0037.
- Codex Alimentarius Commission . (2018). Maximum residue limits (MRLs) and risk management recommendations (RMRs) for residues of veterinary drugs in foods.
- Determination of 105 antibiotic, anti-inflammatory, antiparasitic agents and tranquilizers by LC-MS/MS based on an acidic QuEChERS-like extraction. Food Addit. Contamin.: Part A. 2018;35(4):647-661.
- [Google Scholar]
- Analysis, fate and removal of pharmaceuticals in the water cycle. Amsterdam: Wilson & Wilsons. Elsevier; 2007. p. :427-446.
- Determination of flumequine and oxolinic acid in fortified poultry tissue using on-line dialysis and high-performance liquid chromatography with fluorescence detection. J. Chromatogr. A. 1998;799(1–2):349-354.
- [Google Scholar]
- Veterinary drug residues in meat and meat products: occurrence, detection and implications. Veter. Med. Pharma.. 2019;53
- [Google Scholar]
- Review of the pharmacodynamics of antibiotic use in animal food production. Diagn. Microbiol. Infect. Dis.. 2004;49:105-108.
- [Google Scholar]
- Matrix Effects in Ultra-High-Performance Liquid Chromatography-Tandem Mass Spectrometry Antibiotic Multi-Detection Methods in Food Products with Animal Origins. Food Anal. Methods. 2015;9(1):23-29.
- [CrossRef] [Google Scholar]
- Signal suppression/enhancement in high-performance liquid chromatography tandem mass spectrometry. Journal of Chromatography A. 2010;1217(25):3929-3937.
- [Google Scholar]
- Development of a readily applied method to quantify ractopamine residue in meat and bone meal by QuEChERS-LC–MS/MS. J. Chromatogr. B. 2016;1015:192-200.
- [Google Scholar]
- European Commission. (2021). CELEX1, 2002/657/EC: Commission Decision of 12 August 2002 implementing Council Directive 96/23/EC concerning the performance of analytical methods and the interpretation of results (Text with EEA relevance) (notified under document number C(2002) 3044). Retrieved 15 November 2021, from https://op.europa.eu/en/publication-detail/-/publication/ed928116-a955-4a84-b10a-cf7a82bad858/language-en.
- Heitzman, R. J. (1994). Veterinary drug residues. Residues in food producing animals and their products: Reference materials and methods. EUR 15127 EN
- Analytical quality assurance in veterinary drug residue analysis methods: matrix effects determination and monitoring for sulfonamides analysis. Talanta. 2015;132:443-450.
- [Google Scholar]
- Multiresidue chromatographic method for the determination of macrolide residues in muscle by high-performance liquid chromatography with UV detection. J. AOAC Int.. 1999;82(5):1046-1053.
- [Google Scholar]
- Multiresidue screening of veterinary drugs in meat, milk, egg, and fish using liquid chromatography coupled with ion trap time-of-flight mass spectrometry. Appl. Biochem. Biotechnol.. 2017;182(2):635-652.
- [Google Scholar]
- Quantitative multiresidue method for about 100 veterinary drugs in different meat matrices by sub 2-μm particulate high-performance liquid chromatography coupled to time of flight mass spectrometry. J. Chromatogr. A. 2008;1194(1):66-79.
- [Google Scholar]
- Determination of macrolide antibiotics by liquid chromatography. J. Chromatogr. A. 2001;910(2):285-290.
- [Google Scholar]
- Application of the mechanical high-pressure method combined with high-performance liquid chromatography-tandem mass spectrometry for determination of veterinary drug residues in incurred poultry and rabbit muscle tissues. J. Food Prot.. 2019;82(3):415-421.
- [Google Scholar]
- Development and validation of a multiclass method for the determination of veterinary drug residues in poultry by ultra high performance liquid chromatography–tandem mass spectrometry. Talanta. 2012;89:201-208.
- [Google Scholar]
- Magnusson, B. M., Näykki, T., Hovind, H., & Krysell, M. (2003). Handbook for calculation of measurement uncertainty in environmental laboratories . Nordtest Report
- Determination of pesticides and veterinary drug residues in food by liquid chromatography-mass spectrometry: a review. Anal. Chim. Acta. 2016;936:40-61.
- [Google Scholar]
- Development of a multi-class method for the identification and quantification of residues of antibiotics, coccidiostats and corticosteroids in milk by liquid chromatography–tandem mass spectrometry. Int. Dairy J.. 2012;22(1):78-85.
- [Google Scholar]
- Comprehensive fast multiresidue screening of 150 veterinary drugs in milk by ultra-performance liquid chromatography coupled to time of flight mass spectrometry. J. Chromatogr. B. 2009;877(23):2363-2374.
- [Google Scholar]
- Simultaneous determination of flumequine and oxolinic acid residues in aquatic products using pressurized capillary electrochromatography. Food Anal. Methods. 2014;7(9):1770-1775.
- [Google Scholar]
- Development and validation of a procedure for determination of sulfonamide residues in pasteurized milk using modified QuEChERS method and liquid chromatography/tandem mass spectrometry. J. AOAC Int.. 2012;95(5):1528-1533.
- [CrossRef] [Google Scholar]
- Multi-residue screening of veterinary drugs in egg, fish and meat using high-resolution liquid chromatography accurate mass time-of-flight mass spectrometry. J. Chromatogr. A. 2009;1216(46):8206-8216.
- [Google Scholar]
- Veterinary drug residues in meat: Concerns and rapid methods for detection. Meat Sci.. 2008;78(1–2):60-67.
- [Google Scholar]
- Effect of Organic solutions on the stability and extraction equilibrium of penicillin G. J. Chem. Eng. Data. 2010;55(8):2687-2694.
- [CrossRef] [Google Scholar]
- Rapid multi-residue and multi-class qualitative screening for veterinary drugs in foods of animal origin by UHPLC-MS/MS. Food Addit. Contamin.: Part A. 2013;30(3):443-457.
- [Google Scholar]
- Polymorphic solubility ratio of famotidine and sulfathiazole in various solvents. Cryst. Growth Des.. 2021;21(5):2868-2875.
- [Google Scholar]
- Water hardness as a photochemical parameter: tetracycline photolysis as a function of calcium concentration, magnesium concentration, and pH. Environ. Sci. Technol.. 2006;40(23):7236-7241.
- [Google Scholar]
- Quantitation of nine quinolones in poultry tissues by high-performance liquid chromatography with fluorescence detection. J. Chromatogr. A. 2000;882(1–2):63-77.
- [Google Scholar]
- Multi-class multi-residue analysis of veterinary drugs in meat using enhanced matrix removal lipid cleanup and liquid chromatography-tandem mass spectrometry. J. Chromatogr. A. 2018;1549:14-24.
- [Google Scholar]
- Rapid determination of 88 veterinary drug residues in milk using automated TurborFlow online clean-up mode coupled to liquid chromatography-tandem mass spectrometry. Talanta. 2016;148:401-411.
- [Google Scholar]
Appendix A
Supplementary material
Supplementary data to this article can be found online at https://doi.org/10.1016/j.arabjc.2022.104116.
Appendix A
Supplementary material
The following are the Supplementary data to this article:


