

Translate this page into:
Formation of ketoprofen methyl ester artifact in GC–MS analysis of basic drugs in horse urine using alkaline liquid-liquid extraction
⁎Corresponding authors. prapin.wil@mahidol.ac.th (Prapin Wilairat), rattikan.cha@mahidol.ac.th (Rattikan Chantiwas) rattikan.cha@mahidol.edu (Rattikan Chantiwas)
-
Received: ,
Accepted: ,
This article was originally published by Elsevier and was migrated to Scientific Scholar after the change of Publisher.
Peer review under responsibility of King Saud University.
Abstract
Abstract
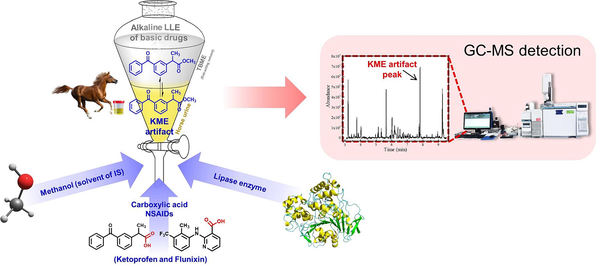
This study investigates the unexpected formation of ketoprofen methyl ester (KME) during the routine alkaline liquid–liquid extraction (LLE) process for analyzing basic drugs in horse urine samples using GC–MS analysis. An unidentified peak in the GC–MS chromatogram was observed in certain horse urine samples, identified as KME through mass spectral comparison with in situ synthesized KME. Since the KME is not a metabolite of ketoprofen present in urine, it is proposed that its formation occurs during the LLE process due to the reaction between ketoprofen contained in the urine and methanol used as the solvent of the spiked internal standard. Surprisingly, no artifact was detected when negative quality control horse urine samples (absence of ketoprofen) even when spiked with standard ketoprofen and methanol. Further investigation indicated that the presence of lipase enzymes from bacteria in specific urine samples is the key factor in the formation of the KME artifact. This hypothesis was confirmed when negative quality control horse urines were spiked with ketoprofen, methanol, and a lipase enzyme and the KME artifact was detected. Additionally, the formation of a methyl ester artifact was also detected for flunixin, a carboxylic acid NSAID drug, when negative quality control horse urines were spiked with the drug, methanol, and lipase enzyme. These findings will be valuable for scientists analyzing drugs in urine.
Keywords
Artifacts
Ketoprofen methyl ester
Horse urine
Liquid–liquid extraction
GC–MS
Drug analysis

1 Introduction
Identification of artifact formation is of concern in chemical analysis. Modern analytical procedure usually involves multiple steps which can include sampling and sample preparation before the final analysis usually performed by chromatographic instruments, i.e., gas chromatography (GC) or liquid chromatography (LC) with mass spectrometric detection. The detection of an unexpected peak in the chromatogram may signal artifact formation during any of the many steps of the analytical process. Failure to recognize these artifacts can lead to misinterpretation of the sample, e.g., affecting the number of components present in the sample (Hornbeck et al., 1993), incorrect calculation of the concentration of a component (Jones and Chalmers, 2000, Huang, 2005) or incorrect identification of a metabolite of drugs (Thevis et al., 2015).
The artifacts can occur during the liquid–liquid extraction (LLE) step when using contaminated extraction solvent (Cone et al., 1982, Miller and Boyd, 2020, Tsujikawa et al., 2020, Tsujikawa et al., 2022). Artifacts can also be formed during the derivatization step after LLE (Moffat et al., 1991, Jones and Chalmers, 2000, Huang, 2005), or even from pyrolysis in the GC liner (Hornbeck et al., 1993, Holowinski et al., 2022, Dawidowicz et al., 2023). Previous studies, as listed in Table 1, have reported artifact formation during LLE or derivatization using gas chromatography-mass spectrometry (GC–MS) analysis. However, when detected and identified they can usually be eliminated by suitable modification of the procedure or recognized as arising from the method of analysis. Identity of artifact Preservatives and chloroform exposure to air Rate of artifact conversion Concentration of nitrogen containing drugs Type of nitrogen-containing drugs Method for removal of artifact Phosgene reacts with nitrogen-containing drugs to produce carbamoyl chlorides. Traces of phosgene react with ethanol to give ethyl chloroformate which, in turn, reacts with the nitrogen-containing drugs to produce ethyl carbamates. Identity of artifact Effect of BHT, benzene and water Identity of artifact Concentrations of PS or EP Derivatization condition GC conditions Derivatization of PS and EP with CB, HFB and TFAP. Thermal conversion of PS or EP to methamphetamine in high temperature of the injector (300 °C). Identity of artifact Different extraction methods Buffer concentration Amount of NaBPr4 Amount of triethyltin Influence of artifact on quantification Identity of artifact Concentration of acetaldehyde Temperature of GC injector Washing ethyl acetate Ratio of acetaldehyde and ephedrines High concentration methamphetamine Identity of artifact GC injector temperature Type of extracting solvents Identity of artifact GC injector temperature Type of extracting solvents Cannabidiol transformation in the GC injector when trichloroacetic acid is used as a protein precipitation agent. The appearance of dichloroacetic esters of Δ8-THC and Δ9-THC among CBD transformation products is probably the result of the thermal decomposition of their trichloroacetic esters in the GC injector. Identity of artifact Percent formation of artifact Role of methanol and lipase enzyme Artifact formation of flunixin (other NSAIDs) BHT: Butylated hydroxytoluene (2,6-Di-tert-butyl-4-methylphenol); PS: Pseudoephedrine; EP: Ephedrine; CB: 4-carbethoxyhexafluorobutyryl chloride; HFB: Heptafluorobutyric anhydride; TFAP: N-trifluoroacetyl-l-prolylchloride; TMS: trimethylsilyl; HMG: 3-Hydroxy-3-methylglutaric acid; 3-HIVA: 3-hydroxyisovaleric acid; BSTFA: N,O-bis-trimethylsilyltrifluoroacetamide; NaBPr4: Sodium tetra(n-propyl)borate; DPO: 3,4-dimethyl-5-phenyloxazolidine; TPO: 2,3,4-trimethyl-5-phenyloxazolidine; Δ9-THC: delta-9-tetrahydrocannabinol; Δ8-THC: delta-8-tetrahydrocannabinol.
Study no.
Artifact (analyte)
Sample and its preparation
Variables studied
Cause of artifact formation
Ref.
1
Carbamoyl chlorides and ethyl carbamates (Nitrogen containing drugs)
Sample: Aqueous solution of nitrogen-containing drugs
LLE: Solvent: chloroform contaminated phosgene, chloroform stabilized with ethanol and sample pH adjusted: pH 9.5
Cone et al. (1982)
2
BHT derivativea
(Fatty acid)
Sample: Fish oils, food products and pathological samples
Saponification of lipid extraction: Reagent: methanolic NaOH, BHT, anti-bumping granules and benzene
Derivatization of free fatty acid: Reagent: BF3 in methanol
LLE of methyl ester: Solvent: hexane
BHT was derivatized by BF3.
Moffat et al. (1991)
3
Methamphetamine (PS and EP)
Sample: Urine or water containing high levels of PS or EP
LLE: Solvent: methylene chloride and 1-chlorobutane with 1 N NaOH
Derivatization: Reagent: CB, HFB and TFAP
Hornbeck et al. (1993)
4
di-TMS, tri-TMS derivatives of HMG, mono-TMS and di-TMS derivatives of 3-HIVA (Organic acid)
Sample: Urine of patients with HMG
LLE: Solvent: ethyl acetate, sample pH adjusted: pH 1, salt: solid NaCl and IS: n-Tetracosane and n-hexacosane
Derivatization: Reagent: BSTFA
Incomplete derivatization of HMG.
Jones and Chalmers (2000)
5
Methyl mercury and ethyl mercury (Methyl mercury and ethyl mercury)
Sample: Environmental samples
LLE: Solvent: cyclopentane, sample pH adjusted: pH 4 and IS: triethyltin
Derivatization: Reagent: NaBPr4
Hg(II) reacted with NaBPr4
Huang (2005)
6
Isocyanate and urea artifactsb (Amphetamine-type substances)
Sample: Aqueous solution of amphetamine-type substances
LLE: Solvent: phosgene-contaminated chloroform and sample pH adjusted: pH 14Identity of artifacts
Phosgene reacts with amphetamine-type substances.
Miller and Boyd (2020)
7
DPO (Ephedrines)
Sample: Ephedrines in basic aqueous solution
LLE: Solvent: chloroformStorage of chloroform (stored after opening the bottle, stored without opening the bottle)
Phosgene in deteriorated chloroform reacted with ephedrines
Tsujikawa et al. (2020)
8
DPO and TPO (Ephedrines)
Sample: Ephedrines in basic aqueous solution of
LLE: Solvent: ethyl acetate contaminated with formaldehyde and acetaldehyde
Aldehydes reacted with ephedrines
Tsujikawa et al. (2022)
9
Trifluoroacetic ester of Δ8-THC and Δ9-THC (Cannabidiol)
Sample: Blood and plasma
Protein precipitation: Reagent: trifluoroacetic acid
LLE of supernatants: Solvent: acetonitrile or dichloromethane or ethyl acetate or hexane
Cannabidiol transformation in the GC injector when trifluoroacetic acid is used as a protein precipitation agent.
Holowinski et al. (2022)
10
Trichloroacetic and dichloroacetic ester of Δ8-THC and Δ9-THC (Cannabidiol)
Sample: Blood and plasma
Protein precipitation: Reagent: trichloroacetic acid
LLE of supernatants: Solvent: acetonitrile or dichloromethane or ethyl acetate or hexane
Dawidowicz et al. (2023)
11
Ketoprofen methyl ester (Basic drugs)
Sample: Horse urine containing a high concentration of ketoprofen
LLE: Solvent: TBME, sample pH adjusted: pH > 10 and IS: diphenylamine dissolved in methanol
Lipase enzyme-catalyzed reaction of ketoprofen in horse urine with methanol from the internal standard.
This work
In the context of analyzing basic drugs in horse urine by alkaline LLE with GC–MS detection (Yi et al., 2013, Guo et al., 2015, Wang et al., 2015, Wozniak et al., 2018), an unidentified peak, tentatively identified as ketoprofen methyl ester (KME) through comparison with a mass spectral library, was observed in certain urine samples. Notably given that previous studies (Benoit et al., 1992, Sams et al., 1995, Alkatheeri et al., 1999a, 1999b) have established that KME is not a metabolite of ketoprofen excreted in horse urine, the unexpected appearance of this artifact, which has not been previously reported (see Table 1), requires investigation of its formation. It should be added that other metabolites of ketoprofen have been detected in equine urine (Knych et al., 2023). It is hypothesized that the formation of the KME artifact arises from the reaction between ketoprofen, present in horse urine, and the methanol used as the solvent for the internal standard (IS, diphenylamine) added to the urine samples. Additionally, it was found that the KME artifact's formation also requires the presence of a lipase enzyme in the urine.
2 Material and methods
2.1 Chemicals and reagents
Ketoprofen (purity ≥ 98.0 %, AR grade), flunixin (purity ≥ 98.0 %, AR grade), flufenamic acid (purity 97.0 %, AR grade), diphenylamine (purity ≥ 98.5 %, GC grade), lipase from Candida rugosa (specific activity ≥ 700 U/mg) and Novozym 435 (lipase from Candida antarctica immobilized on acrylic resin, specific activity ≥ 5000 U/g) were from Sigma-Aldrich (St. Louis, MO, USA). Methyl iodide (purity ≥ 99.0 %, GC grade), acetone (purity ≥ 99.8 %, HPLC grade), potassium hydroxide (purity ≥ 85.0 %, AR grade), and anhydrous sodium sulfate (purity ≥ 99.0 %, AR grade) were supplied by Merck (Darmstadt, Germany). Methanol (purity 99.9 %, HPLC grade) was from Scharlau Chemie (Barcelona, Spain). Dimethyl sulfoxide (DMSO) (purity 99.9 %, AR grade), hydrochloric acid 37 % (AR grade), and tert-butyl methyl ether (TBME) (purity 99.8 %, HPLC grade) were from RCI Labscan (Bangkok, Thailand). Sodium phosphate dibasic heptahydrate (purity ≥ 98.0 %, ACS grade salts) and sodium phosphate monobasic monohydrate (purity ≥ 98.0 %, ACS grade salts) were from Honeywell (Seelze, Germany). Normal saline solution (sodium chloride 0.9 % w/v) was supplied by A.N.B Laboratories (Bangkok, Thailand). Ultrapure water (18.0 MΩ·cm) was produced from the Milli-Q Advantage A10 water purifying system (Merck, Darmstadt, Germany).
2.2 GC–MS instrument and operation
The GC–MS instrument was an Agilent 6890 gas chromatograph with a 7683 automatic sample injector coupled to a 5973 quadrupole mass spectrometer (Agilent Technologies, Palo Alto, CA, USA).
The GC column was a 5 % phenylmethylpolysiloxane (HP-5 Ultra I, 30 m × 0.25 mm i.d. × 0.25 µm film thickness) from Agilent Technologies (Palo Alto, CA, USA). Helium (99.999 % purity) was used as the carrier gas at a constant flow rate of 1.0 mL min−1. The injection port temperature was 280 °C. The GC temperature program was as follows: initial 90 °C, hold 0.13 min, increasing to 300 °C at 25 °C min−1, with a final hold time of 1.00 min. The total chromatographic time was 9.53 min. The sample injection volume was 2.0 µL with a split ratio of 10:1 and electron ionization (EI) at 70 eV. The temperature of the transfer line and the ion volume were set at 280 °C and 250 °C, respectively.
The mass spectrometer was operated in full scan mode from m/z 40 to 400. The solvent delay time was 3.00 min. The quantitation and diagnostic ions (percent relative abundance in parenthesis) for each compound are as follows: KME: m/z 209 (100), m/z 105 (83.1) and m/z 268 (35.3, molecular ion); flunixin methyl ester: m/z 295 (100), m/z 263 (79.1) and m/z 310 (33.4; molecular ion); diphenylamine (IS): m/z 169; and flufenamic methyl ester (IS) m/z 263. Quantification employed the peak area ratio of the base peak of the target compound to the base peak of the appropriate IS.
2.3 Preparation of standard solutions
Each stock standard solution of diphenylamine (10 mg mL−1), flufenamic acid (10 mg mL−1), ketoprofen (20 mg mL−1), and flunixin (20 mg mL−1) was prepared by adding the appropriate amount of each compound in 5.0 mL volumetric flask and making to volume with methanol or DMSO. The stock solutions were kept at 4 °C until needed. Working standard solutions of diphenylamine (0.25 mg mL−1), flufenamic acid (0.25 and 2.5 mg mL−1), ketoprofen (0.05, 0.5, and 5 mg mL−1), and flunixin (0.5 mg mL−1) were prepared daily by diluting the stock standard solutions with methanol or DMSO.
Phosphate buffer (25.0 mM, pH 7.0) was prepared from sodium phosphate dibasic heptahydrate and sodium phosphate monobasic monohydrate. Enzyme suspension of lipase from Candida rugosa (25 mg mL−1) was prepared freshly by adding the appropriate amount of enzyme in a 5.0 mL volumetric flask and making it to volume with the phosphate buffer solution.
2.4 Horse urine samples
Horse urine samples, designated for disposal, were obtained from the National Doping Control Center (NDCC), Analytical Sciences, and National Doping Test Institute, Mahidol University. The use of horse urine samples was reviewed and approved by the Institutional Animal Care and Use Committee of Mahidol University, Faculty of Science (MUSC-IACUC), Bangkok, Thailand (Approval No. MUSC63-036-544). All experiments were performed following the guidelines and regulations of MUSC-IACUC.
The horse urine samples, including those with KME artifact peaks, and the negative quality control horse urine samples were analyzed for basic drugs at the NDCC using the procedure described in Section 2.5. Additionally, the negative quality control horse urine underwent further analysis, as described in Section 2.6, to confirm the absence of ketoprofen. After centrifugation (Allegra X-22R, Beckman Coulter, USA) at 4000 rpm for 30 min, the supernatants were collected and stored at −20 °C. Samples were thawed at room temperature before analysis.
2.5 Procedure for alkaline LLE for basic drugs in horse urine
The alkaline LLE method for basic drugs (e.g., nicotine, caffeine, amphetamine, and methamphetamine) producing the KME artifact is described in this section with the GC–MS method described in Section 2.2. This method is employed for the artifact formation of KME and flunixin methyl ester.
Aliquots of 5.0 mL horse urine samples were pipetted into 10 mL screw-cap glass test tubes and 20 µL of the IS (0.25 mg mL-1 diphenylamine in methanol) was added to each tube. The samples were adjusted to a basic condition (pH > 10) with the addition of 200 µL of 5 M potassium hydroxide. Then, 3 g of anhydrous sodium sulfate was added to each tube as the salting-out agent, followed by 2.0 mL of the TBME extracting solvent. The tubes were screwed tight and shaken horizontally on a shaker (GFL 3006, Burgwedel, Germany) at 300 rpm for 15 min. After centrifugation for 10 min at 1800 rpm to obtain a clear separation of the two phases, the upper organic layer was pipetted into a new test tube and evaporated to dryness under a nitrogen stream at room temperature. The residue was reconstituted with 200 μL of TBME, and 2 μL of the sample was injected into the GC–MS instrument (see Section 2.2).
2.6 Determination of ketoprofen in horse urine by GC–MS
Determination of ketoprofen in horse urine by GC–MS involved an acidic liquid–liquid extraction (LLE) and methylation of the extracted ketoprofen to produce the methyl ketoprofen ester (KME) for analysis by GC–MS. The procedure followed a previously reported method (González et al., 1996) with a modification in the heating time of the methylation step.
A 1.0 mL aliquot of a horse urine sample (or spiked negative quality control horse urine) was pipetted into a 10 mL screw-cap glass test tube and 20 µL of IS (2.5 mg mL−1 flufenamic acid in methanol) was added. The urine was acidified (pH 2–3) by adding 200 µL of 1 M hydrochloric acid, followed by ca. 0.6 g of anhydrous sodium sulfate as the salting-out agent. Then, a 2.0 mL aliquot of TBME was added, and the tube was screwed tight. The tube was shaken horizontally on a shaker at 300 rpm for 15 min. After centrifugation for 10 min at 1800 rpm, the upper TBME layer was separated and evaporated to dryness under a nitrogen stream at room temperature.
The dry residue was dissolved in 1500 μL of acetone. Methylation was performed by pipetting 150 μL of the acetone solution into a clean 10 mL screw-cap glass test tube and adding 50 μL of methyl iodide and 50 mg of anhydrous potassium carbonate. The tube was screwed tight and heated in a heating block (HGT-2, Tianjin Hengao, China) at 60 °C for 30 min. After cooling to room temperature, 2 µL of the solution was injected into the GC–MS instrument for analysis (see Section 2.2).
For calibration, standard ketoprofen was added to 1.0 mL of negative quality control horse urines to give final concentrations of 1, 5, 10, 100, and 500 mg L−1. The spiked urine samples were analyzed in triplicates as described above. The calibration curve was constructed from the plot of peak area ratios of the quantitation ions of KME and flufenamic acid methyl ester (IS) against the spiked concentrations of ketoprofen. A typical linear equation is y = (0.0246 ± 0.0005)x – (0.12 ± 0.12), with a coefficient of determinations (r2) of 0.9986, where y is the area ratio and x is the concentration of the added ketoprofen.
2.7 In situ synthesis of methyl esters of ketoprofen and flunixin
A 20 µL aliquot of 0.5 mg mL−1 standard ketoprofen or flunixin was added to a 10 mL screw-cap glass test tube together with 20 µL of 0.25 mg mL−1 flufenamic acid as the IS. The solution was dried under nitrogen at room temperature and the residue dissolved in 150 µL of acetone and derivatized as described in Section 2.6. The methyl esters of ketoprofen and flunixin synthesized by this method were used for mass spectral identification of the artifact peaks.
2.8 Determination of percent formation of ketoprofen methyl ester artifact
The method requires two parallel procedures to be carried out for the same urine sample: one is the basic extraction and detection of the KME artifact (Section 2.5), and the other is the acidic extraction and analysis of ketoprofen as its KME derivative (Section 2.6). Since the same compound is measured, the percent formation of artifact KME is conveniently found from the ratio of the peak areas ratios determined from the two procedures. However, to correctly compare the peak areas of the GC–MS chromatograms of two different sample preparations from the same urine, the same amount of the same internal standard (diphenylamine) must be present in the two solutions injected into the GC–MS instrument. Therefore, some steps in the two procedures are modified as described below. Complete details of the two modified procedures are given in Supplementary Material A.
In the alkaline LLE procedure (Section 2.5), 20 µL of only pure methanol was added to the horse urine sample in the extraction and drying steps. The final dry residue is reconstituted with 200 µL of TBME and 20.0 µL of 0.25 mg mL−1 diphenylamine (IS), dissolved in methanol. The volume of the solution for injection into the GC is 220 µL and contains 5 µg of diphenylamine (IS).
In the acidic LLE procedure (Section 2.6), after the final methylation step 20.0 µL of 0.25 mg mL−1 diphenylamine, dissolved in methanol, was added to the 200 µL of the methylation solution (cooled to room temperature). The volume of the solution for injecting into the GC is 220 µL and contains 5 µg of diphenylamine (IS).
Moreover, different volumes of horse urine are used in the two procedures, i.e., 5.0 mL for the alkaline LLE procedure and 1.0 mL for the acidic LLE step. In addition, only one-tenth of the latter acidic LLE is employed for derivatization. Therefore, the GC–MS peak area ratio from the acidic LLE process must be multiplied by a factor of 50.
The percent formation of KME is thus given by the following equation.
2.9 Study of role of lipase in formation of KME artifact
2.9.1 Analysis of negative quality control urines spiked with ketoprofen
Aliquots of 5.0 mL of three negative quality control horse urines were spiked with ketoprofen (dissolved in DMSO), to give final concentrations of 70, 200, and 300 mg L−1, respectively. Extraction and analysis were carried out as described in Section 2.5 for the alkaline liquid–liquid extraction procedure.
2.9.2 Analysis of negative quality control urines spiked with ketoprofen and lipase enzymes
Two lipase enzymes, namely, lipase from Candida rugosa (E1) and lipase from Candida antarctica immobilized on acrylic resin (Novozyme 435; E2), were employed. Enzyme suspension of lipase enzyme E1 (25 mg mL−1) was prepared in 25 mM phosphate buffer pH 7.0 and 200 µL of the preparation was added to 5.0 mL of a negative quality control horse urine sample and normal saline solution. Similarly, 10 mg of lipase enzyme E2 was added to 5.0 mL negative quality control horse urine and normal saline solution.
The batch of negative quality control horse urine samples and saline solutions were analyzed as described in Section 2.5. The batch composition was: (a) negative quality control horse urine or saline solution spiked with ketoprofen, dissolved in DMSO at 200 mg L−1; (b) negative quality control horse urine or saline solution with lipase enzyme E1 or lipase enzyme E2 and spiked with ketoprofen at 200 mg L−1. The methanol was again from the addition of the solution of diphenylamine (IS). The samples were analyzed in duplicates.
2.10 Analysis of formation of methyl ester artifact of flunixin
A 5.0 mL aliquot of negative quality control horse urine, spiked with flunixin (prepared in DMSO) at the concentration of 200 mg L−1 and 20 µL of 0.25 mg mL−1 diphenylamine (IS) in methanol, was extracted in alkaline condition with TBME and analyzed as described in Section 2.5. Analyses were carried out in duplicates.
A 5.0 mL aliquot of the same negative quality control horse urine, spiked with flunixin and IS, as described above, but with the addition of 10 mg of lipase enzyme E2 (see Section 2.9.2) was extracted in alkaline condition with TBME and analyzed as described in Section 2.5. Analyses were carried out in duplicates.
3 Results and discussion
3.1 Identification and source of artifact peak formation
Fig. 1(A) displays an example of the total ion chromatogram (TIC) for an alkaline liquid–liquid extract of horse urine, featuring an artifact peak at 7.82 min. The diphenylamine (IS) peak appears at 5.65 min. The provisional identification of the artifact peak as KME was based on mass spectral library matching (see Fig. 1(B)(a) and 1(B)(b)). The identity of the KME artifact was confirmed by mass spectral comparison with an in situ synthesized KME from standard ketoprofen (see Section 2.7 and Fig. 1B(c)) using three diagnostic ions and their percent relative abundance as described in Section 2.2. The identification criteria followed the World Anti-Doping Agency (WADA) Technical Document TD2023IDCR (WADA, 2023). The retention time (RT) of the in situ synthesized KME was also at 7.82 min (chromatogram not shown).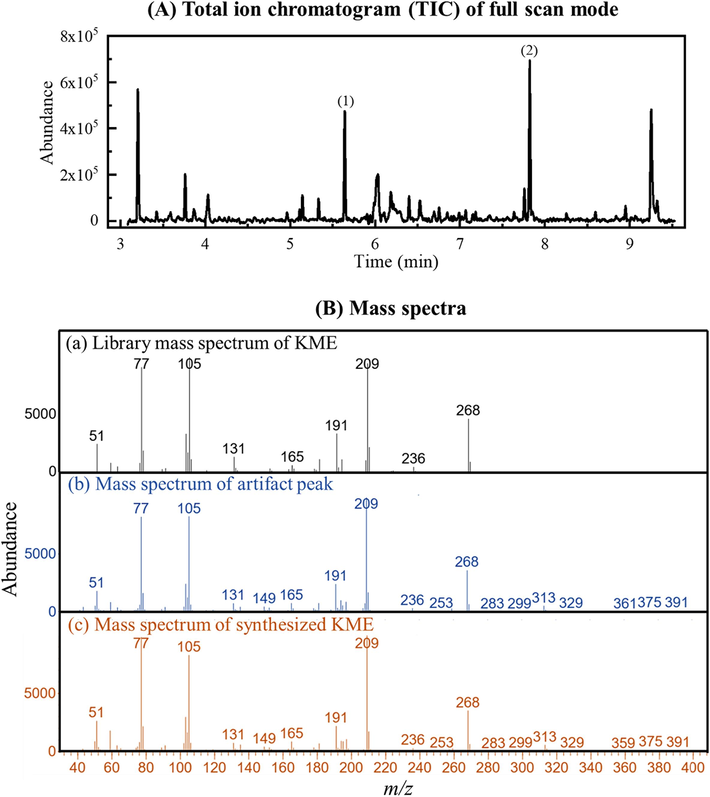
(A) Example of a total ion chromatogram of full scan mode (m/z range 40 – 400) of TBME extract of alkaline horse urine with the artifact peak. Peak identification: (1) diphenylamine (IS), RT = 5.65 min and (2) artifact peak, RT = 7.82 min. (B) Mass spectra of (a) library matched mass spectrum of KME, (b) mass spectrum of artifact peak at RT = 7.82 min, and (c) mass spectrum of synthesized KME at RT = 7.82 min.
Table 2 presents the calculated values of the percent formation of the KME artifact, determined following the procedure described in Section 2.8. A correlation is observed between the amount of the KME artifact with the amount of ketoprofen in the horse urine, i.e., the higher the amount of ketoprofen, the greater the percentage of KME artifact formation. The percent formation of the artifact is very small (<0.5 % of ketoprofen in the urine). The concentrations of ketoprofen in urine Sample 1, Sample 2, and Sample 3 are 70 ± 2, 220 ± 14, and 350 ± 7 mg L−1 respectively.
Horse urine sample
Concentration ± SD (mg L−1) (n = 3)
Peak area ratio of KME ± SD
Percent formation* ± SD
Alkaline LLE
Acidic LLE
Sample 1
70 ± 2
0.026 ± 0.002
0.99 ± 0.05
0.053 ± 0.004
Sample 2
220 ± 14
0.35 ± 0.03
4.1 ± 0.7
0.17 ± 0.04
Sample 3
350 ± 7
0.85 ± 0.08
5.74 ± 0.08
0.30 ± 0.03
The reagent for methyl ester formation was identified as methanol, coming from the solvent of the internal standard solution spiked into the urine sample. This was confirmed by conducting an experiment where diphenylamine dissolved in DMSO was added to a horse urine sample that exhibited the KME artifact. The resulting sample underwent extraction and analysis using the procedure outlined for KME artifact formation (Section 2.5), conducted in triplicates. Fig. 2 shows the absence of a KME peak when methanol was excluded, conclusively confirming methanol as the source of methylation.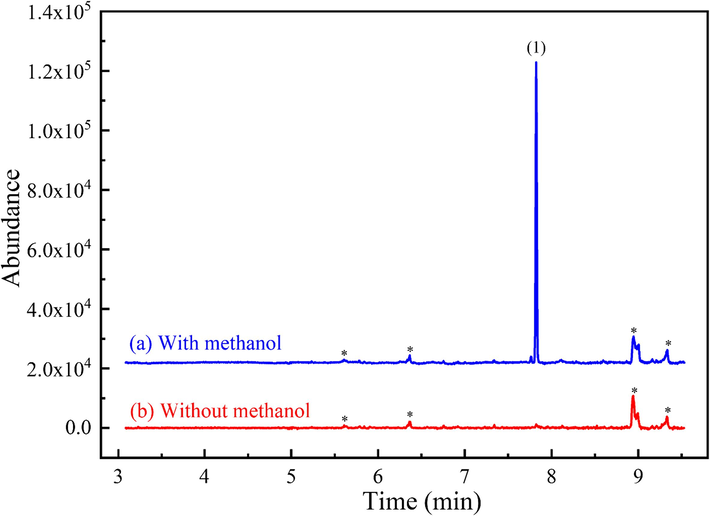
Extracted-ion chromatograms of m/z 209 (KME) from full scan GC–MS (m/z range: 40–400) of TBME extracts of alkaline horse urine having an artifact peak: (a) with methanol and (b) without methanol (DMSO used as solvent of IS). The concentration of ketoprofen is 218 mg L−1. Peak identification: (1) KME artifact, RT = 7.82 min; * unidentified peak.
3.2 Role of lipase enzyme in artifact formation
Unexpectedly, no KME was produced when standard ketoprofen and the internal standard (IS) solution were added to three negative control urine samples (refer to Section 2.9.1). Fig. 3 shows the chromatogram of sample (H0), a horse urine sample spiked with 200 mg L−1 ketoprofen, revealing the absence of the KME artifact. A similar outcome was observed when normal saline solution was substituted for horse urine (see Fig. 3, chromatogram S0). Normal saline solution (sodium chloride 0.9 % w/v) is commonly employed as a surrogate blank sample, given that urine contains a substantial amount of sodium chloride (Choe and Gajek, 2016, Zahoor et al., 2019). Consequently, it is evident that some other factor present in select horse urine samples is required for the formation of the small quantity of the KME artifact during the alkaline liquid–liquid extraction (LLE) step.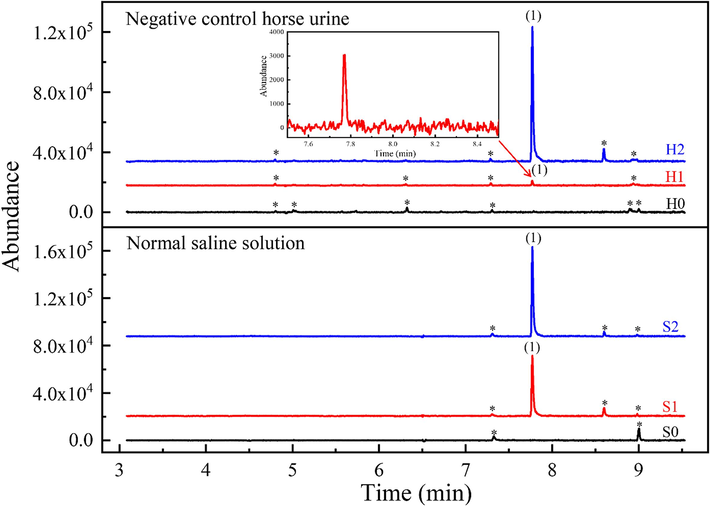
Extracted-ion chromatograms of m/z 209 (KME) from full scan GC–MS (m/z range: 40–400) of negative quality control horse urine (H) and normal saline solution (S) spiked with ketoprofen at 200 mg L−1 and 0.4 % v/v methanol: H0: no lipase enzyme added; H1: lipase enzyme E1 added; H2: lipase enzyme E2 added; S0: no lipase enzyme added; S1: lipase enzyme E1 added; S2: lipase enzyme E2 added. The sample volume is 5.0 mL with 20 µL of diphenylamine (0.25 mg mL−1 dissolved in methanol) added. Peak identification: (1) KME artifact, RT = 7.82 min; * unidentified peak.
It has been well documented that samples of human urine contaminated with certain bacteria can result in the formation of derivatives of endogenous steroids in the urine due to enzymes produced by the bacteria (De La Torre et al., 2001, Bredehöft et al., 2012, Kuuranne et al., 2014, Schweizer Grundisch et al., 2014, Lioudakis et al., 2018). Thus, the presence of bacteria in some samples of horse urine should also be a factor in the KME artifact formation. Bacteria commonly isolated from horses with urinary tract infections (UTI) include Escherichia coli, Proteus, Klebsiella, Enterobacter, Corynebacterium, Streptococcus, Staphylococcus, and Pseudomonas (Frye, 2006). Notably, some of these bacteria, such as Staphylococcus, are known to produce lipase enzymes (Gupta et al., 2004). Moreover, lipase enzymes have been identified in the urine of other animals, such as bovine urine (Kumar, 2013). It is noted that lipase enzymes are widely employed as biocatalysts for converting carboxylic acids to esters in the presence of alcohol under basic conditions (Park et al., 1999; Carvalho et al., 2006; Stergiou et al., 2013).
Lipase enzymes were added to negative quality control horse urine spiked with ketoprofen and the IS solution, as well as to normal saline solutions spiked similarly to the negative control urine (refer to Section 2.9.2). Extracted-ion chromatograms for m/z 209 (KME) for the samples are shown in Fig. 3. The peak area ratios of KME to diphenylamine (IS) for negative quality control horse urine (H0), negative quality control horse urine spiked with lipase enzyme E1 (H1), and negative quality control horse urine spiked with lipase enzyme E2 (H2) are (0.0 ± 0.0), (0.011 ± 0.008), and (0.5 ± 0.2), respectively. The peak area ratios for saline solution (S0), saline solution spiked with lipase enzyme E1 (S1). Similarly, the peak area ratios for saline solution (S0), saline solution spiked with lipase enzyme E1 (S1), and saline solution spiked with lipase enzyme E2 (S2) are (0.0 ± 0.0), (0.3 ± 0.2), and (0.45 ± 0.05), respectively. These chromatograms confirm that a lipase enzyme is necessary for KME artifact formation, thereby supporting the hypothesis that bacterial contamination is a key factor in KME artifact formation in horse urine. The notable variability in lipase-catalyzed KME formation may be attributed to the efficiency variability of the enzyme (Stergiou et al., 2013) and/or the use of the continuous liquid extraction process.
3.3 Methyl ester artifact formation by acidic NSAIDs
The artifact formation of methyl ester during alkaline LLE of horse urine may not be limited to ketoprofen but could possibly be produced by other carboxylic acid NSAID at sufficiently high concentration and with bacterial contamination. A study (see Section 2.10) was conducted using flunixin, a commonly employed NSAID in the treatment of horses (Kuroda et al., 2022).
As shown in Fig. 4, a negative quality control horse urine spiked with flunixin exhibited a peak for flunixin methyl ester only when a lipase enzyme was added. Tentative identification of the flunixin methyl ester was achieved through mass spectral library matching (refer to Fig. S1(a) and (b) in Supplementary Material B). The confirmation of the flunixin methyl ester artifact's identity was established through mass spectral comparison with in-situ synthesized flunixin methyl ester, employing three diagnostic ions and their respective percent relative abundance, as detailed in Section 2.7. The retention time (RT) for in-situ synthesized flunixin methyl ester was observed at 7.36 min (chromatogram not shown).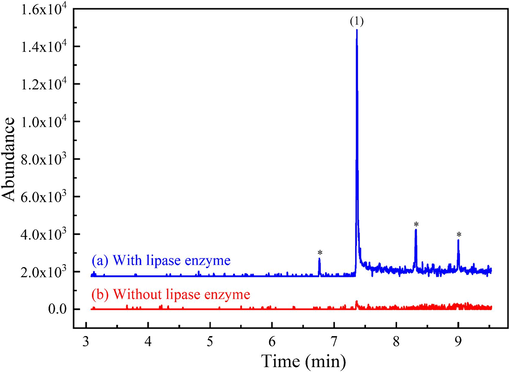
Extracted-ion chromatograms of m/z 295 (flunixin methyl ester) from full scan GC–MS (m/z range: 40–400) of alkaline LLE of negative quality control horse urine spiked with flunixin at 200 mg L−1 and 0.4 % v/v methanol: (a) with lipase enzyme E2 added and (b) without lipase enzyme E2. Peak identification: (1) flunixin methyl ester artifact, RT = 7.36 min; * (unidentified peaks).
4 Conclusion
The occasional detection of an unknown peak in the GC–MS analysis of horse urines for basic drugs using LLE in alkaline conditions was identified as ketoprofen methyl ester by mass spectral comparison with the compound synthesized in situ from standard ketoprofen. The methanol used as the solvent of the diphenylamine (IS) was verified to be the source of the alcohol for the methyl ester artifact formation. The percentage of the KME produced was very low, <0.5 % of ketoprofen in the urine.
Surprisingly, negative quality control horse urines spiked with ketoprofen at levels found in urine samples producing the KME artifact, along with the IS solution, did not exhibit the artifact peak. It was discovered that an enzyme from bacterial contamination was necessary to catalyze the methyl ester formation. This was confirmed by introducing lipase enzymes to the same spiked negative quality control horse urines, resulting in the formation of the KME artifact. Additionally, flunixin, a carboxylic acid NSAID, was found to produce the methyl ester artifact when negative quality control horse urine was spiked with standard flunixin, methanol, and lipase enzymes.
This study is an example of the numerous factors that must be considered in the search for the source of an unexpected chromatographic peak in chemical analysis.
CRediT authorship contribution statement
Chaksawat Sangawitayakorn: Methodology, Validation, Investigation, Writing – original draft, Writing – review & editing. Pirom Chenprakhon: Supervision. Prapin Wilairat: Methodology, Supervision, Writing – original draft, Writing – review & editing. Rattikan Chantiwas: Supervision, Project administration, Funding acquisition, Writing – original draft, Writing – review & editing.
Acknowledgments
The English of this manuscript has been checked by Grammarly. This work is supported by Mahidol University (Strategic Research Fund): fiscal year 2024. The Science Achievement Scholarship of Thailand (SAST) is gratefully acknowledged for scholarships to CS. The Center of Excellence for Innovation in Chemistry (PERCH-CIC), Ministry of Higher Education, Science, Research and Innovation is gratefully acknowledged for support. The authors would like to thank the support of equipment from the Central Instrument Facility (CIF) grant, Faculty of Science, Mahidol University. The authors would also like to thank Ms. Apinya Obma (PhD student, Department of Chemistry, Faculty of Science, Mahidol University) for drawing the graphical abstract.
Declaration of competing interest
The authors declare that they have no known competing financial interests or personal relationships that could have appeared to influence the work reported in this paper.
References
- Identification and confirmation of 3-hydroxy metabolite of ketoprofen in camels by gas chromatography–mass spectrometry and nuclear magnetic resonance spectroscopy. J. Chromatogr. B. 1999;732:299-306.
- [CrossRef] [Google Scholar]
- Pharmacokinetics and metabolism of ketoprofen after intravenous and intramuscular administration in camels. J. Vet. Pharmacol. Ther.. 1999;22:127-135.
- [CrossRef] [Google Scholar]
- Identification of a benzhydrolic metabolite of ketoprofen in horses by gas chromatography—mass spectrometry and high-performance liquid chromatography. J. Chromatogr. B. 1992;583:167-173.
- [CrossRef] [Google Scholar]
- Investigations of the microbial transformation of cortisol to prednisolone in urine samples. J. Steroid Biochem. Mol. Biol.. 2012;129:54-60.
- [CrossRef] [Google Scholar]
- Enzymatic resolution of (R, S)-ibuprofen and (R, S)-ketoprofen by microbial lipases from native and commercial sources. Braz. J. Microbiol.. 2006;37:329-337.
- [CrossRef] [Google Scholar]
- Determination of trace elements in human urine by ICP-MS using sodium chloride as a matrix-matching component in calibration. Anal. Methods. 2016;8:6754-6763.
- [CrossRef] [Google Scholar]
- Analytical controls in drug metabolic studies. II. Artifact formation during chloroform extraction of drugs and metabolites with amine substituents. Drug Metab. Dispos.. 1982;10:561-567.
- [Google Scholar]
- Unexpected formation of dichloroacetic and trichloroacetic artefacts in gas chromatograph injector during Cannabidiol analysis. J. Pharm. Biomed. Anal.. 2023;230:115388
- [CrossRef] [Google Scholar]
- Changes in androgenic steroid profile due to urine contamination by microorganisms: a prospective study in the context of doping control. Anal. Biochem.. 2001;289:116-123.
- [CrossRef] [Google Scholar]
- Pathophysiology, diagnosis, and management of urinary tract infection in horses. Vet. Clin. Equine Pract.. 2006;22:497-517.
- [CrossRef] [Google Scholar]
- Detection of non-steroidal anti-inflammatory drugs in equine plasma and urine by gas chromatography-mass spectrometry. J. Chromatogr. A. 1996;719:251-264.
- [CrossRef] [Google Scholar]
- Simple and rapid analysis of four amphetamines in human whole blood and urine using liquid-liquid extraction without evaporation/derivatization and gas chromatography-mass spectrometry. Forensic Toxicol.. 2015;33:104-111.
- [CrossRef] [Google Scholar]
- Bacterial lipases: an overview of production, purification and biochemical properties. Appl. Microbiol. Biotechnol.. 2004;64:763-781.
- [CrossRef] [Google Scholar]
- Formation of trifluoroacetic artefacts in gas chromatograph injector during Cannabidiol analysis. J. Chromatogr. A. 2022;1671:463020
- [CrossRef] [Google Scholar]
- Detection of a GC/MS artifact peak as methamphetamine. J Anal Toxicol.. 1993;17:257-263.
- [CrossRef] [Google Scholar]
- Artifact formation of methyl-and ethyl-mercury compounds from inorganic mercury during derivatization using sodium tetra (n-propyl) borate. Anal. Chim. Acta. 2005;532:113-120.
- [CrossRef] [Google Scholar]
- Artefacts in organic acid analysis: occurrence and origin of partially trimethylsilylated 3-hydroxy-3-methyl carboxylic acids. Clin. Chim. Acta. 2000;300:203-212.
- [CrossRef] [Google Scholar]
- Ketoprofen in horses: Metabolism, pharmacokinetics, and effects on inflammatory biomarkers. Drug Test. Anal. 2023:1-14.
- [CrossRef] [Google Scholar]
- Analysis of cow’s urine for detection of lipase activity and anti-microbial properties. J. Pharm. Biol. Sci.. 2013;7:01-08.
- [CrossRef] [Google Scholar]
- Medication control of flunixin in racing horses: Possible detection times using Monte Carlo simulations. Equine Vet. J.. 2022;54:979-988.
- [CrossRef] [Google Scholar]
- Confounding factors and genetic polymorphism in the evaluation of individual steroid profiling. Br. J. Sports Med.. 2014;48:848-855.
- [CrossRef] [Google Scholar]
- The kinetics of ethanol markers and the impact on steroid profile upon bacterial contamination of urine doping control samples with E. coli. J. Biomed Pharm. Sci.. 2018;1:2.
- [Google Scholar]
- The synthesis and identification of previously unreported artefacts formed during phosgene-contaminated chloroform extraction of amphetamine-type substances. Forensic Chem.. 2020;20:100272
- [CrossRef] [Google Scholar]
- The production of artifacts during preparation of fatty acid methyl esters from fish oils, food products and pathological samples. J. High Resolut. Chromatogr.. 1991;14:322-326.
- [CrossRef] [Google Scholar]
- Production of optically active ketoprofen by direct enzymatic esterification. J. Biosci. Bioeng.. 1999;87:545-547.
- [CrossRef] [Google Scholar]
- Pharmacokinetics of ketoprofen after multiple intravenous doses to mares. J. Vet. Pharmacol. Ther.. 1995;18:108-116.
- [CrossRef] [Google Scholar]
- Degradation of methyltestosterone in urine samples. Drug Test Anal.. 2014;6:1170-1173.
- [CrossRef] [Google Scholar]
- Advances in lipase-catalyzed esterification reactions. Biotechnol. Adv.. 2013;31:1846-1859.
- [CrossRef] [Google Scholar]
- Formation of the diuretic chlorazanil from the antimalarial drug proguanil—implications for sports drug testing. J. Pharm. Biomed. Anal.. 2015;115:208-213.
- [CrossRef] [Google Scholar]
- Phosgene in deteriorated chloroform: presumptive cause of production of 3,4-dimethyl-5-phenyl-2-oxazolidones in methamphetamine. Forensic Toxicol.. 2020;38:475-480.
- [CrossRef] [Google Scholar]
- Formation of oxazolidine derivatives by reaction with ephedrines and aldehyde impurities in ethyl acetate. J. Chromatogr. Sci.. 2022;60:316-323.
- [CrossRef] [Google Scholar]
- WADA, 2023. WADA Technical Document-TD2021IDCR: minimum criteria for chromatographic-mass spectrometric confirmation of the identity of analytes for doping control purposes. https://www.wada-ama.org/sites/default/files/resources/files/td2023idcr_final_eng_0.pdf (accessed 14 March 2023).
- Fast and sensitive chiral analysis of amphetamines and cathinones in equine urine and plasma using liquid chromatography tandem mass spectrometry. Am. J. Anal. Chem.. 2015;6:995.
- [CrossRef] [Google Scholar]
- Application of gas chromatography-tandem mass spectrometry for the determination of amphetamine-type stimulants in blood and urine. J. Pharm. Biomed. Anal.. 2018;148:58-64.
- [CrossRef] [Google Scholar]
- Detection and elimination profile of cathinone in equine after norephedrine (Propalin®) administration using a validated liquid chromatography–tandem mass spectrometry method. Anal. Bioanal. Chem.. 2013;405:9711-9722.
- [CrossRef] [Google Scholar]
- A fully automated high-throughput liquid chromatography tandem mass spectrometry method for measuring creatinine in urine. Clin. Mass Spectrometry. 2019;11:1-7.
- [CrossRef] [Google Scholar]
Appendix A
Supplementary material
Supplementary data to this article can be found online at https://doi.org/10.1016/j.arabjc.2024.105727.
Appendix A
Supplementary material
The following are the Supplementary data to this article:Supplementary data 1
Supplementary data 1


