

Translate this page into:
Fractal evolution of dual pH- and temperature-responsive P(NIPAM-co-AA)@BMMs with bimodal mesoporous silica core and coated-copolymer shell during drug delivery procedure via SAXS characterization
⁎Corresponding authors at: Beijing Key Laboratory for Green Catalysis and Separation, Department of Chemistry and Chemical Engineering, Beijing University of Technology, 100 PingLeYuan, Chaoyang District, Beijing 100124, China. jhsun@bjut.edu.cn (Jihong Sun)
-
Received: ,
Accepted: ,
This article was originally published by Elsevier and was migrated to Scientific Scholar after the change of Publisher.
Peer review under responsibility of King Saud University.
Abstract
Abstract
Fractal evolution for pre and drug-released mesoporous nanoparticles was explored. Shell thickness for core-shell structured P@BMMs was estimated via SAXS method. Effect of shell thickness on the drug delivery mechanism was elucidated. MTT assay and pharmacokinetic performance were preliminarily investigated.
Abstract
The dual (pH- and temperature-) responsive core-shell structured mesoporous nanomaterial P@BMMs were prepared using bimodal mesoporous silica as a core and poly(N-isopropylacrylamide-co-acrylic acid) P(NIPAM-co-AA) copolymer as a shell. Ibuprofen (IBU) was used as a model drug, and the effects of copolymer-coated shell thickness on drug loading and controlled release behavior were investigated by means of N2 sorption isotherms, dynamic light scattering measurements, X-ray diffraction patterns, Fourier transform infrared spectra, scanning electron and transmission electron microscopy, thermogravimetric profiles, and elemental analysis techniques. Particularly, their fractal evolutions in the drug delivery durations were explored via small angle X-ray scattering methods, demonstrating that the resultant P@BMMs before IBU-loading and after releasing possess the typical fractal features with spherical morphology. Meanwhile, the estimation for shell thickness of P@BMMs coating in different time intervals indicated that the drug-loaded capacity was improved with the increasing shell thickness, but drug-released rate varies, strongly depending on both shell thickness and release conditions. The drug delivery mechanism was preliminarily explored, following the Korsmeyer-Peppas model. Finally, cytotoxicity in cell and pharmacokinetic of released-IBU from hybrid nanocomposite in mice via intravenously injection were preliminarily explored.
Keywords
Fractal
Mesoporous SiO2
Core-shell structures
SAXS
Dual (pH- and temperature-) responsive

1 Introduction
In 2001, Vallet-Regi et al. for the first time used mesoporous silica nanoparticle (MSN) as a carrier for drug sustainable release studies (Vallet-Regi et al., 2001), since then, the advantages of the novel nanomaterials such as regular pore structure, high specific surface area, large pore volume and good biocompatibility have been considered to have great potential in the drug delivery system (Slowing et al., 2007; Sun et al., 2010; Trewyn et al., 2007). The pH- or temperature-sensitive polymer is coated on the surface of mesoporous silica to form porous hybrid nanomaterial with features of core-shell structure. For instance, Zha et al. designed intelligent micro-containers by using hydrogel as core and temperature-responsive poly (Nisopropylacrylamide) (PNIPAM) as shell, which can be used for temperature-controlled drug release (Zha et al., 2002). Hong et al. prepared a pH-responsive novel smart nanocontainer with a MSN as the container and a pH-responsive PAA nanoshell as a smart nanovalve (Hong et al., 2009). Later on, Jin et al. prepared a kind of organic-inorganic hybrid composite with core-shell structure using environmental stimuli (pH/temperature) copolymer poly(Nisopropylacryl-acrylamide)-co-poly(acrylic acid) (P(NIPAM-co-AA)) as a shell and bimodal mesoporous silica nanoparticle as a core (Jin et al., 2017). Although silica nanoparticles with core-shell structure have long-term developing prospects and diverse applications, its drug loading capacity and release mechanism are still ambiguous. In particular, the interactions among loaded-drug molecule and coated-copolymer and modified-mesoporous surface have a large influence on the drug delivery performances. It has been observed that using mesoporous silica-based carriers, the pore distribution (Muñoz et al., 2003; Qu et al., 2006), connectivity (Qu et al., 2006), the chemical composition of the silica surface (Andersson et al., 2004) strongly influence on the release kinetics of drugs. Recently, our group also carried out related studies on the silica based core-shell micro and nano materials with unique morphology, and hierarchical structures, the obtained results demonstrated that functionalized biomodal mesoporous materials (BMMs) with small size of 20–50 nm diameter were found excellent drug carriers and have high drug loading capacity. Gao et al. demonstrated the aspirin delivery behavior using functional bimodal mesoporous materials BMMs as carrier which were modified by grafting with different amounts of 3-aminopropyltriethoxysilane (N-TES) or 3-(2-aminoethylamino) propyltrimethoxysilane (NN-TES) onto the mesoporous surfaces (Gao et al., 2011a). Moreover, the ibuprofen (IBU) loading capacity and the release performance from the environmental stimuli (pH/temperature) nanoparticles P(NIPAM-co-AA)@BMMs were investigated under different external conditions (Jin et al., 2017). The hybrid mesoporous silicas using pH-responsive poly(methylacrylic acid) (PMAA) copolymer coated amine-modified surface of BMMs via “graft to” strategy were further explored, and the results obtained showed a smart pH-controlled drug delivery performance (Han et al., 2015; Zhang et al., 2014). The pH-sensitive complex nanoparticles could overcome the disadvantages of polymer having low drug loading capacity and also achieved the controlled drug-release under various pH.
However, only few reports have carefully explored the “confinement effects” and “surface polarity” of inside mesoporous channels on the drug loading and releasing properties. Based on the above mentioned facts, Wang et al. in our group prepared pH-responsive microspheres using dense nanosilica spheres as core and poly(acrylic acid) (PAA) as shell so as to elucidate surface effects (Wang et al., 2017). The results showed that the shell thickness has significantly effects on the drug loading capacity, showing that the ibuprofen loading procedure was fitted into the pseudo-second-order model, but its drug-release kinetic profile was favorable to Korsmeyer-Peppas model. Recently, the small angle X-ray scattering (SAXS) technique is considered a useful tool that can be used to study nanostructures with nanometer resolution (Sobry and Ciccariello, 2002). Based on the evolution information on nanoparticle growth (Masafumi and Syoko, 2016; Simo et al., 2012; Wuithschick et al., 2013; Yan et al., 2014), especially in nanoscale science, SAXS technique has the advantage of good statistics, because no special preparation of samples is required and original state is preserved. On the basis of the concept of surface fractal firstly proposed by Bale et al. and Sonwane et al. reported the characterization of surface roughness of MCM-41 and shrinkage in the mesoporous channels via small angle X-ray scattering, demonstrating the resolution of rough or uneven surfaces under different apparent fractal dimensions at a molecular scale (Bale and Schmidt, 1984; Sonwane et al., 1999). Morell et al. and Varga et al. used in situ SAXS technology to assess the fractal characteristics of mesopores structures in relationship between drug loaded capacity and mass fractal (Morell et al., 2004; Varga et al., 2015). Based on gold nanoparticle liposome exposed to ultraviolet light, Paasonen et al. further observed the interconversion between the liposome phase and the inverse hexagon phase using SAXS technology (Paasonen et al., 2010). Bellare and co-workers used SAXS patterns to obtain the information of core-shell structure of cesium dodecylsulfate, such as core dimensions, shell thickness, and fractional charge of the micelles (Kanungo et al., 2012), which confirmed the micelle size was dependent on the used surfactant concentration and temperature. Grünewald et al. studied the core-shell structure of highly monodisperse and densely grafted iron oxide core-poly(ethylene glycol) brush shell nanoparticles via SAXS profiles, the results revealed the appearance of a size-feature-specific to the shell and different density models of monodisperse core-shell nanoparticles with dense solvated shells can be distinguished by SAXS method (Grünewald et al., 2015). Through SAXS method, Manet et al. and Sundblom et al. studied the self-assembly mechanism of mesoporous silica under acidic conditions, and found that the hydrolysis-polycondensation performances of silica and micellar morphologies of used surfactants had a significant impact on the formation rate of mesoporous silica and its mesopores order (Manet et al., 2011; Sundblom et al., 2010). Using in situ SAXS technology, Michaux et al. and Schmitt et al. further demonstrated the nucleation and growth of mesoporous silica-based nanoparticles during surfactant-template self-assembly process, and found that their different nanostructures (such as platelets, toroids, and rods) could be successfully controlled using nonionic surfactant as template following from spherical micelles or short wormlike micelles to well-ordered two-dimensional-hexagonal arrangements (Michaux et al., 2012; Schmitt et al., 2013; Schmitt et al., 2016). These results indicated that the SAXS technique is a powerful tool to investigate the core-shell structure of mesoporous materials. We thereby also used SAXS technique to investigate the fractal evolution of mesoporous hybrid BMMs with core-shell structure during the process of drug loading and release, in which, the poly(N-isopropylacrylamide-co-acrylic acid) P(NIPAM-co-AA) copolymer was acted as a shell and mesoporous BMMs as a core.
In the present work, dual pH and thermo-responsive carrier such as P@BMMs and IBU as a model drug were used, their drug delivery profiles were evaluated via adjusting thickness of surface-coated copolymer. The variation of the shell thickness was thoroughly investigated by employing various characterizations, such as X-ray diffraction (XRD), scanning electron microscopy (SEM), transmission electron microscopy (TEM), N2 sorption isotherms, Fourier transform infrared (FT-IR), thermogravimetric analysis (TGA) and dynamic light scattering (DLS), and elemental analysis techniques. Particularly, their fractal evolutions in the drug-loading and subsequent releasing duration were demonstrated via SAXS analysis, and thereafter the drug delivery mechanism was preliminarily suggested. This study is also designed to investigate their cytotoxicity in cell the pharmacokinetics of released-IBU from hybrid nanocomposite in mice via intravenous injection.
2 Experimental section
2.1 Materials
The cetyltrimethyl-ammonium bromide (CTAB, A. R.), potassium persulfate (KPS, A. R.), tetraethyl orthosilicate (TEOS, A. R.), ammonium nitrate (NH4NO3, A. R.), sodiumdodecyl sulfate (SDS, A. R.), acrylic acid (AA, A. R.), IBU (A. R.) and hexane (A. R.), were obtained from Sinopharm Chemical Reagent Co. Ltd. Alfa Aesar company supplied other chemicals, including monomer N-isopropylacrylamide (NIPAM, A. R., 97%), N,N-methylenebisacrylamide (BIS, A. R., 97%), 3-methacryloxypropyltri-ethoxysilane (MPS, A. R., 98%). Before used, NIPAM and BIS were re-crystallized from hexane and methanol. Ammonia (NH3·H2O, A. R., 28%), anhydrous ethanol (C2H5OH, A. R., 99.7%), phosphoric acid, disodium hydrogen phosphate, sodium dihydrogen phosphate were purchased from Beijing chemical works. The deionized water used in the experiment was self-made in our laboratory.
2.2 Preparation and surface modification of BMMs-MPS nanoparticles
BMMs containing CTAB (t-BMMs) was synthesized partially on the basis of reported method (Sun et al., 2003). The synthesis procedure was as follows: The mixtures of 20.8 g of CTAB and 832 mL of deionized water was stirred well, then, 64 mL of TEOS was added dropwise, but 19.2 mL of ammonia was added quickly. The mixture was stirred continuously and became progressively white gel. After filtered, washed, and dried at 120 °C for 3 h, the resulting precipitates were denoted as t-BMMs. In order to modify the silane coupling agent of MPS on the outer surface of the BMMs, the MPS was used prior to remove the CTAB surfactant. BMMs-MPS was synthesized according to the literature (Jin et al., 2017, 2018, 2019). The obtained t-BMMs (0.1 g) was dispersed into the mixtures of 200 mL anhydrous ethanol and 1 mL MPS, which kept stirring for 4 h at 60 °C for 4 h. Then, the modified t-BMMs was collected after repeated washing with ethanol and drying for 12 h under vacuum. Finally, the CTAB was removed from the mesopores according to the method reported in the literature (Jin et al., 2017, 2018, 2019), the detailed process was as follows: 0.5 g of above product was refluxed for 2 h in 100 mL ethanol solution containing 0.6 g NH4NO3. After repeated for 3 times, then filtered, washed thoroughly with anhydrous ethanol, and dried at 60 °C under vacuum. The vinyl-modified materials (BMMs-MPS) were obtained.
2.3 Synthesis of P(NIPAM-co-AA)@BMMs composites
The synthesis of P(NIPAM-co-AA)@BMMs was carried out according to the method reported in the literature (Jin et al., 2017, 2018, 2019). The details of synthesis procedure of P(NIPAM-co-AA)@BMMs were as follows: dispersed 0.2 g of BMMs-MPS in 50 mL deionized water containing in 100 mL three-neck flask equipped with reflux under nitrogen protection, then NIPAM (50 mg), AA (3.3 μL), BIS (3.5 mg) and SDS (4.4 mg) were added into the mixture solution and stirred for 1 h at 70 °C. After the air was exhausted and nitrogen was passed, the initiator KPS was quickly added to the suspension. After the polymerization reaction was completed for a certain time, the composite nanoparticles were obtained by centrifugation, washing with deionized water, drying at 50 °C for 12 h, denoted as P@BMMs(n), where n represents the coating time (h) during polymerization, and is 1, 2, 4, and 7, respectively.
2.4 IBU adsorption
The experimental procedure of drug loading of P@BMMs was studied in the literature (Jin et al., 2017, 2018, 2019). The details of procedure were as follows: P@BMMs(n) (0.1 g) was dispersed in 10 mL solution of IBU hexane (40 mg/mL), and continuously stirred at 25 °C for 48 h. After that filtered, washed repeatedly with hexane, and dried in vacuum, the IBU-loaded P@BMMs(n) was denoted as I/P@BMMs(n)-48.
In order to measure the amount of drug loaded, the filtrate was collected and then diluted to 100 mL with hexane, whereas concentration was analyzed on a high performance liquid chromatography (HPLC). The corresponding calibrated curve of IBU were shown in Fig. S1 of Electronic Supporting Information (ESI) section, showing a good linear relationship (y = 0.0027x + 0.038) and high correlation coefficient (R2 > 0.9995), in which, Y-axis represents their concentrations and X-axis represents peak areas deriving from HPLC chromatograms. Whereas, the peak area was integral value of signal value output by the detector and retention time when the maximum concentration of IBU was eluted from the chromatographic column. In this regard, the unknown concentration of the IBU-contained solution can be obtained by testing the peak area in the HPLC chromatogram. The similar determination method was also reported (Shan et al., 2013).
The drug loading capacity was calculated by the following equation (Jin et al., 2017): where m0 is the initial weight of IBU, m1 is the weight of IBU left in the medium after equilibrium, m2 is the weight of I/P@BMMs(n)-48.
2.5 In vitro release
In vitro drug release procedure was similar to that of our previous report (Jin et al., 2017, 2018, 2019). In details, firstly pressed I/P@BMMs(n)-48 into slice and placed in a dialysis bag with a molecular weight cut off 3500 Da, which was immersed in 100 mL erlenmeyer flask containing PBS solution (pH 2.0, or 7.4) with an ionic strength of 0.02 M at 25 °C or 37 °C, respectively. After a certain time interval, 1 mL of the liquid was taken out of the release solution, at the same time 1 mL of fresh PBS solution was added. The sample obtained after release for 24 h was named as I/P@BMMs(n)-48-24.
The IBU concentration of released solution was analyzed by UV–visible spectrophotometer at the wavelength of 272 nm, which were performed three times. The corresponding calibrated curve of IBU were shown in Fig. S2 of ESI section, showing a good linear relationship (y = 1.42671x + 0.0047) and high correlation coefficient (R2 > 0.9997) in pH of 2.0, a good linear relationship (y = 1.44173x + 0.00769) and high correlation coefficient (R2 > 0.9996) in pH of 7.4.
The drug release percent was calculated using the following formula (Jin et al., 2017): where Cc is the corrected concentration at time t, Ct is the apparent concentration at time t, V1 is the volume of sample collected, and V2 is the total volume of released fluids.
Based on the mentioned-above introductions, the drug-releasing percent (%) could be calculated by formula as follow: where Cc is the corrected concentration at time t, V is the volume of release system, wt% is the amount of IBU loaded, and m is the weight of I/P@BMMs(n)-48.
2.6 Characterizations
The SEM images were obtained using a Hitachi S-4300 electron microscope at an acceleration voltage of 15 kV. The TEM micrograph was recorded on a JEM-2100 at 200 kV. UV–vis absorbance spectra were obtained from Shimadzu UV-2600 spectrophotometer. The XRD pattern was measured by a D8 ADVANCE X-ray powder diffractometer using Cu Kα radiation (λ = 0.154 nm) source in 2θ ranges from 1.0 to 10.0° with a scanning speed of 1.0°/min at the tube voltage of 36 kV and the tube current of 20 mA. The FT-IR spectra were measured on Tensor-27 Fourier infrared spectrometer using a scanned range of 4000–400 cm−1 and 4 cm−1 resolutions and sample was pressed with potassium bromide to a disc prior to measurement. The particle size was measured from Marvin Zetasizer Nano ZS instrument. TGA profiles were measured from Perkin-Elmer STA 8000 instrument in the range of 50–800 °C under air atmosphere with the heating rate of 10 °C/min−1. The N2 adsorption-desorption isotherms of all the samples were determined by JW-BK 300 specific surface and pore size analyzer, and the isotherm data was analyzed by BET (Brunauer-Emment-Teller) and the pore size distributions were calculated using adsorption branches of the isotherm by the Barrett-Joyner-Halenda (BJH) method. The HPLC was used for analysis the drug loading content of samples by Agilent Technologies 1200 series.
The SAXS profiles were measured at Beamline 1W2A at the Beijing Synchrotron Radiation Facility. The wavelength of the instrument was kept to 0.154 nm, and the SAXS detector (Mar 165 CCD) was set to 1.55 m distance from the sample with the experimental condition is under room temperature (22 °C). The powder samples were supported on an adhesive tape for measurement which was used for background correction for the samples. The nanoparticles structure information was obtained from fractal dimension data and the scattering of fractals (mass or surface) obeyed the power law.
According to Hajji’ demonstration (Hajji et al., 2015), the fractal dimension belongs to mass fractal (Dm) in the range of 0 < α < 3, and its value is equal to α, while the surface fractal (Ds) in the range of from 3 to 4, Ds value = 6 − α (Ds ≠ 3). Recently, other methods of fractal calculation have been further developed (Cattani, 2018; Jafari et al., 2018; Liu and Zhang, 2018; Maitama and Zhao, 2019; Prakash and Kaur, 2018; Singh et al., 2016; Yang and Machado, 2017c; Yang et al., 2015, 2016a, 2016b, 2017a, 2017b, 2017d, 2018).
The particle size was estimated originating from distance distribution function P(r), as follows (Glatter, 1977):
On the basis of small angle scattering theory and Porod law, the relation between the characteristic function of a particle γ(r) and the scattering function is given by the following equation:
The distance distribution function P(r) was obtained by multiplying r2:
Essential information on the shape of the particle can be determined from the P(r) function. According to Glatter’ demonstration (Glatter, 1977), P(r) represents the distance distribution function, which is a numerical value, but does not have special statistical significance. The function P(r) thus differs from zero only in a certain limited region of real space, namely between 0 and r, where r corresponds to the maximum distance in the particle. Therefore, the r value for spherical nanocomposite in this work can be defined as the diameters of the particles.
2.7 Cytotoxicity measurement and pharmacokinetic experiment in mice
3-(4,5-Dimethyl-2-thiazoly) 2,5-diphenyl-2-H-tetrazolium bromide (MTT) assay was performed to evaluate cell viability by treating I/P@BMMs(7)-48 with conventional MTT protocols. HepG-2 cells (5 × 10⁴ cells/well) were first incubated for 24 h in 96-well plate, and then 100 μL of I/P@BMMs(7)-48’s concentration in the range of 0.2–100 μg/mL was added. After incubation for 48 h, the medium was discarded and replaced by another medium containing DMSO (100 μL/well). The cell viability was determined using plate reader at 490 nm.
BALB/c mice were supplied by the Laboratory Animal Service Center, The Fourth Military Medical University. All animal experiments were approved by the Animal Experiment Administration Committee of the Fourth Military Medical University. Animals were housed under standard conditions of temperature, humidity and light. Food and water were provided ad libitum. Mice were randomly divided in 10 groups (n = 5 in each group) and injected intravenously with 0.2 mL I/P@BMMs(7)-48-conatined solution at a concentration of 3 mg/mL. Finally, drug dose was around 600 μg/mice through the tail vein. Blood (∼0.5 mL) was drawn from mice and put into heparinized Eppendorf tubes at 10 different time intervals after injection. The blood sample was centrifuged at 4 °C, and 8000 rpm immediately and 0.3 mL of plasma was harvested. Each plasma sample was mixed with 0.5 mL of ethanol, vortexed, and centrifuged at 15000 rpm for 5 min. The supernatant was collected to measure the drug concentrations using the UV–vis spectrophotometer (Shimadzu UV-2600 spectrophotometer). Standard equation of drug and its linear fitting was established by UV absorption at different drug concentrations. Y = 9.6584x − 0.0068 (R2 = 0.9996, linear range: 0.0010–600 μg/mL).
3 Results and discussion
3.1 Structural and textural characterizations
Fig. 1A showed the XRD patterns of before and after drug-loaded samples with different copolymer-coating time interval and drug-loaded amounts (inset). As can be seen, an obvious peak (100) in all samples suggested the presence of highly ordered mesopore structures, while, the diffraction peak of BMMs modified by silane coupling agent shifted from 1.94° of pure BMMs (Fig. 1A-a) to 2.08° of BMMs-MPS (Fig. 1A-b), implying the successful grafting of the organic functional groups on the mesoporous surface of BMMs (Jin et al., 2017). The peak (100) of each mesoporous hybrid sample presented not only decreasing intensity but also shifting from 2.1° of P@BMMs(1) (Fig. 1A-c) to 2.14° of P@BMMs(7) (Fig. 1A-d) with the increasing grafted amount of P(NIPAM-co-AA) copolymer, indicating a slight effect of grafting procedure on the ordered mesopore structures. After IBU-loading, a pounced reduction in peak (100) intensity of I/P@BMMs(n)-48 (Fig. 1A-e, and -f) was observed, implying the successful loading of IBU molecules in mesoporous channels of P@BMMs. The corresponding wide angle XRD patterns were shown in Fig. 1A (inset). As can be seen in Fig. 1A-g (inset), the strong diffraction peaks within 2 theta of 10–50° belonged to the crystalline phase of used IBU. The loaded-IBU samples of both P@BMMs(1)-48 and P@BMMs(7)-48 presented a wide diffraction peak in the range of 20–30°, suggesting the highly uniform distribution of IBU in mesoporous I/P@BMMs(n)-48 (seen in Fig. 1A-e and -f (inset)) (Li et al., 2016; Shen et al., 2011). Unfortunately, as shown in Fig. 1B, the drug-released samples obtained under different conditions, taking I/P@BMMs(7)-48-24 as an example, exhibited no characteristic diffraction peaks, indicating the disappearance of ordered mesopores structures.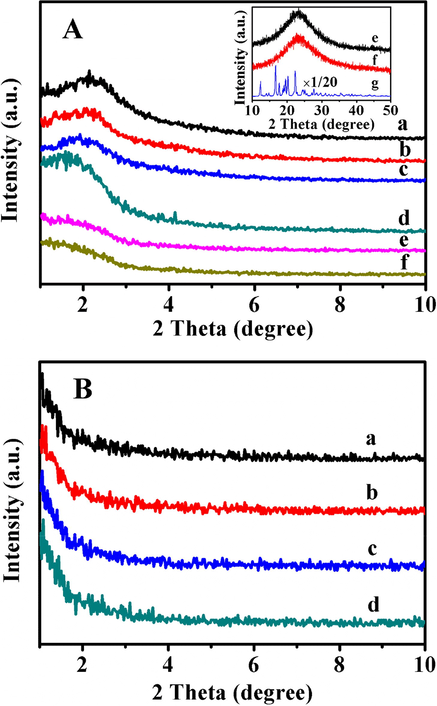
A: XRD patterns of pre and after drug-loaded samples. (a) BMMs, (b) BMMs-MPS, (c) P@BMMs(1), (d) P@BMMs(7), (e) I/P@BMMs(1)-48, and (f) I/P@BMMs(7)-48, The corresponding wide angle XRD patterns of (e) I/P@BMMs(1)-48, (f) I/P@BMMs(7)-48, and (g) IBU (inset); B: XRD patterns of after drug-releasing I/P@BMMs(7)-48-24 under various media. (a) 25 °C, pH 2.0, (b) 25 °C, pH 7.4, (c) 37 °C, pH 2.0, and (d) 37 °C, pH 7.4.
The SEM and TEM micrographs can provide the morphologies and microstructures of BMMs-MPS, P@BMMs(7), I/P@BMMs(7)-48, and I/P@BMMs(7)-48-24, as imaged in Fig. 2. Firstly, as seen in Fig. 2a and 2e, the BMMs-MPS exhibited a spherical nanoparticle of around 50 nm with the abundant worm-like pore channels of around 3 nm, which were found consistent with our previous report (Gao et al., 2011b). However, the SEM image of P@BMMs(7), as shown in Fig. 2b, presented a spherical morphology, but had a little larger size of around 60 nm than that of pure BMMs-MPS (Fig. 2a). Meanwhile, the TEM image (Fig. 2f) revealed the core (black color) in the center of copolymer shell (gray edges) and small mesopores with uniform size of 3 nm. These observations clearly indicated that the copolymer has been successfully wrapped onto the surface of BMMs, but did not significantly impact on the morphology and mesopore structure of BMMs. On the other hand, the SEM micrograph (Fig. 2c) of IBU-loaded sample (I/P@BMMs(7)-48) showed the spherical morphologies in size of 60 nm, almost same as that of copolymer-coated BMMs (Fig. 2b), Fig. 2g presented that the TEM image of I/P@BMMs(7) also had the core-shell structure. Taking a typical drug-released sample obtained at 25 °C, pH 2 as an example, the spherical morphologies (Fig. 2d) and the core-shell structure of I/P@BMMs(7)-48-24 after IBU releasing still remained intact (Fig. 2h), but the mesoporous structure may be collapsed, or even disappeared to somehow.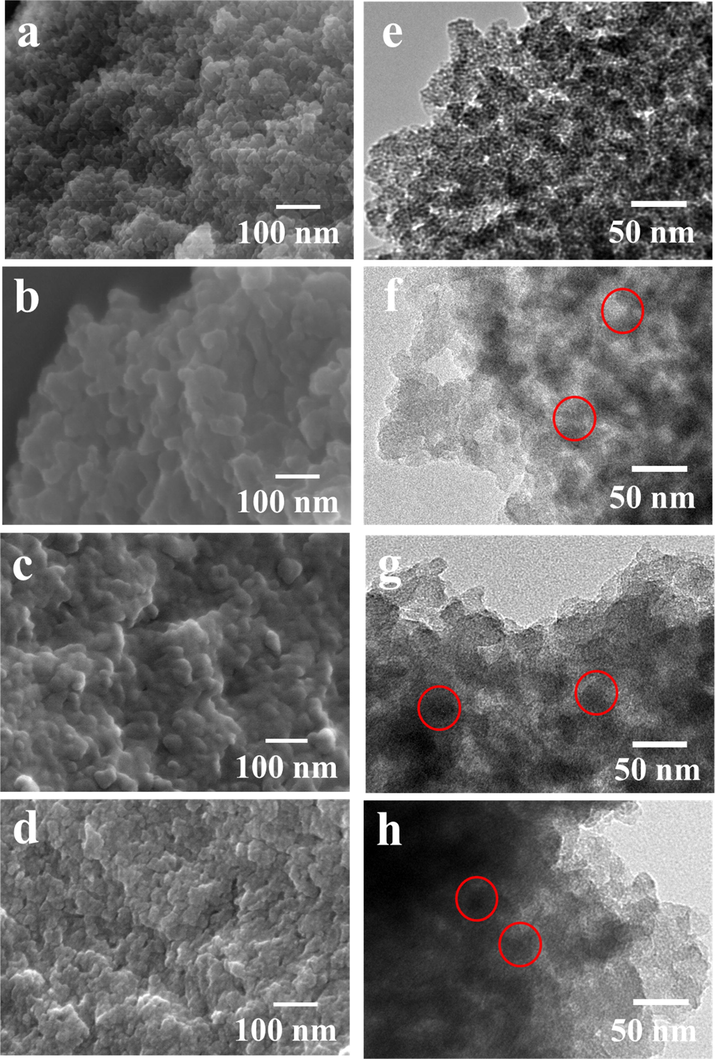
SEM images of (a) BMMs-MPS, (b) P@BMMs(7), (c) I/P@BMMs(7)-48, (d) I/P@BMMs(7)-48-24. The corresponding TEM images of (e) BMMs-MPS, (f) P@BMMs(7), (g) I/P@BMMs(7)-48, and (h) I/P@BMMs(7)-48-24 (the typical drug-released sample, taking I/P@BMMs(7)-48 after IBU releasing at 25 °C, pH 2.0 as example).
TG profiles of pre and after drug-loaded samples were also carried out (Fig. S3 of ESI section). As can be seen in Fig. S3-A, there were two stages of weight loss procedures: one before 200 °C could be attributed to the removal of moisture absorbed or residual solvent (Jaroniec et al., 1998), another between 200 and 800 °C was assigned to the decomposition of the surface silanol groups and the residual organic components, corresponding to 4.7 wt% of pure BMMs (Fig. S3-A(a)), 16.2 wt% of BMMs-MPS (Fig. S3-A(b)), and 16.3 wt% to 39.4 wt% of P@BMMs(n) (Fig. S3-A(c), (d), (e), and (f). Taking BMMs-MPS as a reference, the copolymer-coated amount was about 0.1%, 4.6%, 11.5%, and 23.2%, respectively. The TG curves of IBU-loaded samples were present in Fig. S3-B, obviously showing three stages of weight loss procedure, which was different from that of copolymer-loaded samples (seen in Fig. S3-A): the weight loss profile for I/P@BMMs(n)-48 (n = 1, 2, 4, and 7, respectively) during the temperature of before 200 °C were corresponding to the removal of adsorbed water, the second one for decompositions of surface-coated copolymer and partial loaded-IBU in the mesoporous BMMs during the temperature of 200–400 °C, corresponding to 7.7, 4.6, 6.8, and 11.8 wt% for first stage, and 7.3, 12.0, 7.1, and 10.7 wt% for second stage, respectively. The last one of around 5.9, 8.7, 6.2, and 10.0 wt% in the temperature range of 400–800 °C was attributed to completely decomposition of organic component including residual copolymer and IBU. Taking P@BMMs(n) as a reference, as shown in Fig. S3-B, the drug loading of I/P@BMMs(n = 1, 2, 4, and 7, respectively)-48 was about 4.5, 4.7, 7.6, and 6.9 wt%, respectively, which proved that the drug loading capacity increased with increasing copolymer-coated time intervals.
The elemental analysis results of pre and after copolymer-coated, as well as IBU-loaded samples were collected in Table S1 of ESI section. It can be seen that the content of C and H in BMMs was 3.43 wt% and 1.01 wt%, respectively, which may be due to the unremoved CTAB completely, while, the content of C and H in BMMs-MPS corresponding to 11.65 wt% and 5.7 wt%, respectively, indicated the successful modification by 3-methacryloxypropyltri-ethoxy groups. After coating by copolymer, the content of C and H in P@BMMs(n = 1, 2, 4, and 7, respectively) obviously increased from 11.67 wt% and 5.83 wt% to 27.36 wt% and 10.82 wt%, respectively. Particularly, the content of N increased from 0 for BMMs-MPS to 4.35 wt% for P@BMMs(7) , but, the molar ratio of N/C kept almost unchanged with ca. 0.12–0.15, suggesting successful coating of copolymer on the mesoporous BMMs. After drug-loading, the content of C in I/P@BMMs (n = 1, 2, 4, and 7, respectively)-48 presented the increased tendency from 10.9 to 20.42 wt%, indicating that IBU was gradually loaded into the mesoporous channels with the increasing amounts of coated-copolymer.
Fig. 3 displayed the N2 adsorption-desorption isotherms and corresponding pore size distributions of related samples, their textural parameters were collected in Table S2. As shown in Fig. 3A, the isotherms of all samples belonged to type IV, and the appearance of two distinct hysteresis loops in the relative pressures (P/P0) range of 0.3–0.5 and 0.7–0.9, respectively, verified the existence of bimodal mesopores structures, which are found in good agreement with our previous report (Jin et al., 2017). However, the hysteresis loop in the low pressure region gradually disappeared along with the copolymer-coating time, while the other one in the high pressure region changed unobvious. The corresponding pore distributions (as shown in Fig. 3B-c and -d) exhibited that the bimodal mesopores size of pre and after copolymer-coated samples remained almost intact, similar to that of BMMs (Fig. 3B-a) or BMMs-MPS (Fig. 3B-b), suggesting that P(NIPAM-co-AA) copolymer as a shell was mainly coated on the outer surface of BMMs via polymerization between vinyl functional groups and acylamine groups. However, their specific surface area and pore volume decreased from 1019 cm2/g and 1.64 cm3/g for P@BMMs(1) to 554 cm2/g and 1.12 cm3/g for P@BMMs(7), respectively, as shown in Table S2 of ESI section.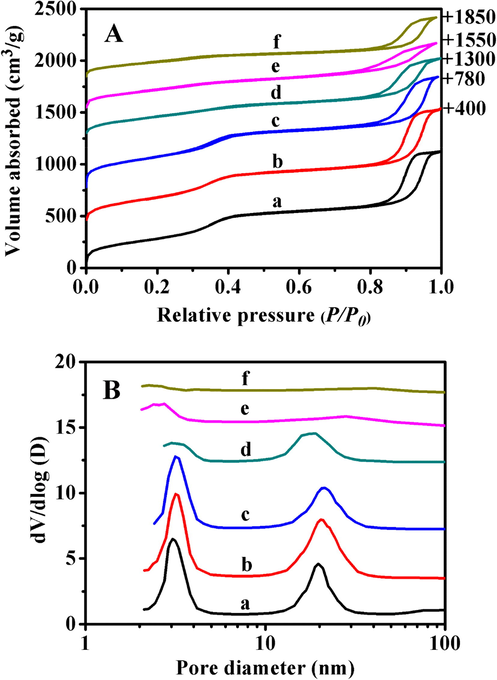
N2 adsorption–desorption isotherms (A) and their corresponding pore size distributions (B) of (a) BMMs, (b) BMMs-MPS, (c) P@BMMs(1), (d) P@BMMs(7), (e) I/P@BMMs(1)-48, and (f) I/P@BMMs(7)-48.
After drug-loading, both the specific surface area and pore volume decreased along with copolymer-coated time from 669 m2/g and 1.29 cm3/g for I/P@BMMs(1)-48, to 385 m2/g and 0.69 cm3/g for I/P@BMMs(7)-48, respectively, while the mean primary pore diameter decreased from 2.54 to 2.27 nm (seen in Table S2). These results clearly indicated the successful IBU-loading into the mesoporous channels of P@BMMs. Interestingly, as can be seen in Fig. 3B-e and -f, the gradual disappearances of larger mesopores for I/P@BMMs(1)-48 and I/P@BMMs(7)-48 again proved that IBU was successfully loaded into the mesopores.
As shown in Fig. S4 of ESI section, FT-IR spectra presented the characteristic information of the functional groups in before and after IBU-loaded samples using IBU as a reference. Firstly, as can be seen in Fig. S4-a for BMMs, the absorption peaks centered at 1080 and 802 cm−1 belonged to asymmetric stretching vibration of Si—O—Si, and another at 952 cm−1 could be attributed to the stretching vibration of Si—OH (Gao et al., 2012). In case of BMMs-MPS (Fig. S4-b), the additional appearance of a vinyl characteristic peak at 1637 cm−1 and —CH2 stretching peal at 2952 cm−1 suggested the successful modification by vinyl groups (Chang et al., 2013). The spectrum of P@BMMs(7) (Fig. S4-c) exhibited the comparatively new absorption peaks at 1560, 1467, and 1376 cm−1, which were ascribed to the characteristic peaks of copolymer P(NIPAM-co-AA) (Bourgeat-Lami and Lang, 1998; Efthimiadou et al., 2014). Furthermore, I/P@BMMs(7)-48 (Fig. S4-d) showed a strong carboxyl band at 1718 cm−1, indicating the successful IBU-loading in the mesoporous hybrid material (Brás et al., 2014). However, a characteristic peak of IBU (Fig. S4-g) was also observed at 1718 cm−1 in I/P@BMMs(7)-48-24 (Fig. S4-e and -f) after-releasing under different conditions, which confirmed the presence of the residues of IBU in the mesoporous BMMs even after releasing for 24 h.
The SAXS patterns of BMMs, BMMs-MPS and P@BMMs(n) were shown in Fig. 4A, the straight line for each scattering pattern in low region (q < 1) implied the presence of typical fractal features in all samples with a good correlation (correlation coefficient (R2) > 0.99). Fig. 4B showed the effect of copolymer-coated time on the Dm values of hybrid P@BMMs by accompanying with their morphologies (as imaged in inset), it can be seen that the Dm value increased from 2.01 for BMMs to 2.02 for BMMs-MPS, 2.12 for P@BMMs(7), meaning that the copolymer-coated procedure has an effect on the microstructure transformation from regular to complex (Liu et al., 2015). Meanwhile, SEM images, as seen in Fig. 4B(inset), not only presented the spherical particles in the copolymer-coating duration, but also showed the increased particle size from 50 to 60 nm, which was proportional to Dm values of hybrid P@BMMs with the copolymer-coated time intervals. Interestingly, it is noted that the symmetric profiles of distance distribution curves (as shown in Fig. 4C) suggested the spherical morphologies of all samples (Glatter, 1979; Shang et al., 2013), in close agreement with the SEM observations in Figs. 2 and 4B (inset).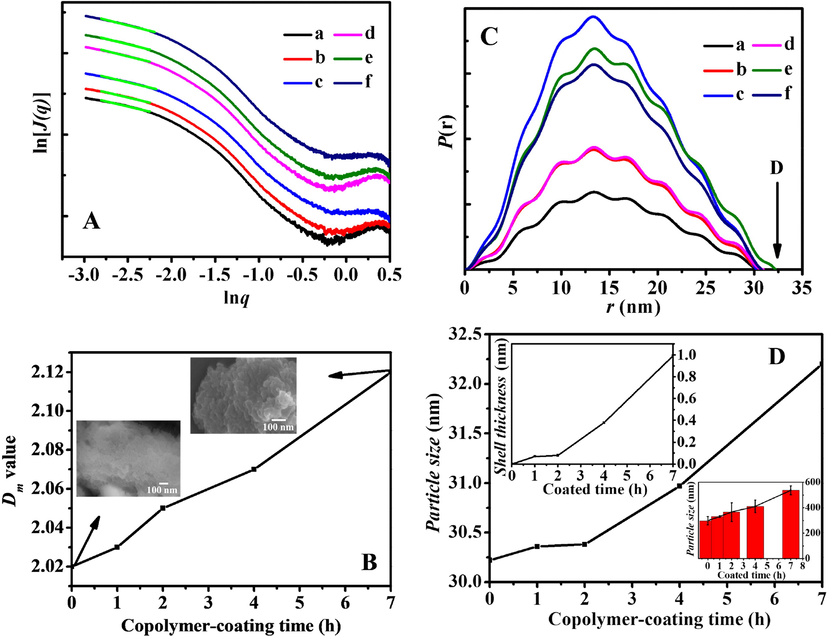
A: SAXS patterns of (a) BMMs, (b) BMMs-MPS, (c) P@BMMs(1), (d) P@BMMs(2), (e) P@BMMs(4), and (f) P@BMMs(7); B: Effect of copolymer-coating time intervals (1, 2, 4, and 7 h, respectively) on the Dm values of hybrid P@BMMs(n) along with their morphologies (inset); C: r-P(r) chart originating from description given in the Experimental section. (a) BMMs, (b) BMMs-MPS, (c) P@BMMs(1), (d) P@BMMs(2), (e) P@BMMs(4), and (f) P@BMMs(7); D: Estimated particles size of P@BMMs(n) on the basis of distance distribution function (equation (4) in the Experimental section) with their estimated shell thickness on the basis of estimated particle size by deducing particle size of BMMs-MPS (inset left up) and DLS measurements (inset right down) with different copolymer-coated time intervals (1, 2, 4, and 7 h, respectively).
On the basis of SAXS patterns and the distance distribution curves (Fig. 4C), Fig. 4D presented the evolution of particle size with copolymer-coating interval (Becker et al., 1998), the estimated shell thickness of P@BMMs(n) (inset left up) and DLS measurements (inset right down). As can be seen, the increase in estimated particle size of P@BMMs from 30.2 to 32.2 nm was similar to the increasing tendency from 297.2 to 536.8 nm of DLS profiles (inset right down), but much smaller than that of results measured using DLS data. The main reason was due to both the swelling behavior of surface-coated P(NIPAM-co-AA) copolymer in the hybrid P@BMMs and the solvation effect under neutral aqueous solutions during the DLS measurements. These observations again demonstrated that the copolymer gradually wrapped to the surface of BMMs with prolonged coating time interval. Taking BMMs-MPS as a reference, the estimated shell thickness of P@BMMs(1), P@BMMs(2), P@BMMs(4), and P@BMMs(7) was about 0.07, 0.08, 0.38 and 0.99 nm, respectively (Fig. 4D (inset left up)). These results showed that the shell thickness was proportional to the copolymer-coated time interval. The increase phenomena of Dm values with copolymer-coating time implied that nanoparticles with mass fractal feature were gradually changed to dense structures. Furthermore, the shells of obtained nanocomposites after encapsulation of the polymers were thicker with copolymer-coating time, meaning the successful preparation of nanocomposites with core-shell structures.
3.2 IBU loading and in vitro releasing performance
The SAXS patterns of drug-loaded samples were shown in Fig. 5A, showing the straight line for each scattering pattern in low region (q < 1) with a good correlation efficient (R2 > 0.99). However, Fig. 5B indicated that their fractal characteristics varied from mass fractal of pre IBU-loaded sample (seen in Fig. 4B) to surface fractal, suggesting the transformation of the mesoporous structures from high porosity to densely rough surface (Varga et al., 2015). The Ds value also revealed increasing shell thickness from 2.47 for I/P@BMMs(1) to 2.77 for I/P@BMMs(7) with copolymer-coating time interval ranges, one of main reasons may be due to the introduction of IBU onto the mesoporous channels of P@BMMs.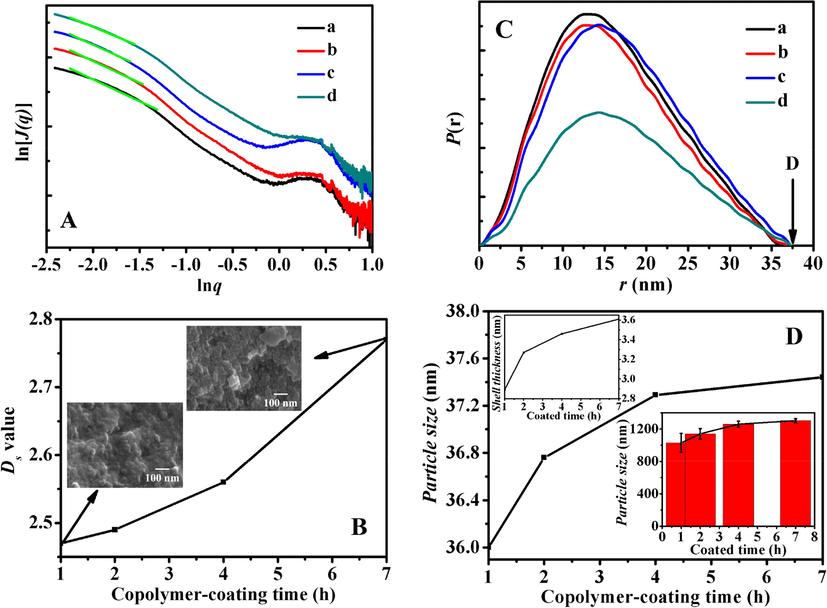
A: SAXS patterns of (a) I/P@BMMs(1)-48, (b) I/P@BMMs(2)-48, (c) I/P@BMMs(4)-48, and (d) I/P@BMMs(7)-48; B: Evolution of surface fractal dimensions (Ds) calculated from SAXS patterns for I/P@BMMs(n) along with their morphologies (inset); C: r-P(r) chart originating from description given in the Experimental section. (a) I/P@BMMs(1)-48, (b) I/P@BMMs(2)-48, (c) I/P@BMMs(4)-48, and (d) I/P@BMMs(7)-48; D: Estimated particles size of I/P@BMMs(n) on the basis of distance distribution function (Eq. (4) in the Experimental section) with the estimated shell thickness of I/P@BMMs(n)-48 on the basis of estimated particle size by deducing particle size of BMMs-MPS (inset left up) and their DLS measurements (inset right down) with different copolymer-coated time intervals (1, 2, 4, and 7 h, respectively).
The similarity of symmetric profiles for pre and after IBU-loaded samples was comparable with distance distribution curves, as shown in Fig. 5C, demonstrating that the spherical morphologies of I/P@BMMs(n) were reserved (Glatter, 1979; Shang et al., 2013), which could be also confirmed by SEM images (Figs. 2 and 5B (inset)).
As can be seen in Fig. 5D, the variations in the particle sizes originating from the distance distribution curves (Fig. 5C) in the range of 36 to 37.4 nm were similar to the increasing particle sizes from 1028 to 1303 nm of I/P@BMMs(n) measured by DLS (Fig. 5D (inset right down)), but much smaller than that of DLS measurements. Taking BMMs-MPS as a reference, the shell thickness of I/P@BMMs(1), I/P@BMMs(2), I/P@BMMs(4), and I/P@BMMs(7) was calculated around 2.9, 3.3, 3.5, and 3.6 nm , respectively (Fig. 5D (inset left up)), clearly showing comparatively more thickness than the corresponding hybrid P@BMMs (Fig. 4D (inset left up)), and suggesting that the drug was successfully loaded into the nanocomposites.
Presently, the IBU-loading content of P@BMMs was about 23%, a little lower than that of pure BMMs (27%) (Gao et al., 2012), indicating the certain influence of copolymer shell thickness on the IBU drug loading behavior. The detailed discussions are given in the following section.
Taking I/P@BMMs(4)-48-24 as an example, Fig. 6 presented the SAXS patterns of after drug-released samples obtained under various conditions. As shown in Fig. 6A, the straight line for each scattering pattern in low region (q < 1) with a good correlation coefficient (R2 > 0.99) also implied the presence of typical mass fractal features for I/P@BMMs(4)-48-24, showing Dm value of around 2.93, 2.91, 2.9, 2.85, respectively. Interestingly, Fig. 6A (inset) exhibited that the fractal features of after IBU-released samples reverted back from surface fractal for drug-loaded sample (seen in Fig. 5B) to mass fractal, but was similar to the copolymer-coated BMMs (Fig. 4B). Combined with mentioned-above XRD analysis (Fig. 1B), these phenomena may be due to disappearances of the mesoporous structures (Jin et al., 2017).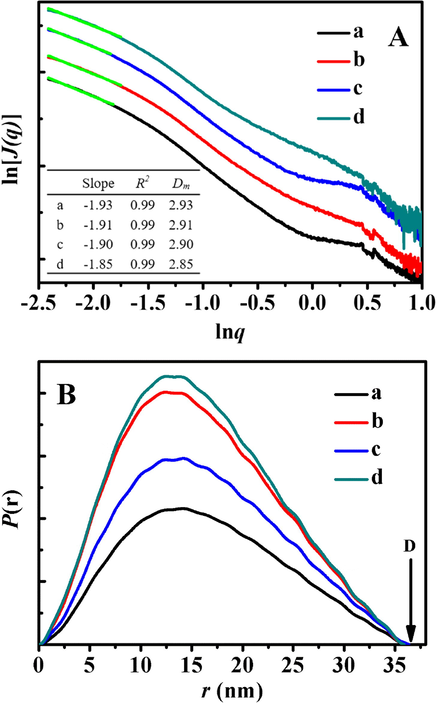
A: SAXS patterns of I/P@BMMs(4)-48-24 obtained under different conditions of drug releasing and corresponding Dm values (inset); B: r-P(r) chart of I/P@BMMs(4)-48-24 originating from description in the Experimental section under different conditions of drug releasing. (a) 25 °C, pH 2.0; (b) 25 °C, pH 7.4; (c) 37 °C, pH 2.0; and (d) 37 °C, pH 7.4.
However, Fig. 6B presented the symmetric profiles for after IBU-released samples, similar to that of pre and after drug-loaded samples, also confirming the reservation of spherical morphologies. The estimated particle size of I/P@BMMs(4)-48-24 under various releasing conditions was 36.11 (25 °C, pH 2.0), 35.72 (25 °C, pH 7.4), 35.34 (37 °C, pH 2.0), and 36.09 nm (37 °C, pH 7.4), respectively, when BMMs-MPS was taken as a reference, the estimated shell thickness of coated copolymers could be deduced to 2.95 (25 °C, pH 2.0), 2.75 (25 °C, pH 7.4), 2.56 (37 °C, pH 2.0), 2.94 nm (37 °C, pH 7.4), showing much thicker than that of P@BMM(4) (around 0.4 nm, seen in Fig. 4D (inset left up)), but a little thinner than that of drug-loaded I/P@BMMs (4)-48 (around 3.5 nm, seen in Fig. 5D (inset left up)). The estimated particle size and corresponding shell thickness may be influenced by various factors, such as shrunken-swollen behaviors of copolymer-coated shell, the residues of IBU left in the mesopores, and nonuniform nanoparticle morphologies of mesoporous BMMs. Similar behavior was observed in the I/P@BMMs(1)-48-24, I/P@BMMs(2)-48-24, I/P@BMMs(7)-48-24 obtained under various releasing conditions, and the detailed information was shown in Figs. S5–S7 of ESI section.
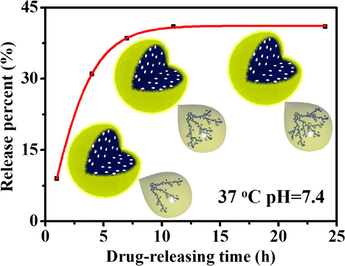
Fig. 7 presented the in vitro IBU-release performance from I/P@BMMs(n)-48 under different releasing conditions. As can be seen in Fig. 7A and 7C, in acidic medium (pH 2.0), the IBU-releasing equilibrium amount at 37 °C reached up to about 43.5% for I/P@BMMs(1)-48, 58% for I/P@BMMs(2)-48, 66.5% for I/P@BMMs(4)-48, and 75% for I/P@BMMs(7)-48, respectively, higher than that measured at 25 °C (24%, 30.5%, 37%, 40.5%), showing the temperature-responsive properties. These phenomena could be further interpreted in terms of low temperature, the hydrogen bonding interactions between IBU and P@BMMs carrier caused a delay in drug molecule’s release. On the contrary, the hydrogen bonding interactions were broken at high temperature (Sousa et al., 2005), which can facilitate the release of IBU from P@BMMs(n) carrier. However, in the PBS solution of pH 7.4, the IBU-releasing amount of I/P@BMMs (n = 1, 2, 4, and 7, respectively) at 37 °C was 22.5%, 33%, 35.5%, 42% (Fig. 7D), more or less similar to that (26%, 29%, 30.5%, 32.5%) at 25 °C (Fig. 7B). On the other hand, the IBU-release equilibrium amounts of I/P@BMMs (n = 1, 2, 4, and 7) at pH 2.0 (Fig. 7C) were around 43.5%, 58%, 66.5%, 75%, respectively, higher than that at pH 7.4 (Fig. 7D) (22.5%, 33%, 35.5%, 42%, respectively), showing the pH-responsive behaviors. These observations may be related to the shrinkage networks of copolymer in the low pH release solution and the swollen state at pH of basic medium, which have been investigated in our previous work (Jin et al., 2017). In addition, the IBU-releasing amount at pH 2.0 (Fig. 7A) was similar to that at pH 7.4 (Fig. 7B). The IBU release profiles presented the copolymer has dual pH- and temperature- responsive performances. These results demonstrated that, the equilibrium release rate also increased with the increasing polymer-coated time interval, which proved that the release performance of the IBU was significantly affected with the increasing coated-copolymer thickness.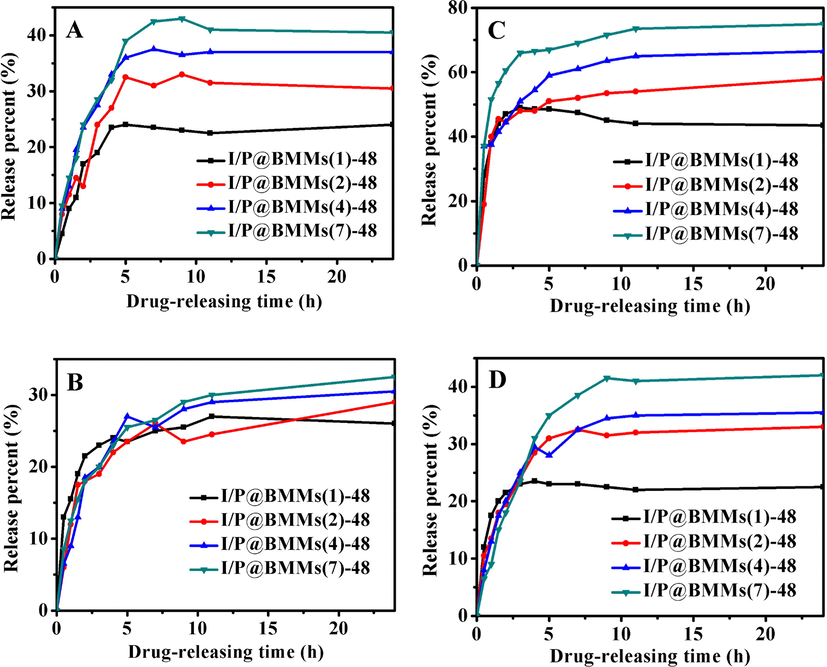
In vitro IBU-release behaviors of I/P@BMMs(n)-48 obtained with different copolymer coated time (1, 2, 4, and 7 h, respectively) under various releasing conditions. A: 25 °C, pH 2.0; B: 25 °C, pH 7.4; C: 37 °C, pH 2.0; and D: 37 °C, pH 7.4.
Thereafter, based on the mentioned-above discussion, the relationships between estimated shell thickness and release behavior from I/P@BMMs(n)-48 under different conditions were displayed in Fig. 8. As can be seen in Fig. 8A and 8C, the results presented that under the acid media of pH 2.0, the estimated shell thickness all decreased (at 25 °C, from 3.2 to 2.6 nm, at 37 °C from 3.2 to 2.4 nm) with increasing drug release percent (at 25 °C from 24.0 to 40.5%, at 37 °C from 43.5 to 75%). On the contrary, Fig. 8B and 8D presented that the estimated shell thickness increased at pH 7.4 (at 25 °C from 2.2 to 2.8 nm, at 37 °C, from 2.3 to 2.9 nm) with the increasing drug release percent (at 25 °C from 26 to 32.5%, at 37 °C from 22.5 to 42%), which may be due to the shrinkage networks of copolymer in the low pH release solution, but the swollen state at pH of basic medium. These observations certified that the shell thickness has an obvious influence on the drug release system.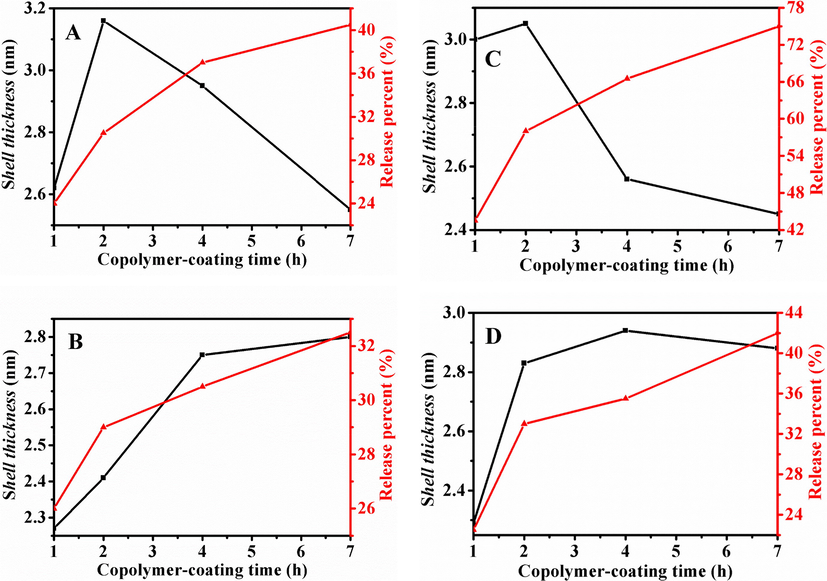
Relationship between estimated shell thickness (black line) and drug release behavior (red line) for I/P@BMMs(n)-48 with copolymer-coating time intervals (1, 2, 4, and 7 h, respectively) under different conditions. A: 25 °C, pH 2.0; B: 25 °C, pH 7.4; C: 37 °C, pH 2.0; and D: 37 °C, pH 7.4.
In order to further explore the influence of the shell thickness of hybrid P@BMMs on the drug release procedure, the kinetic performances of amine-modified BMMs as a reference (Han et al., 2015) and I/P@BMMs(7) were compared on the basis of Korsmeyer-Peppas model. As seen in Fig. 9, all fitting curves had a high linear correlation coefficient (R2 > 0.88), meaning that the IBU-releasing could be well described by the Korsmeyer-Peppas model, in which, the release rate (k) value for amine-modified BMMs under acidic conditions (Fig. 9A) and alkaline conditions (Fig. 9B) remained intact in size of around 0.55–0.56, further demonstrating that amine-modified BMMs had no obvious pH-responsive property, in good agreement of our previous report (Han et al., 2015). However, after copolymer coating, the release rate of I/P@BMMs(7) under acidic conditions (k = 0.31) was significantly higher than that under alkaline conditions (k = 0.12), indicating that the drug-releasing behaviors followed the synergistic mechanism of diffusion/swelling-based control (Siepmann and Peppas, 2001).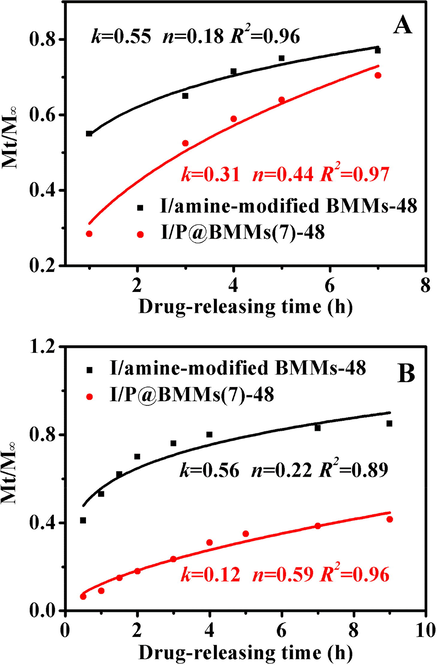
Korsmeyer-Peppas model fitting curve of IBU-released samples under different conditions. A: 37 °C, pH 2.0; B: 37 °C, pH 7.4.
3.3 Cytotoxicity test and pharmacokinetic performance in mice
The MTT assay (Cao et al., 2015) result of I/P@BMMs(7)-48 was showed in Fig. 10A. As can be seen, HepG-2 cells were incubated in I/P@BMMs(7)-48 by different concentrations, such as 0.2, 0.4, 0.8, 1.6, 3.2, 6.3, 12.5, 25, 50 and 100 μg/mL. The IC50 is around 70 μg/mL, indicated the good biocompatibilty and non-toxic properties, which can be used in drug delivery (Sun et al., 2017).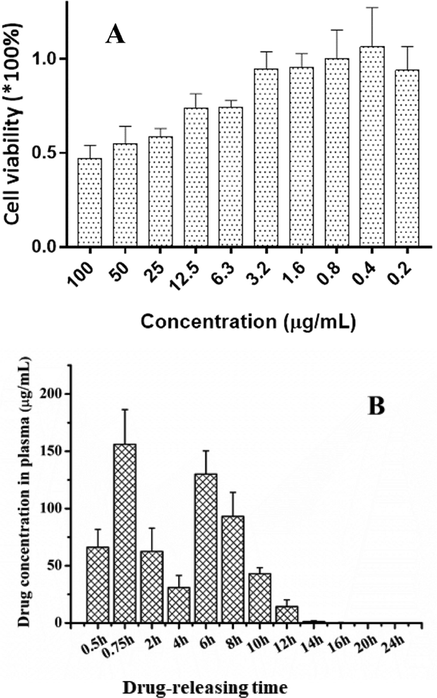
A: Cell viability with different concentrations of I/P@BMMs(7)-48 (0.2, 0.4, 0.8, 1.6, 3.2, 6.3, 12.5, 25, 50, and 100 μg/mL, respectively); B: Plasma concentration-time profile of IBU releasing from I/P@BMMs(7)-48 in mice.
An ideal drug delivery vehicle must be non-toxic, biocompatible, non-immunogenic, biodegradable, and maintaining a desired drug plasma concentration. The theory of this ideal drug delivery system was firstly introduced by Teorell in 1937 (Teorell, 1937). Accordingly, the ideal drug release profiles must be greater than the minimum effective concentration but less than the minimum toxic concentration. It is noteworthy to mention that sustained release systems have advantages of improving “efficacy” and “safety” with long drug duration, fewer doses, and less fluctuation in plasma concentration. In the present study, Fig. 10B presents the sustained drug release behavior from hybrid nanocomposite, taken I/P@BMMs(7)-48 as an example, showing a high drug concentration at the beginning of the treatment, and thereafter presence of the burst release characteristics was noticed, but still existence of the sustained release was confirmed, whereas almost all the drug captured by liver or lung in a very short period gradually entered in the blood circulation after administration by tail intravenous injection. However, the plasma drug concentration profile containing two peaks at different time intervals (0.75 h and 6 h) might be due to the drug accumulation.
4 Conclusions
The mesoporous hybrid P@BMMs with core-shell feature were successfully prepared using P(NIPAM-co-AA) copolymer as a shell and mesoporous BMMs as a core. The various characterizations, such as XRD, TEM, SEM, FT-IR, N2 sorption isotherm, TGA, and elemental analysis, verified the strong dual (pH- and temperature-) responsive performance and presence of ordered mesopores pre and after copolymer-coating. Using IBU as a model, the evolution of fractal structures for obtained P@BMMs, deriving from SAXS patterns showed the transformation behaviors between mass fractal and surface fractal in the drug-loading and releasing durations, demonstrating surface roughness and self-similarity of microstructure. The estimation of their shell thickness stemming from distance distribution profiles elucidated a strong influence on the drug loading capacity, while the release kinetics from I/P@BMMs was fitted in the Korsmeyer-Peppas model with anomalous diffusion mechanism. Hence, how to control shell thickness of P@BMMs is extremely meaningful in controlled drug delivery system. The MTT assay and pharmacokinetic performance suggested that the preparation of core-shell structured P@BMMs could be a promising approach to improve bioavailability of drug as a delivery vehicle with good biocompatibility and non-toxicity.
Acknowledgements
This project was supported by the National Natural Science Foundation of China (21576005 and 21878006). We gratefully acknowledge Dr. Zhihong Li working at the Beijing Synchrotron Radiation Facility for fruitful discussion on SAXS measurements and fractal dimension.
References
- Influences of material characteristics on ibuprofen drug loading and release profiles from ordered micro- and mesoporous silica matrices. J. Chem. Mater.. 2004;16:4160-4167.
- [Google Scholar]
- Small-angle X-ray scattering investigation of submicroscopic porosity with fractal properties. Phys. Rev. Lett.. 1984;53:596-599.
- [Google Scholar]
- SAXS and TEM investigations on thermoplastic nanocomposites containing functionalized silica nanoparticles. J. Sol-Gel. Sci. Technol.. 1998;13:499-502.
- [Google Scholar]
- Encapsulation of inorganic particles by dispersion polymerization in polar media. J. Colloid. Interface. Sci.. 1998;197:293-308.
- [Google Scholar]
- Influence of nanoscale confinement on the molecular mobility of ibuprofen. J. Phys. Chem. C. 2014;118:13857-13868.
- [Google Scholar]
- A ruthenium(II) complex-based lysosome-targetable multisignal chemosensor for in vivo detection of hypochlorous acid. Biomaterials. 2015;68:21-31.
- [Google Scholar]
- A review on Harmonic Wavelets and their fractional extension. J. Adv. Eng. Comput.. 2018;2:224-238.
- [Google Scholar]
- Bioresponsive controlled drug release based on mesoporous silica nanoparticles coated with reductively sheddable polymer shell. J. Chem. Mater.. 2013;25:574-585.
- [Google Scholar]
- pH- and thermo-responsive microcontainers as potential drug delivery systems: Morphological characteristic, release and cytotoxicity studies. Mater. Sci. Eng. C. 2014;37:271-277.
- [Google Scholar]
- Bimodal mesoporous silicas functionalized with different level and species of the amino groups for adsorption and controlled release of aspirin. J. Nanosci. Nanotechnol.. 2011;11:6690-6697.
- [Google Scholar]
- Structural characterization and surface heterogeneity of bimodal mesoporous silicas functionalized with aminopropyl groups and loaded aspirin. Mater. Res. Bull.. 2011;46:1540-1545.
- [Google Scholar]
- Influence of different structured channels of mesoporous silicate on the controlled ibuprofen delivery. Mater. Chem. Phys.. 2012;135:786-797.
- [Google Scholar]
- A new method for the evaluation of small-angle scattering data. J. Appl. Cryst.. 1977;10:415-421.
- [Google Scholar]
- The interpretation of real-space information from small-angle scattering experiments. J. Appl. Cryst.. 1979;12:166-175.
- [Google Scholar]
- Structural characterization of colloidal core-shell polymer-based nanoparticles using small-angle X-ray scattering. J. Chem. Mater.. 2015;27:4763-4771.
- [Google Scholar]
- Synthesis, structure, and morphology of polymer–silica hybrid nanocomposites based on hydroxyethyl methacrylate. J. Polym. Sci. Part B: Polym. Phys.. 2015;37:3172-3187.
- [Google Scholar]
- “Graft to” synthesis and ibuprofen-loading performance of pH-sensitive PMAA–silica hybrid nanoparticles with controlled bimodal mesopores. J. Pharm. Sci.. 2015;104:4299-4306.
- [Google Scholar]
- Fabrication of smart nanocontainers with a mesoporous core and a pH-responsive shell for controlled uptake and release. J. Mater. Chem.. 2009;19:5155-5160.
- [Google Scholar]
- The reduced differential transform and variational iteration methods for 3D diffusion model in fractal heat transfer within local fractional operators. Therm. Sci.. 2018;22:S301-S307.
- [Google Scholar]
- Tailoring surface and structural properties of MCM-41 silicas by bonding organosilanes. J. Phys. Chem. B. 1998;102:5503-5510.
- [Google Scholar]
- Dual (pH- and temperature-) stimuli responsive nanocarrier with bimodal mesoporous silica nanoparticles core and copolymer shell for controlled ibuprofen-releasing: fractal feature and diffusion mechanism. Micro. Meso. Mater.. 2017;254:77-85.
- [Google Scholar]
- P(NIPAM-co-AA) @BMMs with mesoporous silica core and controlled copolymer shell and its fractal characteristics for dual pH- and temperature- responsive performance of ibuprofen release. Int. J. Polym. Mater.. 2018;67:131-142.
- [Google Scholar]
- Regulating dual temperature- and pH-responsibility constructed from core-shell mesoporous hybrid silica (P(NIPAM-co-AA)@BMMs) via adjusting AA incorporation onto NIPAM. Int. J. Polym. Mater. 2019:463-471.
- [Google Scholar]
- Study of core–shell structure of cesium dodecylsulfate micelles using small-angle X-ray and neutron scattering. J. Mol. Liq.. 2012;175:38-43.
- [Google Scholar]
- Biomimetic synthesized bimodal nanoporous silica: Bimodal mesostructure formation and application for ibuprofen delivery. Mater. Sci. Eng. C. 2016;58:1105-1111.
- [Google Scholar]
- Analytical study of exact solutions of the nonlinear Korteweg-de Vries equation with space-time fractional derivatives. Mod. Phys. Lett. B. 2018;32:1850012.
- [Google Scholar]
- Investigation of pore structure and fractal characteristics of organic-rich Yanchang formation shale in central China by nitrogen adsorption/desorption analysis. J. Nat. Gas. Sci. Eng.. 2015;22:62-72.
- [Google Scholar]
- Local fractional homotopy analysis method for solving non-differentiable problems on Cantor sets. Adv. Differ. Equ.. 2019;1:127-149.
- [Google Scholar]
- Kinetics of the formation of 2D-hexagonal silica nanostructured materials by nonionic block copolymer templating in solution. J. Phys. Chem. B. 2011;115:11330-11344.
- [Google Scholar]
- Formation mechanism of gold nanoparticles synthesized by photoreduction in aqueous ethanol solutions of polymers using in situ quick scanning X-ray absorption fine structure and small-angle X-ray scattering. Cryst. Growth. Des.. 2016;16:1200-1212.
- [Google Scholar]
- In situ time-resolved SAXS study of the formation of mesostructured organically modified silica through modeling of micelles evolution during surfactant-templated self-assembly. Langmuir. 2012;28:17477-17493.
- [Google Scholar]
- In situ synchrotron SAXS/XRD study on the formation of ordered mesoscopic hybrid materials with crystal-like walls. J. Chem. Mater.. 2004;16:5564-5566.
- [Google Scholar]
- MCM-41 organic modification as drug delivery rate regulator. J. Chem. Mater.. 2003;15:500-503.
- [Google Scholar]
- Gold-embedded photosensitive liposomes for drug delivery: Triggering mechanism and intracellular release. J. Control. Release. 2010;147:136-143.
- [Google Scholar]
- An efficient hybrid computational technique for solving nonlinear local fractional partial differential equations arising in fractal media. Nonlinear Eng.. 2018;7:229-235.
- [Google Scholar]
- Controlled release of captopril by regulating the pore size and morphology of ordered mesoporous silica. Micro. Meso. Mater.. 2006;92:1-9.
- [Google Scholar]
- Simultaneous determination of four bioactive compounds in Glechoma longituba extracts by high performance liquid chromatography. Pharmacogn. Mag.. 2013;9:216-219.
- [Google Scholar]
- Formation of nanostructured silica materials templated with nonionic fluorinated surfactant followed by in situ SAXS. Langmuir. 2013;29:2007-2023.
- [Google Scholar]
- Outset of the morphology of nanostructured silica particles during nucleation followed by ultrasmall-angle X-ray scattering. Langmuir. 2016;32:5162-5172.
- [Google Scholar]
- Shape and size controlled synthesis of MOF nanocrystals with the assistance of ionic liquid mircoemulsions. Langmuir. 2013;29:13168-13174.
- [Google Scholar]
- Physical state and dissolution of ibuprofen formulated by co-spray drying with mesoporous silica: effect of pore and particle size. Int. J. Pharm.. 2011;410:188-195.
- [Google Scholar]
- Modeling of drug release from delivery systems based on hydroxypropyl methylcellulose (HPMC) Adv. Drug Deliver. Rev.. 2001;48:139-157.
- [Google Scholar]
- Formation mechanism of silver nanoparticles stabilized in glassy matrices. J. Am. Chem. Soc.. 2012;134:18824-18833.
- [Google Scholar]
- A reliable algorithm for a local fractional tricomi equation arising in fractal transonic flow. Entropy. 2016;18:206-214.
- [Google Scholar]
- Mesoporous silica nanoparticles for drug delivery and biosensing applications. J. Adv. Funct. Mater.. 2007;17:1225-1236.
- [Google Scholar]
- Background subtraction and moments of the microscopic density fluctuation. J. Appl. Cryst.. 2002;35:220-227.
- [Google Scholar]
- Characterization of surface roughness of MCM-41 using methods of fractal analysis. Langmuir. 1999;15:4603-4612.
- [Google Scholar]
- Dependence of copolymer composition, swelling history, and drug concentration on the loading of diltiazem hydrochloride (DIL.HCl) into poly[(N-isopropylacrylamide)-co-(methacrylic acid)] hydrogels and its release behavior from hydrogel slabs. J. Control. Release. 2005;102:595-606.
- [Google Scholar]
- Synthesis of bimodal nanostructured silicas with independently controlled small and large mesopore sizes. Langmuir. 2003;19:8395-8402.
- [Google Scholar]
- Fabrication of PDEAEMA-coated mesoporous silica nanoparticles and pH-responsive controlled release. J. Phys. Chem. C. 2010;114:12481-12486.
- [Google Scholar]
- Kinetics of distribution of substances administered to the body. I. The extravascular modes of administration. Arch. Int. Pharmacodyn. Therapy. 1937;57:205-240.
- [Google Scholar]
- Functionalization of mixed ligand metal-organic frameworks as the transport vehicles for drugs. J. Colloid Interface Sci.. 2017;486:128-135.
- [Google Scholar]
- On the formation mechanism of pluronic-templated mesostructured silica. J. Phys. Chem. C. 2010;114:3483-3492.
- [Google Scholar]
- Synthesis and functionalization of a mesoporous silica nanoparticle based on the sol-gel process and applications in controlled release. J. Chem. Res.. 2007;40:846-853.
- [Google Scholar]
- Mesoporous silica core–shell composite functionalized with polyelectrolytes for drug delivery. Micro. Meso. Mater.. 2015;213:134-141.
- [Google Scholar]
- Facile synthesis and fractal feature of pH-responsive poly(acrylic acid) hollow microspheres for ibuprofen delivery. Int. J. Polym. Mater.. 2017;67:896-904.
- [Google Scholar]
- Size-controlled synthesis of colloidal silver nanoparticles based on mechanistic understanding. J. Chem. Mater.. 2013;25:4679-4689.
- [Google Scholar]
- Time-resolved small-angle X-ray scattering study on the growth behavior of silver nanoparticles. J. Phys. Chem. C. 2014;118:11454-11463.
- [Google Scholar]
- Local fractional similarity solution for the diffusion equation defined on Cantor sets. Appl. Math. Lett.. 2015;47:54-60.
- [Google Scholar]
- A new computational approach for solving nonlinear local fractional PDEs. J. Comput. Appl. Math.. 2018;339:285-296.
- [Google Scholar]
- Exact travelling wave solutions for the local fractional two-dimensional Burgers-type equations. Comput. Math. Appl.. 2017;73:203-210.
- [Google Scholar]
- New rheological models within local fractional derivative. Rom. Rep. Phys.. 2017;69:113-124.
- [Google Scholar]
- A new insight into complexity from the local fractional calculus view point: modelling growths of populations. Math. Meth. Appl. Sci.. 2017;40:1-6.
- [Google Scholar]
- Exact traveling-wave solution for local fractional Boussinesq equation in fractal domain. Fractals. 2017;25:1740006.
- [Google Scholar]
- On exact traveling-wave solutions for local fractional Korteweg-de Vries equation. Chaos. 2016;26:084312.
- [Google Scholar]
- On a fractal LC-electric circuit modeled by local fractional calculus. Commun. Nonlinear Sci. Numer. Simulat.. 2016;47:200-206.
- [Google Scholar]
- Monodisperse temperature-sensitive microcontainers. Adv. Mater.. 2002;14:1090-1092.
- [Google Scholar]
- pH-responsive ibuprofen delivery in silane-modified poly(methylacrylic acid) coated bimodal mesoporous silicas. Mater. Res. Bull.. 2014;53:266-271.
- [Google Scholar]
Appendix A
Supplementary material
Supplementary data to this article can be found online at https://doi.org/10.1016/j.arabjc.2019.06.012.
Appendix A
Supplementary material
The following are the Supplementary data to this article:Supplementary data 1
Supplementary data 1


