

Translate this page into:
Fractal geometry analysis of chemical structure of natural starch modification as a green biopolymeric product
⁎Corresponding author. Mobile: +98 9126733708. Sarkheil_h@yahoo.co.uk (Hamid Sarkheil)
-
Received: ,
Accepted: ,
This article was originally published by Elsevier and was migrated to Scientific Scholar after the change of Publisher.
Peer review under responsibility of King Saud University.
Abstract
Public concerns and official pressures around environmental protection as well as exhausting petroleum resources have brought about preferences in studying and applying environmental-friendly polymers instead of synthetic petroleum-based polymers. For this aim, biopolymers can have outstanding advantages in biodegradability by saving time, energy and effort spent on increasingly costs of polymeric wastes. Natural starch (being studied in this work), as one of the most abundant natural resources for polymer materials, is inexpensive and biodegradable. As starch necessarily needs for modifications and processing before being used as ideal green polymer material, it is vital to perform feature extraction and defect detection measures in structure by some method like image analysis. Fractal as a new geometry has circumstantially progressed recently in the fields of image processing, physical space–time, medical image analysis, electrochemical patterns, digital images, sounds etc. Box Count Fractal Dimension as a very important and popular part of fractal geometry can be a useful factor in feature extraction and pattern recognition. This paper presents a new method for defect detection in the structure of natural starch modification images using the fractal dimension (FD) along with mean and standard deviation of image color. This is performed via feature extraction based on artificial intelligence by MatLab R2013a for box counting algorithms. Otsu’s graythresh method by MatLab R2013a is applied to binarize the images. The results of proposed methodology are illustrated as log–log curves where the fractal dimensions are recognized by curve fitting (CF) tool with more than 95% accuracy. The outputs express that starch samples’ FD vary in the range from 1.636 to 1.926 among which the last is identified as non-defective polymer. Non-defective feature is of great importance for quality control measures and chemical reactivity being here highlighted as biodegradability.
Keywords
Image analysis
Natural starch
Fractal dimension FD
Box counting
Pattern recognition
Computer program

1 Introduction
Increasing interest has been cast upon the research of biopolymers because of the environmental pressure of using lesser amounts of synthetic petroleum-based polymers. Most petroleum-based polymeric products are not biodegradable. It usually takes several decades, even centuries, for nature to decompose these polymeric materials. Much energy and effort spent on the landfill of polymeric wastes could be saved by using biodegradable polymer products. Besides environmental pressure, exhausting petroleum resources also drive the researchers to look for alternative resources for polymer materials. Biopolymeric products manufactured from natural resources, such as starch and cellulose, can offer the polymer industry inexhaustible and green resources. Natural starch, as one of the most abundant natural resources for polymer materials, is inexpensive and biodegradable. With necessary modification and processing, starch can be used as ideal “green” polymer material that comes from nature and readily goes to nature. Present paper is schematically illustrated as Fig. 1. Accordingly, the fractal dimension of nonwoven images is calculated for feature extraction. After that, an artificial neural network is implemented for defect detection and classification. Otsu’s method (Quarteroni and Saleri, 2006) utilized by MatLab R2013a is prepared for converting the images to binary type. Using numbers of the possible defect classes, the system may be enhanced to give consistent and repeatable results in the experimental and real industrial implementations.
Present study schematic perspective.
Mandelbrot introduced the perception of fractal sets (Mandelbrot, 1977), which enables to consider the degree of regularity of the organizational structure related to the physical system’s behavior. A well known property among fractal objects is their measured metric properties, such as length or area being relative to the scale of measurement. An introduced example for naming property is the ‘‘length” of a coastline (Mandelbrot, 1967). Based on the principles of geometry, different activities can be brought into account as image process, in other words, can be used for images countable that create a pixel format. Development of fast and specialized equipment, however, has facilitated the application of image processing algorithms to real-world industrial inspection problems. Industrial vision systems must operate in real-time, produce a low false alarm rate and be flexible to accommodate variations in inspection sites.
Chemical modification is an alternative approach to making starch thermoplastic. Side chains can be introduced into the starch molecules through chemical reactions between the hydroxyl groups and functional groups. The side chains interrupt the hydrogen bonds between the hydroxyl groups of starch and destroy the granular semicrystalline structure of natural starch. The mobility of starch molecules is enhanced so that the glass transition temperature and the melting temperature can be lowered.
Furthermore, the decreasing number of available hydroxyl groups and the introduction of hydrophobic functional groups make the starch hydrophobic.
Many attempts have been made to solve these problems. An optical system for real time defect detection is shown in paper of Olsson and Gruber (1993). It is based on light scattering and uses electro-optical equipment for defect detection. Dar et al. (1997) present a system for detecting one type of defect (pilling) in the five grades. The Radon transform is used for feature extraction and fuzzy logic is implemented for rating. Escofet et al. (1998)analyze a variety of defects in different fabrics and in every case, the flaws are finally segmented from the background, while Gabor functions are used for feature extraction. Mueller and Nickolay (1994) use the morphological image processing for gray-level inspections. The system of Huart et al. (1994) has use of multi-cameras with associated hardware. Group of researches in Georgia Institute of Technology implement the wavelets transform and fuzzy logic to solve this task. Stojanovic et al. (1998) describe simple system, based on fast binary algorithm to determine possible defect regions and use neural network to classify the defect. Campbell in 1997 present 2D Discrete Fourier Transform to feature extraction and feed forward neural network to classification. Pakkanen et al. (2004) use the MPEG-7 standard feature descriptor and evolving tree self organizing map for defect image classification. Amet et al. (2000) use co-occurrence matrix for feature extraction and defect inspection. Serdaroglu et al. use wavelet packet transform to feature extraction of images and Euclidean distance for defect detective. Karras et al. (1998) present the feature extraction method which is based on wavelets transform, SVD analysis, and co-occurrence matrix.
2 Natural starch
Starch is a carbohydrate material that can be hydrolyzed into small molecules by specific enzymes during animal metastasis, generating biological energy for animals. Many plants, in their fruits, seeds, tubers or rhizomes, grow with starch. Potato, corn, wheat and rice are major resources for production of starch worldwide.
2.1 Compositions of natural starch
Starch contains two major components: one is amylose, which is a linear polymer, and the other is amylopectin, which is a highly branched polymer. The repeat units in both amylose and amylopectin are identical (so-called α-d-glucosyl residues) but connected in different ways, as given in Fig. 2. Most starches contain 20–30 wt% of amylose, although some waxy starches contain very little amylose. In amylose, α-d-glucosyl residues are linked by an α[1 → 4] bond. Typically, the molecular weights of extracted amylose are in the order of 105–106 g/mol. Amylose generally is recognized as linear macromolecule. However, it has been reported that there is a slight degree of branching (9–20 branch points per molecule) in amylose from various botanical sources. The length of side chains ranges from 4 to over 100 repeat units. There is no effective way of separating the branched amylose from the linear amylose.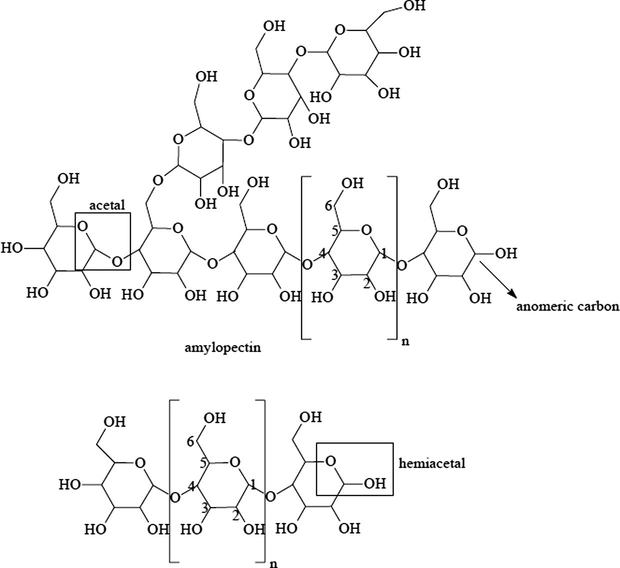
Chemical structures of amylose and amylopectin.
As described above, the linear polysaccharide chains tend to have helix structure either left-handed or right-handed. The left-handed form is energetically preferred to the right-handed form. There are two ways the helical molecule is packed in the crystalline phases of starch: A-type and B-type, as shown in Fig. 3. In both A- and B-type crystals, the helices are packed parallel. Besides A-type and B-type crystalline structures in natural starches, previous researchers also found Vh-type crystalline structure in starch complex formed between the single helix of amylose molecules with compounds, such as iodine, dimethyl sulfoxide (DMSO), alcohol, and fatty acid. In such complexes, iodine atoms or the hydrocarbon part of alcohol or fatty acid is held by the hydrophobic inner surface in the helix. Then these complexes are packed parallel in an orthorhombic unit cell.
Two major types of crystalline structure in the natural starch granules: A-type and B-type.13 (Reprinted with permission from Elsevier) (Smith et al., 2005).
2.2 Starch degradation and starch applications
Starch chains are to be phosphorylated in order to be degraded by enzymes. One enzyme type: glucan, water dikinase “GWD” phosphorylates the C-6 position in glucose molecule. Another enzyme: phosphoglucan, water dikinase “PWD” phosphorylates C-3 position. If starch is not phosphorylated, it accumulates in the plastid.
Maltose as the main product of degradation is made by activity of enzyme: beta-amylase “BAM” at non-reduced end of glucose after being phosphorylated.
When the glucose chain has three or less molecules, BAM cannot produce maltose. Another enzyme, disproportionating enzyme-1 “DPE1”, combines two maltotriose molecules and releases glucose molecule. Then BAM releases another maltose molecule from the remaining chain. This process proceeds to completely degrade starch (Smith et al., 2005).
Starch is most widely used as food additive in food industry. On the other hand, Papermaking can be served as the largest non-food application of starches. Starch is also used in making adhesive agent (glues), clothing industry, textile industry, synthetic bioplastic formations, biofuel production via wet milling and so on.
3 Theories and image analysis algorithms
3.1 Geometry, fractal geometry and dimension
In 1623, Galileo expressed that the book of nature was written in mathematic languages and the alphabets of this language is triangles, circles and other geometrical shapes, that human being could not understand it carefully. Euclidean geometry is a mathematical system attributed to the Alexandrian Greek mathematician Euclid, which he described in his textbook on geometry: the elements. The Euclidean geometry is the axiomatic study of lines, circles and triangles that shaped form an ideal, therefore approximate basis for understanding geography, mechanics and every real thing. From this perspective, nature is like noisy mathematics and crumpled slightly out of focus.
At 18’th century “Euler” discussed a generalization of Euclidean geometry called “affine geometry”. The 19’th century’s most outstanding progress in geometry occurred when, around 1830, János Bolyai and Nikolai Ivanovich Lobachevsky separately published on non-Euclidean geometry – a newly made realm in that time, in which the parallelism is not right. Einstein’s theory of general relativity shows that the true geometry of spacetime is not Euclidean geometry. For example, if a triangle is constructed out of three rays of light, then in general the interior angles do not add up to 180 degrees because of gravity.
At 20th century, controversial works were produced on non-Archimedean models of Euclidean geometry, in which the distance between two points might be infinite or infinitesimal, in the Newton–Leibniz sense.
The name “fractal” in geometry was first invented by mathematician Benoît Mandelbrot in 1975.
Fractal geometry creates an alternative to Euclidean geometry whose elements are not lines and circles but iterations, replications and self-resemblance, whose surfaces are not smooth but jagged, whose features are not perfect but broken. Fractal is a new geometry with capability to understand formerly inexplicable real world phenomena. Fractal provides insight into the distribution of galaxies, the shape of coastlines and growth of crystals. In nature, it can be seen more fractal object such as fern, cauliflowers, clouds, trees and so on.
The fractal objects have distinctive boundaries that occupied the constant volume or space.
Fractals are different from other geometric figures because of the way in which they scale. Doubling the edge lengths of a square scales its area by four, which is two to the power of two, because a square is two-dimensional. Likewise, if the radius of a sphere is doubled, its volume scales by eight, which is two to the power of three, because a sphere is three-dimensional. If a fractal’s one-dimensional lengths are all doubled, the spatial content of the fractal scales by a power of two that is not necessarily an integer (Mandelbrot, 1983).
Fractal dimension can define any changing in the details of object. Until now, many fractal dimensions were introduced with special applications (Mandelbrot, 1983). Generally the fractal dimension is changed between 0 and 3 and takes a real amount. For curve specifically, this varies between one up to two and for surface changes from two to three. The fractal dimension shows freedom’s degree of object. From the perspective of some application and also the concept that is used in present research, fractal dimensions can be used instead of human vision in some systems. So using this concept, it is very useful for object’s pattern investigation. Some of the most important and useful fractal dimensions are box counting, compass and self-similar methods. Although, the applied algorithms differ from method to other, they obey to the same basis summarized by following four steps according to Fig. 4:
-
Prepare the suitable image with adjusted zooming and pixel.
-
Measure the quantities of the object using various step sizes (S and a function of S: f(S)).
-
Plot log (measured quantities) vs. log (step sizes) after calculations.
-
Fit a regression line (like by least-squares) through the data points and estimate FD as the slope of the regression line.
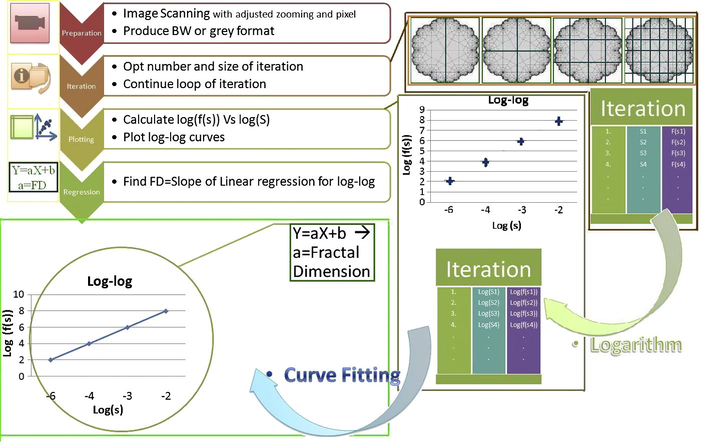
- Fractal dimension computing methods’ main algorithm.
3.2 Box counting dimension (BC)
The box counting method defined by Russel et al. (1980), is the most applied and most popular method in fractal geometry. Box counting dimension used in many applications in different systems. It is related to self-similarity structures, but it can be applied even to the random structure without a conspicuous self-similar unit, like a coastline. For determining box counting dimension (DB), it is assumed that the object is covered by a square mesh of various sizes “s” and then number of boxes (N(s)) containing part of the image (containing the object) is counted. Because N is the function of the mesh size, N(s) increases as s decreases. The box counting dimension (DB) is given by the slope of the linear portion of a log(N(s)) vs. log(1/s) graph as expressed by Eq. (1):
Recent studies on box count notes: as the reiteration for different sizes of s can produce various sizes of N(s), the grid should be randomly relocated at each iteration (Appleby, 1996). More recently, Pruess (2007) showed that the computation of the FD is box size sensitive.
3.3 Differential box-counting method (DBCM)
Differential box-counting method (DBCM) proposed by Chaudhuri and Sarkar (1995) is an adaptation or modification of popular box count method. As it aims to solve some of limitations of the BM method, it has tendency to work on gray-scale images instead of binarization of images. The procedure of the method is just like the BC method with difference that the image itself is partitioned into boxes of various size s and N(s) is computed like the difference between the minimum and the maximum gray levels in the (i, j)th box. Then FD is calculated by logarithmic formula (1).
Some limitation in the box-counting methods is the optimization of the box size. Many studies were done to find the upper and lower bounds for the box size. Chen et al. (1993) proposed a theoretical justification for a restriction on the smallest box size inspired by the work of (Pickover and Khorasani, 1986). Also Bisoi and Mishra (2001) established a lower bound of the box size to ensure accurate results.
3.4 Compass dimension
The compass dimension is a relationship between the compass divider setting and measured length. To measure the length of the random fractal curve, a compass divider must divide by a compass divider or ruler with certain ruler setting. If multiplying the ruler length by the number of rulers that is needed to cover the object’s image length, the approximate length of a curve can be expressed as Eq. (2):
By decreasing the length of rulers, the more accurate length of the curve can be obtained, because of the closer measurement to the path of the curve. So if we plot ln (L) against ln (L) for a range value of l, the slope will be an estimation for the compass dimension (DC).
3.5 Area measurement methods
Area measurement methods upon their name continue the work of box count methods by using some elements (triangle, erosion, dilatation,…) of various scales “s” and compute the area A(s) of the image intensity surface at scale “s” instead of filled box number N(s). In this case FD is the slope of the best fitting line at the points (log(s), log(A(s))) synonymous to BC (log(1/s), log(N(s))). In this method, three algorithms are frequent. Table 1 presents a history of these 3 classes. Isarithm dependence Only 2D case Dependence on directions: rows, column, cardinal Gray level case 3D case Asymmetric identified anisotropic Underestimates FD Sensitive to noise or extreme gray-level
Area measurement
Initiator
Procedure
Advantages
Disadvantages
Isarithm method (IM)
Shelberg et al. (1983)
Define the complexity of Isarithm for 2D. Isarithm FD comes from Walking Divider
Analyzing nonself-similar surfaces
ImageFD = mean(isarithmFD) + 1
Blanket method (BM)
Peleg et al. (1984)
Upon Mandelbrot’s method and ultimately upon Minkowski’s sausage logic. Defined by dilatation and erosion of the image
Limited to relatively low theoretical FD
Triangular prism method (TPM)
Clarke (1986)
Compares the surface areas of triangular prisms with the pixels area (step size squared) in log–log
Fastest method with more accuracy
4 Experimental
4.1 Materials
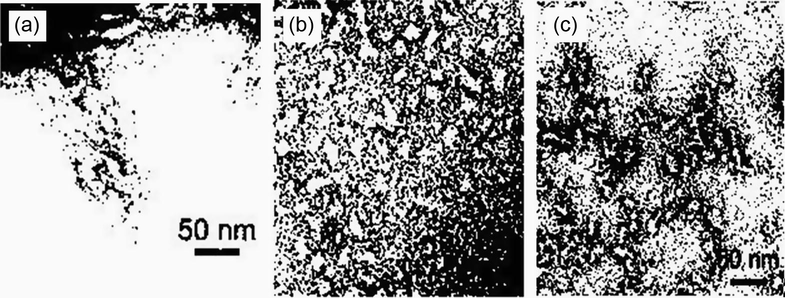
In present study the sample of structure of natural starch before and after modification was used for investigation and analysis. A microscanner was utilized for taking photograph from natural starch before and after modification at best resolution. The scanning resolution was set to 200 dpi which provides parallel lighting inspection with no shadows on them.
4.2 Computer program, feature extraction
For feature extraction, one MatLab R2013a code is composed to find box count dimension by preparing BW images, rescaling them for some steps and then using linear regression. The size of all the images is the same and is 128 × 128 pixels. Images were covered with boxes then by changing the size of boxes in 30 steps it is found how the number of boxes changes with the size of the boxes. The number of steps are raised up to 30 in order to have more precision. In Fig. 6, the results of transformation are shown. These figures are prepared by a function of MatLab R2013a being Otsu’s method for converting types of images to black and white images illustrating in followings:
The “level = graythresh(I)” computes a global threshold (level) that can be used to convert an intensity image to a binary image with “im2bw”. level is a normalized intensity value that lies in the range [0, 1].
The graythresh function uses Otsu’s method, which chooses the threshold to minimize the intraclass variance of the black and white pixels. By following code the images in Fig. 5 are converted to BW type presented in Fig. 6:
The sample images of natural starch before and after modification: (a), (b) and (c).
The conversion code and sample images of natural starch for box counting calculation: (a), (b) and (c).
After converting the images into black and white type, the box counting fractal dimension of each image is defined by horizontal and vertical meshing grid. The array BW of each image is reboxed by averaging via a “for loop” with 30 repetitions. Reboxing performance is schematically shown according to Fig. 7 for 3 steps.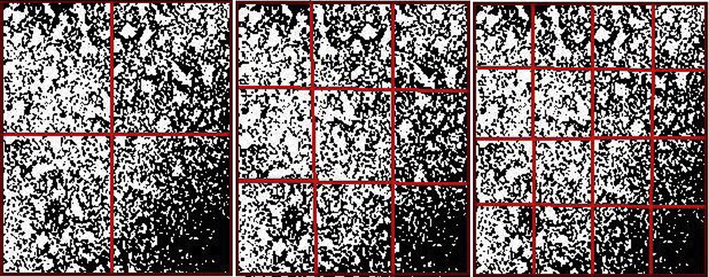
Three steps of meshing for sample b.
In code, the average amounts of pixel color in each box are calculated which is a real number between 0 and 1. If the number is smaller than 0.5 the box is more black and it is inferred that it is occupied by body otherwise it is empty. Then after each boxing (meshing) and calculation, produced vectors of “vectorS” and “vectorN” are brought to curve fitting tool in MatLab to find the slope of best line passing through naming vectors as following:vectorS = Log(1/s); vectorN = Log(N(s)); vectorN = DB × vectorS;
where:
-
“s” is new-meshed array size vector = [S1, S2, …, S30];
-
N(s) is the vector of total numbers of filled boxes = [N(S1), N(S2), …, N(S30)];
-
vectorS = [Log(1/S1), Log(1/S2), …, Log(1/S30)];
-
vectorN = [Log(N(S1)), Log(N(S2)), …, Log(N(S30))];
-
DB is box counting dimension being the slope of fit line passing through vectorS and vectorN
4.3 Result and discussion
The graphs of Fig. 8 show the results of applying the fractal algorithm on naming images. They represent the best fit line with slope of DB.
The box counting dimension of images (a), (b) and (c) in study.
In table No. 2 the results of CF (curve fitting) tool are presented for study images. The second column represents the fit slopes by “Center and scale” method – a method proposed by Matlab CF tool – in which data meet linear regression around mean −4.712 by standard deviation of 1.676. Columns 4 and 5 represent statistical data for pixels of BW images. Color of a binary image is 0 (Black) or 1 (White). Column 4 shows the mean color of pixels in study images and column 5 is the standard deviations of pixel colors.
According to box count results of Table 2 and binary images of Fig. 6, the following notes are perceived: The order of fractal dimensions from low to high is: c < a < b which shows the degree and quality of fractal activity in order such that sample b has the most amount of complexity and replications while sample c has the least amount of fractal presence and iterated divisions. However the fractal dimensions of a and c are approximately close to each other. On the other hand, the order of mean pixel color for samples is: b < c < a which shows sample b is most black and is most filled by body whereas sample a is most white and is most empty. It is inferred that sample b has complex and well-woven texture among the samples as it has more objects and is also more fractal. This matter can be found by a rather high amount of std = 0/4770 because it represents a high amount of distribution of color pixels in figure that means more weight is more dispensed all over the geometry.
DB (Center and Scale)
Confidence bounds (%)
Mean (color)
Std
A
1.74 (1.705, 1.775)
95
0.8054
0.3751
B
1.926 (1.859, 1.993)
95
0.4916
0.4770
C
1.607 (1.577, 1.636)
95
0.5871
0.4780
Among samples, the modified sample b has FD approximately equal to 2 (a two dimensional case) which is the most suitable pattern for biodegradability based on having a well-distributed structure with more surface area needed for biological and environmental activities. Indeed raising the amount of fractal dimension increases reactivity and so biodegradability. It is noticeable that the samples are classified as distinctive terms: “non-defective” for sample “B” and “thin Spot” for samples “A” and “C” according to neural network algorithm working with 3 parameters naming FD, Mean and Std of processed images (P1, P2 and P3) as shown in Fig. 9.
The structure of neural network.
Defect detections extracted by Neural Network are classified into four divisions as 1: non-defective, 2: thin Spot, 3: Thick Spot, 4: Neps.
On the other hand about industrial applications of polymers could be stated: different kinds of defects found in an analyzed sample make inability and incapacity of sample texture to play role of container package and contact exposure and hence, qualified product needs for non-defective feature and classification due to design philosophy and quality control. In terms of material mechanics, polymer microstructure must be designed so geometrically that exerted forces and stresses can find suitable equilibrium based on their structure capacity, just as a firm steel structure or a mechanically-designed framework is in statics. Here the importance of fractal geometry is appreciated by providing scientific tool of FD to quantify geometry measurements. The more regularly the microstructure is branched, in a more sophisticated mechanics the structure will sustain loads and forces.
5 Conclusion
New world is so dependent upon integration of different parts of science and various fields of study and it requires innovative methodologies indeed the most. New geometry (fractal) initiated by Mandelbrot is a very applicable field being served as precursor and guide for other knowledges such as image processing, medical image analysis, physical space–time, chemical and composite pattern recognition and material defect detection. Present study which comprises various fields of study naming: biopolymer, image analysis and computer programming in conjunction with environmental requirements and needs for savings; aims to link the fields to achieve well-prepared defect detections for natural starch via feature extraction by fractal geometry. By popular box counting method performed in MatLab code, fractal dimension (FD) of starch samples could be found. They represent structure complexity and fractal activity of samples being fair representatives for biodegradability of industrial modified biopolymers.
As a not-hardly-procured biopolymer, Natural starch can be a suitable alternative for petroleum-based polymers which readily comes from nature and readily returns the nature. It can not only lower the raw material price and process cost in polymer production but also lower or even eliminate the additional indirect costs of non-degradability and environmental pollutions of common polymers. The study results express that natural starch might exhibit moderately close dimensions and rather similar patterns while modification can enhance the geometric dimension and so biodegradability. Among samples, the rather two-dimensional case ‘b’, classified as non-defective, is a fair opt for biopolymer application because of regularities in its geometry. Of great advantages of proposed methodology would be the hitech capability for being applied as computer-based quality control unit in industrial manufacturing plants. In fact, Non-defective classification is of great importance for industrial product quality and chemical reactivity – biodegradability – for surface area provision.
Based on the study, it is highly advised to utilize “Otsu’s” and “Center and Scale” methods by MatLab for binarizations and Linear Regressions correspondingly so that the results meet proper exactness and sophistication. Besides the main objectives of the study are areas under discussion as explanations of geometries’ specifications as well as scoping FD measuring methods algorithms.
References
- An efficient method for texture defect detection: subband domain co-occurrence matrices. Image Vision Comput.. 2000;18:543-553.
- [Google Scholar]
- Multifractal characterization of the distribution pattern of the human population. Geogr. Anal.. 1996;28:147-160.
- [Google Scholar]
- On calculation of fractal dimension of images. Pattern Recogn. Lett.. 2001;22:631-637.
- [Google Scholar]
- Texture segmentation using fractal dimension. IEEE Trans. Pattern Anal. Mach. Intell.. 1995;17:72-77.
- [Google Scholar]
- On the calculation of fractal features from images. IEEE Trans. Pattern Anal. Mach. Intell.. 1993;15:1087-1090.
- [Google Scholar]
- Computation of the fractal dimension of topographic surfaces using the triangular prism surface area method. Comput. Geosci.. 1986;12:713-722.
- [Google Scholar]
- Automated pilling detection and fuzzy classification of textile fabrics. Proc. Mach. Ind. Inspect. SPIE. 1997;3029:26-36.
- [Google Scholar]
- Detection of local defects in textile webs using Gabor filters. Opt. Eng.. 1998;37:2297-2307.
- [Google Scholar]
- Integration of computer vision on to weavers for quality control in the textile industry. Georgia Inst. Technol. SPIE. 1994;2183:155-164.
- [Google Scholar]
- Supervised and unsupervised neural network methods applied to textile quality control based on improved wavelet feature extraction techniques. Int. J. Comput. Math.. 1998;67:169-181.
- [Google Scholar]
- How long is the coast of Britain? Statistical self-similarity and fractional dimension. Science. 1967;156:636-638.
- [Google Scholar]
- Mandelbrot, B., 1975. Les objets fractals: forme, hasard et dimension. Flammarion (Ed.), Paris, pp. 208.
- Mandelbrot, B., 1977. Fractals: Form. Chance and Dimension. Freeman (Ed.), pp. 365.
- Freeman, ed. The Fractal Geometry of Nature. Macmillan; 1983. p. :468.
- Morphological image processing for the recognition of surface defects. Proc. SPIE. 1994;2249:298-307.
- [Google Scholar]
- Web process inspection using neural classification of scattering light. IEEE Trans. Ind. Electron.. 1993;40:228-234.
- [Google Scholar]
- The evolving tree – a novel self organizing network for data analysis. Neural Process. Lett.. 2004;20:199-211.
- [Google Scholar]
- Multiple resolution texture analysis and classification. IEEE Trans. Pattern Anal. Mach. Intell.. 1984;6:661-674.
- [Google Scholar]
- Some remarks on the numerical estimation of fractal dimension. In: Barton C.C., La Pointe P.R., eds. Fractals in the Earth Sciences. Vol vol. 3. New-York: Plenum Press; 2007. p. :65-75.
- [Google Scholar]
- Fractal characterization of speech waveforms graphs. Comput. Graphics. 1986;10:51-61.
- [Google Scholar]
- Scientific Computing with MATLAB and Octave. Springer; 2006.
- Shelberg, M., Lam, N., Moellering, H., 1983. Measuring the fractal dimension of surfaces. In: Proceedings of the Sixth International Symposium on Computer-Assisted Cartography Auto-Carto, vol. 6, pp. 319–328.
- Stojanovic, M., Proakis, J. G., Rice, J.A., Green, M.D., 1998. Spread spectrum underwater acoustic telemetry. In: Proceedings of Oceans 98, Nice, France September 28–October 1, vol. 2, pp. 650–654.


