

Translate this page into:
Graphene oxide/ZnO nanocomposites for efficient removal of heavy metal and organic contaminants from water
⁎Corresponding authors. Sasandan@gmail.com (Sasan Dan), hashemipur@yahoo.com (Hassan Hashemipour) h.hashemipour@vru.ac.ir (Hassan Hashemipour)
-
Received: ,
Accepted: ,
This article was originally published by Elsevier and was migrated to Scientific Scholar after the change of Publisher.
Abstract
The graphene oxide-zinc oxide (GO-ZnO) nanocomposite was fabricated and applied as the adsorbent to survey the adsorption characteristics of the adsorbates of organic and inorganic water contaminations in an aqueous solution. The synthesized nanocomposite has been characterized using X-ray powder diffraction (XRD) and Scanning electron microscope (SEM), indicating that the nanocomposite was synthesized successfully. The impact of the initial solution concentrations and pH was investigated, indicating that the synthesized compound has a high adsorption capacity and capability to remove both organic and inorganic contamination. The kinetic adsorption could also be well described by Pseudo-second-order (PSO) kinetic expressions. The equilibrium adsorption findings indicated that the Langmuir was more suitable than Temkin, Freundlich, and Flory-Higgins models. High adsorption capacity of 99.00, 125, 121.95 and 277.78 mg/g respectiviety for Methylene blue (MB), Methyl orange (MO), Cd2+, and Pb2+ The antibacterial assay was also performed using Staphylococcus aureus and Escherichia coli in which the ZnO nanocomposite proved to be an effective Bactericide that inhibits the growth of bacteria. The obtained results indicated that the synthesized GO-ZnO nanocomposites are ideal adsorbents for the MB, MO, Cd2+, and Pb2+ removals in an aqueous solution.
Keywords
Graphene oxide
ZnO nanocomposite
Water contamination
Water treatment

Nomenclature
- CFU
-
Colony-forming units
- GO
-
Graphene oxide
- GO-ZnO
-
Graphene oxide-zinc oxide
- MB
-
Methylene blue
- MO
-
Methyl orange
- SDS
-
Sodium dodecyl sulfate
- SEM
-
Scanning electron microscope
- XRD
-
X-ray powder diffraction
- ZnO
-
Zinc oxide
- G°
-
Gibbs free energy (kJ.mol−1)
- bT
-
Temkin constant relating to the adsorption heat (J.mol−1)
- Ce
-
Concentration at equilibrium time (mg.L-1)
- Ci
-
Concentration at the initial time (mg.L-1)
- k1
-
The pseudo-first-order rate constant (min.−1)
- k2
-
Pseudo-second-order rate constant (g.mg−1.min.−1)
- KF
-
Freundlich empirical constant [(mg.g−1)(L.mg−1)1/n]
- KFH
-
The flory-Huggins equilibrium constant (L.mol−1)
- KL
-
Langmuir constant (L.mg−1)
- KT
-
Temkin isotherm constant (L.g−1)
- nF
-
Adsorption intensity
- nFH
-
Number of adsorbates occupying adsorption sites
- qCal.
-
Calculated adsorption capacity (mg.g−1)
- qe
-
Sorption capacity at the equilibrium time (mg.g−1)
- qExp.
-
Experimental adsorption capacity (mg.g−1)
- qMax.
-
Maximum adsorption capacity (mg.g−1)
- qt
-
Sorption capacity at time t (mg.g−1)
- R2
-
Coefficient of determination
- RL
-
Langmuir separation factor
- θ
-
Degree of surface coverage
- λ
-
Wavelength (nm)
1 Introduction
The rapid process of industrialization as well as population growth in the last half century has made planning and action to solve the problem of water shortage and water pollutants one of the main priorities for countries. According to the United Nations Global Water Development Report 2020, it is estimated that the water demand of manufacturing industries will increase significantly by 400% by 2050 (Yaqoob et al., 2020). Moreover, the production of wastewater that contains different substances such as heavy metals, chlorinated hydrocarbons, biological wastes, radioactive substances, negative ions, and toxic dyes will result in a wealth of environmental damage (Khurana et al., 2017). Therefore, considering the problem of water shortage and the ever-increasing expansion of industries, the treatment of industrial wastewater is of particular importance to meet part of this growing need (Moradi et al., 2022). Furthermore, the colors are widely used in industries and these dyes are toxic and even carcinogenic in some cases, disposing of the wastewater of these industries in water can lead to the pollution of biological resources and many other harms (Hosseini et al., 2016).
Most of the dyes used in industries are organic structures soluble or not soluble in water, which causes the water to become turbid and then reduce oxygen content and photosynthesis process, thus changing the ecosystem of aquatic organisms. Furthermore, they cause diseases and mutations in organisms and microorganisms in water (Ferreira et al., 2020). In general, the dyes used in industries are divided into two groups, ionic (negatively and positively charged ions) and non-ionic. Some colors such as azo colors, having a molecular structure including the azo-chromophore group (—N⚌N—), are widely used since they are stable and economical (Moradi et al., 2022). Methylene blue (MB), which is mainly used for dyeing cotton, cellulose, and silk fibers, belongs to the category of thiazine cationic dyes. Despite the value of MB in scientific discussions, it has harmful effects on humans and the environment because of its toxicity and solubility in water. Methyl orange (MO), used in the textile industry, is also one of the most stable azo dyes and is resistant to biodegradation. A major part of textile industry wastewater is made up of dyes and salts with high concentrations (Tsade Kara et al., 2021).
Some wastewater may contain heavy metals, which makes wastewater treatment complicated. The results of toxicological studies show that cadmium (Cd), as the most toxic biological heavy metal, is a part of some metallic dyes (Visa and Duta, 2013). This heavy metal has no physiological function and is often known as a poison, leading to a range of bone-related diseases, kidney failure, and anemia (Genchi et al., 2020). In the same way, lead (Pb) is a metal element that can be considered a water pollutant.
According to what has been said, to have a healthier and cleaner environment, removing MB, MO, Cd, and Pb from wastewater seems essential. Some of the wastewater treatment methods containing MB and MO dyes such as photocatalytic degradation, surface adsorption, electrochemical, ion exchange, and catalytic processes have been investigated. Among the methods of removing dyes and heavy metals, absorption has been taken into consideration because it is economical, easy to process, and able to absorb pollutants (Tsade Kara et al., 2021). Graphene oxide (GO) can be mentioned as a suitable adsorbent due to its unique properties such as very high specific surface area and other electrical and mechanical properties. Due to the presence of oxygen, GO has a high negative charge density, which allows the connection of metal ions and cationic organic compounds such as MB (Moradi et al., 2022); (Ferreira et al., 2020). Although GO has been specially considered as an adsorbent for both dye pollution and heavy metals. Some limitations have caused the correction of the functional weaknesses of this material to achieve greater stability and more appropriate performance (Singh, 2022). Therefore, it is desirable to combine GO with materials such as polymers, silica, and other structures, especially metal oxides that reduce the energy gap and also reduce the electron-hole pair rates (Joshi and Gogate, 2012). Graphene composites and other compounds related to it have been significantly used in the treatment of wastewater containing anionic and cationic dyes. Therefore, according to the publications, these materials purify wastewater containing dyed substances as well as pollution related to heavy metals (Khurana et al., 2017). Also, according to some considerations, since the 1970s, the use of metal oxides for wastewater treatment has been considered, which include ZnO, Fe2O3, TiO2, WO3, ZrO2, and V2O5. In the meantime, ZnO has received special attention due to its characteristics and ease of synthesis, and compatibility with the environment (Yaqoob et al., 2020). The suitable properties of ZnO metal oxide for its combination with GO, including high electron mobility, make the composite resulting from the combination of GO and ZnO particles, to overcome limitations such as reduced activity due to the wide energy band gap for ZnO. In other words, the combination with GO causes a delay in the recombination of ZnO-based catalysts and also results in an increase in the surface area and an increase in the adsorption capacity in GO (Hosseini et al., 2016); (Khayatian et al., 2018). In this paper, the synthesis of a novel graphene oxide nanocomposite has been studied, in which the nanocomposite has been synthesized and characterized. The adsorption of industrial wastewater pollutants, organic contamination, and heavy metals has been studied to refine the wastewater for agriculture of household usage.
2 Materials and methods
2.1 Reagents
Graphite powder (average particle size ∼ 50 μm, purity > 99.5 %) and H3PO4 solution (85 wt%) were supplied from Merck Company (Darmstadt, Germany). Zinc oxide (ZnO) nanocarriers (average particle size < 100 nm, purity > 99.5 %), adsorbates of MO (C14H14N3NaO3S) as an anionic dye and MB (C16H18 N3ClS) as a cationic dye, solutions of KMnO4 (0.02 mol.L-1 (0.1 N)), H2O2 (30 wt%), sodium dodecyl sulfate (SDS) (ACS reagent, ∼ 99 %), Cadmium Chloride (CdCl2), lead nitrate (Pb(NO3)2), and NaOH were obtained from Sigma-Aldrich Company (St. Louis, MO, U.S.). Furthermore, extra pure H2SO4 (98 wt%) and HCl (35 wt%) were received from Mojallali company (Mojallali, Iran). All chemicals and reactants were of analytical grade, without any further purification.
2.2 Synthesis of graphene oxide (GO)
As a well-known method, graphene oxide (GO) is dominantly synthesized through the chemical oxidation of natural graphite. In this work, GO was treated by an easy, convenient, and cost-effective method, based on the modified Hummer's method (Oral et al., 2020); (Arabpour et al., 2021). In detail, 70 (mL) of protonated solvent that was prepared through a mixture of H2SO4 and H3PO4 (9:1 vol ratio) was introduced into a beaker containing 0.45 (g) graphite powder and stirred in an ice bath for 20 (min.). Next, 3.5 (g) KMnO4 as a strong oxidizing agent was slowly added to the mixture at a constant temperature of 5 °C and let to continue the reaction for 2 h. Then, the resultant suspension was heated to 35 °C and eventually ultrasonicated for 1 h. As the final step of the synthesis method, the mixture was added to 70 (mL) of deionized water to dilute and stop the reaction and 2 (mL) of H2O2 to remove any metal ions from the oxidizer. The resulting yellow–brown liquid indicated a considerable extent of oxidation. Ultimately, the remaining solid material which was obtained through filter paper and funnel was treated with 5 % HCl aqueous solution, centrifuged (Hettich, EBA 20), and washed with deionized water repeatedly until the pH of the reaction product was essentially neutral. The synthesized brown-black material was eventually dried in a vacuum oven at 50 °C for 24 h.
2.3 Synthesis of graphene oxide-ZnO (GO-ZnO) nanocomposite
The nanocomposites (GO-ZnO 1%, GO-ZnO 3%, GO-ZnO 5%) were synthesized based on the solution mixing method. To obtain the ZnO dispersion, the corresponding amounts of ZnO nanoparticles were sonicated in 50 (mL) of a homogenous mixture of ethanol/water (1:1 vol ratio) for 2 h. The GO's suspensions were obtained by various extents of the synthesized GO dissolved in 50 (mL) of deionized water containing 1 % SDS and put inside the sonicated bath for about a 2 h period. The SDS surfactant improves the suspension process by maintaining uniform colloidal dispersion and preventing metal particle agglomeration. To achieve the homogenous mixture, next, the GO water suspension was added to the ZnO dispersion in equal amounts and sonicated at ambient temperature (23 ± 1 °C). After 30 (min.) NaOH (1 M) solution was added dropwise till the resulting product was adjusted at the pH = 10. Later, the solution was heated in the water bath for 5 h at an elevated temperature of 85 °C. The precipitate was ultimately collected through centrifugation and washed with deionized water several times, and, at last, it was transferred into an oven at 50 °C for solvent evaporation.
2.4 Structural analysis
The crystalline structure of the synthetic and natural samples was distinguished from the X-ray powder diffraction analysis (XRD) pattern by using the powder diffractometer (EQUINOX-3000, Intel, France) equipped with Cu Ka radiation (λ = 1.541 Å) at 40 (kV) and 30 (mA), with a scanning speed of 2θ = 5/min. between 4 and 90° 2θ angular range. To make micro-morphological observations, the synthesized GO and GO-ZnO samples were subjected to Scanning Electron Microscopy (SEM) using a scanning electron microscope (AIS-2100 Seron Technology, Seron Technology, Korea) operating with up to 20 (kV) acceleration voltage field emission gun at 25 Kx (different) magnifications. Notably, all sample fragments were previously sputter coated through an ultrathin layer of conductive gold.
2.5 Batch adsorption assay
The batch adsorption method was applied to evaluate. The photocatalytic performance of both organometallic species and organic components of typical metathesis reactions. The stock solutions of MB, MO, Cd2+, and Pb2+ pollutants (1000 ppm) were set up according to the dilution method in the deionized water. A given proportion of the GO-ZnO absorbent was dispersed in a flask of 25 (mL) for each stock solution. The flasks were then transferred to an incubator shaker (150 rpm, SI-100R, tradekorea, South Korea) and thoroughly agitated for 2 h at room temperature (23 ± 1 °C). The pH extent was adjusted by using NaOH (0.1 N) and HNO3 solutions (0.1 N). Having been filtered to separate the dye solutions from the adsorbent, all solutions were analyzed to determine the contaminant concentration with Uv–Vis spectroscopy. In this work, a UV–Vis. spectrophotometer (Lambda 25, Perkin Elmer, U.S.) was used, and the recorded UV–Vis. spectra have been measured at λMB and MO = 664 (nm), while Cd2+ and Pb2+ concentrations were determined through atomic absorption (AA) methodology.
Kinetics and isotherm studies were eventually applied to the obtained sorption data. The measure of sorption capacity qt (mg.g−1) and the removal efficiency (%R) were determined according to Eqs. (1) and (2), respectively (Dan et al., 2023):
2.6 Adsorption kinetic
The adsorption kinetic trials were conducted by shaking the desired GO-ZnO absorbent (10 mg) with diverse initial concentrations of contaminants for diverse time interims (30–720 min.) as separate experiments. Having been centrifuged to separate the solutions from the solid sorbent, all samples were subjected to determine the dyes and cations concentrations through UV–Vis. spectrophotometer and AA technique, respectively. Solutions pH was also fixed to 2 and 12 for the dye MB and MO and 2 and 10 for the Cd2+ and Pb2+ removal, respectively, except where the pH effect on the adsorption process was investigated and controlled by supplementing drops of HNO3 or KOH (1 M) solution. From these measurements, the extent of adsorbed pollutants at the anytime qt (mg.g−1) was calculated as Eq. (1) for any time (Iriel et al., 2018); (Banivaheb et al., 2021):
2.7 Adsorption isotherms
The isotherm studies were explored to predict the adsorption mechanisms and the distribution behavior of the adsorbate dyes and ions between the solid and fluid. The impact of the dyes and heavy metals' initial concentrations on removal efficiency was understood by GO-ZnO absorbent (10 mg) in contact with diverse initial concentrations of contaminants (Ci, MB = 10–125; Ci, MO = 10–150; Ci, Cd2+ =10–100; Ci, Pb2+ =10–175 mg.L-1) as separated experiments at constant pH 7. Having been centrifuged to separate the dye solutions from the solid sorbent, all samples were subjected to determine the pollutants concentrations through UV–Vis. and AA spectrophotometers.
2.8 Influence of pH
To evaluate the pH impact on the pollutant's optimum uptake, the weighted quantity of the synthesized GO-ZnO absorbent (10 mg) was rigorously shaken with 25 (mL) of MB, MO, and Cd2+ (50 mg.L-1) and Pb2+ (100 mg.L-1) solutions at various pH values (2–12) for 2 h, as separated tests. Eventually, the solutions and solids were separated, and the filtrate was collected for optimal pH investigation.
2.9 Antibacterial activity
Disk diffusion technique was implemented to investigate the antibacterial function of synthesized nanomaterials. The zone inhibition method was applied to study the antibacterial activity of nanostructures. In this case, two gram-positive bacterial strains of Staphylococcus Aureus (ATCC 25923) and gram-negative ones of Escherichia Coli (ATCC 11229) were cultured in the nutrient agar medium as maintenance for a wide variety of non-fastidious bacteria. The culture media preparation was finalized by suspending the agar powder (23 g) in highly purified water (1 L) and heating (∼45 °C) with frequent agitation for ∼ 2 (min.) to completely dissolve the powder. Later, a 15–20 (mL) volume of the ready media was poured into a 60-mm sterile glass petri dish and left standing for ∼ 30 min. to solidify. Next, the agar-loaded plates were inoculated with 100 (µL) of 108 Colony-forming units (CFU).mL−1 using standard microorganisms' suspensions. The filter paper discs that were thoroughly sterilized were placed on top of inoculated plates and 15 (µL) of the nanomaterial solutions (a quantity of 50 (mg) samples containing 10 % solution in purified water) were pipetted on the disks. Eventually, test samples were firmly sealed to alleviate chances of any contamination and incubated with a shaker (150 rpm) at 37 °C overnight.
3 Results and discussion
3.1 Structural and morphological characterization
The XRD patterns of the pure GO and GO-ZnO nanocomposite are represented in Fig. 1. As observed, no impurity peaks were observed, thereby demonstrating that the resulting composition was a combination of GO and GO-ZnO with high purity and no impurities had been produced. The obtained XRD spectrum also represents the characterization of pristine graphene oxide sheet by diffraction peaks at 2θ of 10.77° related to (0 0 1). This is on account of the presence of the functional groups, including oxygen, on the graphene/graphene oxide layers and the increment of the interlayer distance as well. The obtained XRD pattern of the synthetic nanocomposite expresses the doping of different levels of GO resulting in the wider peak shape and lower intensity of GO-ZnO compared to pristine GO and a decline in crystallinity of the nanocomposite sample. In detail, with regards to previous studies (Malekkiani et al., 2022; Ghoreishi et al., 2013), ZnO characterization peaks represent ranging from 2θ of 30.0° to 70.0°. As observed in Fig. 1, the nanocomposite peaks have gotten weaker and shifted to the right reflecting the coordination reaction between Zn2+ and GO, which, in turn, leads to altering the GO-ZnO crystallinity. Therefore, it could be concluded that the crystal structure of ZnO nanoparticles had been successfully transformed into the synthetic nanostructure and positioned on the outer surface of the GO-ZnO. However, a new weak diffraction peak approximately at 2θ of 26° that is related to (0 0 2) was observed, indicating the reduction of the graphene oxide into the graphene, and subsequently the disordered stacking of graphene sheets in the synthesized nanocomposite (Ghoreishi et al., 2013). Indeed, the weakness of the graphene diffraction peak (2θ = 26°) related to the insignificant mass ratio of graphene in comparison with ZnO demonstrates the formation of graphene sheets that have been redecorated by hexagonal ZnO nanoparticles.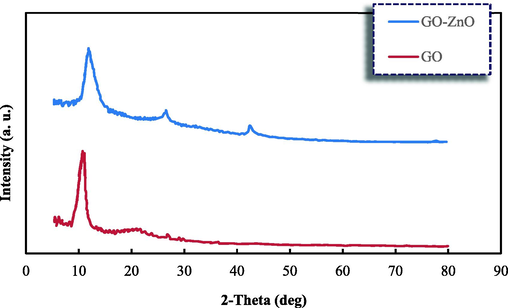
X-ray diffractograms for the GO and GO-ZnO nanocomposites.
The surface topography of the samples detected by SEM at various magnifications is depicted in Fig. 2. As illustrated in the inset of Fig. 2(A-B), the morphology of the graphene oxide surface was smooth indicating that it comprised tremendously stacked planes. Owing to cavities that were firmly connected, the edges of the graphene oxide sheets were inclined to fold to create highly crumpled multilayers, resulting in fading of sheet-like structures. However, the SEM images in Fig. 2(C-D) revealed that the introduction of ZnO nanoparticles uniformly dispersing over the GO matrix diminished the congestion, and the surface smoothness disappeared by creating hollow-shaped spaces between the GO layers. As expected, on account of the 3D cross-linked nature of ZnO nanoparticles that tend to be homogeneously coated on the surface of the graphene oxide sheets, the flake-like GO-ZnO morphology was successfully formed over the reaction (Ghoreishi et al., 2013). Moreover, the SEM microphotographs given in Fig. 2 indicated that the nanoparticles were acceptably attached to the GO surface, and the GO matrix considerably prevented the agglomeration of the supplemented nanoparticles, which is due to the uniform distribution and good coupling nature of ZnO. It is noteworthy that the uniform and small agglomeration of the nanoparticles contributes to higher dyes and cations adsorption on the nanocomposite surface.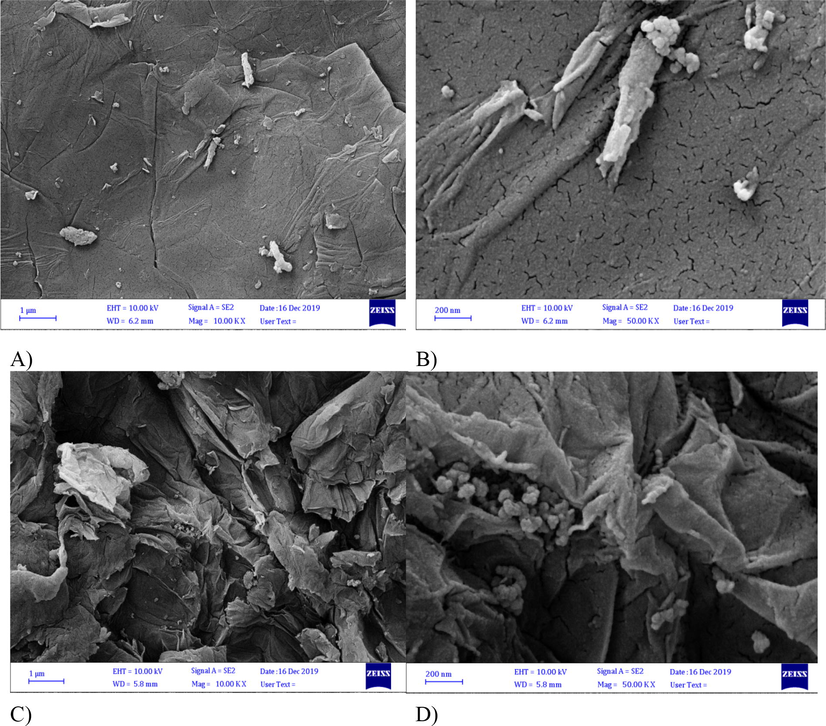
Scanning electron micro-graphs of the GO (A and B) and GO-ZnO nanocomposite (C and D); Transmission electron micrographs with a magnification of 10.00 KX (A and C) and 50.00 KX (B and D).
3.2 Pollutant adsorption study
The adsorption capability evaluation of the synthetic nanocomposite was carried out through its activities on the removal of the MO and MB pollutants as organic targets and desired heavy metals of the Cd2+ and Pb2+. So, the effect of concentration and pH traces of the solutions were studied for the removal (%) of the contaminants.
3.2.1 Effect of nanoparticle on adsorption process
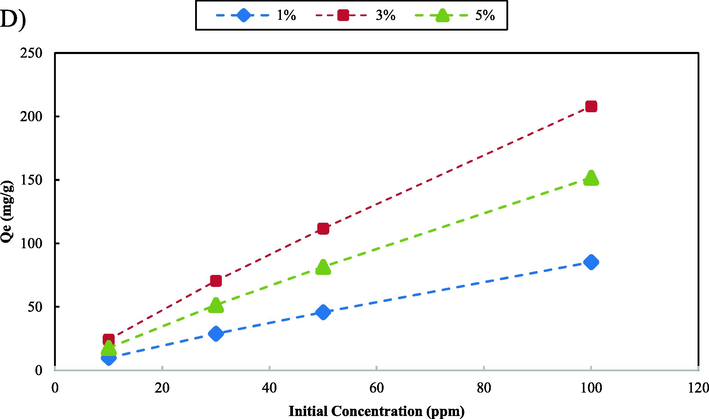
Graphene oxide (GO) is one of the most common compounds used as an advanced adsorbent due to its unique properties. These properties such as large surface area, high chemical stability, and mechanical properties can vary and depend on the layer count structure of the compound. One of the main disadvantages of GO is the low adsorption capacity that limits its applications in wastewater treatment. One of the approaches to enhance the adsorption capacity of GO is to incorporate it with various compounds such as polymers and metal oxide nanoparticles. ZnO nanoparticles can act as adsorption sites and improve the adsorption properties of GO. In this study, GO-ZnO nanocomposites with various ZnO loading percentages (1%, 3%, and 5%) were synthesized. The adsorption tests of the synthesized nanocomposites were carried out in batch experiments. The results shown in Fig. 3 indicate that the GO-ZnO nanocomposite that contains 3% ZnO shows the highest adsorption efficiency for all the pollutants. The adsorption capacity of the nanocomposites increased as the amount of ZnO loading increases to 3%. The addition of ZnO over 3% to the GO-ZnO structure results in a decrease in the adsorption capacity. The optimal loading percentage of ZnO to achieve the highest adsorption capacity is nanocomposite containing 3% ZnO. The high pollutant adsorption capacity of the GO-ZnO nanocomposite containing 3% ZnO can be attributed to several phenomena. One of the main reasons is the synergistic effect of the two components. ZnO nanoparticles provide additional adsorption sites while the GO sheets act as an efficient adsorbent due to their large surface area. Also, GO acts as a base that can improve the dispersion and stability of the ZnO nanoparticles in the medium. The nanocomposite that contains 1% ZnO showed the lowest adsorption capacity for all the water pollutants, while the nanocomposite with 5% ZnO showed a lower efficiency compared to the nanocomposite that contains 3% ZnO. The decrease in adsorption efficiency at higher percentages of ZnO can be attributed to the decrease in the surface area of graphene oxide as the percentage of ZnO increased. In addition, an excess of ZnO can also result in the aggregation of ZnO nanoparticles and graphene oxide sheets by forming a new functional group between the GO layers, which might hinder the accessibility of the active sites for adsorption.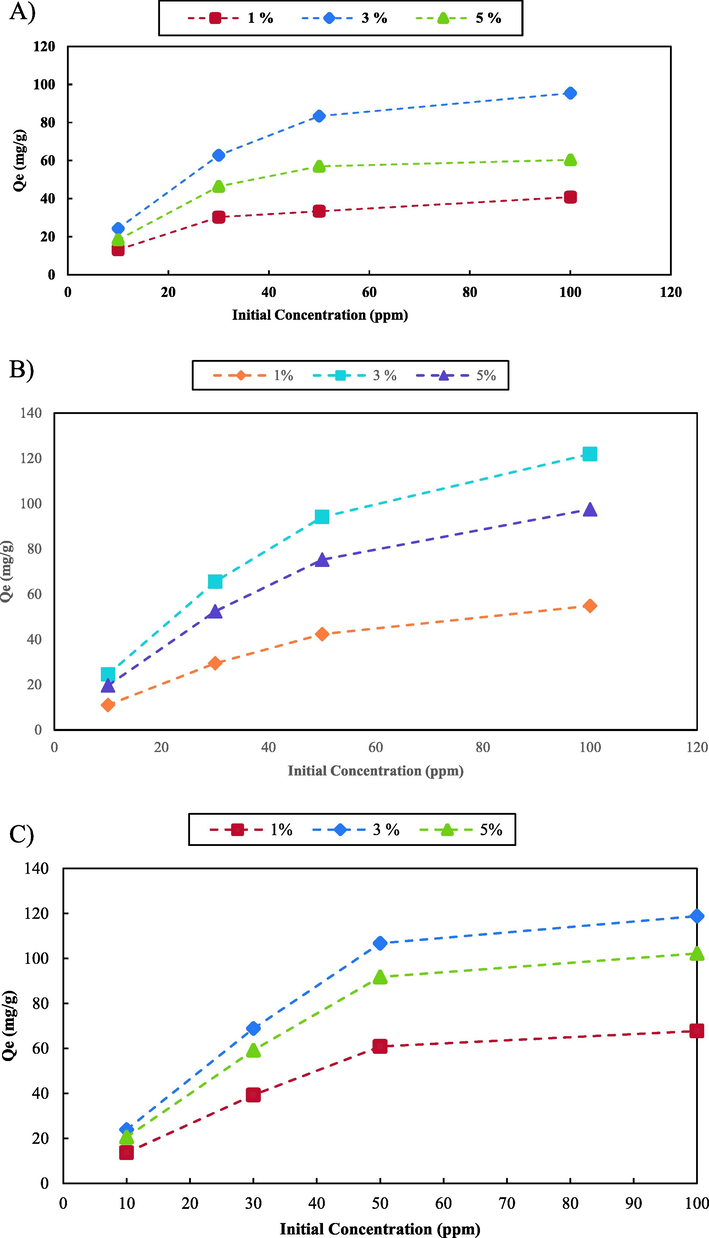
Effect of different amounts of nanoparticle on the adsorption capacity of the nanocomposite; MB (A), MO (B), Cd2+ (C) and Pb2+ (D).
Effect of different amounts of nanoparticle on the adsorption capacity of the nanocomposite; MB (A), MO (B), Cd2+ (C) and Pb2+ (D).
3.2.2 Isotherm adsorption assay
The adsorption dependence behavior of the synthesized nanocomposites to the initial concentration of the dyes and heavy metals in the given range shows up in Fig. 4A & A'. The maximum obtained adsorption capacities (mg.g−1) were 96.15 and 122.01 at the concentrations of 125 and 150 (mg.L-1) for the MB and MO, and 118.84 and 256.48 at the concentrations of 100 and 175 (mg.L-1) for the Cd2+ and Pb2+, respectively. The increase of MB and MO concentration from 10 to 75 (mg.L-1) led to a sharp increment of the adsorption capacities up to 93.45 to 118.03 (mg.g−1), respectively, while qe reached a plateau and set to levels of as illustrated in the graph with more increases of the initial concentration dyes. The same trend would happen to the Cd2+ and Pb2+ with the obtained adsorption capacities up to 106.76 and 253.32 (mg.g−1) at the concentrations of 50 and 125 (mg.L-1), respectively. The findings also indicate that with the increase in the adsorbate levels, removal efficiency deteriorated from 97.49% to 30.77%, 98.37% to 32.54%, 95.73% to 47.53%, and 97.10% to 58.62% for MB, MO, Cd2+ and Pb2+, respectively. The diminished adsorption rate with the increase of the operating parameter of the pollutants' concentrations might be credited to a drop in available active areas for the adsorption. At lower concentrations due to the availability of more adsorption/vacant sites, the concentration gradient between the adsorbate in solution and the adsorbate on the adsorbent tends to be higher. Therefore, through the fast diffusion of into the interparticle matrix, the contaminants effectively interact with the nanocomposite sorbent, leading to enhanced removal efficiency (Malekkiani et al., 2022; Ahmada et al., 2016).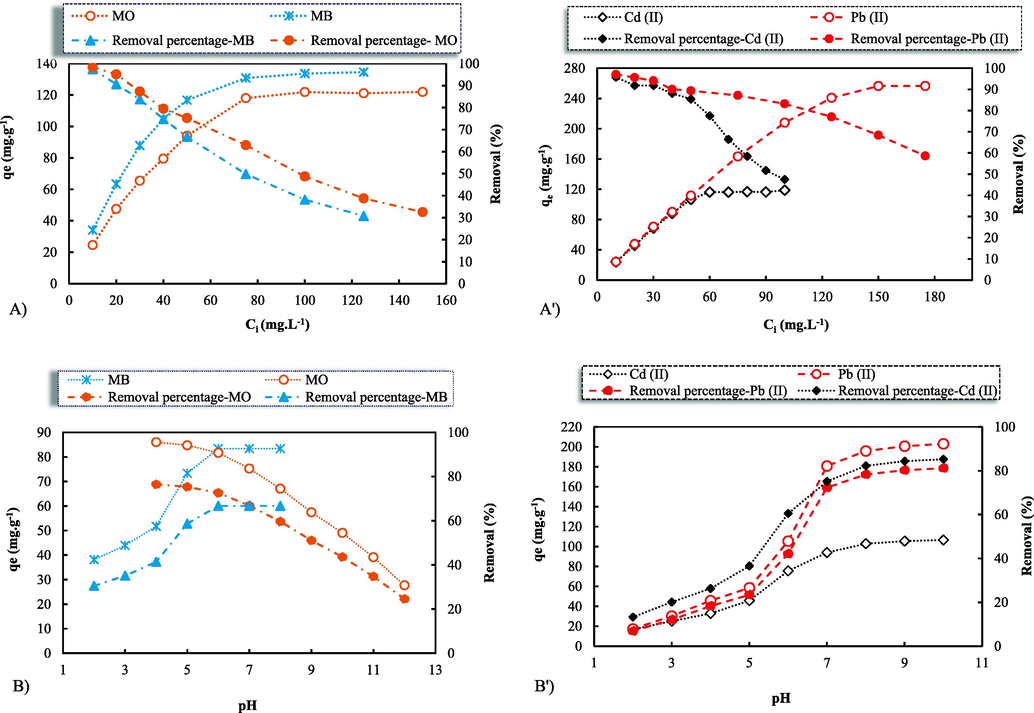
Influences of the initial solution concentrations (A) and pH (B) on the dyes and cations qe and removal (%) by the synthetic nanocomposite GO-ZnO; Initial conditions: 25 (mL) of the MB, MO, and Cd2+ (50 mg.L-1) and Pb2+ (100 mg.L-1) adsorbates, the adsorbent 10 (mg).
3.2.3 pH dependence
The initial pH adjustment of solutions has a crucial impact on ion exchange and adsorption processes through the protonation of adsorbent chemical functional groups. Indeed, the pH influence on the dyes and heavy metals uptake is related to the adsorbate ionic charge in the solution and the sorbent surface functional groups (Iriel et al., 2018); (Shaban et al., 2018). In this regard, by maintaining other performing parameters as constant, the batch adsorption technique was applied to evaluate the impact of pH ranges of 2–8 and 4–12 on the MB and MO dyes uptakes, respectively (Fig. 4B). At the same time, the relationship between the aqueous media pH and the pollutants removal (%) is graphically illustrated in Fig. 4B. It is obvious that the adsorption capacity of the MB dye increased clearly with increasing pH, up to an equilibrium extent of approximate 6 (at the slightly acidic media), where qe was already constant (∼83.42 mg.g−1). The MB removal efficiency also improved with growing the pH levels and it finally reached a plateau beyond the pH ∼ 6, remaining fixed in the alkaline media (pH ∼ 8). The GO's dual responsiveness and the role of the metal oxide ZnO are reflected in the synthetic GO-ZnO. The GO surface functional groups, e.g. —COOH, —CHO, —OH, and epoxy, provide an amphoteric behavior that results in becoming negatively or positively charged depending on the solution pH scale. Owing to the deprotonation in acid pH (<6), the GO forms stable colloids of ionized oxygen functional groups (—COOH) electrostatic repulsion, contributing to inducing the chemisorption of positively charged MB molecules. In other words, highly negatively charged sheets of graphene oxide in suspension could not only improve the electrostatic attraction between them and cationic MB molecules but also disperse homogeneously through electrostatic repulsion, clearly upgrading the adsorption feature (Peng et al., 2016; Ederer, 2022). Furthermore, the MB is a dye that holds several active functional groups interacting with ZnO, leading to a hydrogen bond between the ZnO and MB and an increase in the adsorption of the MB dye. According to Mohamed Shaban et al. (Shaban et al., 2018), increasing the mass over 0.15 g of natural serpentine adsorbent which was associated with an increase in the level of the dissolved carbonate, as impurities within the serpentine minerals, would cause to decrease in the pH value, and hence the removal (%) of MB. On the other side, the nanocomposite adsorption capacity for the MO dye molecules seems to reduce steadily (from 95.6 to 30.77 mg.g−1) with expanding the pH levels from 4 to 12. The findings were entirely consistent with the research by shi (Shi, 2022) reporting that the studied graphene oxide-chitosan (GO-CS) composite tended to adsorb MO at low pH. This trend is reflected in diminishing the removal efficiency from 76.48% to 24.62%. This tendency can be explained by considering that the acidic conditions brought about the adsorbent surface protonation, resulting in improving the uptake of the acidic MO dye and enhancing the pH caused a reduction in the removal percentage. Moreover, the decrease in the adsorption feature might be because the ZnO nanoparticles lost their oxygen atoms, in weakly alkaline solutions, through a reaction with the hydrogen ion (H+). In this case, the MO adsorption on the adsorbent surface might be considered to be a competition of the dye adsorbate with the generated cations (Zn2+), occupying more ionic exchange sites and resulting in a drop in the MO removal (Shaban et al., 2018; Malekkiani et al., 2022; Peng et al., 2016). Conversely, as indicated by Syed Shahabuddin et al. (Shahabuddin et al., 2016), the adsorption of MO dye onto the surface of polyaniline (PANI)-Co3O4 nano cube-doped nanocomposites appeared to be pH dependent in a positive relationship. This trend can be deduced from the fact that MO exists in anionic form at pH values less than the pKa value of (∼3.4), and hence gets protonated. As shown in Fig. 4B', the impact of pH ranging from 2 to 10 of the Cd2+ and Pb2+ solution was investigated. It was obvious that the uptakes and removal efficiencies increased moderately quickly from pH 2 to 8, and then increased very slowly from pH 8 to 10. It was found that the solution pH was likely to influence the deprotonation degree and the speciation of the surface functional groups of the GO-ZnO nanocomposite. With growing pH, the surface charge was more negative, meaning that the electrostatic interactions between the GO nanosheets and the heavy metal ions would become stronger resulting in the improvement in Cd2+ and Pb2+ ions sorption. Furthermore, it is the fact that cadmium and lead species might present the various forms of Cd2+, Cd (OH)3-, Cd (OH)+, Cd (OH)20, Pb2+, Pb (OH)3-, Pb (OH)+, and Pb (OH)20 at diverse pH levels. The removal of the Cd2+ and Pb2+ pollutants, as predominant cadmium, and lead species at low pH levels, is chiefly achieved through an adsorption reaction. The low Cd2+ and Pb2+ uptakes which took place under very acidic conditions may be attributed to the competition between positive lead species and hydrogen ions on the sites of the surface (Wang, 2015; Zhao et al., 2011). Similarly, Yaoguang Wang et al. (Wang, 2015) showed an increase in the removal efficiency of lead species by increasing the pH from 2.7 to 5.0, and then a decrease from pH 5.0 to 6.6 using magnetic hydroxypropyl chitosan/oxidized multi-walled carbon nanotubes (MHC/OMCNTs). According to Aghdas Heidari et al. (Heidari et al., 2009), the sorption efficiency of Cd2+, Pb2+, and Ni2+ metal ions by NH2-MCM-41would grow with an increase in the solution pH from 1.5 to 5.0., meaning that the solution pH influenced the adsorption of the metal ions through electrostatic binding of ions to corresponding –NH2 groups. In the present research, with the increase in pH up to ∼ 8, the levels of hydrogen ions relatively diminished, meaning that the proportion of adsorbed Cd2+ and Pb2+ which were competitive to hydrogen ions would grow. Overall, pH levels of ∼ 6 and ∼ 8 would appear to be the ideal conditions and they were chosen for the succeeding trials.
3.3 Adsorption kinetics
Time is a key factor for adsorption system designs. The influence of the contact time on the components' adsorption was evaluated to obtain the relevant kinetics parameters under the controlled conditions of pH = 6 and pH = 8 for the dyes and metal ions solutions, respectively, at the initial concentrations up to 50 and 125 (mg.L-1) for the MB, 75 and 150 (mg.L-1) for the MO, 50 and 100 (mg.L-1) for the Cd2+, and 75 and 150 (mg.L-1) for the Pb2+ pollutants. The measured reaction kinetic of the dyes and heavy metals adsorption as a function of time were fitted to both pseudo-first-order (PFO) and pseudo-second-order (PSO) kinetic expressions. The kinetics models applied for characterizing the adsorption tendency are expressed as (Bhattacharya and Venkobachar, 1984):
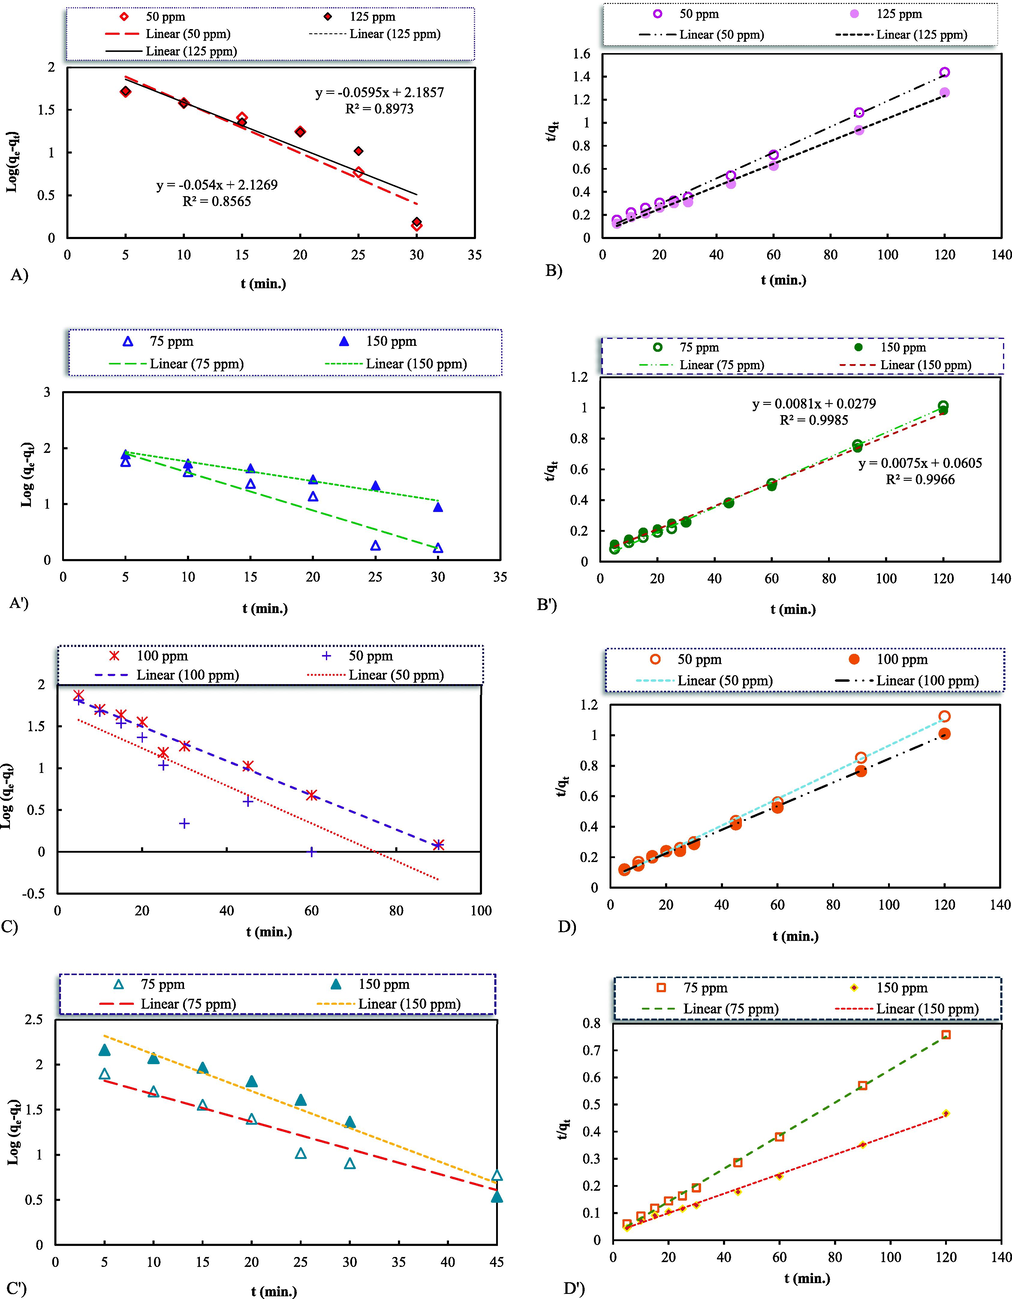
Pseudo-first-order and Pseudo-second-order adsorption kinetics models for the MB (A & B), MO (A' & B'), Cd2+ (C & D), and Pb2+ (C' & D') adsorptions on the synthetic nanocomposite GO-ZnO; Initial conditions: 25 (mL) of the adsorbates, the adsorbent 7.5 and 10 (mg).
Ci
(ppm)Pseudo-1st-order
Pseudo-2nd-order
k1
(min.−1)q(e, Exp.)*
(mg.g−1)q(e, Cal.)*
(mg.g−1)R2
k2
(g.mg−1.min.−1)q(e, Exp.)
(mg.g−1)q(e, Cal.)
(mg.g−1)R2
MB
50
0.120
83.425
153.350
0.8973
0.0018
83.425
89.285
0.9947
125
0.109
93.317
133.930
0.8565
0.0017
93.317
102.041
0.9961
MO
75
0.137
118.47
174.020
0.9155
0.0023
118.47
123.457
0.9985
150
0.07
121.97
127.614
0.9471
0.0009
121.97
133.333
0.9966
Cd2+
50
0.101
106.763
174.783
0.876
0.0012
106.763
114.942
0.996
100
0.054
118.837
101.765
0.899
0.0008
118.837
129.870
0.998
Pb2+
75
0.061
163.425
93.993
0.9078
0.0018
163.425
163.934
0.9989
150
0.082
256.475
333.042
0.9584
0.0004
256.475
277.778
0.9968
3.4 Equilibrium adsorption isotherms
A deep understanding of adsorption isotherms is crucial for productive adsorption system designs as well as overall the upgrade of adsorption mechanism pathways. Indeed, the connection between adsorbates and adsorbents, in the equilibrium state, can be characterized through adsorption isotherms. To clarify very well-fitting adsorption models, a linear regression analysis has been frequently applied since it has the potential to verify the theoretical assumption consistency of adsorption isotherm models and quantify adsorbates distributions (Ayawei et al., 2017). To understand the maximum adsorbed quantity via the GO-ZnO for the MB and MO dyes and heavy metals of Cd2+ and Pb2+, equilibrium trials were conducted at different initial concentrations and pH ∼ 6 and ∼ 8 with an adsorbent dose of 10 mg, alongside during the contact time of 45 min. Eventually, the experimental data obtained in the batch adsorption experiments were adjusted to Langmuir, Freundlich, Temkin, and Flory-Huggins isotherms (Temkin, and Flory-Huggins isotherms are described in detail in Appendix A). All the experimental equilibrium data of the pollutant's adsorption were fitted to the applied linearized isotherms (Fig. 6) and the corresponding parameters were reported in Table 2.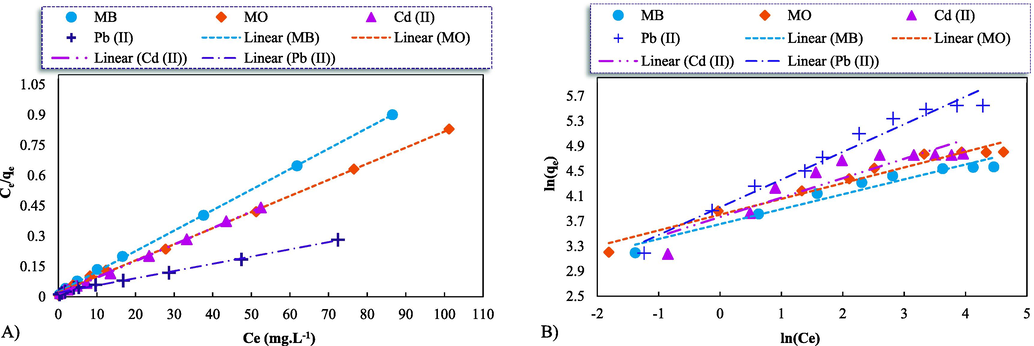
Linearized fits of the Langmuir, Freundlich, Temkin, and Flory-Huggins (F-H) isotherms (A, B, C, and D, respectively) for the adsorption of the dye pollutants of the MB and MO (at pH ∼ 6) and the heavy metals of the Cd2+ and Pb2+ (at pH ∼ 8) onto the synthetic GO-ZnO; Initial conditions: 10 mg of the adsorbent, the initial concentration range: 10–175 (mg.L-1) at 298 K.
Isotherm model
Parameters
Linearized isotherma
MB
MO
Cd2+
Pb2+
Langmuir
qMax. (mg.g−1)
99.00
125
121.951
277.778
KL (L.mg−1)
RL
0.429
0.011–0.590.382
0.009–0.640.590
0.01–0.490.176
0.01–0.68
R2
0.999
0.999
0.999
0.995
Freundlich
1/nF
0.238
0.251
0.310
0.4422
KF [(mg.g−1)(L.mg−1)1/n]
38.582
44.871
43.164
50.451
R2
0.949
0.961
0.842
0.967
Temkin
βT
13.241
16.736
20.609
48.825
KT (L.g−1)
23.700
20.409
10.460
3.086
bT (J.mol−1)
182.973
144.762
117.557
49.621
R2
0.982
0.969
0.905
0.949
Flory-Huggins
KFH (L.mol−1)
0.0029
0.0027
0.0025
0.0010
nFH
−1.067
−0.975
−1.091
−1.251
R2
0.911
0.912
0.974
0.988
Langmuir adsorption is one of the equilibrium isotherms applied to quantify as well as contrast the adsorptive capacity of varied adsorbents. This isotherm explaining affinity between adsorbents and adsorbates assumes that an adsorption process occurs on homogeneous sites of the solid media and that just monolayer formation takes place without any interactions between the adsorbed molecules (Shaban et al., 2018). Accordingly, Langmuir isotherm clarifies the surface coverage by balancing the respective adsorption and desorption rates (dynamic equilibrium) (Iriel et al., 2018). The qe (mg.g−1) for Langmuir isotherm was obtained in the linearized form (Eq. (5)) (Dan et al., 2023).
The obtained qMax., based on the Langmuir isotherm (Fig. 6A and Table 2), was determined as 99, 125, 121.951and 277.778 (mg.g−1) for the MB, MO, Cd2+, and Pb2+, respectively, that is, the adsorption process using the synthesized adsorbent was very good for the MO dye as it had the highest maximum monolayer adsorption capacity. The KL extent for the four adsorption systems showed a relatively small level (0.429, 0.382, 0.590, and 0.176 (L.mg−1) for MB, MO, Cd2+, and Pb2+, respectively), meaning that there was weak interaction between the adsorbates molecules and the absorbent since the active sites adsorbed only one molecule. Meanwhile, the adsorption of the GO-ZnO adsorbent matched the Langmuir isotherm with a coefficient correlation (R2 > 0.99) too far closer to 1. This signified that the studied adsorption using the GO-ZnO adsorbent permitted monolayer formation. All the calculated RL levels were also in the range of 0–1, reflecting the favorable adsorption of the contaminants through the examined nanostructure.
The obtained equilibrium data was also fitted by using the applicable Freundlich isotherm (Eq. (7)) considering a heterogeneous adsorption surface and an exponential distribution of activated sites and their energies. To rephrase it, Freundlich isotherm is contingent on a non-uniform, multilayer, alongside heterogeneous adsorption (Chikate and Kadu, 2014).
R2 extents ranging from 0.999 to 1.000 indicate that the empirical adsorption data of the adsorbate on the adsorbent were very well good mathematically fitted in the corresponding model. The Langmuir isotherm described the adsorption behavior of the desired dyes and heavy metals on the synthesized GO-ZnO better than the other studied two-parameter models as the related coefficients of the Langmuir equation were higher for all pollutants (R2 > 0.99). Therefore, based on R2 according to (Table 2), the Freundlich, Temkin, and Flory-Higgins isotherms were not suitable for the studied dyes and heavy metals adsorption onto the given nanocomposite. The adsorption system with the synthetic GO-ZnO adsorbent for all studied pollutants followed suit with the order of the Langmuir > Temkin > Freundlich > Flory-Higgins. In addition, equilibrium data could not be applied to firmly establish the nature of the present adsorption process. To put it in another way, this model might be characterized by presuming a mono-layer adsorption reaction, that is, the adsorbed layer comprised only one molecule in thickness, accordingly adsorption was able to only occur at a finite sites number. Cautiously, based on the linear curve of the Temkin adsorption (Fig. S1A), the adsorption system with the examined adsorbent was compatible with the Temkin isotherm model. Indeed, the uptake behavior of the selected pollutants was described satisfactorily using the Temkin isotherm model with a reasonable correlation coefficient. At last, it can be concluded that these present dyes and metals adsorption represented, to some extent, by the Langmuir isotherm model followed by Temkin isotherm, meaning that the adsorption by the synthetic GO-ZnO occurred in a multilayer form. According to Ederer et al. (Ederer, 2022), the Temkin isotherm can be applied to describe MB pollutants on GO. The presence of diverse indirect MB interactions with the GO surface that is confirmed by the data of the nonlinear fitting probably comes from the interactions of the MB with GO carbon honeycomb structure and functional groups. Several researches have been also conducted with graphene oxide for the removal of diverse metallic ions, such as Cd, Al, Cu, Ni, Zn, Pb, and Co (Ahmada et al., 2016; Rodríguez et al., 2020; Kong, 2020; Wang, 2018). In all these cases, the Langmuir adsorption model had a very good fit for experimental data.
Table 3 represents a maximum adsorption capacity comparison among various adsorbents and components with their given experimental conditions and mathematical models applied for data fitting towards MB and MO dyes and the metallic ions of Cd2+ and Pb2+. There are noteworthy differences in qMax. values as may be expected. However, the lower uptakes of the GO/magnetic cellulose composite, magnetic multi/wall carbon nanotube, GO/polyaniline, CPOM, and fly ash/chitosan do not mean that they are inefficient subjects. The low qMax. levels of the studied pollutants through the adsorbents reported by other authors (Table 3) should be probably connected with some factors, including synthesis procedures, GO oxidation degree, the hydroxyl groups number of adsorbents' surface, and eventually the degree of structural vacancy defects in the honeycomb structures of the adsorbents such as GO. Conversely, due to any ionized and activated interactions with the dye structure at pH ∼ 7, the GO/SiO2 nanocomposite tends to improve considerably the MB adsorption capacity up to 555.50 (mg.g1). Overall, the comparison of the studied pollutants' adsorption on the synthetic nanocomposite and other individual components indicates that the present GO-ZnO would be likely to exhibit acceptable adsorption efficiency towards both given dyes and metal ions.
Adsorbent (Langmuir mathematical isotherm)
Pollutant
qMax. (mg.g−1)
Refs.
Magnetic multi/wall carbon nanotube
MB
11.86
(Gong, 2009)
GO/magnetic cellulose composite
MB
70.00
(Shi et al., 2014)
GO/SiO2
MB
555.50
(Dan et al., 2023)
GO/polyaniline
MB
6.70
(El-Sharkaway et al., 2019)
AC from sugarcane mills boiler residue
MO
161.8
(Martini et al., 2018)
Chitosan-grafted-polyaniline-OMMT (CPOM)
Cd2+
54.64
(Ahmada et al., 2016)
Fly Ash/chitosan
Cd2+
87.72
(Pandey and Tiwari, 2015)
NH2-MCM-41
Pb2+
57.74
(Heidari et al., 2009)
Sulfur functionalized graphene oxide (GO-SOxR)
Pb2+
285.00
(Pirveysian and Ghiaci, 2018)
GO-ZnO nanocomposite
MB
99.00
This work
MO
125
Cd2+
121.95
Pb2+
277.78
3.5 Antibacterial assay
Agar testing is a widely used method for evaluating the antibacterial activity of various materials. In this method, a nutrient-rich agar medium is used to grow bacterial colonies, which are then treated with the test material. The agar plates are then incubated under specific conditions to promote bacterial growth, and the degree of bacterial growth inhibition is evaluated by analyzing the size and number of bacterial colonies on the agar plates. The GO-ZnO nanocomposite might be a promising candidate for applying as an antibacterial agent due to its unique combination of properties. The high surface area of the nanocomposite enables it to adsorb bacterial cells, while the photocatalytic activity of the ZnO nanoparticles generates reactive oxygen species (ROS) that damage and kill bacterial cells. The graphene oxide component of the nanocomposite also contributes to its antibacterial activity by disrupting the cellular processes of bacteria. In the case of the agar testing, bacterial colonies of E. coli and Staphylococcus aureus were grown on agar plates, and the GO-ZnO nanocomposite was applied to the surface of the plates. The plates were then exposed to light to activate the photocatalytic activity of the nanocomposite. The results of the agar testing demonstrated (Table 4) that the synthetic GO-ZnO nanocomposite was highly effective against both bacterial pathogens. The nanocomposite significantly reduced the size and number of bacterial colonies on the agar plates, and in some cases, completely inhibited bacterial growth. The effectiveness of the nanocomposite in agar testing is likely due to a combination of factors. The high surface area of the nanocomposite allows for the adsorption of bacterial cells, while the photocatalytic activity of the ZnO nanoparticles generates ROS that damage and kill bacterial cells. Additionally, the graphene oxide component of the nanocomposite may disrupt the cellular processes of bacteria, contributing to its antibacterial activity.
Inhibition zone (mm)
GO (mm)
GO-ZnO(mm)
Staphylococcus aureus
13
19
Escherichia coli
11
16
Overall, the agar testing confirms the antibacterial activity of the synthetic GO-ZnO nanocomposite against E. coli and Staphylococcus aureus and suggests its potential for use in various antibacterial applications. The results of the study demonstrate the need for further investigations to determine the optimal concentration and exposure time of the nanocomposite to maximize its antibacterial activity. Additionally, further studies are necessary to fully understand the mechanism of action of the GO-ZnO nanocomposite and its potential side effects before it can be used in practical applications.
4 Conclusions
ZnO nanocomposite has been synthesized and characterized using different analysis techniques to study the structural properties of the nanocomposite, including XRD, to study the molecular structure of the synthesized compound and SEM to determine the distribution of nanoparticles on the graphene oxide layers, which has proven to be successful. Nanoparticles have been evenly distributed which gives the nanocomposite special properties such as high adsorption capacity and antibacterial activity against bacterial contaminations. The synthesized nanocomposite synthesized using a novel graphene oxide synthesis method has proven to be more efficient and useful in water treatment applications regarding to the high adsorption capacity and antibacterial activity. ability to adsorb high amounts of organic and inorganic pollutants 99, 125, 121.95and 277.77 (mg.g−1) for the MB, MO, Cd2+, and Pb2+, respectively, proves that the synthesized nanocomposite is suitable to be applied to surface waters and wastewater to reduce the environmental pollution disturbance.
Declaration of Competing Interest
The authors declare the following financial interests/personal relationships which may be considered as potential competing interests: [Hassan Hashemipour].
References
- Adsorption of Cr (VI) and Cd (II) on chitosan grafted polyaniline-OMMT nanocomposite: isotherms, kinetics and thermodynamics studies. Desalin. Water Treat.. 2016;58:144-153.
- [CrossRef] [Google Scholar]
- Preparation and optimization of novel graphene oxide and adsorption isotherm study of methylene blue. Arab. J. Chem.. 2021;14(3):103003
- [Google Scholar]
- Modelling and interpretation of adsorption isotherms. J. Chem.. 2017;2017:3039817.
- [CrossRef] [Google Scholar]
- Synthesis of modified chitosan TiO2 and SiO2 hydrogel nanocomposites for cadmium removal. J. Saudi Chem. Soc.. 2021;25(8):101283
- [CrossRef] [Google Scholar]
- Improved photocatalytic activity of CdSe-nanocomposites: effect of Montmorillonite support towards efficient removal of Indigo Carmine. Spectrochim Acta Part A Mol. Biomol. Spectrosc.. 2014;124:138-147.
- [CrossRef] [Google Scholar]
- Performance of graphene Oxide/SiO2 nanocomposite-based: antibacterial activity, dye and heavy metal removal. Arab. J. Chem.. 2023;16(2):104450
- [CrossRef] [Google Scholar]
- A study of methylene blue dye interaction and adsorption by monolayer graphene oxide. Adsorpt. Sci. Technol.. 2022;2022:7385541.
- [CrossRef] [Google Scholar]
- Removal of methylene blue from aqueous solutions using polyaniline/graphene oxide or polyaniline/reduced graphene oxide composites. Environ. Technol. 2019
- [Google Scholar]
- Adsorption and visible-light photocatalytic performance of a graphene derivative for methylene blue degradation. Environ. Nanotechnol., Monit. Manage.. 2020;14:100373
- [CrossRef] [Google Scholar]
- The effects of cadmium toxicity. Int. J. Environ. Res. Public Health. 2020;17(11):3782.
- [Google Scholar]
- Synthesis and characterization of Graphene-ZnO nanocomposite and its application in photovoltaic cells. J. nanostructures. 2013;3(4):453-459.
- [Google Scholar]
- Removal of cationic dyes from aqueous solution using magnetic multi-wall carbon nanotube nanocomposite as adsorbent. J. Hazard. Mater.. 2009;164(2–3):1517-1522.
- [Google Scholar]
- Removal of Ni(II), Cd(II), and Pb(II) from a ternary aqueous solution by amino functionalized mesoporous and nano mesoporous silica. Chem. Eng. J.. 2009;153(1):70-79.
- [CrossRef] [Google Scholar]
- Graphene oxide/zinc oxide nanocomposite: a superior adsorbent for removal of methylene blue-statistical analysis by response surface methodology (RSM) South African J. Chem.. 2016;69:105-112.
- [Google Scholar]
- The removal of fluoride from aqueous solution by a lateritic soil adsorption: kinetic and equilibrium studies. Ecotoxicol. Environ. Saf.. 2018;149:166-172.
- [CrossRef] [Google Scholar]
- Degradation of dichlorvos using hydrodynamic cavitation based treatment strategies. Ultrason. Sonochem.. 2012;19(3):532-539.
- [CrossRef] [Google Scholar]
- Enhanced photocatalytic performance of Al-doped ZnO NPs-reduced graphene oxide nanocomposite for removing of methyl orange dye from water under visible-light irradiation. J. Inorg. Organomet. Polym. Mater.. 2018;28:2677-2688.
- [Google Scholar]
- Removal of dyes using graphene-based composites: a review. Water, Air, Soil Pollut.. 2017;228:1-17.
- [Google Scholar]
- Relations between metal ion characteristics and adsorption performance of graphene oxide: a comprehensive experimental and theoretical study. Sep. Purif. Technol.. 2020;232:115956
- [CrossRef] [Google Scholar]
- Facile fabrication of ternary MWCNTs/ZnO/Chitosan nanocomposite for enhanced photocatalytic degradation of methylene blue and antibacterial activity. Sci. Rep.. 2022;12(1):5927.
- [CrossRef] [Google Scholar]
- Methyl orange and tartrazine yellow adsorption on activated carbon prepared from boiler residue: kinetics, isotherms, thermodynamics studies and material characterization. J. Environ. Chem. Eng.. 2018;6(5):6669-6679.
- [Google Scholar]
- Synthesis and characterization Agar/GO/ZnO NPs nanocomposite for removal of methylene blue and methyl orange as azo dyes from food industrial effluents. Food Chem. Toxicol.. 2022;169:113412
- [Google Scholar]
- Adsorption and kinetics studies of Cr (VI) by graphene oxide and reduced graphene oxide-zinc oxide nanocomposite. Molecules. 2022;27(21)
- [CrossRef] [Google Scholar]
- Preparation and characterization of a graphene-based magnetic nanocomposite for the adsorption of lanthanum ions from aqueous solution. Anal. Lett.. 2020;53(11):1812-1833.
- [Google Scholar]
- Facile approach to synthesize chitosan based composite—characterization and cadmium (II) ion adsorption studies. Carbohydr. Polym.. 2015;134:646-656.
- [Google Scholar]
- Adsorption of methylene blue on graphene oxide prepared from amorphous graphite: effects of pH and foreign ions. J. Mol. Liq.. 2016;221:82-87.
- [Google Scholar]
- Synthesis and characterization of sulfur functionalized graphene oxide nanosheets as efficient sorbent for removal of Pb2+, Cd2+, Ni2+ and Zn2+ ions from aqueous solution: a combined thermodynamic and kinetic studies. Appl. Surf. Sci.. 2018;428:98-109.
- [CrossRef] [Google Scholar]
- How to calculate adsorption isotherms of particles using two-parameter monolayer adsorption models and equations. Indones. J. Sci. Technol.. 2021;6(1):205-234.
- [Google Scholar]
- Graphene oxide–ZnO nanocomposites for removal of aluminum and copper ions from acid mine drainage wastewater. Int. J. Environ. Res. Public Health. 2020;17(18):pp.
- [CrossRef] [Google Scholar]
- Removal of Congo red, methylene blue and Cr(VI) ions from water using natural serpentine. J. Taiwan Inst. Chem. Eng.. 2018;82:102-116.
- [CrossRef] [Google Scholar]
- Synthesis and characterization of Co3O4 nanocube-doped polyaniline nanocomposites with enhanced methyl orange adsorption from aqueous solution. RSC Adv.. 2016;6:43388-43400.
- [Google Scholar]
- Graphene oxide-chitosan composite aerogel for adsorption of methyl orange and methylene blue: Effect of pH in single and binary systems. Colloids Surf. A Physicochem. Eng. Asp.. 2022;641:128595
- [CrossRef] [Google Scholar]
- Methylene blue adsorption from aqueous solution by magnetic cellulose/graphene oxide composite: equilibrium, kinetics, and thermodynamics. Ind. Eng. Chem. Res.. 2014;53(3):1108-1118.
- [Google Scholar]
- Sustainable removal of Cr (VI) using graphene oxide-zinc oxide nanohybrid: adsorption kinetics, isotherms and thermodynamics. Environ. Res.. 2022;203:111891
- [Google Scholar]
- Removal of methylene blue dye from wastewater using periodiated modified nanocellulose. Int. J. Chem. Eng. 2021:1-16.
- [Google Scholar]
- Methyl-orange and cadmium simultaneous removal using fly ash and photo-Fenton systems. J. Hazard. Mater.. 2013;244:773-779.
- [Google Scholar]
- The removal of lead ions from aqueous solution by using magnetic hydroxypropyl chitosan/oxidized multiwalled carbon nanotubes composites. J. Colloid Interface Sci.. 2015;451:7-14.
- [Google Scholar]
- Effect of graphene oxide surface modification on the elimination of Co(II) from aqueous solutions. Chem. Eng. J.. 2018;344:380-390.
- [CrossRef] [Google Scholar]
- Advances and challenges in developing efficient graphene oxide-based ZnO photocatalysts for dye photo-oxidation. Nanomaterials. 2020;10(5):932.
- [Google Scholar]
- Few-layered graphene oxide nanosheets as superior sorbents for heavy metal ion pollution management. Environ. Sci. Technol.. 2011;45(24):10454-10462.
- [Google Scholar]
Appendix A
Supplementary material
Supplementary data to this article can be found online at https://doi.org/10.1016/j.arabjc.2023.105176.
Appendix A
Supplementary material
The following are the Supplementary data to this article:Supplementary data 1
Supplementary data 1


