

Translate this page into:
Green and highly extraction of phenolic compounds and antioxidant capacity from kinkeliba (Combretum micranthum G. Don) by natural deep eutectic solvents (NADESs) using maceration, ultrasound-assisted extraction and homogenate-assisted extraction
⁎Corresponding author. zannouoscar@gmail.com (Oscar Zannou),
-
Received: ,
Accepted: ,
This article was originally published by Elsevier and was migrated to Scientific Scholar after the change of Publisher.
Peer review under responsibility of King Saud University.
Abstract
Kinkeliba (C. micranthum) is a tropical plant widely used for its tremendous phytochemicals and biological activities. In the present study, three green carboxylic acid-based natural deep eutectic solvents (NADESs) were used to assess the extraction of phenolic compounds in terms of total phenolic content (TPC), total flavonoid content (TFC), individual phenolic compounds and antioxidant capacity (DPPH and FRAP assays) from dried C. micranthum leaves. For the synthesis of NADESs choline chloride was used as hydrogen bond acceptors (HBA) in combination with lactic acid (ChLa), acetic acid (ChAa) and tartaric acid (ChTa) as hydrogen bond donors (HBDs). The conventional solvents including distilled water, pure methanol and pure ethanol were used for comparison. Three extraction methods including maceration extraction (ME), homogenate-assisted extraction (HAE) and ultrasound-assisted extraction (UAE) were tested to determine the best extraction conditions. The solvents combined with the extraction methods were successfully applied for the recovery of phenolic compounds from C. micranthum leaves. ChLa exhibited the highest performance giving the TPC (21.12 ± 0.13–23.62 ± 0.58 mg GAE/g, followed by ChAc (15.49 ± 0.13–18.85 ± 0.39 mg GAE/g), water (17.08 ± 0.32–18.13 ± 0.13 mg GAE/g), ChTa (14.49 ± 0.26–17.44 ± 0.19 mg GAE/g), methanol (7.46 ± 0.45–11.64 ± 0.32 mg GAE/g) and ethanol (2.88 ± 0.39–4.60 ± 0.39 mg GAE/g), respectively. For TFC, ChLa (4.38 ± 0.09–5.01 ± 0.09 mg ECE/g) was the most prominent solvent, followed by ChAc (2.84 ± 0.04–5.01 ± 0.36 mg ECE/g), methanol (1.93 ± 053–4.85 ± 0.04 mg ECE/g), ethanol (1.49 ± 0.36–4.16 ± 0.04 mg ECE/g), ChTa (1.09 ± 0.04–3.22 ± 0.13 mg ECE/g) and water (1.15 ± 0.04–1.37 ± 0.44 mg ECE/g), respectively. The acidic NADESs especially ChLa and ChAa exhibited the best efficiencies compared to the conventional solvents. Furthermore, UAE and HAE provided good extraction efficiency in a short extraction time (30 min) in terms of the TPC, TFC, individual phenolic compounds and the antioxidant capacity compared to ME which gave a similar yield with 12 h of extraction time. Principal component analysis (PCA) showed that C. micranthum extracts could clearly be discriminated in terms of phytochemical compounds and antioxidant capacity and UAE, HAE or ME combined with ChLa ChAc or ChTa were the best choices to higher extraction efficiency.
Keywords
Phenolic compounds
Kinkeliba
Combretum micranthum
Acidic NADESs
Extraction methods
Antioxidant capacity

1 Introduction
The devasting effects of the COVID-19 pandemic together with other challenges in health, demography and nutrition led to research of preventive and sustainable solutions. For example, foods with high bioactive compounds and biological activities have been suggested to reinforce the immune system during the COVID-19 pandemic (Galanakis, 2020). The phytochemical and biological activity surveys of Combretum micranthum G. Don have revealed the presence of many bioactive compounds with tremendous biological activities (Touré et al., 2011; Kpemissi et al., 2019). C. micranthum is from the Combretaceae family and is commonly known as kinkeliba. It is a dicotyledonous plant of 4–5 m height widely spread in West African countries. It is popularly employed as a traditional medicine for the prevention and treatment of wounds, sores, fever, malaria, cough, liver ailments, sleep disorder, headache, fatigue and bronchitis. Benoit et al. (1996) have proved the efficacy of C. micranthum against malarial, biliary fever, colic and vomiting. It is a rich source of bioactive ingredients and possesses many biological properties such as antioxidant (Touré et al., 2011; Beda et al., 2014), nephroprotective activity (Kpemissi et al., 2019; Kpemissi et al., 2020), anti-inflammatory (Olajide et al., 2003), anti-tyrosinase (Zeitoun et al., 2016), anti-diabetic (Tanko et al., 2017) and antimicrobial (Baba-Moussa et al., 1999; Ayodeji Akeem et al., 2012) activities. Recent clinical studies suggested that C. micranthum is a potential plant in preventing and managing hypertension (Seck et al., 2017; Welch et al., 2018; Bourqui et al., 2020) and brain functional damage (Mohammed et al., 2020). These biological activities of C. micranthum are closely linked with its richness in bioactive ingredients and particularly in phenolic compounds such as gallic acid, myricetin-3-O-rutinoside, rutin trihydrate, orientin, catechin, vitexin, quercitrin and benzoic acid (Touré et al., 2011; Welch et al., 2018; Kpemissi et al., 2019; Kpemissi et al., 2020; Zeitoun et al., 2020). In Africa, C. micranthum is widespread in the fields, streets and forests. It is also sold in the local market as a vegetable, spice or for medicinal purposes.
The efficient extraction of phenolic compounds requires an adequate choice of extraction techniques, solvents and extraction parameters. The phenolic compounds of C. micranthum are usually extracted from plants using conventional solvents such as methanol, ethanol, water, acetone and hexane. The use of these conventional solvents requires a long extraction time and a high quantity of solvents (Azmir et al., 2003). They are also lower extraction yields, lower thermal-resistant, lower contents of active constituents in the extracts and higher energy consumption (Azmir et al., 2003; Cui et al., 2018; Zannou et al., 2020). In addition, some of the conventional solvents can be harmful to human beings and environment since they are inflammable, volatile, explosive and toxic (Chemat et al., 2012; Azmir et al., 2003; Bursać Kovačević et al., 2018). Therefore, it is urgent to explore greener ways for the highly efficient extraction of phenolic compounds from C. micranthum. Natural deep eutectic solvent (NADES) is a novel class of green and sustainable solvent based on natural components such as carboxylic acids, choline chloride, urea, polyols and sugars. The application of NADES for the extraction of phenolic compounds has emerged as a greener approach, efficient and alternative to organic solvents (Chand Ali et al., 2019; El Kantar et al., 2019; Zannou and Koca, 2020). NADES is generated by mixing two or more natural constituents that are susceptible to self-associated via hydrogen bond interactions by forming a eutectic mixture with a melting point that is hugely below that of the individual constituents (Chand Ali et al., 2019; Alañón et al., 2018). The hydrogen bond interactions take place between the hydrogen bond donor (HBD) and the hydrogen bond acceptor (HBA).
NADESs generated from a wide range of natural constituents have been successfully employed for efficient extraction of phenolic compounds of various plants and derived products (Saha et al., 2019; Buldo et al., 2019; Chakroun et al., 2019; Pal and Jadeja, 2019; Barbieri et al., 2020; Zannou and Koca, 2020; Alsaud et al., 2021). To the best of our knowledge, no study has reported NADESs to extract and enhance the extraction yield of the phenolic compounds from C. micranthum. In the present study, NADESs were combined with the extraction techniques such as ultrasound-assisted extraction (UAE), homogenate-assisted extraction (HAE) and maceration (ME) for greener extraction of phenolic compounds from C. micranthum. NADES were constituted of choline chloride as HBA and acetic acid, lactic acid, and tartaric acid as HBD. The conventional solvents such as distilled water, ethanol and methanol were compared to the NADESs. The total phenolic content, total flavonoid content, DPPH radical scavenging activity and ferric reducing power, and the individual phenolic compounds of C. micranthum were determined.
2 Material and methods
2.1 Plant material
The leaves of kinkeliba (Combretum micranthum G. Don) were collected from Abomey-Calavi/Benin Republic. The leaves sun-dried for seven days and packed in brown bottles with screw caps.
2.2 Chemicals and reagents
Distilled water purified by a Millipore-Q system (Millipore Billerica, Massachusetts, USA). methanol (HPLC grade), ethanol (HPLC grade), acetonitrile (HPLC grade), 2,2-diphenyl-1-picrylhydrazyl (DPPH), 2,4,6-tris(2-pyridyl)-s-triazine (TPTZ, ≥99.0%), Folin-Ciocalteu reagent, Trolox (97%), sodium nitrite (99–100.5%), hydrochloric acid (36.5–38%), sodium carbonate (99.5–100.5%), choline chloride (≥98%), gallic acid (≥99.0) and other standards were bought from Sigma Aldrich Chemical Co. (St Louis, MO). Lactic acid (90%) was purchased from Isolab while aluminum chloride, iron (III) chloride and iron sulfate heptahydrate (≥99.5%) were brought from Merck. Sodium acetate anhydrous (≥99.0%), L(+) tartaric acid (>99%), glacial acetic acid (99.5%), potassium chloride (≥99.0%), and sodium hydroxide (≥97.0%) obtained from Carlo Erba.
2.3 Synthesis of NADESs
Three NADESs were synthesized using choline chloride as the hydrogen bond acceptor (HBA) and lactic acid, tartaric acid and acetic acid as hydrogen bond donors (HBD). The NADESs were obtained according to the preparation procedure described in Chanioti and Tzia (2018) with a slight modification. Briefly, choline chloride was mixed with each hydrogen bond donor at 1:2 M ratio, followed by the addition of 20% of distilled water. Then, the mixture was heated at 80 °C under constant stirring for 2 h. The NADESs obtained from the combination of choline chloride and lactic acid, tartaric acid and acetic acid were encoded as ChLa, ChTa and ChAa, respectively.
2.4 Extraction with NADES and conventional solvents
2.4.1 Ultrasound-assisted extraction (UAE)
A portion of 1 g of the comminuted C. micranthum leaves was mixed with 20 g of solvents (NADESs and conventional solvents) in extraction vessels and ultrasonicated in an ultrasonic bath (40 kHz, 296 W, WUC-A03H, daihan scientific Co., Ltd. Seoul, Korea) at room temperature (25 °C) for 30 min.
2.4.2 Homogenate-assisted extraction (HAE)
A portion of 1 g of the comminuted C. micranthum leaves was mixed with 20 g of solvents (NADESs and conventional solvents) in extraction tubes and homogenized at 100 rpm in a high-speed homogenizer (Unidrive Χ1000, CAT Scientific, Inc., Paso Robles, California) at room temperature (25 °C) for 30 min.
2.4.3 Maceration extraction (ME)
The macerationis a traditional extraction method used for the extraction of phenolic compounds from plant materials. The maceration was conducted using the maceration method described in Ćujić et al. (2016) with a slight modification. Briefly, a portion of 1 g of the comminuted C. micranthum leaves was mixed with 20 g of solvents (NADESs and conventional solvents) in extraction vessels and roughly shaken for 2 min to homogenize. Afterwards, the mixture was left at room temperature (25 °C) to extract for 12 h.
2.5 Total phenolic content (TPC)
The TPC was determined by the Folin-Ciocalteu method using the method of Singleton and Rossi (1965) with some modifications. Briefly, 150 µL of the appropriately diluted sample was mixed 750 µL of 10% Folin-Ciocalteu reagent and 600 μL of 7.5% (w/v) Na2CO3, respectively. The mixture was placed in the dark for 2 h and the absorbance was read at 760 nm using a UV- spectrophotometer (Thermo Spectronic). The TPC was expressed as mg gallic acid equivalent per g (mg GAE/g).
2.6 Total flavonoid content (TFC)
TFC was determined using the described method in Zannou and Koca (2020). Briefly, 1 mL of the appropriately diluted sample mixed with 300 µL of 5% NaNO2 and 500 µL of 5% AlCl3 and 500 µL of 1 M NaOH respectively. Afterwards, the mixture was placed in the dark for 10 min and the absorbance was read at 510 nm. The results were given as mg epicatechin equivalents per g (mg ECE/g).
2.7 DPPH radical scavenging activity assay (DPPH)
The DPPH assay was conducted according to the adopted method of Zannou et al. (2020). The DPPH solution was used as the control and the scavenging ratio was calculated as follows:
The values of DPPH radical scavenging were determined with a calibration curve as mmol Trolox equivalent per g (mmol TE/g).
2.8 Ferric reducing antioxidant power assay (FRAP)
The FRAP assay was conducted according to the procedure indicated in Benzie and Strain (1996). The values of FRAP was calculated from a calibration curve of FeSO4 and the results were given as mmol FeSO4 equivalents per g (mmol ISE/g).
2.9 Phenolic compounds profile of C. micranthum extracts via HPLC-DAD
The individual phenolic compounds of sumac were determined using the previous method of Bosiljkov et al. (2017) with modifications. The phenolic compounds were identified using a high-pressure liquid chromatography (HPLC) system (Agilent 1260; Agilent Technologies) coupled with a diode array detector (DAD) at 520 nm wavelength for anthocyanins and 280 nm for other phenolic compounds. The phenolic compounds were separated in an Inertsil ODS-4 column (3 µm, 4,6 × 50 mm; GL Sciences Kat No: 5020–0404) at a 1 mL.min−1 flow rate. The mobile phases were: (A) 94% 2 mM sodium acetate and 6% acetic acid (v/v); and (B) acetonitrile. The following elution gradient was used, according to solvent B: 0–20 min, 14–23%; 20–40 min, 23–35%; 40–50 min, 40%; 50–60 min, 60%; 60–65 min 95%. The column temperature was set at 30 °C. The individual phenolic compounds were identified by comparing their retention times with their respective standard. The identified phenolic compounds were quantified using a mixture of external standards which were prepared at different concentrations.
2.10 Statistical analyses
The experiments were carried out in triplicate. The results were given as mean ± standard deviation. The one-way analysis of variance (ANOVA) was performed for the statistical analyses using SPSS 18.0 (SPSS Inc., Chicago, IL, USA). Duncan's test was applied to determine the significance of the solvents' extractability results (p < 0.05). The independent t-test was performed to evaluate the significance of the extraction techniques (p < 0.05). Pearson's correlation test was used for the evaluation of the correlation between the antioxidant capacities of two independent tests (DPPH and FRAP) and total phenolic content, total flavonoid content and individual phenolic compounds. In addition, the principal component analysis (PCA) was performed (XL Stat software, Addinsoft, New York, NY, USA) to determine the correlations between the variables and properties of the extracts.
3 Results and discussion
3.1 Effects of solvents and extraction methods on phytochemical properties of C. Micranthum
In the present study, the efficiency of the synthesized NADESs to recover phenolic compounds from C. micranthum leaves was tested using two representative phytochemical indices such as TPC and TFC. Distilled water, ethanol and methanol were chosen as control solvents since they are the conventional solvents usually used for the extraction of phenolic compounds from plant material. Furthermore, the extractions were carried out using ultrasound-assisted extraction (UAE), homogenate-assisted extraction (HAE) and maceration (ME) techniques to show out the appropriate extraction methods. Extraction is the first and essential step in the isolation and purification of bioactive components from plants. The maceration is a traditional extraction technique applied for the recovery of bioactive compounds such as phenolic compounds. In recent years, new extraction techniques have been experimented for the extraction of bioactive compounds including ultrasound-assisted extraction and homogenate-assisted extraction, (Khoddami et al., 2013; Chanioti and Tzia, 2018). Although the extraction technique is essential in the extraction process, the solvent and other extraction parameters such as time and temperature play a key role in the recovery of bioactive compounds.
The extractability of phenolic compounds with ChLa, ChTa and ChAa, water, methanol and ethanol was shown in Fig. 1. The recovery of phenolic compounds from C. micranthum leaves was significantly affected by the type of solvents (p < 0.05). ChLa exhibited the highest performance giving the TPC varying between 21.12 ± 0.13 mg GAE/g and 23.62 ± 0.58 mg GAE/g depending on the extraction methods. ChLa was followed by ChAc (15.49 ± 0.13–18.85 ± 0.39 mg GAE/g), water (17.08 ± 0.32–18.13 ± 0.13 mg GAE/g), ChTa (14.49 ± 0.26–17.44 ± 0.19 mg GAE/g), methanol (7.46 ± 0.45–11.64 ± 0.32 mg GAE/g) and ethanol (2.88 ± 0.39–4.60 ± 0.39 mg GAE/g), respectively. For TFC, ChLa (4.38 ± 0.09–5.01 ± 0.09 mg ECE/g) was the most prominent solvent extracting the flavonoid compounds, followed by ChAc (2.84 ± 0.04–5.01 ± 0.36 mg ECE/g), methanol (1.93 ± 053–4.85 ± 0.04 mg ECE/g), ethanol (1.49 ± 0.36–4.16 ± 0.04 mg ECE/g), ChTa (1.09 ± 0.04–3.22 ± 0.13 mg ECE/g) and water (1.15 ± 0.04–1.37 ± 0.44 mg ECE/g), respectively. The NADESs and particularly ChLa and ChAa exhibited the highest extraction efficiency compared to the conventional solvents. This finding is in close accordance with the results reported by others who found that carboxylic-based NADESs have a high ability to extract phenolics from plants (Chanioti and Tzia, 2018; Zannou et al.2020; Zannou and Koca, 2020; Alsaud et al., 2021). The addition of 20% of water to NADESs enhanced their hydrophilicity and decreased their viscosity. Thus, the phenolic compounds of C. micranthum leaves were more dissolved in NADESs. Moreover, the interaction between the phenolic compounds and hydrogen bonds of NADESs (OH and/or Cl-) facilitated their removal (Alsaud et al., 2021). Hao et al. (2020) have reported that the higher ability of ChLa and ChAc of extracting the flavonoids is linked with the strong multiple hydrogen-bonding networks that choline chloride and carboxylic acid-based NADESs form with flavonoids. ChLa has shown the best performance compared to ChAa and ChTa. Therefore, ChLa may have more affinity with the phenolic compounds of C. micranthum leaves since the NADES which form high hydrogen bonding can perform better than other NADESs (Dai et al., 2016; Alsaud et al., 2021).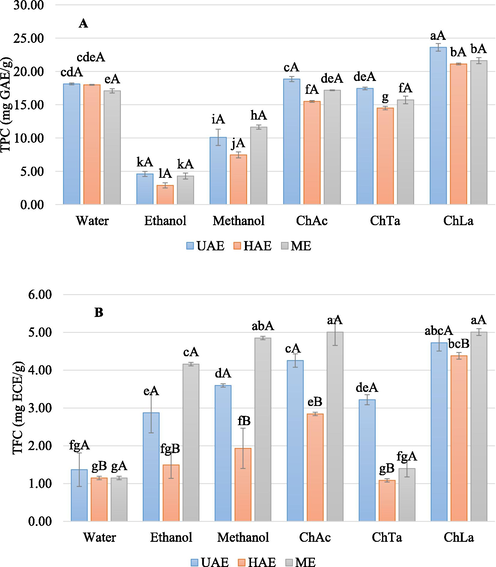
Recovery of phtychemical content from C. micranthum: (A) total phenolic content (TPC) and (B) total flavonoid content (TFC). a-l = Different lowercase letters indicate significant differences between solvents (P < 0.05). A-L = Different uppercase letters indicate significant differences between the extraction methods (P < 0.05).
The extraction methods did not have significant effects on the TPC, however, the TFC was significantly affected by the extraction methods (p < 0.05). For TPC, UAE was found to be the best method with extraction efficiency higher than HAE and ME. While the ME showed the best performance for the recovery of TFC, followed by UAE and HAE, respectively. It is worth mentioning that the dissolution of the phenolic compounds of C. micranthum leaves in the solvents was slow with ME (12 h), whereas UAE and HAE achieved close results with a very short time (30 min). These results are in close agreement with the previous studies where the novel extraction methods such as microwave-assisted extraction and ultrasound-assisted extraction have been reported to reduce significantly the extraction time as compared to maceration (Yılmaz et al., 2020; Tambun et al., 2021; Frohlich et al., 2022). The high yield and short timeframe of UAE and HAE are due to the disruption of the cell walls thanks to the ultrasound and high rotation speed, respectively. Wu et al. (2020) have demonstrated that the NADES-based UAE remarkably showed higher TPC, TFC, DPPH, ABTS+, OH− and FRAP values than maceration and stirring extraction. Also, Chanioti and Tzia (2018) have proved that NADES-based HAE was the best method compared to ultrasound-assisted extraction, high hydrostatic pressure-assisted extraction and microwave-assisted extraction for the extraction of phenolic compounds from olive pomace. Although ME requires a long extraction time, UAE, HAE and ME could be good choices to perform the extraction of phenolic compounds with NADES.
3.2 Antioxidant capacity of C. micranthum
The antioxidant capacity of C. micranthum leaves was measured with DPPH and FRAP assays which are the most common antioxidant capacity assays used in the literature. The DPPH assay displayed the antiradical capacity of the extract, while the FRAP assay measures the ability of the extract to reduce the ferric ions. The results of the antioxidant capacity of C. micranthum leaves were given in Table 1. As can be seen, both antiradical activity and FRAP of C. micranthum extracts were significantly affected by the types of solvents (p < 0.05). The total antiradical activity was ranged from 73.33 ± 19.69 mmol TE/g to 255.22 ± 3.94 mmol TE/g, while the FRAP changed from 43.60 ± 3.73 mmol ISE/g to 160.27 ± 0.39 mmol ISE/g. The extracts obtained from ChLa, ChAa and ChTa provided the highest antioxidant capacity compared to the conventional solvents. Several studies have mentioned the same tendencies, reporting the highest antioxidant capacity from NADES extracts obtained from acidic NADESs when compared to aqueous, methanolic and ethanolic extracts (Bakirtzi et al., 2016; Chanioti and Tzia, 2018; Barbieri et al., 2020; Alsaud et al., 2021). The highest antiradical activity was observed with ChLa, followed by ChAc and ChTa, whereas the best FRAP was achieved with ChTa followed by ethanol and ChAa. Since the NADESs with higher antiradical activity were found different from those giving higher FRAP, it can be concluded that the composition of NADES influences greatly the extraction of the targeted analytes. Many previous studies have been reported the same behavior of NADESs on the antioxidant capacity of various plant materials (Bakirtzi et al., 2016; Barbieri et al., 2020; Oliveira et al., 2021; Alsaud et al., 2021). Although the UAE proved to be the best method, there was no significant statistical difference was determined between UAE, HAE and ME (p < 0.05). Thus, these extraction methods are well-adapted to assist the acidic NADESs for the extraction of antioxidants from plants. a-m = Different lowercase letters indicate significant differences between solvents (P < 0.05). a-i = Different uppercase letters indicate significant differences between the extraction methods (P < 0.05).
Solvents
Antioxidant activity
DPPH radical scavenging activity
FRAP
UAE
HAE
ME
UAE
HAE
ME
Conventional
Water
125.30 ± 17.06fA
116.94 ± 5.25fA
150.35 ± 15.75eA
56.22 ± 0.39ijA
63.43 ± 1.96ghA
67.73 ± efA
Ethanol
73.33 ± 19.69hA
85.39 ± 7.87ghA
75.18 ± 6.56hA
92.57 ± 1.18dA
71.76 ± 4.71eA
90.49 ± 1.77dA
Methanol
83.53 ± 0.00ghA
87.25 ± 2.62ghA
103.95 ± 5.25fgA
59.55 ± 3.14hiA
43.60 ± 3.73nA
50.11 ± 1.57lmA
NADES
ChAa
224.59 ± 21.00bcA
200.46 ± 2.62cdA
216.24 ± 6.56bcA
68.43 ± 1.96efA
51.50 ± 0.78klA
52.75 ± jklA
ChTa
213.45 ± 5.25bcA
181.90 ± 10.50dA
208.82 ± 17.06bcA
154.03 ± 0.59bA
136.55 ± 0.98cA
160.27 ± 0.39aA
ChLa
255.22 ± 3.94aA
229.23 ± 3.94bA
231.09 ± 17.06bA
65.52 ± 0.98fgA
46.23 ± 0.00mnA
54.56 ± 0.78jkA
3.3 Phenolic profile of C. micranthum leaves
The phenolic compounds extracted from C. micranthum using the acidic NADESs and conventional solvents combined with ME, UAE and HAE were shown in Tables 2, 3 and 4. Twelve phenolic compounds including gallic acid, catechin, hydroxybenzoic acid, chlorogenic acid, vanillic acid, epicatechin, syringic, ρ-coumaric acid, ferulic acid, sinapic acid and quercetin-3-glucoside were identified in all the extracts. According to the literature in the C. micranthum, gallic acid, catechin, epicatechin, caffeic acid, chlorogenic acid, ρ-coumaric acid, vanillic acid and syringic acid have been reported in various extracts C. micranthum (Touré et al., 2011; Kpemissi et al., 2019; Kpemissi et al., 2020; Zeitoun et al., 2020). Mean value of three replicates ± standard deviation; a-f = Different lowercase letters indicate significant differences between solvents (P < 0.05); Sum = The sum of determined phenolic compounds ± standard deviation. Mean value of three replicates ± standard deviation; a-f = Different lowercase letters indicate significant differences between solvents (P < 0.05); Sum = The sum of determined phenolic compounds ± standard deviation. Mean value of three replicates ± standard deviation; a-f = Different lowercase letters indicate significant differences between solvents (P < 0.05); Sum = The sum of determined phenolic compounds ± standard deviation.
RT (min)
Phenolic compounds
Solvents
Water
Ethanol
Methanol
ChAc
ChLa
ChTa
4.87
Gallic acid
1269.54 ± 35.35a
25.09 ± 0.54e
137.97 ± 6.78d
575.46 ± 17.68b
501.02 ± 8.75c
530.46 ± 8.11c
14.29
Catechin
45.73 ± 0.05b
70.36 ± 2.90a
31.31 ± 1.67d
28.54 ± 0.35d
39.73 ± 0.23c
22.65 ± 0.11e
16.34
Hydroxybenzoic acid
65.94 ± 1.10a
0.96 ± 0.06f
23.22 ± 1.39d
54.40 ± 2.02b
40.94 ± 2.73c
3.78 ± 0.36e
17.86
Chlorogenic acid
14.67 ± 0.04e
14.99 ± 0.14e
39.57 ± 0.69d
84.69 ± 1.11a
76.86 ± 2.29b
46.32 ± 0.59c
21.05
Caffeic acid
133.93 ± 3.12a
1.65 ± 0.09f
55.60 ± 0.62d
126.81 ± 0.88b
68.90 ± 1.04c
29.85 ± 0.72e
22.01
Vanillic acid
41.13 ± 0.55e
20.28 ± 0.14f
45.61 ± 1.26d
88.41 ± 0.82a
77.00 ± 0.72b
49.13 ± 0.27c
24.76
Epicatechin
108.72 ± 1.35b
39.18 ± 0.37e
51.34 ± 0.85d
101.41 ± 3.88c
96.89 ± 2.31c
149.56 ± 1.20a
25.90
Syringic acid
48.32 ± 0.14c
10.04 ± 0.07f
36.98 ± 0.71d
69.93 ± 0.14a
49.80 ± 0.41b
28.12 ± 0.47e
33.85
ρ-coumaric acid
807.80 ± 12.05c
132.84 ± 1.75e
588.67 ± 2.94d
1394.24 ± 13.64a
1163.97 ± 18.65b
560.46 ± 11.59d
39.16
Ferulic acid
585.71 ± 6.60c
61.95 ± 2.52f
417.39 ± 5.83d
975.21 ± 5.85a
763.43 ± 6.23b
378.51 ± 3.46e
40.73
Sinapic acid
2321.44 ± 15.44c
330.05 ± 2.54e
1575.60 ± 50.89d
3805.27 ± 60.92a
3165.59 ± 68.15b
1559.95 ± 48.12d
43.11
Quercetin-3-glucoside
5828.66 ± 74.91e
2647.23 ± 51.53f
9578.45 ± 67.35c
16377.36 ± 37.07a
12317.99 ± 35.23b
7104.10 ± 40.83d
Sum
11271.59 ± 144.10
3354.62 ± 62.65
12581.71 ± 146.87
23681.73 ± 84.36
18362.12 ± 146.74
10462.89 ± 115.83
RT (min)
Phenolic compounds
Solvents
Water
Ethanol
Methanol
ChAc
ChLa
ChTa
4.87
Gallic acid
1321.52 ± 24.67a
24.03 ± 0.70e
127.61 ± 0.93d
773.76 ± 8.93b
796.63 ± 10.25b
577.94 ± 16.27c
14.29
Catechin
45.03 ± 1.22d
79.18 ± 1.45a
17.47 ± 0.35f
48.25 ± 1.09c
39.81 ± 0.64e
63.81 ± 0.06b
16.34
Hydroxybenzoic acid
69.46 ± 1.41a
1.18 ± 0.28e
16.72 ± 0.36d
47.28 ± 1.60c
59.91 ± 5.13b
18.79 ± 2.19d
17.86
Chlorogenic acid
14.95 ± 0.08e
14.93 ± 0.11e
33.49 ± 0.61d
72.86 ± 0.57b
86.42 ± 3.47a
56.00 ± 0.80c
21.05
Caffeic acid
140.69 ± 1.36a
1.78 ± 0.08e
40.63 ± 0.20d
86.15 ± 1.20b
87.06 ± 1.43b
56.03 ± 4.83c
22.01
Vanillic acid
41.31 ± 0.66d
20.92 ± f
35.55 ± 0.33e
86.72 ± 1.80b
91.37 ± 2.22a
66.30 ± 1.73c
24.76
Epicatechin
109.57 ± 3.24c
38.75 ± 0.02d
40.62 ± 0.34d
113.01 ± 3.97bc
130.13 ± 1.48a
117.76 ± 1.55b
25.90
Syringic acid
50.16 ± 1.22a
10.74 ± 0.04e
21.21 ± 1.67d
45.49 ± 1.23b
44.31 ± 0.70b
37.49 ± 1.30c
33.85
ρ-coumaric acid
800.45 ± 16.65c
133.88 ± 0.11e
418.86 ± 0.14d
1180.75 ± 12.03b
1313.11 ± 9.17a
780.23 ± 53.97c
39.16
Ferulic acid
574.04 ± 8.74c
66.06 ± 0.69e
306.08 ± 0.89d
806.05 ± 13.08b
909.65 ± 31.11a
544.73 ± 31.12c
40.73
Sinapic acid
2315.78 ± 20.46c
333.43 ± 1.88e
1150.56 ± 7.36d
3171.88 ± 72.07b
3518.23 ± 28.02a
2364.94 ± 31.81c
43.11
Quercetin-3-glucoside
5883.32 ± 85.33e
2632.28 ± 6.30f
7174.82 ± 23.67d
13284.00 ± 418.42b
14564.76 ± 394.05a
10729.98 ± 394.05c
Sum
11366.28 ± 165.04
3357.16 ± 32.58
9383.62 ± 36.85
19716.23 ± 522.91
21641.39 ± 487.67
15474.00 ± 538.38
RT (min)
Phenolic compounds
Solvents
Water
Ethanol
Methanol
ChAc
ChLa
ChTa
4.87
Gallic acid
976.03 ± 8.72a
28.80 ± 0.64d
105.61 ± 1.67c
771.12 ± 30.06b
779.07 ± 33.72b
741.31 ± 28.26b
14.29
Catechin
45.96 ± 0.68b
38.72 ± 2.16c
12.81 ± 1.02e
41.85 ± 0.54cb
29.93 ± 1.51d
61.64 ± 3.29a
16.34
Hydroxybenzoic acid
63.05 ± 1.70a
0.75 ± 0.01e
11.82 ± 0.78d
32.07 ± 0.80c
35.84 ± 0.58b
12.92 ± 1.67d
17.86
Chlorogenic acid
19.17 ± 0.09e
11.22 ± 0.06f
27.03 ± 0.80d
66.79 ± 1.60b
73.68 ± 1.08a
59.11 ± 0.56c
21.05
Caffeic acid
112.02 ± 8.58a
1.31 ± 0.09e
27.21 ± 0.79d
81.93 ± 1.42b
80.94 ± 3.99b
59.59 ± 2.28c
22.01
Vanillic acid
40.23 ± 0.37c
18.50 ± 0.05e
29.71 ± 0.10d
78.40 ± 1.43a
77.95 ± 0.53a
62.52 ± 1.76b
24.76
Epicatechin
102.07 ± 0.93c
39.22 ± 0.32e
41.83 ± 0.23d
103.45 ± 1.26c
108.26 ± 0.47b
113.03 ± 0.07a
25.90
Syringic acid
40.84 ± 0.37d
8.25 ± 0.19f
20.46 ± 0.42e
45.82 ± 1.70b
49.80 ± 0.12a
43.09 ± 0.19c
33.85
p-coumaric acid
779.97 ± 43.07d
101.51 ± 6.91f
323.80 ± 7.14e
1032.19 ± 23.83b
1168.25 ± 10.84a
847.81 ± 19.32c
39.16
Ferulic acid
505.10 ± 10.63d
44.64 ± 0.67f
226.70 ± 9.31e
735.85 ± 19.44b
789.01 ± 21.87a
561.56 ± 29.06c
40.73
Sinapic acid
1991.51 ± 134.66d
231.05 ± 10.82f
901.56 ± 22.02e
2785.22 ± 95.34b
3160.09 ± 31.09a
2391.19 ± 72.90c
43.11
Quercetin-3-glucoside
5274.02 ± 117.00d
1879.64 ± 28.89e
5688.54 ± 179.41d
14711.80 ± 93.55b
15915.97 ± 158.65a
11383.01 ± 432.67c
Sum
9949.97 ± 326.80
2403.61 ± 50.81
7417.08 ± 223.69
20487.15 ± 178.62
22268.79 ± 264.45
16336.78 ± 592.03
3.3.1 Recovery of C. micranthum phenolic compounds using acidic NADESs and ME
The extraction yield of C. micranthum phenolic compounds obtained from maceration using ChLa, ChAa, ChTa, water, methanol and ethanol was shown in Table 2. Maceration is a traditional and one of the most ancient extraction processes applied for the extraction of bioactive substances such as phenolic compounds. Although maceration is a time-consuming method, it has been reported to be adequate and subsequent for the recovery of antioxidants from various plant materials (Contini et al., 2008; Ćujić et al., 2016). Based on the experimental results, the type of the examined solvents significantly influenced the phenolic compounds of the extracts (p < 0.05) suggesting a great variation among the extraction yields (Table 2). The highest amounts of gallic acid, hydroxybenzoic acid and caffeic acid were obtained from the aqueous, ChAa and ChLa extracts, while catechin was highly dissolved in ethanol, water and ChLa. The highest amounts of chlorogenic acid, caffeic acid, vanillic acid and quercetin-3-glucoside were observed with ChAa, followed by ChLa, ChTa and methanol whereas the extracts obtained with ChAa, ChLa, water and methanol exhibited the best recovery of syringic acid, ρ-coumaric acid, ferulic acid and sinapic acid. In addition, ChTa achieved the best performance for the extraction of epicatechin, followed by water, ChAa, ChLa, methanol and ethanol. Considering the sum of the identified phenolic compounds from C. micranthum, the general order of the ME efficiency was: ChAa > ChLa > water > methanol > ChTa > ethanol. The synthesized NADESs yielded great amounts of the determined phenolic compounds from C. micranthum. It has been revealed that the hydroxyl groups of carboxylic acid (tartaric acid) interact with each other without affecting other protons, indicating a strong hydroxyl attraction from the chlorine anion (Koutsoukos et al., 2019). This kind of attraction between chemical groups leads to the formation of hydrogen bonds (Abbott et al., 2004; Koutsoukos et al., 2019) which increases the extraction yield of bioactive compounds from plants (Dai et al., 2013). Moreover, the carboxylic acid-based NADESs have been reported to be highly polar which therefore facilitate the extraction of polar substances such as phenolic compounds (Bubalo et al., 2016; Chanioti and Tzia, 2018).
3.3.2 Recovery of C. micranthum phenolic compounds using acidic NADESs and UAE
The effect of ultrasound-assisted extraction (UAE) on the recovery of C. micranthum phenolic compounds with acidic NADESs and conventional solvents was shown in Table 3. The high extraction of phenolic compounds by applying UAE is due to the known acoustic cavitation phenomenon and the bubbles generated on the solid surface, resulting in the disruption of cell walls, penetration of the solvent into the plant material and the release of the phenolic compounds (Chanioti and Tzia, 2017). The efficiency of UAE on the recovery of phenolic compounds from C. micranthum was significantly affected by the nature of the solvents (p < 0.05). The highest amounts of gallic acid, hydroxybenzoic acid, caffeic acid and syringic acid were extracted with water, followed by ChLa, ChAc, ChTa, methanol and ethanol. Whereas, the highest amounts of chlorogenic acid, vanillic acid, epicatechin, ρ-coumaric acid, ferulic acid, sinapic acid and quercetin-3-glucoside were extracted with ChLa, followed by ChAc, ChTa, methanol, water and ethanol. In addition, catechin was mostly extracted in ethanol, followed by ChTa, ChAa, water, ChLa and methanol. As can be observed, the amount of the target compounds changed greatly depending on the type of solvents. It is well known that solvent polarity, pH and hydrophilicity play a key role in incrementing the solubility of phenolic compounds. Moreover, NADES composition, hydrogen-bunding ability, surface tension and viscosity are important in the extraction of phenolics from plant materials (Dai et al., 2013; Cui et al., 2018). The acidic NADESs combined with UAE provided the best extraction yield of phenolic compounds from C. micranthum compared to the conventional solvents. These findings are in the same agreement with the previous studies which reported that the acidic NADESs are prominent for the recovery of phenolic compounds (Radošević et al., 2016; Bosiljkov et al., 2017; Chanioti and Tzia, 2017; Zannou and Koca, 2020). In general, the behavior observed for the sum of the investigated phenolic compounds was: ChLa > ChAa > ChTa > water > methanol > ethanol.
3.3.3 Recovery of C. micranthum phenolic compounds using acidic NADESs and HAE
The effect of homogenate-assisted extraction (HAE) combined with the acidic NADESs and conventional solvents on the recovery of C. micranthum phenolic compounds was shown in Table 4. The performance of the acidic NADESs combined with HAE on the extraction of phenolic compounds from C. micranthum varied significantly depending on the type of the solvents (p < 0.05). The highest amounts of gallic acid, hydroxybenzoic acid and caffeic acid were found with water, followed by ChLa, ChAc, ChTa, methanol and ethanol. The best extraction of vanillic acid, ρ-coumaric acid, ferulic acid, sinapic acid and quercetin-3-glucoside were observed with ChLa, followed by ChAc, ChTa, water, methanol, and ethanol. The highest recovery of chlorogenic acid was achieved with ChLa, followed by ChAc, ChTa, methanol, water and ethanol. In addition, the highest amount of catechin was obtained with ChTa, followed by water, ChAc, ethanol, ChLa and methanol, while epicatechin was mostly extracted ChTa, followed by ChLa, ChAc, water, methanol, and ethanol. The HAE is a good dispersion method since it disperses uniformly the sample in the solvent, softens the sample, facilitate penetration of the solvent into the inner part of the matrix and extract the target bioactive compounds from the matrix outer (Duan et al., 2015; Chanioti and Tzia, 2018). The high extraction yield obtained with the application of HAE is related to good disruption of the cell wall due to the stronger mechanical shear and liquid shear exerted by solvent and sample (Duan et al., 2018). The acidic NADESs combined with HAE provided the highest extraction efficiency compared to the water, methanol and ethanol. The general behavior observed for the sum of the investigated phenolic compounds was: ChLa > ChAa > ChTa > water > methanol > ethanol.
3.4 Correlation uisng Pearson's correlation test
3.4.1 Correlation between total phenolic content and antioxidant capacities
The results of correlation between the independent antioxidant capacities (DPPH and FRAP) were given in Table 5. For all the extraction methods, the correlation coefficients were higher and positive (R = 0.79–0.89, p = 0.018–0.064) between TPC and DPPH, while they were negative (R = (−0.17)–(−0.04), p = 0.755–0.946) between TPC and FRAP. Significant correlations between total phenolic content and DPPH provided strong evidence that the predominant source of antiradical activity derives from phenolic compounds in C. micranthum. Sariburun et al. (2010) suggested a strong correlation between total phenolic content and DPPH activity. The phenolic compounds are the most important antioxidants of plant materials acting as primary antioxidants or free radical terminators (Sulaiman et al., 2011). The negative correlation between TPC and FRAP confirmed that phenolic compounds are not the only antioxidants of C. micranthum extracts. Sulaiman et al. (2011) confirmed that the antioxidant capacity depends on several factors including the extraction solvent, hydrophilicity of compounds, plant material and type of phenolic compounds. The type and concentration of the phenolic compounds and the presence of non-phenolic antioxidants should be accountable of the antioxidant capacity of plant material and extracts (Socha et al., 2009; Sulaiman et al., 2011). Obviously, the non-phenolic antioxidants in C. micranthum including amino acids, minerals and vitamins (vitamins C and E) might contribute to the FRAP activity. p = p value for a 2-tailed test; * Correlation is significant at the 0.05 level (2-tailed); ** Correlation is significant at the 0.01 level (2-tailed).
Extraction methods
UAE
HAE
ME
Antioxidant activity
Factors
DPPH
FRAP
DPPH
FRAP
DPPH
FRAP
TPC
R = 0.88*; p = 0.021
R = −0.08; p = 0.882
R = 0.79; p = 0.064
R = −0.04; p = 0.946
R = 0.89*; p = 0.018
R = −0.17;p = 0.755
TFC
R = 0.60 ; p = 0.213
R = −0.02; p = 0.972
R = 0.68; p = 0.136
R = −0.57; p = 0.242
R = −0.04; p = 0.945
R = −0.65; p = 0.161
Gallic acid
R = 0.43; p = 0.165
R = −0.022; p = 0.947
R = 0.66*; p = 0.019
R = 0.21; p = 0.506
R = 0.41; p = 0.180
R = −0.07; p = 0.834
Catechin
R = 0.10; p = 0.756
R = 0.06; p = 0.856
R = 0.61*; p = 0.036
R = −0.19; p = 0.546
R = −0.72**; p = 0.008
R = 0.34; p = 0.279
Hydroxybenzoic acid
R = 0.35; p = 0.270
R = 0.21; p = 0.516
R = 0.13; p = 0.695
R = p = 0.454
R = 0.28; p = 0.372
R = 0.06; p = 0.850
Chlorogenic acid
R = 0.80**; p = 0.002
R = 0.56; p = 0.059
R = 0.88**; p < 0.0001
R = 0.37; p = 0.235
R = 0.72**; p = 0.008
R = 0.26; p = 0.41
Caffeic acid
R = 0.34; p = 0.279
R = −0.07; p = 0.82
R = 0.47; p = 0.128
R = 0.20; p = 0.528
R = 0.37; p = 0.241
R = −0.15; p = 0.638
Vanillic acid
R = 0.88**; p < 0.0001
R = 0.45; p = 0.141
R = 0.88**; p < 0.0001
R = 0.36; p = 0.254
R = 0.76**; p = 0.004
R = 0.26; p = 0.407
Epicatechin
R = 0.86**; p < 0.0001
R = 0.29; p = 0.368
R = 0.84**; p = 0.001
R = 0.25; p = 0.438
R = 0.87**; p < 0.0001
R = −0.10; p = 0.751
Syringic acid
R = 0.66*; p = 0.020
R = 0.05; p = 0.874
R = 0.80**; p = 0.002
R = 0.31; p = 0.330
R = 0.59*; p = 0.045
R = −0.01; p = 0.971
ρ-coumaric acid
R = 0.78**; p = 0.003
R = 0.41; p = 0.189
R = 0.80**; p = 0.002
R = 0.41; p = 0.182
R = 0.70*; p = 0.012
R = 0.19; 0.555
Ferulic acid
R = 0.77**; p < 0.003
R = 0.38; p < 0.218
R = 0.80**; p = 0.002
R = 0.39; p = 0.214
R = 0.68*; p = 0.015
R = 0.12; p = 0.707
Sinapic acid
R = 0.81**; p = 0.001
R = 0.36; p = 0.256
R = 0.83**; p = 0.001
R = 0.40; p = 0.199
R = 0.70*; p = 0.012
R = 0.18; p = 0.578
Quercetin-3-glucoside
R = 0.80**; p = 0.002
R = 0.49; p = 0.108
R = 0.84**; p = 0.001
R = 0.40; p = 0.196
R = 0.62*; p = 0.032
R = 0.18; p = 0.587
3.4.2 Correlation between total flavonoid content and antioxidant capacities
Table 5 showed the Pearson’s correlation coefficients among TFC and independent antioxidant capacities (DPPH and FRAP) in C. micranthum extracts. The correlation coefficients between TFC and DPPH were positively significant and moderate ranging from 0.60 to 0.68 (p = 0.136–0.213) for UAE and HAE, while for the extraction method ME, the correlation coefficient found TFC and DPPH was negative (R = −0.04, p = 0.945). It can be concluded that although the hydrogen donating abilities of the extracts might depend on TFC, the extraction methods influence this correlation. The correlations between TFC and FRAP were negative (R= (−0.65)–(−0.02), p = 0.161–0.972) for all the extraction methods (Table 5), suggesting that the TFC might not actively contribute to FRAP activity.
3.4.3 Correlation between phenolic compounds and antioxidant capacities
The results of Pearson’s correlation showing the relationship between phenolic compounds of C. micranthum and antioxidant capacities were given in Table 5. For all the extraction methods, the phenolic compounds showed a strong or moderate and positive significant linear relationship with DPPH activity, except catechin obtained with ME which showed a negative correlation. These results supported those reported above for TPC and TFC which displayed a positive significant relationship with DPPH. Chlorogenic acid (R = 0.72–0.88, p < 0.008–0.0001), vanillic acid (R = 0.76–0.88, p < 0.004–0.0001), epicatechin (R = 0.84–0.88, p < 0.001–0.0001), ρ-coumaric acid (R = 0.70–0.80, p < 0.002–0.012), ferulic acid (R = 0.68–0.80, p < 0.003–0.015), sinapic acid (R = 0.70–0.81, p < 0.001–0.012), quercetin-3-glucoside (R = 0.62–0.84, p < 0.032–0.001) and syringic acid (R = 0.59–0.80, p < 0.002–0.045) displayed strong positive linear correlation with DPPH. In addition, gallic acid (R = 0.41–0.66, p < 0.019–0.180) displayed a moderate positive linear correlation with DPPH with hydroxybenzoic acid (R = 0.13–0.35, p = 0.270–0.695) exhibited a weak positive linear correlation with DPPH. These findings indicated that these phenolic compounds are the main components responsible for the antioxidant behavior of C. micranthum in terms of DPPH activity. This statistically significant correlation was found in agreement with the findings of other authors (Socha et al., 2009; José Jara-Palacios et al., 2018), who also found a strong relationship between DPPH activity and the above mentioned phenolic compounds of C. micranthum. In contrast, the phenolic compounds determined in this study displayed negative or linear weak to moderate correlation with FRAP (Table 5). This result corroborates with the results of TPC and TFC which provided a negative or low correlation with FRAP. Thus, it can be assessed that FRAP values of the studied C. micranthum extracts were mostly linked to the non-phenolic antioxidant compounds.
3.5 Correlation and properties of differents extracts obtained with acidic NADESs and conventional solvents using ME, UAE and HAE
Principle component analysis (PCA) was performed to display the correlation of TPC, TFC, the antioxidant capacity and the phenolic compounds extracted from C. micranthum by using the green acidic NADESs combined with UAE, HAE and ME (Fig. 2). A total of sixteen variables (TPC, TFC, DPPH, FRAP and 12 individual phenolic compounds) were used for the PCA, contributing to a total of 79.27% of the total variation extraction experiments. The points on the loading plot assigned the contribution of a variable to the score, while the points on the score plot represented an investigated sample. The first principal component factor (PC1) contributed for 64.4% of the total variation of extraction experiments while the second principal component factor (PC2) described 14.83% of the variations. As can be seen in the PCA biplot, most of the investigated variables had positive effects on PC1, except FRAP, catechin and TFC which had a negative effect on PC1. Gallic acid, chlorogenic acid, quercetin-3-glucoside, vanillic acid, DPPH, ferulic acid, sinapic acid, TPC, ρ-coumaric acid and syringic acid positively correlated with each other. Furthermore, there are positive correlations between TPC, syringic acid, epicatechin, hydroxybenzoic acid, caffeic acid and gallic acid. Likewise, there is a positive correlation between FRAP and catechin.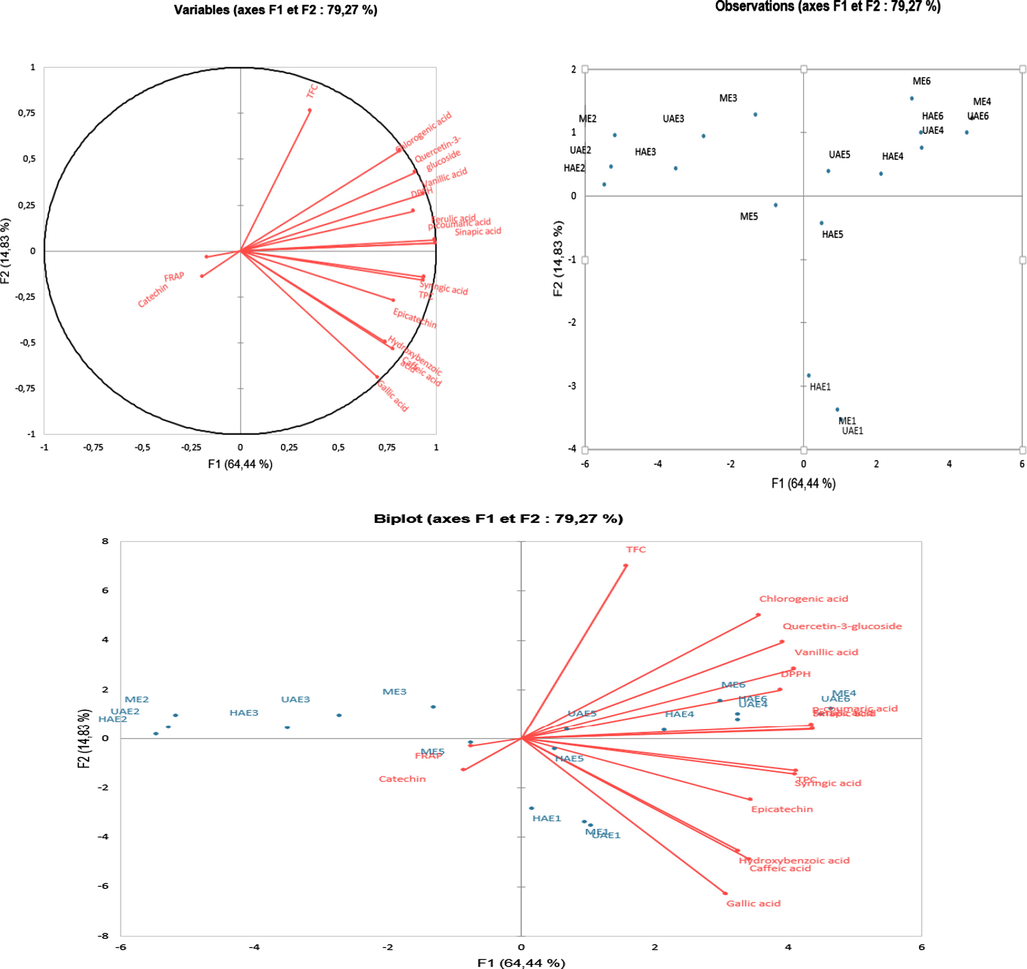
PCA biplot of the extracts obtained from C. micranthum with NADESs and conventional solvents combined with ME, UAE and HAE.
The coded values of the PCA score plot representing the extracts were shown in Table 6. According to the PCA score plot, 4 main groups of extracts were observed: (1) ME4, ME6, UAE4, UAE5, UAE6, HAE4, HAE5 and HAE 6; (2) ME1, UAE1 and HAE1; (3) ME2, UAE2 and HAE2; and (4) ME3, UAE3 and HAE3. The extracts of the group (1) confirmed that the best efficiencies were achieved with UAE, HAE and ME combined with ChLa ChAc and ChTa. These extracts conditions were particularly efficient for the recovery of TFC, chlorogenic acid, gallic acid, quercetin-3-glucoside, vanillic acid, DPPH, ferulic acid, sinapic acid, TPC, ρ-coumaric acid and syringic acid. The extraction time (12 h) applied during the maceration extraction was quite long for the solvents to penetrate and break the cell walls of the raw material, allowing the analytes to dissolve efficiently in the solvents. As can be acknowledged, the great performance of HAE at a short time (30 min) could be related to both processes of raw material-pulverizing with mechanical shear force and mixing of solid with solvent (Sun et al., 2017; Duan et al., 2018; Chanioti and Tzia, 2018). Likewise, the highest performances achieved by UAE at a short extraction time (30 min) could be attributed to the ultrasound waves that disrupted the plant cell walls, increased the solvent penetration and improved the mass transfer between the solvents and solute (Hossain et al., 2012; Altemimi et al., 2016).
Solvents
Extraction methods
Extracts
Code
Water
Maceration extraction
ME-water
ME1
Ethanol
ME-ethanol
ME2
Methanol
ME-methanol
ME3
ChAc
ME-ChAc
ME4
ChTa
ME-ChTa
ME5
ChLa
ME-ChLa
ME6
Water
Ultrasound-assisted extraction
UAE-water
UAE1
Ethanol
UAE-ethanol
UAE2
Methanol
UAE-methanol
UAE3
ChAc
UAE-ChAc
UAE4
ChTa
UAE-ChTa
UAE5
ChLa
UAE-ChLa
UAE6
Water
Homognate-assisted extraction
ME-water
HAE1
Ethanol
ME-ethanol
HAE2
Methanol
ME-methanol
HAE3
ChAc
ME-ChAc
HAE4
ChTa
ME-ChTa
HAE5
ChLa
ME-ChLa
HAE6
The values of the group (2) revealed that the extracts obtained with water using ME, UAE and HAE showed similar characteristics of syringic acid, TPC, epicatechin, hydroxybenzoic acid caffeic acid and gallic acid. ME, UAE and HAE were found effective for the extraction of these phenolic compounds. The highest recovery of these phenolic compounds could be attributed to their high hydrophilic properties (Deng et al., 2012; Rodríguez-Roque et al., 2015). The samples of groups (3) and (4) indicated that the extraction of phenolic compounds from C. micranthum using ME, UAE and HAE combined with pure methanol and ethanol was less efficient. In addition, the lowest yields were determined with the ethanolic extracts. The previous studies have demonstrated that the extraction of antioxidants such as phenolic compounds with pure methanol or ethanol is less efficient and many authors have suggested the addition of 10–50% of water to pure methanol or ethanol in order to improve their efficiency in extracting the bioactive compounds (Odabaş and Koca, 2016; Kumar and Srinivasa Rao, 2020; Phuong et al., 2020; Saha et al., 2020).
4 Conclusion
In the present study, the extraction efficiency of the phenolic antioxidants of C. micranthum was investigated using a combination of three green acidic NADESs (choline chloride-lactic acid (ChLa), choline chloride-acetic acid (ChAa) and choline chloride-tartaric acid (ChTa)) combined with maceration (ME), homogenate-assisted (HAE) and ultrasound-assisted (UAE) extraction methods. The results revealed that the combination of NADESs with MAE, HAE and ultrasounds (UAE) were promising and efficient media for the extraction of phenolic compounds from C. micranthum. ChLa exhibited the highest performance giving the TPC (21.12 ± 0.13–23.62 ± 0.58 mg GAE/g, followed by ChAc (15.49 ± 0.13–18.85 ± 0.39 mg GAE/g), water (17.08 ± 0.32–18.13 ± 0.13 mg GAE/g), ChTa (14.49 ± 0.26–17.44 ± 0.19 mg GAE/g), methanol (7.46 ± 0.45–11.64 ± 0.32 mg GAE/g) and ethanol (2.88 ± 0.39–4.60 ± 0.39 mg GAE/g), respectively. For TFC, ChLa (4.38 ± 0.09–5.01 ± 0.09 mg ECE/g) was the most prominent solvent, followed by ChAc (2.84 ± 0.04–5.01 ± 0.36 mg ECE/g), methanol (1.93 ± 053–4.85 ± 0.04 mg ECE/g), ethanol (1.49 ± 0.36–4.16 ± 0.04 mg ECE/g), ChTa (1.09 ± 0.04–3.22 ± 0.13 mg ECE/g) and water (1.15 ± 0.04–1.37 ± 0.44 mg ECE/g), respectively. The highest yield of TPC was determined with UAE-ChLa, followed by ME-ChLa and HAE-ChLa, while The highest yield of TFC was found with ME-ChLa, followed by ME-ChAa and UAE-ChLa. The total antiradical activity was 73.33 ± 19.69–255.22 ± 3.94 mmol TE/g, while the FRAP was found as 43.60 ± 3.73–160.27 ± 0.39 mmol ISE/g. The best yield of DPPH radical scavenging activiy was found with UAE-ChLA, followed by ME-ChLa and HAE-ChLa, whereas the best yield of FRAP was achieved with ME-ChTa, followed by UAE-ChTA and HAE-ChTA. The extracts obtained from NADESs were found to be more enriched in phenolic compounds as compared with the conventional solvents such as water, ethanol and methanol. Homogenate-assisted extraction and ultrasound-assisted extraction achieved similar performance to that of maceration very short extraction time. The evaluated acidic NADESs offered sustainability and greener extractability of phenolic compounds from C. micranthum leaves. Moreover, the association of these NADESs with homogenate-assisted extraction and ultrasound-assisted extraction are prominent to increase significantly the extraction efficiencies in a very reduced time.
Acknowledgement
Authors thank the Scientific Research Projects Office of Ondokuz Mayis University for funding this project (Grant Number PYO. MUH.1904.20.010). Authors would also like to acknowledge the support of the Agricultural Research Station at North Carolina Agricultural and Technical State University (Greensboro, NC 27411, USA). This research was funded, in part, by Grants (project Number NC.X337-5-21-170-1 and NC.X341-5-21-170-1) from the National Institute of Food and Agriculture (NIFA). Its contents are solely the responsibility of the authors and do not necessarily represent the official views of NIFA.
Declaration of Competing Interest
The authors declare that they have no known competing financial interests or personal relationships that could have appeared to influence the work reported in this paper.
References
- Deep Eutectic Solvents Formed between Choline Chloride and Carboxylic Acids: Versatile Alternatives to Ionic Liquids. J. Am. Chem. Soc.. 2004;126(29):9142-9147.
- [CrossRef] [Google Scholar]
- Choline chloride derivative-based deep eutectic liquids as novel green alternative solvents for extraction of phenolic compounds from olive leaf. Arab. J. Chem.. 2018;14(8):103257.
- [CrossRef] [Google Scholar]
- Application of deep eutectic solvents in the extraction of polyphenolic antioxidants from New Zealand Manuka leaves (Leptospermum Scoparium): optimization and antioxidant activity. J. Mol. Liq.. 2021;337:116385.
- [CrossRef] [Google Scholar]
- Ultrasound assisted extraction of phenolic compounds from peaches and pumpkins. Plos One. 2016;11(2):e0148758.
- [CrossRef] [Google Scholar]
- Antibacterial potentials of the ethanolic extract of the stem bark of Combretum micranthum G. Don and its fractions. J. Plant Stud.. 2012;1(2):75-81.
- [CrossRef] [Google Scholar]
- Techniques for extraction of bioactive compounds from plant materials: a review. J. Food Eng.. 2003;117:426-436.
- [Google Scholar]
- Antifungal activities of seven West African Combretaceae used in traditional medicine. J. Ethnopharmacol.. 1999;66:335-338.
- [Google Scholar]
- Novel lactic acidbased natural deep eutectic solvents: efficiency in the ultrasoundassisted extraction of antioxidant polyphenols from common native Greek medicinal plants. J. Appl. Res. Med. Aromat. Plants. 2016;3:120-127.
- [CrossRef] [Google Scholar]
- Deep eutectic solvents applied in the extraction and stabilization of rosemary (Rosmarinus officinalis L.) phenolic compounds. Ind. Crop. Prod.. 2020;144:112049.
- [CrossRef] [Google Scholar]
- Optimization of water-extract of phenolic and antioxidant compounds from kinkéliba (Combretum micranthum) leaves. Afr. J. Food Sci. Res.. 2014;2(1):37-43.
- [Google Scholar]
- In vitro antimalarial activity of vegetal extracts used in west african traditional medicine. Am. J. Trop. Med. Hyg.. 1996;54:67-71.
- [Google Scholar]
- Hypertension treatment with Combretum micranthum or Hibiscus sabdariffa, as decoction or tablet: a randomized clinical trial. J. Hum. Hypertens.. 2020;35(9):800-808.
- [CrossRef] [Google Scholar]
- Detoxification of olive mill wastewaters by liquid-liquid extraction with natural deep eutectic solvents. Chem. Eng. Trans.. 2019;74:1495-1500.
- [Google Scholar]
- Pressurized hot water extraction (PHWE) for the green recovery of bioactive compounds and steviol glycosides from Stevia rebaudiana Bertoni leaves. Food Chem.. 2018;254:150-157.
- [CrossRef] [Google Scholar]
- Enhanced-performance extraction of olive (Olea europaea) leaf polyphenols using L-lactic acid/ammonium acetate deep eutectic solvent combined with β-cyclodextrin: screening, optimisation, temperature effects and stability. Biomass Convers. Biorefin.. 2019;11:1125-1136.
- [Google Scholar]
- Effective extraction of flavonoids from Lycium barbarum L. fruits by deep eutectic solvents-based ultrasound-assisted extraction. Talanta. 2019;203:16-22.
- [CrossRef] [Google Scholar]
- Extraction of phenolic compounds from olive pomace by using natural deep eutectic solvents and innovative extraction techniques. Innov. Food Sci. Emerg. Technol.. 2018;48:228-239.
- [CrossRef] [Google Scholar]
- Optimization of ultrasound-assisted extraction of oil from olive pomace using response surface technology: oil recovery, unsaponifiable matter, total phenol content and antioxidant activity. LWT – Food Sci. Technol.. 2017;79:178-189.
- [Google Scholar]
- Green extraction of natural products: concept and principles. Int. J. Mol. Sci.. 2012;13:8615-8627.
- [Google Scholar]
- Extraction of natural antioxidants from hazelnut (Corylus avellana L.) shell and skin wastes by long maceration at room temperature. Food Chem.. 2008;110(3):659-669.
- [CrossRef] [Google Scholar]
- Sustainable deep eutectic solvents preparation and their efficiency in extraction and enrichment of main bioactive flavonoids from sea buckthorn leaves. J. Clean. Prod.. 2018;184:826-835.
- [CrossRef] [Google Scholar]
- Optimization of polyphenols extraction from dried chokeberry using maceration as traditional technique. Food Chem.. 2016;194:135-142.
- [CrossRef] [Google Scholar]
- Application of natural deep eutectic solvents to the extraction of anthocyanins from Catharanthus roseus with high extractability and stability replacing conventional organic solvents. J. Chromatogr. A.. 2016;1434:50-56.
- [Google Scholar]
- Natural Deep Eutectic Solvents as a new extraction media for phenolic metabolites in Carthamus tinctorius L. Anal. Chem.. 2013;85(13):6272-6278.
- [CrossRef] [Google Scholar]
- Determination of antioxidant property and their lipophilic and hydrophilic phenolic contents in cereal grains. J. Funct. Foods. 2012;4(4):906-914.
- [CrossRef] [Google Scholar]
- Homogenate-assisted high-pressure disruption extraction of phenolic acids from Lonicerae japonicae Flos analyzed by HPLC. J. Chromatogr. B. 2018;1097–1098:119-127.
- [CrossRef] [Google Scholar]
- Homogenate-assisted negative pressure cavitation extraction of active compounds from Pyrola incarnata Fisch. and the extraction kinetics study. Innovative Food Sci. Emerg. Technol.. 2015;27:86-93.
- [CrossRef] [Google Scholar]
- Green extraction of polyphenols from grapefruit peels using high voltage electrical discharges, deep eutectic solvents and aqueous glycerol. Food Chem.. 2019;295:165-171.
- [Google Scholar]
- Evaluation of the ethanolic ultrasound-assisted extraction from clove (Syzygium aromaticum) leaves and chemical characterization of the extracts. Food Chem.. 2022;373:131351.
- [CrossRef] [Google Scholar]
- The food systems in the era of the coronavirus (COVID-19) pandemic crisis. Foods. 2020;9:523.
- [CrossRef] [Google Scholar]
- Extraction of flavonoids from Scutellariae radix using ultrasound-assisted deep eutectic solvents and evaluation of their anti-inflammatory activities. ACS Omega. 2020;5:23140-23147.
- [CrossRef] [Google Scholar]
- Optimization of ultrasound assisted extraction of antioxidant compounds from marjoram (Origanum majorana L.) using response surface methodology. Ultrason. Sonochem.. 2012;19(3):582-590.
- [CrossRef] [Google Scholar]
- Effects of in vitro gastrointestinal digestion on phenolic compounds and antioxidant activity of different white winemaking byproducts extracts. Food Res. Int.. 2018;109:433-439.
- [CrossRef] [Google Scholar]
- Techniques for analysis of plant phenolic compounds. Molecules. 2013;18(2):2328-2375.
- [CrossRef] [Google Scholar]
- Choline chloride and tartaric acid, a Natural Deep Eutectic Solvent for the efficient extraction of phenolic and carotenoid compounds. J. Clean. Prod.. 2019;241:118384.
- [CrossRef] [Google Scholar]
- Nephroprotective effect of Combretum micranthum G. Don in nicotinamide-streptozotocin induced diabetic nephropathy in rats: in-vivo and in-silico experiments. J. Ethnopharmacol.. 2020;261
- [CrossRef] [Google Scholar]
- Antioxidant and nephroprotection activities of Combretum micranthum: a phytochemical, in-vitro and ex-vivo studies. Heliyon. 2019;5(3):e01365.
- [CrossRef] [Google Scholar]
- Optimization of pulsed-mode ultrasound assisted extraction of bioactive compounds from pomegranate peel using response surface methodology. J. Food Meas. Charact.. 2020;14:3493-3507.
- [CrossRef] [Google Scholar]
- Effect of Combretum micranthum methanol leaf extract against exposure to lead on behavioral activities in mice. J. Biomed. Therapy. Sci.. 2020;7(1):1-6.
- [Google Scholar]
- Application of response surface methodology for optimizing the recovery of phenolic compounds from hazelnut skin using different extraction methods. Ind. Crops Prod.. 2016;91:114-124.
- [CrossRef] [Google Scholar]
- Evaluation of the anti-inflammatory property of the extract of Combretum micranthum G. Don (Combretaceae) Inflammopharmacol.. 2003;11(3):293-298.
- [Google Scholar]
- Extraction of bioactive compounds from Curcuma longa L. using deep eutectic solvents: in vitro and in vivo biological activities. Innov. Food Sci. Emerg. Technol.. 2021;70
- [CrossRef] [Google Scholar]
- Deep eutectic solvent-based extraction of polyphenolic antioxidants from onion (Allium cepa L.) peel. J. Sci. Food Agric.. 2019;99:1969-1979.
- [CrossRef] [Google Scholar]
- Selection of extraction conditions of phenolic compounds from rambutan (Nephelium lappaceum L.) peel. Food Bioprod. Process.. 2020;122:222-229.
- [CrossRef] [Google Scholar]
- Impact of food matrix and processing on the in vitro bioaccessibility of vitamin C, phenolic compounds, and hydrophilic antioxidant activity from fruit juice-based beverages. J. Funct. Foods.. 2015;14:33-43.
- [CrossRef] [Google Scholar]
- Valorization of Java citronella (Cymbopogon winterianus Jowitt) distillation waste as a potential source of phenolics/antioxidant: influence of extraction solvents. J. Food Sci. Technol.. 2020;58(1):255-266.
- [CrossRef] [Google Scholar]
- Effect of choline chloride-oxalic acid based deep eutectic solvent on the ultrasonic assisted extraction of polyphenols from Aegle marmelos. J. Mol. Liq.. 2019;287:110956.
- [Google Scholar]
- Phenolic content and antioxidant activity of raspberry and blackberry cultivars. J. Food Sci.. 2010;75(4):C328-C335.
- [CrossRef] [Google Scholar]
- Clinical efficacy of African traditional medicines in hypertension: a randomized controlled trial with Combretum micranthum and Hibiscus sabdariffa. J. Hum. Hypertens. 2017;32(1):75-81.
- [CrossRef] [Google Scholar]
- Antioxidant activity and phenolic composition of herbhoneys. Food Chem.. 2009;113(2):568-574.
- [CrossRef] [Google Scholar]
- Correlation between total phenolic and mineral contents with antioxidant activity of eight Malaysian bananas (Musa sp.) J. Food Compos. Anal.. 2011;24(1):1-10.
- [CrossRef] [Google Scholar]
- Homogenate-assisted vacuum-powered bubble extraction of moso bamboo flavonoids for on-line scavenging free radical capacity analysis. Molecules. 2017;22(7):1156.
- [CrossRef] [Google Scholar]
- Performance comparison of maceration method, soxhletation method, and microwave-assisted extraction in extracting active compounds from soursop leaves (Annona muricata): a review. IOP Conf. Ser.: Mater. Sci. Eng.. 2021;1122:012095.
- [Google Scholar]
- Anti-diabetic effect of ethanol leaf extract of Combretum micranthum blood glucose and oxidative stress biomarkers on alloxan induced diabetic in wistar rats. Bayero J. Pure Appl. Sci.. 2017;10(1):108.
- [CrossRef] [Google Scholar]
- In vitro antioxidant and radical scavenging of Guinean kinkeliba leaf (Combretum micranthum G. Don) extracts. Nat. Prod. Res.. 2011;25(11):1025-1036.
- [CrossRef] [Google Scholar]
- Bioactive polyphenols in kinkéliba tea (Combretum micranthum) and their glucose-lowering activities. J. Food Drug Anal.. 2018;26(2):487-496.
- [CrossRef] [Google Scholar]
- Deep eutectic solvent-based ultrasonic-assisted extraction of phenolic compounds from Moringa oleifera L. leaves: optimization, comparison and antioxidant activity. Sep. Purif. Technol.. 2020;247:117014.
- [CrossRef] [Google Scholar]
- Steviol glycosides and polyphenols extraction from Stevia rebaudiana Bertoni leaves using maceration, microwave-, and ultrasound-assisted techniques. Sep. Sci. Technol.. 2020;56(5):936-948.
- [CrossRef] [Google Scholar]
- Recovery and stabilization of anthocyanins and phenolic antioxidants of roselle (Hibiscus sabdariffa L.) with hydrophilic deep eutectic solvents. Molecules.. 2020;25(16):3715.
- [Google Scholar]
- Optimization and stabilization of the antioxidant properties from Alkanet (Alkanna tinctoria) with natural deep eutectic solvents. Arab. J. Chem.. 2020;13:6437-13450.
- [CrossRef] [Google Scholar]
- Phytochemicals screening and anti-tyrosinase activity of Senegalese herbal extracts. Int. J. Innov. Res. Sci. Eng. Technol.. 2016;5(11):19781-19789.
- [Google Scholar]


