

Translate this page into:
Gut microbiota and urine metabolomics based exploration of Coreopsis tinctoria Nutt. tea on type 2 diabetic mellitus
⁎Corresponding author at: State Key Laboratory of Component-Based Chinese Medicine, Institute of Traditional Chinese Medicine, Tianjin University of Traditional Chinese Medicine, Tianjin 301617, China; Haihe Laboratory of Modern Chinese Medicine, Tianjin 301617, China xpchen@tjutcm.edu.cn (Xiaopeng Chen)
-
Received: ,
Accepted: ,
This article was originally published by Elsevier and was migrated to Scientific Scholar after the change of Publisher.
Peer review under responsibility of King Saud University. Production and hosting by Elsevier.
Abstract
Abstract
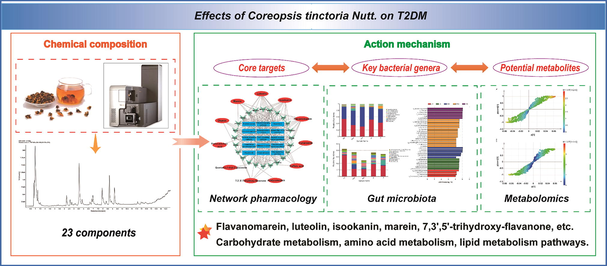
Scented tea, as an integral part of tea culture for several centuries, is important to prevent chronic metabolic diseases. Coreopsis tinctoria Nutt. (CT) tea is often used to prevent and treat diabetes, but the mechanism of action needs further study. Liquid chromatography-mass spectrometry was used to analyze 23 chemical components of CT extracts, and a “compounds-target-healthy function” network was constructed while the pathway enrichment analysis was carried out. Eleven CT compounds, including flavanomarein, luteolin, isookanin, marein, 7,3′,5′-trihydroxy-flavanone, okanin, caffeic acid, cynaroside, acetylcoreopsin, quercetin-7-O-β-D-glucoside, protocatechuic acid, were obtained through network pharmacology screening. The corresponding targets SRC, TP53, HSP90AA1, STAT3, MAPK1, PIK3R1, AKT1 and PIK3CA were associated with anti-glycemic effects. The rat model of type 2 diabetic mellitus (T2DM) was induced by a high-fat diet combined with low-dose streptozotocin injection and biochemical indexes (blood glucose, serum total cholesterol, and triglyceride) were determined. The low-dose water extract of CT can significantly regulate the total cholesterol level of diabetic rats (p < 0.01). 16S rDNA sequencing showed that CT could reverse the imbalance of intestinal flora, especially Lactobacillus, Prevotella, Succinivibrio, unidentified_Ruminococcaceae, and Treponema. Urine metabolomics observed 31 differential metabolites, mainly related to Glycerophospholipid metabolism. The correlation study showed that CT could treat T2DM by modulating the interaction of gut microbiota composition, changes in key bacterial genera, and the levels of endogenous metabolites to act on carbohydrate metabolism, amino acid metabolism, and lipid metabolism pathways. Therefore, CT water extract can effectively alleviate the changes of T2DM may be related to the combined changes of intestinal flora and metabolic characteristics.
Keywords
Scented tea
Type 2 diabetes mellitus
Coreopsis tinctoria Nutt.
Flavonoids
Intestinal flora
Metabolites

- CT
-
Coreopsis tinctoria Nutt.
- T2DM
-
type 2 diabetic mellitus
- TCM
-
traditional Chinese medicine
- PPI
-
protein–protein interaction
- HFD
-
high-fat diet
- STZ
-
streptozotocin
- TC
-
total cholesterol
- TG
-
triglyceride
- QC
-
quality control
- PCA
-
principal component analysis
- OPLS-DA
-
orthogonal partial least square analysis
- VIP
-
Variable importance in the projection
- TIC
-
total ion chromatogram
- FC
-
fold change
- PIK3CA
-
Phosphatidylinositol 3-kinase p85
- PIK3R1
-
Phosphatidylinositol 3-kinase p110
Abbreviations
1 Introduction
Non-communicable diseases such as diabetes have become prevalent with people's lifestyles changing, and the incidence is increasing and showing a trend of younger (Ogurtsova et al., 2017; Demmer et al., 2013). Type 2 diabetes mellitus (T2DM), caused by defective insulin secretion or its biological function impairment, is a typical metabolic disease characterized by hyperglycemia and involves a variety of metabolic disorders (American Diabetes Association, 2014). Diabetes not only threatens personal life, but also imposes a heavy burden on society, and has gradually become an increasingly prominent social health problem worldwide (Yaribeygi et al., 2019). At present, insulin sensitizers, insulin secretion drugs, and insulin are used in the clinical treatment of T2DM. The survey found that a plant-based diet may improve insulin sensitivity and reduce diabetes (Zhou et al., 2022; Chan et al., 2012; Zhao, 2016). Several components of the plant-based diet contribute to the beneficial health effect, and plant polyphenols contribute a lot (Ren et al., 2019; Long et al., 2014). Scented tea is particularly rich in polyphenols and has very little or none of the caffeine, theobromine, or theophylline contents. Moreover, scented tea, as popular beverage, is attracting increasing attention from both scientists and consumers due to its health and safety benefits.
Coreopsis tinctoria Nutt. (CT) is an annual plant of the genus Chrysanthemum of Compositae (Zhang et al., 2013). Because of its homologous characteristics of food and medicine, it has significant health care and economic value (Li et al., 2019). Indigenous peoples of India use CT to treat diarrhoea, internal pains, and bleeding, and as an emetic, while in Portugal the dried capitulum of CT is used as a tea to prevent diabetes. The widely used CT in China has the functions of clearing away heat and detoxification, promoting blood circulation and removing blood stasis, etc. So it is often used by folks to drink as flower tea to prevent and treat diabetes (Shen et al., 2021). Some pharmacological studies have reported that CT is rich in flavonoids, which can regulate glucose metabolism, promote blood circulation, and reduce the risk of cardiovascular disease (Dias et al., 2010a; Dias et al., 2010b). It has a certain effect on hypertension and hyperlipidemia, significantly inhibits the activity of α-glucosidase, reduces blood glucose and restores impaired glucose tolerance, which has a certain potential and application prospect (Lee et al., 2012). However, the CT mechanism of the influence on diabetes is still unclear. Due to the complex composition of botanicals and the complex mechanism of diabetes, it demands new analytical technology and strategy to further study the relevant molecular mechanism (Hao et al., 2023; Krishna et al., 2022a; Krishna et al., 2022b; Ahammad et al., 2021; Krishna et al., 2021; Krishna et al., 2020).
As a new systematic method to study the interaction and influence, network pharmacology has shifted pharmacological research from a traditional search from a single target to a comprehensive network analysis. It has great potential to understand the occurrence and development of diseases, TCM syndromes, and the mechanism of TCM in treating diseases (Hopkins, 2018; Li et al., 2021). So network pharmacology could find the targets of CT for T2DM treatment and analyzes pathways regulating the disorders. Intestinal microorganisms have been recognized as the most important micro-ecosystem that regulates symbiosis with other organs (Li et al., 2021). The intestinal microorganisms are closely related to the occurrence and development of chronic metabolic diseases. Therefore, the beneficial effect of CT on T2DM may be partly attributed to the regulation of gut microflora. To further explore the changes of small molecule metabolites involved in metabolic pathways as a whole, metabolomics could find the relationship between metabolites and physiological or pathological changes, and can quickly and accurately analyze metabolites and identify biomarkers (Karlsson et al., 2013; Ma et al., 2019). Intestinal microbiota sequencing obtain differential microbial genera and metabolomics screen differential metabolites of CT for T2DM treatment. Therefore, the combined strategy of the above technologies can be used for the mechanism study of CT.
In this study, the work first qualitatively and quantitatively analyzed the chemical components of the water extract of CT and predicted the therapeutic mechanism of CT on diabetes based on the network pharmacology. And then the effect of CT water extract on T2DM rats was observed and “Compounds-Target-Function” network was constructed. The metabolic spectrum of urine was detected by ultra-high performance liquid chromatography-quadrupole-time of flight-mass spectrometry (UHPLC-Q-TOF-MS/MS), and the composition of intestinal microflora was analyzed by 16S rDNA sequencing. Through the comprehensive analysis of network pharmacology, biochemical indexes, characteristics of intestinal microflora and urine metabolites, the anti-diabetic mechanism of CT water extract was explored. It is to provide the experimental basis for further exploring the mechanism of CT influence on T2DM and “Compounds-Target-Function” network strategy for scented tea study.
2 Materials and methods
2.1 Materials
CT was provided by Xinjiang Life Nuclear Power High-Tech Co., Ltd., and was identified as the dried flower head of Coreopsis tinctoria Nutt. by Xiaopeng Chen associate professor of Tianjin University of Traditional Chinese Medicine. The samples are kept in the sample room of the Institute of Traditional Chinese Medicine, Tianjin University of Traditional Chinese Medicine. Chlorogenic acid, protocatechuic acid, flavanomarein, isookanin, marein, okanin, and quercetin-7-O-β-D-glucoside standards (batch numbers DST190906-021, DST180428-081, DST191102-240, DST200509-453, DST200311-132, DST191210-105, DST200315-029) were purchased from Chengdu Desite Bio-Technology Co., Ltd. (Chengdu, China). The standards of neochlorogenic acid (wkq19021413) and coreopsin (wkq20061703) were obtained from Sichuan Victory Biological Technology Co., Ltd. (Sichuan, China), and caffeic acid standard (MUST-18032003) was purchased from Chengdu Must Bio-Technology Co., Ltd.(Chengdu, China). The mass fractions of all standard reagents were ≥ 98%.
2.2 CT water extract preparation and analysis
Following the pre-treatment method of teabag test in the National Food Safety Standard (GB15193.21–2014). Weigh 2 g CT samples into a 100 mL beaker, add 50 mL boiling water, and cover with tin foil, brew for 30 min, filter out the tea soup. Add 50 mL of boiling water to brew for 30 min once more, filter out the tea soup, mix the tea soup, shake well, and concentrate. When the temperature of the tea soup drops, fix the volume to 40 mL and filter. The sample is stored in the refrigerator below 4 ℃ for later use.
The qualitative and quantitative analysis of the components of the CT water extract was carried out on UPLC-IMS-QTOF-MS (Waters, USA) and HPLC-PDA (Waters, USA), respectively. The instrument characteristics and chromatographic conditions are provided in the supplementary material.
2.3 Network pharmacology analysis
Based on the ingredients from section 2.2, the active ingredient targets and predicted targets of CT were obtained from TCMSP, Swiss Target Prediction, and PharmMapper Server databases. The related targets of T2DM were searched with “type 2 diabetes mellitus” in the Gene Cards database, and combined with the literature reports, the duplicated data were deleted and the diabetes target genes were screened. The intersection of the above two-part targets is the key target genes of CT in the treatment of T2DM. Input genes into the STRING database, and get the PPI network of CT acting on T2DM. Import the network into Cytoscape software, and screen the potential genes of the compound by node value, intermediate center degree, and near center degree. Input the data into DAVID 6.8 database to carry out GO biological process enrichment analysis and KEGG pathway enrichment analysis.
2.4 Animal study
SD rats, 180–200 g, male, purchased from Beijing Huafukang Biotechnology Co., Ltd., license number: SCXK (Beijing) 2019–0008. Basic feed and high-fat feed were purchased from Beijing Huafukang Biotechnology Co., Ltd. The rat model of T2DM was established by high-fat diet (HFD) combined with a low-dose injection of streptozotocin (STZ). After 3 days of adaptive feeding, SD male rats were fed with HFD for 8 weeks, resulting in insulin resistance. After passing the glucose tolerance test, STZ 35 mg/kg (prepared by the citric acid buffer of pH 4.5) was injected into the tail vein and fed for 2 weeks to establish the T2DM model. The blood glucose higher than 16.7 mmol/L is taken as the success model. A normal control group using conventional feed and the same feeding conditions was set at the same time. The model rats were randomly divided into four groups: model group (n = 8), positive control group (250 mg/kg of metformin, n = 8), low dose group (1000 mg/kg of CT, n = 8), high dose group (2000 mg/kg of CT, n = 8), and normal control group (n = 8). The rats were given intragastric administration and the normal control and model group were given the same volume of normal saline for 8 weeks. During the dosing, the rats were fed with conventional feed in the controlled environmental conditions of 12 h day and night replacement, ambient temperature 22 ± 2 ℃, and ambient humidity 35 ± 5%. All experimental protocols strictly followed the U.K. Animals (Scientific Procedures) Act, 1986 and associated guidelines, EU Directive 2010/63/EU for animal experiments, the Guidance Suggestions for the Care and Use of Laboratory Animals issued by the Ministry of Science and Technology of China (2006), and the Animal Use and Care Committee of Tianjin University of Traditional Chinese Medicine (No. IRMDWLL-201903).
2.5 Sample collection and biochemical index determination
After dosing for 8 weeks, the rats fasted in metabolic cages, collected 24-hour urine and packed in centrifuge tubes for metabonomic analysis. Then rubbed the abdomen of rats, collected the feces of rats in each group, packed them in aseptic frozen tubes, and stored them in the refrigerator at −80 ℃ after quick freezing with liquid nitrogen. The body weight of rats was measured and recorded regularly every week before and during dosing, and the changes were calculated. Before and during dosing, the rats fasted for 12 h and the blood of the orbital venous plexus was taken every week. Blood glucose, the levels of serum total cholesterol (TC) and triglyceride (TG) were detected by Mindray BS-240VET animal automatic biochemical instrument.
2.6 Intestinal microflora
The genomic DNA of feces was extracted by the CTAB method, and then the purity and concentration of DNA were detected by agarose gel electrophoresis. An appropriate amount of sample DNA was taken out to the centrifuge tube, and the sample was diluted to 1 ng/μL with sterile water. Then the diluted genomic DNA was used as the template, and the 16SrDNA variable region primers were applied to PCR using the specific primers 515F (5′-ACTCTACGGAGCAGCAGCAGCA-3′) with Barcode and 806R (5′-GGACTACGGGTWTCTAAT-3′). The amplification procedure is as follows: initial denaturation of 1 min at 98 ℃, then denaturation at 98 ℃, annealing at 50 ℃, annealing at 50 ℃, extension of 30 s at 72 ℃ for 30 cycles, and final extension of 5 min at 72 ℃. The qualified PCR products were purified by magnetic beads, quantified by enzyme labeling, and the same amount of samples was mixed according to the concentration of PCR products. After full mixing, 2% agarose gel electrophoresis was used to detect PCR products, and the gel recovery kit provided by the Qiangen company was used to recover the products. The library was constructed with TruSeq ®DNAPCR-Free Sample Preparation Kit library construction kit, and the library was quantified by Qubit and QPCR. After the library was qualified, NovaSeq6000 was used for computer sequencing. Construction of the 16S rDNA gene amplicon sequence library, statistical analysis, and data manipulation are described in Supporting Information.
2.7 Urine metabolomics
The urine samples stored in the −80 °C refrigerator were thawed on the ice. 100 μL of urine was taken into the 1.5 mL EP tube, 20 μL of the internal standard solution was added, and the vortex oscillated for 1 min. Then add 400 μL acetonitrile solution to precipitate the protein, continue to scroll for 1 min, then centrifuge for 15 min at 4 °C, 19,721 g. Suck the supernatant nitrogen to dry, add 100 μL acetonitrile solution to re-dissolve, and centrifuge for 15 min at 4 °C, 19,721 g. Take the supernatant in the automatic injection bottle, to be analyzed. The QC samples were mixed with 10 μL of all the samples. At the beginning of the sequence, the QC samples were run 5–10 times to balance the whole detection system and analyzed periodically in the whole analysis process. The QC samples were used to monitor and examine the stability of the instrument and the repeatability of the method. See Supplementary Materials for metabolomics data acquisition and analysis conditions.
2.8 Data analysis and statistics
SPSS 24.0 software and Origin 2021 were used for data analysis. The data were expressed by mean ± standard deviation, and the significant levels were *p < 0.05 and ***p < 0.01, respectively. Using the file format converter of Labsolutions software (Shimadzu, Japan), the original offline data of MS was converted into mzML format data file. The obtained data file was imported into MsDial software (RIKEN, Japan), which is used to set noise, perform baseline correction, peak extraction, and peak alignment to obtain a preliminary metabonomic data matrix, and use MetaboAnalyst database (https://www.metaboanalyst.ca/) to process the data. The not available value is filled with 1/2 of the minimum value, and the peaks with missing rate > 50% are filtered. The area normalization, logarithmic transformation, and pareto scaling mode are used to transform the data from biased distribution to normal distribution. By establishing the models of unsupervised principal component analysis (PCA) and supervised orthogonal partial least square analysis (OPLS-DA), and drawing the S-plot diagram, the metabolites with variable importance in the projection (VIP) > 1 were screened and analyzed by t-test. And the difference compounds with VIP ≥ 1 and p ≤ 0.01 were selected as potential biomarkers, combined with the public database HMDB (http://www.hmdb.ca/), MassBank databases (https://www.massbank.jp/), and METLIN databases. The selected biomarkers were enriched and analyzed by the MetaboAnalyst database. Under the condition of p < 0.05, the metabolic pathways with significant enrichment were screened, which were considered to be the potential key pathways for the treatment of T2DM. And the related target proteins of the key pathways were searched by the KEGG database (https://www.genome.jp/kegg/).
3 Results
3.1 Qualitative and quantitative of CT water extract
To characterize the constituents in CT water extract, UPLC-IMS-QTOF-MS was used to detect the samples in negative ion mode. The total ion chromatogram (TIC) was shown in Fig. 1. The obtained chromatographic mass spectrometry information includes the retention time of each peak, the quasi-molecular ion peak and its fragment ion information obtained after adducting ions, and the fragmentation rule of mass spectrometry. A total of 23 compounds were obtained, including 18 flavonoids. See Table 1 for details. Among them, the content of 5 components was measured (Figure A1), namely flavanomarein, isookanin, marein, coreopsin, okanin, which were 8.350 mg/g, 1.693 mg/g, 16.785 mg/g, 1.083 mg/g, 5.813 mg/g, respectively. The investigation of the linear relationship, LOQ, and LOD is shown in Table A1 of the Supplementary Material, and the methodological investigations are detailed in Table A2 of the Supplementary Material.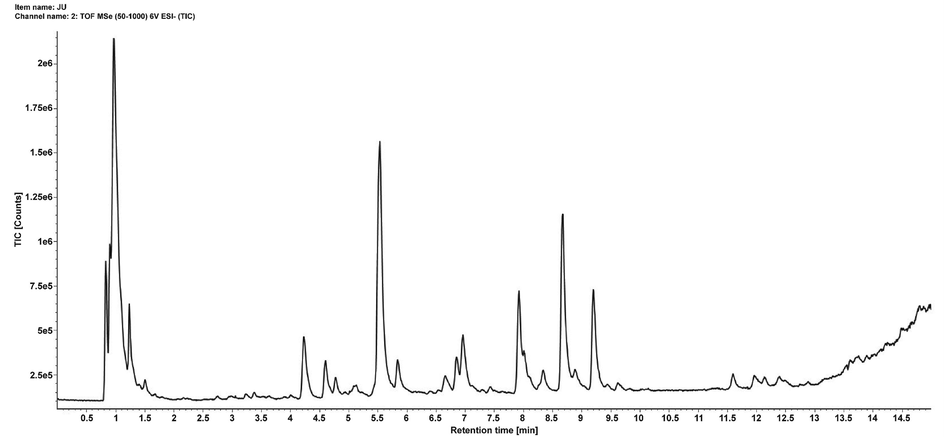
TIC of Coreopsis tinctoria Nutt. water extract in negative ion mode.
NO.
RT(min)
Formula
Measured
Predicted
Error(ppm)
Adduct
MS2
Compound
1
0.97
C6H12O7
195.0509
195.0510
−0.51
[M−H]-
191.0559
D-Gluconic acid
2
0.99
C9H8O4
179.0560
179.0561
−0.56
[M−H]-
161.0455
Caffeic acid
3
2.94
C7H6O4
153.0196
153.0193
1.96
[M−H]-
109.0297
Protocatechuic acid
4
3.23
C16H18O9*
353.0882
353.0878
1.13
[M−H]-
191.0562, 135.0451
Neochlorogenic acid
5
3.39
C21H22O12
465.1050
465.1039
2.37
[M−H]-
303.0517, 285.0410, 151.0039
Taxifolin-7-O-β-D-glucoside
6
3.64
C21H22O11
449.1101
449.1089
2.67
[M−H]-
287.0566
R/S-Flavanomarein
7
4.60
C16H18O9*
353.0884
353.0878
1.70
[M−H]-
191.0563, 179.0343, 135.0452
Chlorogenic acid
8
4.68
C15H10O6
285.0409
285.0405
1.40
[M−H]-
151.0033, 135.0450
Luteolin
9
5.53
C21H22O11*
449.1097
449.1089
1.78
[M−H]-
287.0566, 269.0459, 151.0039, 135.0453
R/S-Flavanomarein
10
5.83
C21H22O10
433.1150
433.1140
2.31
[M−H]-
271.0617, 151.0038, 135.0454
Flavanocoreopsin
11
6.33
C21H20O11
447.0939
447.0933
1.34
[M−H]-
285.0407
3′,4′,6,7-Tetrahydroxy-6-O-
glucosylaurone
12
6.39
C21H22O10
433.1147
433.1140
1.62
[M−H]-
271.0616
7,3′,5′-Trihydroxy-flavanone-7-O-β-D-glucopyranoside
13
6.54
C27H32O16
611.1631
611.1618
2.13
[M−H]-
449.1098, 287.0565, 269.0461, 151.0038
Luteolin-7-O-β-D-sophoroside
14
6.65
C15H12O6*
287.0569
287.0561
2.79
[M−H]-
151.0039, 135.0454
Isookanin
15
6.71
C23H24O12
491.1206
491.1195
2.24
[M−H]-
287.0566, 269.0456, 151.0038, 135.0086
Acetylmarein
16
6.96
C21H22O11
449.1098
449.1089
2.00
[M−H]-
287.0566, 151.0039, 135.0453
5,7,3′,5′-Tetra-hydroxy-flavanone-7-O-β-D-glucopyranoside
17
7.19
C23H24O11
475.1253
475.1246
1.47
[M−H]-
271.0615, 151.0389, 135.0085
Acetylcoreopsin
18
7.25
C21H20O12*
463.0887
463.0882
1.08
[M−H]-
269.0455
Quercetin-7-O-β-D-glucoside
19
7.31
C21H20O11
447.0941
447.0933
1.79
[M−H]-
285.0407
Cynaroside
20
7.43
C21H22O11*
449.1098
449.1089
2.00
[M−H]-
287.0565, 269.0457, 151.0038, 135.0453
Marein
21
8.05
C15H12O5
271.0615
271.0612
1.11
[M−H]-
151.0038
7,3′,5′-Trihydroxy-flavanone
22
8.39
C21H22O10*
433.1146
433.1140
1.39
[M−H]-
271.0615, 135.0451
Coreopsin
23
8.43
C15H12O6
287.0560
287.0561
−0.35
[M−H]-
269.0451, 135.0451
Okanin
3.2 Network pharmacology
3.2.1 Prediction of compound and disease targets
A total of 477 targets of CT were screened through the TCMSP, Swiss Target Prediction, and PharmMapper databases. A total of 12,582 type 2 diabetes target genes were retrieved from the Gene Cards database. The component targets and disease targets were taken at the intersection to obtain 408 target genes of the active compounds of CT against T2DM.
3.2.2 Protein target database construction
The 408 target genes were input into the STRING database for PPI network construction and analysis. Then the PPI network of CT for the treatment of diabetes target proteins was obtained. The topology of the PPI network was studied by the “Network Analyzer” on Cytoscape, and the sub-network was constructed according to the obtained parameters including Degree, Betweenness Centrality, and Closeness Centrality. The medians of Degree, Betweenness Centrality, and Closeness Centrality were 5, 0.001535, and 0.31043, respectively. Select the target whose node degree value is greater than or equal to 5 times of the median value of all points, and meet the requirements of the betweenness centrality and closeness centrality that are greater than the median value of all points as the potential target for the treatment of T2DM with CT. A total of 25 key targets were obtained. The higher the node degree value, the larger the graph, and the corresponding color varies from green to orange. As in Fig. 2A, 25 key targets are SRC, TP53, HSP90AA1, STAT3, MAPK1, PIK3R1, AKT1, PIK3CA, HRAS, JUN, RELA, ESR1, EGFR, PTPN11, JAK2, CDK1, RHOA, MAPK8, RXRA, STAT1, LCK, CDKN1A, HDAC1, MAPK14, IGF1.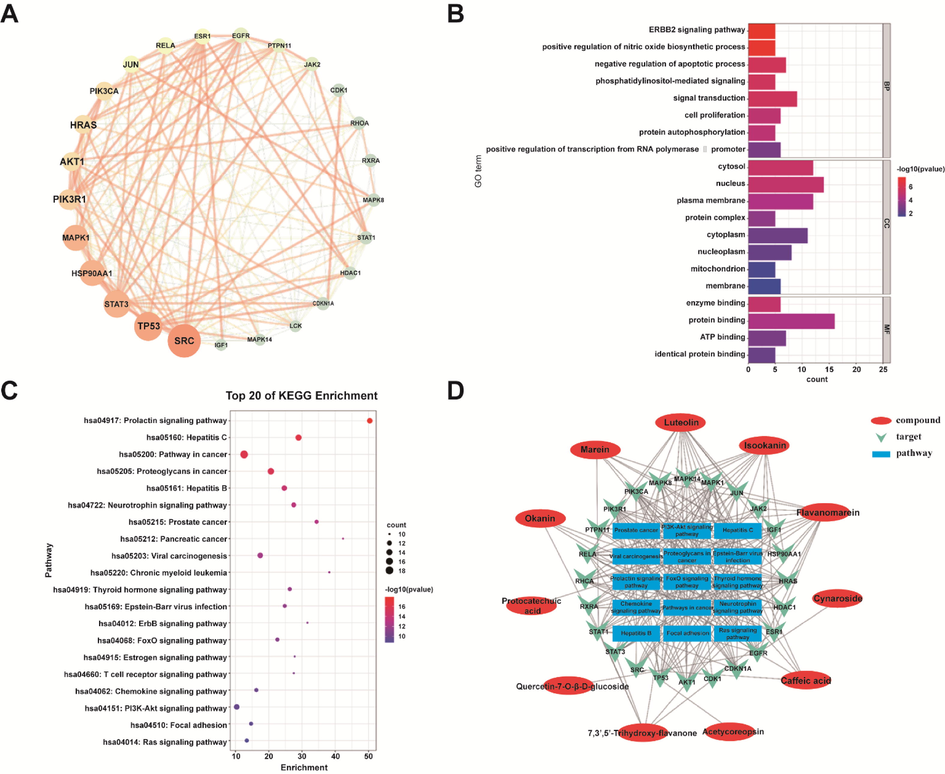
Network pharmacological prediction of CT in the treatment of T2DM. (A) Core targets and interaction relationship of CT in the treatment of T2DM. (B) Top 20 GO enrichment analysis. (C) Bubble diagram of KEGG signaling pathway. (D) “Active Ingredient-Core Target-Key Pathway” Network.
3.2.3 Pathway enrichment analysis
Based on the 25 intersection targets obtained above, the target genes were mapped into the DAVID database, and GO biological process enrichment analysis and KEGG pathway annotation analysis were performed. A total of 139 GO biological processes (p < 0.05) and 92 pathways (p < 0.05) were obtained by enrichment. These key targets are closely related to biological processes such as apoptosis, phosphatidylinositol-mediated signals, protein phosphorylation, regulation of biological functions such as enzyme series reactions, signal transduction, and regulation of insulin receptors. The pathways involved in T2DM such as diabetes and inflammatory complications include PI3K-Akt signaling pathway, Neurotrophin signaling pathway, and Estrogen signaling pathway. Filter and sort the count and p value of the GO results, and take the top 20 for visual analysis, as shown in Fig. 2B. The top 20 signaling pathways were selected, and the KEGG enrichment analysis results were visualized using Bioinformatics Website, as shown in Fig. 2C.
3.2.4 Network pharmacology analysis
Fifteen pathways were further screened and identified by enrichment of the 25 intersection targets, which involved 11 core components, including flavanomarein, luteolin, isookanin, marein, 7,3′,5′-trihydroxy-flavanone, okanin, caffeic acid, cynaroside, acetylcoreopsin, quercetin-7-O-β-D-glucoside, protocatechuic acid. The network diagram of the relationship between targets, pathways, and related active components was obtained by visual processing with Cytoscape 3.7.1. The results are shown in Fig. 2D. From the network map, it can be found that among the high ranking pathways obtained by KEGG enrichment and associated with diabetes, inflammatory complications, and other diseases, 13 target proteins are involved in PI3K-Akt signaling pathway, including CDKN1A, HSP90AA1, PIK3R1, IGF1, EGFR, RELA, RXRA, PIK3CA, AKT1, MAPK1, JAK2, HRAS, TP53. There are 12 target proteins related to Neurotrophin signaling pathway, including JUN, MAPK8, PIK3CA, MAPK1, AKT1, PTPN11, PIK3R1, MAPK14, and HRAS. There are 10 target proteins involved in TP53, RELA, RHOA; Estrogen signaling pathway, including HSP90AA1, JUN, PIK3CA, SRC, MAPK1, AKT1, PIK3R1, HRAS, ESR1, EGFR. It can be seen that the action targets of the main active components of the CT are distributed in different metabolic pathways and coordinate with each other to realize the mechanism of action of multiple ways to treat T2DM.
3.3 Determination of biochemical indicators
The content of blood lipids such as TC and TG in the serum of rats after dosing was detected. Compared with the NC group as shown in Fig. 3, the serum TC and TG levels of the Mod group significantly increased (p < 0.05), and the body weight significantly reduce. The TG and TC values of the T2DM model rats were higher than those of the healthy rats with normal blood sugar, which indicated that the abnormal blood sugar level of the glucose and lipid metabolism mice was often accompanied by the symptoms of dyslipidemia. Compared with the Mod group, the serum total cholesterol of the rats in the CT low-dose group was significantly decreased (p < 0.05). It shows that the administration group can effectively reduce the level of TC in serum, thereby correcting the disorder of blood lipid metabolism and preventing T2DM.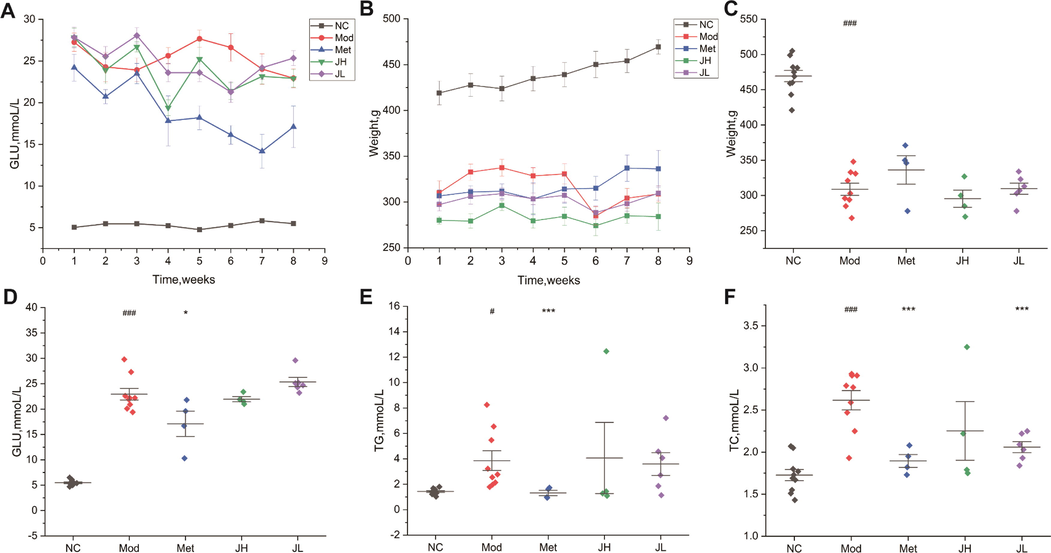
Physiological index changes of each group in the eighth week after administration. (A) Changes of blood glucose in each group for 8 weeks of intervention. (B) Eight-week body weight change trend of intervention in each group. (C) The body weight at the 8th week. (D) Blood glucose values at the 8th week. (E) The triglyceride level at the 8th week. (F) The total cholesterol level at the 8th week. Values are presented as mean ± SD. (NC) normal group; (Mod) model group; (Met) positive group; (JH) high dose group; (JL) low dose group.
3.4 Gut microbiome analysis
3.4.1 Species distribution annotation
The OTUs were classified and analyzed at the phylum, class, order, family, genus, and species classification level. All detected samples mainly include 44 phylum, 96 class, 191 order, 247 family, 319 genus, and 111 species. According to the species annotation results, select the top 10 species with the largest abundance at the taxonomic level of phylum and genus, and generate a column accumulation chart of the relative abundance of species to visually check the relative abundance of each sample at the taxonomic level of phylum, genus, and their proportions. The main phyla detected at the phylum classification level are Firmicutes, Bacteroidota, Proteobacteria, Actinobacteriota, Spirochaetota, unidentified_Bacteria, Acidobacteriota, Campilobacterota, Verrucomicrobiota, Desulfobacterota (Fig. 4A). The main ones detected at the genus taxonomic level were Lactobacillus, Prevotella, Succinivibrio, Bifidobacterium, and Treponema(Fig. 4B).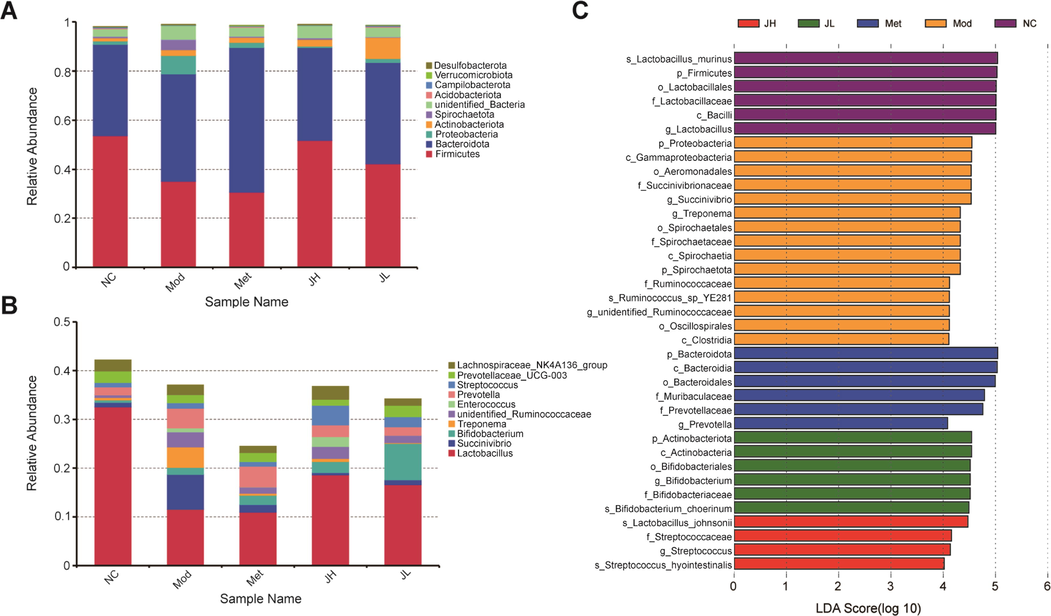
Gut microbiota species annotation analysis. (A) Histogram of relative abundance of species at the phylum level. (B) Histogram of relative abundance of species at the genus level. (C) Histogram of LDA value distribution in LEfSe analysis.
3.4.2 Differential genus analysis
LEfSe analysis of all samples found a total of 37 species with significantly different species information (p < 0.05) at the level of phylum, class, order, family, genus, and species (Fig. 4C). The bacterial flora of the tract was also significantly affected. Lactobacillus showed a downward trend in the model group, and Prevotella, Succinivibrio, unidentified Ruminococcaceae, and Treponema showed an upward trend in the diabetes model group. CT can regulate the relative abundance of the above intestinal flora in the model group to varying degrees as shown in Fig. 5.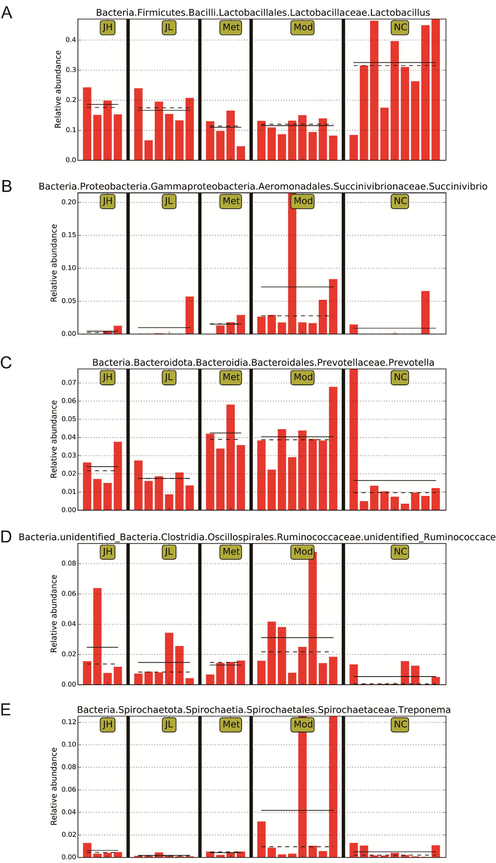
Effects of CT on intestinal microbial composition in T2DM. (A) Lactobacillus. (B) Succinivibrio. (C) Prevotella. (D) unidentified Ruminococcaceae. (E) Treponema. (NC) normal group; (Mod) model group; (Met) positive group; (JH) high dose group; (JL) low dose group.
3.4.3 Pathway prediction analysis
Based on the function prediction analysis of Tax4Fun the pathway involved in KEGG is shown in Fig. 6. The pathway is mostly enriched in metabolic pathways, which mainly include Carbohydrate metabolism, Amino acid, Nucleotide metabolism, Energy metabolism, and Glycan biosynthesis and metabolism.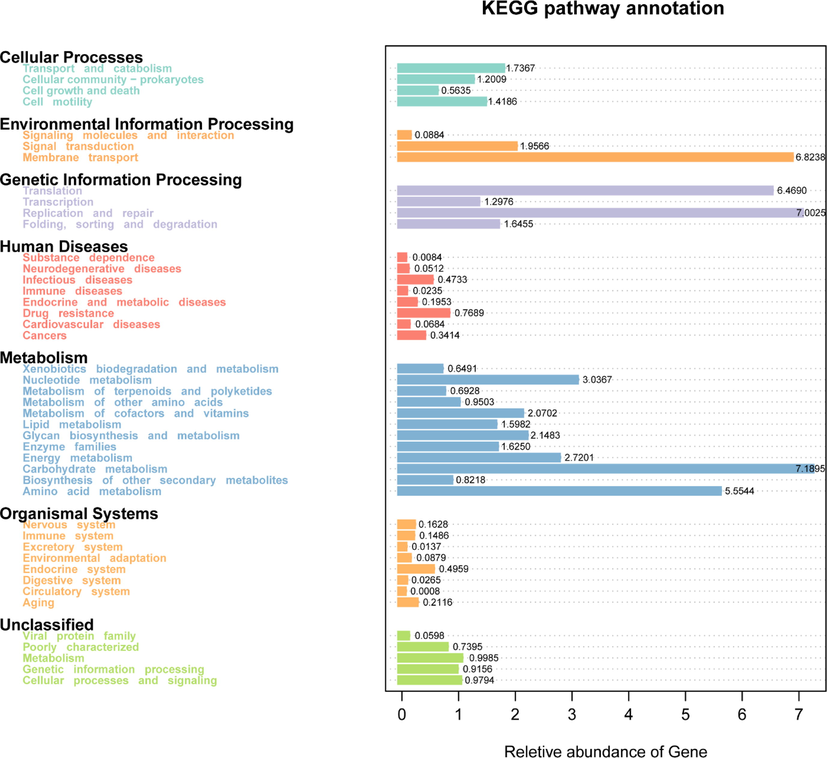
Functional predictive analysis.
3.5 Metabolomics analysis
3.5.1 Multivariate statistical analysis
Unsupervised principal component analysis (PCA) was performed on each group, and the results found that the normal group and the model group were significantly separated, indicating that the urinary endogenous metabolites in T2DM dose undergo significant change. Meanwhile, the dosing group was far away from the model group, and there was no obvious difference between clusters, indicating that CT or metformin also changed the endogenous metabolites of diabetic rats to a certain extent (Fig. 7A).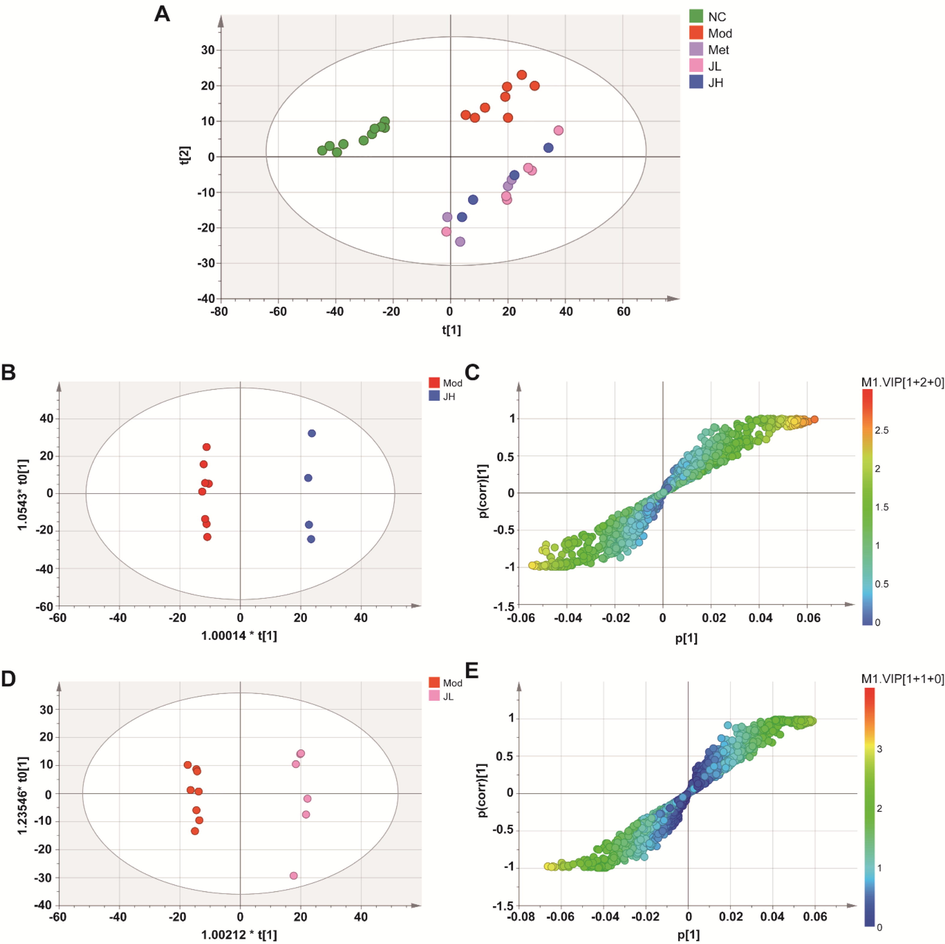
Multivariate analyses of urine UHPLC-QTOF-MS/MS spectra data. (A) Principal Component Analysis (PCA) scores plot. (B, C) OPLS-DA score plot and S-plot for high-dose and model group. (D, E) OPLS-DA score plot and S-plot for low-dose and model group. (NC) normal group; (Mod) model group; (Met) positive group; (JH) high dose group; (JL) low dose group.
To further screen out the differential metabolites with significant changes, a supervised orthogonal partial least squares discriminant analysis (OPLS-DA) model was constructed. The model group (Mod) and the CT high-dose group (JH) were clearly distinguished, with R2X, R2Y, and Q2 being 0.664, 0.999, and 0.943, respectively (Fig. 7B). The model group (Mod) and the CT low-dose group (JL) were distinguished, with R2X, R2Y, and Q2 being 0.371, 0.993 and 0.937, respectively(Fig. 7D). The more the parameters are inclined to 1, the more the model is reliable. Q2 > 0.5 indicated the good predictive ability of the OPLS-DA model. Moreover, the results of the random permutation test indicate that the model has a good explanatory and predictive ability.
3.5.2 Potential marker analysis
An S-plot graph was constructed to screen the differential metabolites between the model group and the two administration groups, as shown in Fig. 7C and E. The higher the VIP value, the greater the contribution to distinguishing the two groups. The screening conditions for the metabolites marker were as follows: VIP ≥ 1, fold change (FC) ≥ 2 or ≤ 0.5, and the difference was statistically significant between the two groups (t-test p-Value < 0.05). According to the molecular weights and secondary fragments corresponding to the variables, the potential markers were identified by searching the public databases HMDB, METLIN, and MetDNA, and comparing them with relevant literature. The 31 marker metabolites related to the treatment of diabetes progression are shown in Table 2, mainly including amino acids. To facilitate the observation of the changes in the relative contents of metabolites, the study standardized the original relative contents of the metabolites identified by the screening criteria (Unit Variance Scaling) by row and drew a heat map through the online platform. The results are shown in Fig. 8. It can be found that the contents of 8 metabolites decreased in the diabetic rat model group, while the contents of 23 metabolites increased. All 31 metabolites showed callback effects after administration of CT.
NO.
RT(min)
Mass(g/mol)
Formula
Compounds
VIP
p_value
Log2FC
Type
1
1.79
162.0528
C6H10O5
1,6-Anhydro-β-D-glucose
1.478542
0.040053862
−1.1986
down
2
1.97
268.0736
C16H12O4
formononetin
2.065681
0.009658918
−3.7877
down
3
6.34
569.3173
C25H43N7O8
Asn-Leu-Pro-Ile-Asn
1.817375
9.60589E-05
1.038247
up
4
6.35
546.3166
C27H42N6O6
Westiellamide
2.491242
1.30855E-06
−4.65889
down
5
6.50
612.3384
C30H44N8O6
Phe-Tyr-Lys-Arg
2.338088
0.003422727
1.580587
up
6
6.50
590.3540
C28H46N8O6
Gly-Leu-Arg-Val-Phe
2.453694
6.88578E-06
−3.99582
down
7
7.08
626.3388
C27H46N8O9
Glu-Lys-Leu-Thr-His
2.275839
0.018560722
1.711438
up
8
12.16
598.3915
C26H50N10O6
Ala-Pro-Arg-Lys-Lys
1.943954
0.00254572
−2.33234
down
9
13.82
337.3345
C22H43NO
13Z-Docosenamide
1.86724
0.002593778
−4.04777
down
10
14.31
594.3853
C28H50N8O6
His-Lys-Leu-Val-Val
2.266149
2.50169E-05
2.741213
up
11
14.47
731.5465
C40H78NO8P
1-Oleoyl-2-myristoyl-sn-glycero-3-phosphocholine(PC(18:1(9Z)/14:0))
2.434706
3.3567E-07
−1.73161
down
12
14.62
576.3635
C29H48N6O6
Ile-Gly-Lys-Ile-Phe
2.088116
0.013848311
1.078988
up
13
15.07
722.4758
C44H66O8
1,26-Dicaffeoylhexacosanediol
2.042758
0.017579569
1.264828
up
14
15.08
700.4914
C42H68O8
MycolactoneF
1.640435
0.009788668
1.1777
up
15
15.75
637.3071
C28H43N7O10
Lys-Tyr-Gln-Glu-Ala
2.068704
0.000803063
−1.23474
down
16
15.75
636.3119
C29H44N6O10
Asp-Tyr-Asn-Leu-Leu
1.862101
0.002836002
−1.15739
down
17
16.55
757.5622
C42H80NO8P
1,2-Dioleoyl-sn-glycero-3-phosphoethanolamine-N-methyl
1.972926
0.049881676
−2.5886
down
18
16.66
550.4961
C35H66O4
ArtemoinA
1.239144
0.01353093
−2.87506
down
19
16.67
761.5935
C42H84NO8P
1-Palmitoyl-2-stearoyl-sn-glycero-3-phosphocholine(PC(16:0/18:0))
2.125899
0.001607988
−1.81388
down
20
16.72
713.5442
C40H75NO9
Glucocerebrosides
2.216238
0.000215953
−1.26903
down
21
16.82
590.4335
C39H58O4
CoenzymeQ6
2.269752
8.99233E-05
−1.03892
down
22
16.84
568.5067
C35H68O5
1,2-Dihexadecanoyl-sn-glycerol
1.986973
0.004734363
−4.7641
down
23
16.89
618.5223
C39H70O5
DG(16:0/0:0/20:3n9)
1.480091
0.022021349
2.83719
up
24
17.15
672.4449
C36H64O11
VinaginsenosideR12
1.149489
0.041819694
−1.24196
down
25
17.16
309.3032
C20H39NO
OleoylEthylAmide
1.669653
0.029553385
−1.60311
down
26
17.16
182.1307
C11H18O2
Decahydronaphthalene-2-carboxylic acid
1.752376
0.04116878
−1.39749
down
27
17.22
568.5067
C35H68O5
DG(16:0/16:0/0:0)
1.706035
0.008536144
−2.49324
down
28
17.36
296.3079
C20H40O
Phytol
1.662572
0.03975343
−1.50364
down
29
17.77
112.0888
C7H12O
xi-3-Methyl-3-cyclohexen-1-ol
2.013088
0.022770733
−1.3543
down
30
17.84
157.9625
C2H7O2PS2
Dimethyldithiophosphate
1.819238
0.039248913
−1.90517
down
31
18.24
297.3032
C19H39NO
Tridemorph
1.665878
0.023567774
−1.03526
down
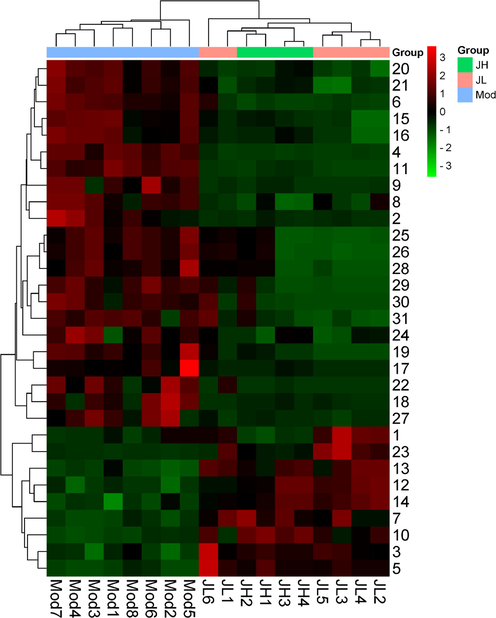
Heatmap of 31 potential biomarkers.
3.5.3 Metabolic marker-related pathway analysis
The marker metabolites were entered into the MetaboAnalyst database, and the most relevant metabolic pathways were found through the results of metabolic pathway enrichment analysis and topology analysis. Four metabolic pathways were obtained through enrichment, among which the important metabolic pathway was identified as Glycerophospholipid metabolism (Fig. 9).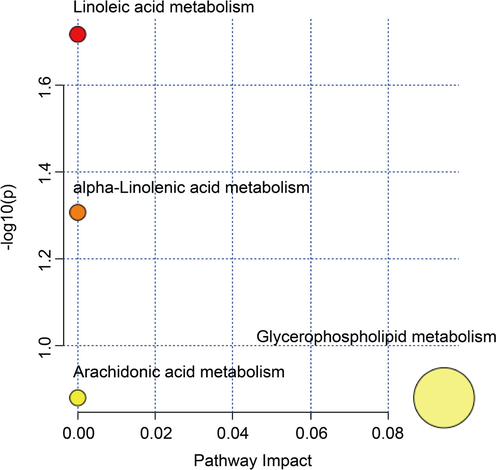
Enrichment of pathway analysis with MetaboAnalyst.
3.6 Correlation analysis
The potential targets obtained from the network pharmacology were combined with the targets involved in the significant pathways obtained by metabolomics enrichment, and two targets, PIK3R1 and PIK3CA, were obtained. To determine the potential link between the gut microbiota and the endogenous metabolites, correlation analysis was performed between the differential microbes obtained by the gut microbiota and the differential metabolites obtained by metabolomics. The Pearson correlation coefficient of the compounds was used to display the correlation between the microorganisms and the metabolites at the genus level through a cluster heat map. Heatmaps were drawn using the Complex Heatmap package of the R software (Fig. 10).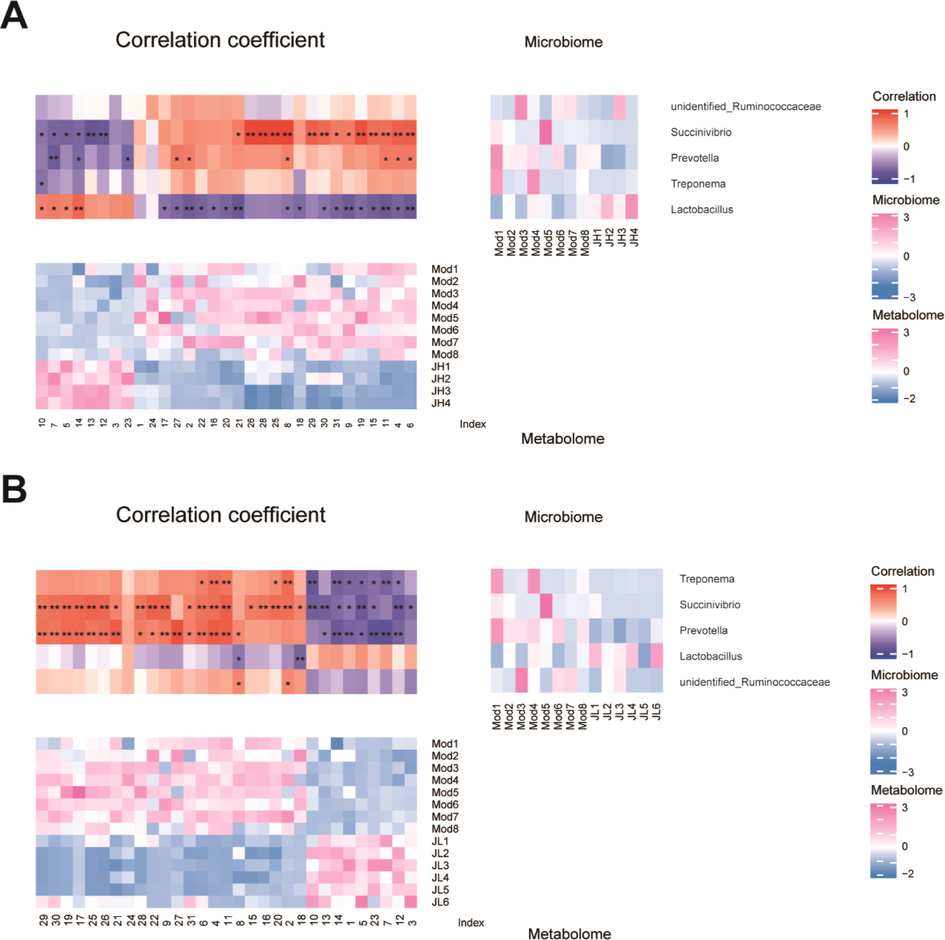
Heatmap of Pearson correlation analysis between bacteria and metabolites. (A) Heatmap of model and high-dose group. (B) Heatmap of model and low-dose group.
The CT water extract can regulate the intestinal flora and metabolites to varying degrees, and the intestinal microbes and small molecule metabolites are closely related. Most of the metabolites are significantly correlated (p < 0.05) to Treponema, Prevotella, and Succinivibrio. Metabolites including 3, 5, 7, 10, 12–14, and 23 were negatively correlated with harmful bacteria Treponema, Prevotella, Succinivibrio, and Ruminobacteria, but positively correlated with the beneficial bacteria Lactobacillus.
4 Discussion
4.1 Effects of CT on intestinal microbiota diversity
GLU, TC, and TG in the model group were all increased while the TC of the low-dose in the treatment group of CT was significantly decreased, indicating that CT can improve cholesterol metabolism of type 2 diabetes in rats. The results of 16S rDNA showed that the CT's overall performance is to increase the abundance of beneficial bacteria Lactobacillus and reduce the pathogenic bacteria abundance of Prevotella, Succinivibrio, unidentified_Ruminococcaceae, and Treponema.
Numerous studies have found that tea and herb play a critical role in the treatment of diabetes by adjusting the imbalance of intestinal microflora, promoting the abundance of beneficial bacteria, and inhibiting the reproduction of harmful bacteria. Tea supplementation was effective in reversing these changes (Liu et al., 2019; Liu et al., 2020). Lactobacilli are Gram-positive bacteria present in probiotics that restore the balance of the gut microflora (Usman et al., 2019; Panwar et al., 2014; Piano et al., 2012). The laboratory Lactobacillus used in the study assists in the normal expression of metabolic genes, suppresses inflammatory responses and the stress response to obesity and insulin resistance (Youn et al., 2021). Prevotella belongs to a class of anaerobic gram-negative bacilli and is closely related to low-grade inflammation and insulin resistance (Larsen, 2017). In our study, the Prevotella were significantly increased in T2DM mice and were significantly decreased after the CT intervention. Prevotella is a key factor in regulating inflammation and is mediated by caspase-8, which can induce more inflammatory factors to trigger inflammation. So CT may further improve T2DM by inhibiting inflammation. Succinivibrio can ferment a variety of sugars, and the main metabolic products are acetic and succinic acids while small amounts of formic and lactic acids. Ruminococcus was positively associated with T2DM according to most studies, and one of which showed that Ruminococcus bromii abundance increased and Ruminococcus torques decreased after bariatric surgery and diabetes remission (Yao et al., 2020). In the present study, the abundance of Ruminococcus, Treponema, and Succinivibrio significantly decreased after the intervention of CT in diabetic rats, which was partly contrary to the reported results that the abundance of Treponema sp. increased, and the abundance of Ruminococcus sp. decreased significantly in patients or animals with diabetes (Arangannal et al., 2013; Qu et al., 2018).
4.2 Effects of CT on urine metabolites
The 31 metabolites obtained in this research involved changes in carbohydrate metabolism, amino acid metabolism, and lipid metabolism. The level of 1,6-Anhydro-β-D-glucose in the model group increased and decreased significantly after administration. Dysregulation of glucose and impaired carbohydrate consumption resulting from defective or defective insulin secretion responses are key pathogenic factors in diabetes.
In this experiment, changes of nine amino acid metabolites were detected. Among them, Asn-Leu-Pro-Ile-Asn, Phe-Tyr-Lys-Arg, Glu-Lys-Leu-Thr-His, His-Lys-Leu-Val-Val, Ile-Gly-Lys-Ile-Phe of CT group significantly increased, while Gly-Leu-Arg-Val-Phe, Ala-Pro-Arg-Lys-Lys, Lys-Tyr-Gln-Glu-Ala, Asp-Tyr-Asn-Leu-Leu significantly decreased compared to the model. Studies have reported that impaired amino acid metabolism may lead to an increased risk of diabetes, which are closely related to the occurrence of T2DM in the population (Vanweert et al., 2021; Ramzan et al., 2020; Neinast et al., 2019).
Phosphatidylcholine PC(18:1(9Z)/14:0) and PC(16:0/18:0) were up-regulated in the T2DM model group, suggesting the disorder of phospholipid metabolism in T2DM rats. After the intervention of CT, they were significantly down-regulated, suggesting that CT mainly regulates the disorder of lipid metabolism to improve the process of T2DM. The relevant metabolites of the glycerophospholipid metabolic pathway are a class of phosphatidylcholines. Research analysis shows that the intermediate products of the two lipids are closely related to oxidative stress and inflammation complicated by diabetes (Gu et al., 2010). So the content of PC(18:1(9Z)/14:0) and PC(16:0/18:0) could be used as the basis for judging the therapeutic effect of CT on diabetes.
4.3 Common targets and pathways of urine metabolomics and network pharmacology
PIK3R1 and PIK3CA are important targets obtained from the correlation analysis. They are important mediators of insulin metabolism (Winnay et al., 2016; Sopasakis et al., 2010). Correlation analysis of gut microbiota and metabolomic showed that both high-dose and low-dose of CT groups could modulate gut microbiota abundance, and further adjusted the levels of the corresponding metabolites. And it is further found that gut microbiota and metabolites both act on carbohydrate metabolism, amino acid metabolism, and lipid metabolism. A large number of studies have shown that T2DM is a group of common metabolic endocrine diseases with glucose and fat metabolism disorders. Long-term carbohydrate, fat, and protein metabolism disorders can cause multi-system damage. The central link and pathogenesis of various metabolic problems together lead to the occurrence and development of diabetes. The results demonstrate that CT tea can treat type 2 diabetes rats by regulating the composition of intestinal flora, changing bacteria abundance and levels of endogenous metabolites.
4.4 Effects related chemical components of CT
Flavanomarein, luteolin, isookanin, marein, 7,3′,5′-trihydroxy-flavanone, okanin, and caffeic acid plays key role through SRC, TP53, HSP90AA1, STAT3, MAPK1, PIK3R1, AKT1, PIK3CA, HRAS and JUN. It is suggested that flavonoids are the key active compounds of CT in the treatment of T2DM.
The hypoglycemic effect of CT tea in T2DM is attributed to the multiple active components. Flavanomarein, luteolin, isookanin, marein, 7,3′,5′-trihydroxy-flavanone, and okanin belong to a large class of flavonoids. Studies have shown that they treat diabetes by regulating blood sugar. The mechanism is related to the restoration of pancreatic function, inhibition of α-glucosidase activity and regulation of enzymes in glucose metabolism. The monomer marein extracted from CT has been widely studied. Marein can reverse the high expression of SGLT2 and mRNA protein in HK-2 cells treated with high glucose, and activate p-AMPK/p-ACC protein to inhibit glucose uptake. Animal experiments in vivo show that marein could significantly reduce fasting blood glucose, serum triglyceride, cholesterol, and low-density lipoprotein in db/db mice. Marein can reduce gluconeogenesis through Akt/FoxO1, improve insulin resistance and lipid metabolism abnormalities induced by high glucose in HepG2 cells, and have a certain protective effect on mouse islet β cell line MIN6 damage model induced by high glucose and fat. In addition, it can also achieve the goal of reducing blood sugar by regulating the Bcl-2 protein family (Guo et al., 2020; Jiang et al., 2016a; Jiang et al., 2016b). Luteolin is also a kind of flavonoids. Wang et al. found that luteolin reduced cardiomyocyte apoptosis in diabetic mice by inhibiting RhoA/ROCK2 signal pathway, thus improving diabetic myocardial injury and insulin resistance, regulating disorders of glucose and lipid metabolism, and playing an anti-inflammatory role in the treatment of diabetes and its complications. In addition, the degree value of the caffeic acid is 57, ranking in the forefront. Studies show that caffeic acid has the same inhibitory intensity on α-glucosidase as acarbose in vitro, and can reduce fasting blood glucose in type 2 diabetic rats.
Chrysanthemum, with the Chinese name Juhua, has been used as a diet for>3000 years, especially for health care and scented tea. However, the unique geographical, climatic conditions and processing methods of different chrysanthemum producing areas have gradually led to the diversification of chrysanthemum varieties, including ‘Huaiju’, ‘Boju’, ‘Chuju’, ‘Gongju’, ‘Hangju’ and so on. Chrysanthemum contains phenolic acids, flavonoids, volatile oils, carotenoids, and other chemical components, as well as sugars, amino acids, non-volatile sesquiterpenes, triterpenes, and so on (Zhou et al., 2022; Li et al., 2019).
There are significant differences in flavonoid content and composition among different varieties of chrysanthemum. And these are the reason for their different flavor and function. Chrysanthemum, especially Huaiju and Boju, mainly contain flavonoid aglycone, such as apigenin, luteolin, acacetin, diosmetin, etc. While Gongju and Hangju, as traditional medicinal chrysanthemums, the main active components belong to chlorogenic acid, 3,5-dicaffeoylquinic acid, cynaroside, and quercitrin. Studies have shown that the anti-inflammatory, antibacterial, blood pressure, and blood lipid-lowering pharmacological activities of chrysanthemum are closely related to phenolic acids, flavonoids and volatile oil (Chen et al., 2021; Yang et al., 2016; Dong et al., 2014). Chrysanthemum flavonoids, luteolin, and cymaroside, could reduce the weight and level of total cholesterol, triglyceride, and low-density lipoprotein cholesterol, increase the level of high-density lipoprotein cholesterol in blood, reduce steatosis of liver, and improve the index of liver function (Wang et al., 2021; Salles et al., 2021). Also, chrysanthemum flavonoids have good effects on anti-oxidation and activities of enzymes related to lipid metabolism, and have a strong ability of antioxidation and regulation of lipid metabolism (Yamamoto et al., 2015). Therefore, flavonoids and organic acids derivatives in chrysanthemum demands more comparative study.
5 Conclusion
In this study, anti-diabetic mechanism of Coreopsis tinctoria Nutt. water extract was explored. Flavonoids are the key active compounds of CT in treating T2DM. The influence of CT on glycerophospholipid metabolism plays an important role in the treatment of diabetes. The “compounds-target-healthy function” network was constructed with the pathway enrichment analysis. CT may be regarded as a promising scented tea for the callback of metabolic disorders, T2DM, and diabetes-related complications in practice. This study provides the experimental basis for further exploring the mechanism of CT influence on diabetes and strategy for flower tea research. In the following study, we will detect the expression of key enzymes on the target pathway and conduct in vitro and in vivo experiments with metabolites to observe pharmacology effects.
Authors’ contributions
Jing Liu and Xiaopeng Chen designed the study; Jing Liu, Yuqing Pang, Hongxia Yang, Dongna Huo and Xiuxue Liu performed research; Jing Liu analyzed data and wrote the paper; Xiaopeng Chen revised the manuscript. All authors read and approved the final manuscript.
Funding
This work was supported by the Haihe Laboratory of Modern Chinese Medicine (22HHZYSS00001) and National Natural Science Foundation of China (81903915).
Declaration of Competing Interest
The authors declare that they have no known competing financial interests or personal relationships that could have appeared to influence the work reported in this paper.
References
- Numerical investigation of chemical reaction, Soret and Dufour impacts on MHD free convective gyrating flow through a vertical porous channel. Case Stud. Therm. Eng.. 2021;28:101571
- [CrossRef] [Google Scholar]
- Standards of medical care in diabetes-2014. Diabetes Care. 2014;37(1, Suppl 1):S14-S80.
- [CrossRef] [Google Scholar]
- Detection of putative periodontopathic bacteria in type 1 diabetic and healthy children: a comparative study. Indian J. Dent. Res.. 2013;24(3):342-346.
- [CrossRef] [Google Scholar]
- A brief review on anti diabetic plants: Global distribution, active ingredients, extraction techniques and acting mechanisms. Pharmacogn. Rev.. 2012;6(11):22-28.
- [CrossRef] [Google Scholar]
- Comparison of Chemical Constituents and Pharmacological Effects of Different Varieties of Chrysanthemum Flos in China. Chem. Biodivers.. 2021;18(8):e2100206
- [CrossRef] [Google Scholar]
- Prevalence of diagnosed and undiagnosed type 2 diabetes mellitus among US adolescents: results from the continuous NHANES, 1999–2010. Am. J. Epidemiol.. 2013;178(7):1106-1113.
- [CrossRef] [Google Scholar]
- Recovery of oral glucose tolerance by wistar rats after treatment with Coreopsis tinctoria infusion. Phytother. Res.. 2010;24(5):699-705.
- [CrossRef] [Google Scholar]
- The flavonoid-rich fraction of Coreopsis tinctoria promotes glucose tolerance regain through pancreatic function recovery in streptozotocin-induced glucose-intolerant rats. J. Ethnopharmacol.. 2010;132(2):483-490.
- [CrossRef] [Google Scholar]
- Prevention of aqueous extract from Chrysanthemum Morifolium of chuju against high-fat diet induced obesity and dyslipidemia. Food Res. Develop.. 2014;35(04):101-104.
- [Google Scholar]
- Effect of traditional Chinese medicine berberine on type 2 diabetes based on comprehensive metabolomics. Talanta. 2010;81(3):766-772.
- [CrossRef] [Google Scholar]
- Marein ameliorates diabetic nephropathy by inhibiting renal sodium glucose transporter 2 and activating the AMPK signaling pathway in db/db mice and high glucose-treated HK-2 cells. Biomed. Pharmacother.. 2020;131:110684
- [CrossRef] [Google Scholar]
- Integration of metabolomics and network pharmacology to validate the mechanism of Schisandra chinensis(Turcz.)Baill- Acorus tatarinowii Schott ameliorating the Alzheimer's disease by regulating the aromatase activity to affect local estrogen in brain of AD model rats. Arab. J. Chem.. 2023;16(2):104457
- [CrossRef] [Google Scholar]
- Network pharmacology: the next paradigm in drug discovery. Nat. Chem. Biol.. 2008;4(11):682-690.
- [CrossRef] [Google Scholar]
- Marein protects against methylglyoxal-induced apoptosis by activating the AMPK pathway in PC12 cells. Free Radic. Res.. 2016;50(11):1173-1187.
- [CrossRef] [Google Scholar]
- Protective effects of marein on high glucose-induced glucose metabolic disorder in HepG2 cells. Phytomedicine. 2016;23(9):891-900.
- [CrossRef] [Google Scholar]
- Gut metagenome in European women with normal, impaired and diabetic glucose control. Nature. 2013;498(7452):99-103.
- [CrossRef] [Google Scholar]
- Chemical reaction, heat absorption and Newtonian heating on MHD free convective Casson hybrid nanofluids past an infinite oscillating vertical porous plate. Int. Commun. Heat Mass Transf.. 2022;138:106327
- [CrossRef] [Google Scholar]
- Radiative MHD flow of Casson hybrid nanofluid over an infinite exponentially accelerated vertical porous surface. Case Stud. Therm. Eng.. 2021;27:101229
- [CrossRef] [Google Scholar]
- Hall and ion slip effects on MHD rotating flow of elastico-viscous fluid through porous medium. Int. Commun. Heat Mass Transf.. 2020;113:104494
- [CrossRef] [Google Scholar]
- Krishna, M. V., 2022b. Analytical study of chemical reaction, Soret, Hall and ion slip effects on MHD flow past an infinite rotating vertical porous plate. 2044094. https://doi.org/10.1080/17455030.2022.2044094
- The immune response to Prevotella bacteria in chronic inflammatory disease. Immunology. 2017;151(4):363-374.
- [CrossRef] [Google Scholar]
- Modulation of starch digestion for slow glucose release through “toggling” of activities of mucosal α-glucosidases. J. Biol. Chem.. 2012;287(38):31929-31938.
- [CrossRef] [Google Scholar]
- The composition, pharmacological effect and development of compound beverage of Coreopsis tinctoria Nutt. Journal of Hebei Normal University (Natural Science). 2019;43:147-154.
- [CrossRef] [Google Scholar]
- Chemical compositions of chrysanthemum teas and their anti-inflammatory and antioxidant properties. Food Chem.. 2019;286:8-16.
- [CrossRef] [Google Scholar]
- Discovery of potential Q-marker of traditional Chinese medicine based on plant metabolomics and network pharmacology: Periplocae Cortex as an example. Phytomedicine. 2021;85:153535
- [CrossRef] [Google Scholar]
- Effects and mechanisms of probiotics, Prebiotics, Synbiotics, and Postbiotics on metabolic diseases targeting gut microbiota: a narrative review. Nutrients. 2021;13(9):3211.
- [CrossRef] [Google Scholar]
- Fuzhuan brick tea attenuates high-fat diet-induced obesity and associated metabolic disorders by shaping gut microbiota. J. Agric. Food Chem.. 2019;67(49):13589-13604.
- [CrossRef] [Google Scholar]
- Prebiotic properties of green and dark tea contribute to protective effects in chemical-induced colitis in mice: A fecal microbiota transplantation study. J. Agric. Food Chem.. 2020;68(23):6368-6380.
- [CrossRef] [Google Scholar]
- Commercialized non-Camellia tea: traditional function and molecular identification. Acta Pharm. Sin. B.. 2014;4(3):227-237.
- [CrossRef] [Google Scholar]
- Research progress in the relationship between type 2 diabetes mellitus and intestinal flora. Biomed. Pharmacother.. 2019;117:109138
- [CrossRef] [Google Scholar]
- Quantitative analysis of the whole-body metabolic fate of branched-chain amino acids. Cell Metab.. 2019;29(2):417-429.
- [CrossRef] [Google Scholar]
- IDF Diabetes Atlas: global estimates for the prevalence of diabetes for 2015 and 2040. Diabetes Res. Clin. Pract.. 2017;128:40-50.
- [CrossRef] [Google Scholar]
- Lactobacillus strains isolated from infant faeces possess potent inhibitory activity against intestinal alpha- and beta-glucosidases suggesting anti-diabetic potential. Eur. J. Nutr.. 2014;53(7):1465-1474.
- [CrossRef] [Google Scholar]
- The innovative potential of Lactobacillus rhamnosus LR06, Lactobacillus pentosus LPS01, Lactobacillus plantarum LP01, and Lactobacillus delbrueckii Subsp. delbrueckii LDD01 to restore the “gastric barrier effect” in patients chronically treated with PPI: a pilot study. J. Clin. Gastroenterol.. 2012;46(Suppl):S18-S26.
- [CrossRef] [Google Scholar]
- Antidiabetic effects of Lactobacillus casei, fermented yogurt through reshaping gut microbiota structure in type 2 diabetic rats. J. Agric. Food Chem.. 2018;66(48):12696-12705.
- [CrossRef] [Google Scholar]
- A Novel Dietary Intervention Reduces Circulatory Branched-Chain Amino Acids by 50%: A Pilot Study of Relevance for Obesity and Diabetes. Nutrients. 2020;13(1):95.
- [CrossRef] [Google Scholar]
- Non-Camellia Tea in China: Traditional usage, phytochemistry, and pharmacology. Chinese Herbal Medicines. 2019;11(02):119-131.
- [CrossRef] [Google Scholar]
- Protective effect of flavonoids from Passiflora edulis Sims on diabetic complications in rats. J. Pharm. Pharmacol.. 2021;73(10):1361-1368.
- [CrossRef] [Google Scholar]
- Traditional uses, phytochemistry, pharmacology, and toxicology of Coreopsis tinctoria Nutt.: A review. J. Ethnopharmacol.. 2021;269:113690
- [CrossRef] [Google Scholar]
- Specific roles of the p110 alpha isoform of Phosphatidylinsositol 3-Kinase in hepatic insulin signaling and metabolic regulation. Cell Metab.. 2010;11:220-230.
- [CrossRef] [Google Scholar]
- Recent developments in alpha-glucosidase inhibitors for management of type-2 diabetes: an update. Curr. Pharm. Des.. 2019;25(23):2510-2525.
- [CrossRef] [Google Scholar]
- Elevated plasma branched-chain amino acid levels correlate with type 2 diabetes-related metabolic disturbances. J. Clin. Endocrinol. Metab.. 2021;106(4):e1827-e1836.
- [CrossRef] [Google Scholar]
- Dietary Luteolin: A Narrative Review Focusing on Its Pharmacokinetic Properties and Effects on Glycolipid Metabolism. J. Agric. Food Chem.. 2021;69(5):1441-1454.
- [CrossRef] [Google Scholar]
- PI3-kinase mutation linked to insulin and growth factor resistance in vivo. J. Clin. Invest.. 2016;126(4):1401-1412.
- [CrossRef] [Google Scholar]
- Hot water extracts of edible Chrysanthemum morifolium Ramat. exert antidiabetic effects in obese diabetic KK-Ay mice. Biosci. Biotechnol. Biochem.. 2015;79(7):1147-1154.
- [CrossRef] [Google Scholar]
- Quantitative and Qualitative Analysis of Flavonoids and Phenolic Acids in Snow Chrysanthemum (Coreopsis tinctoria Nutt.) by HPLC-DAD and UPLC-ESI-QTOF-MS. Molecules. 2016;21(10):1307.
- [CrossRef] [Google Scholar]
- Cyclocarya paliurus polysaccharides alleviate type 2 diabetic symptoms by modulating gut microbiota and short-chain fatty acids. Phytomedicine. 2020;77:153268
- [CrossRef] [Google Scholar]
- Insulin resistance: review of the underlying molecular mechanisms. J. Cell. Physiol.. 2019;234:8152-8161.
- [CrossRef] [Google Scholar]
- Lactobacillus plantarum reduces low-grade inflammation and glucose levels in a mouse model of chronic stress and diabetes. Infect. Immun.. 2021;89(8):e0061520
- [CrossRef] [Google Scholar]
- Research advance in medicinal plants from genus Coreopsis. Chinese Journal of Chinese Materia Medica. 2013;38:2633-2638.
- [Google Scholar]
- General situation of research on traditional Chinese medicine and its active ingredients in the treatment of diabetes mellitus. Diabetes New World. 2016;19(19):197-198.
- [Google Scholar]
- Discrimination of chrysanthemum varieties using lipidomics based on UHPLC-HR-AM/MS/MS. J. Sci. Food Agric.. 2022;103(2):837-845.
- [CrossRef] [Google Scholar]
- Six types of tea extracts attenuated high-fat diet-induced metabolic syndrome via modulating gut microbiota in rats. Food Res. Int.. 2022;161:111788
- [CrossRef] [Google Scholar]
Appendix A
Supplementary data
Supplementary data to this article can be found online at https://doi.org/10.1016/j.arabjc.2023.105037.
Appendix A
Supplementary data
The following are the Supplementary data to this article:Supplementary data 1
Supplementary data 1


