

Translate this page into:
Husk Cherry: Nutritional attributes, bioactive compounds and technological applications
⁎Corresponding author. shamohamed@pnu.edu.sa (Shaimaa A.M. Abdelmohsen),
-
Received: ,
Accepted: ,
This article was originally published by Elsevier and was migrated to Scientific Scholar after the change of Publisher.
Abstract
Husk cherry (Physalis pruinosa; L) is a tropical fruit commonly grown in the Mediterranean region, and widely consumed fresh in most countries of the world. To enhance our knowledge about this promising fruit, the technological, therapeutic, and nutritional quality attributes of the raw fruits were investigated. The fruit had an orange yellowish color and a mild sweetness, with a pulp yield of 93.40 % (w/w) and a juice yield of 64.45 % (v/w). It contains high ratios of total sugar (41.65%), protein (14.56%), crude fibers (11.59 %), ascorbic acid (40.17 mg/100 g), ß-carotene (64.78 μg/g), total phenols (178.53 mg gallic acid 100 g−1), anthocyanin (7.01 μg cyaniding-3-glucoside equivalents 100 g−1), flavonoids (6.69 mg quercetin g−1), and chlorophylls (19.03 μg g−1). These fruit showed high antioxidant activities, which were found using DPPH and ABTS assays, and could be considered as a good source of antioxidants. The fruit contained several minerals, including potassium, phosphorus, sodium, and magnesium. The major amino acids in the fruit pulp were glutamic acid, aspartic acid, arginine, phenylalanine, proline, valine and alanine. The main polyphenols detected in the fruits were gallic acid, 4-hydroxybenzoic acid, benzoic acid, catechol, ellagic acid, chlorogenic acid, and epicatechin. Several flavonoids can be obtained in high concentrations, such as naringenin, luteolin, and rutin. Six functional food products (juice, jelly, jam, candied fruits, chocolate--coated dried fruits, and fruit leather) were manufactured using husk cherry fruits. The quality attributes of prepared products were determined. The highest crude fiber, ascorbic acid, β carotene, and total sugar compositions were found in chocolate-coated dry fruit products. All the manufactured products were well palatable amongst 25 trained panelists. The findings of this study confirmed the nutritional and technological potential of husk cherry fruits, which might be used effectively within the development of some functional products for food industries.
Keywords
Bioactive compounds
Husk cherry
Jam
Jelly
Juice
Physalis pruinosa

1 Introduction
Physalis pruinosa is a member of the Solanaceae family of approximately 2800 species and 85 genera and is known by many English names, including husk cherry, pineapple tomatillo, and Cape gooseberry. It is a promising tropical plant, which is grown in Australia, California, New Zealand, India, South Africa, and Egypt (Somkuwar 2014; Nawirska-Olszańska et al., 2017). P. pruinosa fruit are commonly consumed fresh in the Middle East. In some countries, small industries have sprouted up around these fruit, but they are yet to gain widespread commercial success (Thuy et al., 2020). In the last few decades, many countries have started processing tropical fruits. This development has led to the expansion of fruit industries in fruit-growing countries, which are attempting to encourage successful production strategies for both domestic and export markets (Mazova et al., 2020). P. pruinosa fruit have several uses in daily consumption in several countries, including in salad decorations and preparing deserts, cooked meals, fresh juices, decorated jelly, and natural preservative (Mazova et al., 2020; Ramadan et al., 2008; Ramadan and Mörsel, 2003).
The shelf life of P. pruinosa fruit grown in Egypt is relatively short, and they can be stored frozen. The fruit have an attractive tropical golden color with a juicy texture and appealing flavor and taste. The productivity of P. pruinosa crops is promising because the fruits are produces in 3–4 months under conditions of low irrigation and poor soils, making it suitable for small-scale commercial production in temperate climates (Singh et al., 2014). Previous investigations have been conducted on the processing of other Physalis species, which are commonly grown as edible fruits and used in desserts, juice processing, and appetizers (Sharoba and Hassanien, 2010; Aamer, 2018; Ramadan and Mörsel, 2003). However, no studies have been conducted on the processing of P. pruinosa fruits to produce jam, candied fruit, chocolate-coated dry fruit, juice, jelly, and fruit leather.
The fruits of closely related Physalis species have also been used in traditional medicine for the treatment of throat infections, amoebas, and intestinal parasites, and they have diuretic, kidney albumin reduction, antiseptic, and antiasthmatic applications (Sharoba and Hassanien, 2010). Additionally, other studies have revealed that P. peruviana is used for the treatment of malaria, dermatitis, and rheumatism (Singh et al., 2014). Previous investigation of P. pruinosa, which included the production of dry fruit, revealed that the fruit contain a high proportion of total sugar (54.22%), titratable acidity (1.72%), high ascorbic acid (178.88 mg/100 g), and moderate ash composition (5.98%) (Abou-Farrag et al., 2013). However, the study did not investigate the possibility of obtaining products other than dried fruit products. Previous investigation of P. peruviana revealed a low ash (2.98 %) and protein (1.66 %) content, a moderate antioxidant ratio (57.67 %), and a moderate phenolic composition (145.22 mg gallic acid /100 g) (İzli et al., 2014). Another study on P. pubescens fruit revealed high protein (13.14%), low pectin (0.47%), moderate polyphenols (125.04 mg tannic acid/100 g), and lower total sugars (32.43%) (El Sheikha et al., 2008). P. peruviana fruit has strong antioxidant and anticancer properties (Mier-Giraldo et al., 2017). Additionally, the leaves, calyces, and fruit of other Physalis species, such as P. patula, P. subulata, P. solanacea, P. hederifolia, and P. angulata, contain several phenolic acids and have noticeable antioxidant activities (Medina-Medrano et al., 2015). However, the health benefits and nutritional values of P. pruinosa fruit are understudied.
Considering the health benefits of P. pruinosa, very limited attention has been given to prolonging the shelf life of its fruit in food industries. There is currently no available information about the nutritional, chemical, and sensory characteristics of prepared food stuff from P. pruinosa. This study sheds light mostly on the fruit of the husk cherry (Physalis pruinosa), which is already widely consumed fresh in most countries worldwide. This may explain why surplus fruits record post-harvest losses due to weevil infection and poor handling during its peak season. As a result, there is a need to investigate efficient and affordable food processing methods that can be used to process surplus fruits into shelf-stable products such as juice, jelly, jam, and other similar products that are safe, nutritious, inexpensive, well preferred by consumers, and economically viable alternatives that will minimize post-harvest losses. The main aims of the study are to assess the bioactive compounds and nutritional quality attributes of husk cherry (P. pruinosa) and to develop six food products, including jam, candied fruit, chocolate-coated dry fruit, juice, jelly, and fruit leather, of P. pruinosa, and to assess the most significant attributes that control their quality characteristics. This technological processing of these fruits may develop continuous supply to the local and international markets with new products of high nutritional and economic value.
2 Materials and methods
2.1 Chemicals and plant material
All chemicals used in this study were of analytical grade and purchased from Sigma Aldrich (Berlin, Germany). Fresh husk cherry (P. pruinosa L) fruits (Fig. 1) were purchased from the local market in Damietta, Egypt in October 2019. Samples were identified by Prof. Elansary at the Faculty of Agriculture, University of Alexandria. The fruits were sorted and then washed with running tap water. The entire clean, de-husked fruits were used in the manufacture of jam, candied fruit, and chocolate-coated dry fruit, while the fruit pulp was used in the manufacture of juice, jelly, and fruit leather. Sugar, chocolate, glass, bottles, and jars were purchased from Damietta hypermarkets.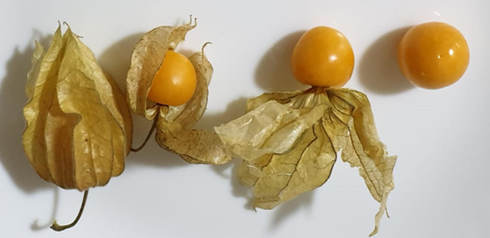
Whole fruit and berries of husk cherry (P. pruinosa, L); (Photo by E. A. Mahmoud).
2.2 Physicochemical methods
The measured technological properties of P. pruinosa fruit included the percentage of the husk, pulp yield, juice yield, skin and seeds, and juice ratio, which were determined using a digital top-loading balance (Radwag PS 6000/C1).
The physical properties of the fruit, including average weight (g fruit−1), fruit average width (cm fruit−1), fruit average length (cm fruit−1), and fruit index (width length−1), were measured in micrometers. The number of fruit kg−1, number of seeds fruit−1, and weight of one thousand seeds (g) were determined (Kramer and Twigg, 1971; Polat and Caliskan, 2008). The pH values of fresh fruit and prepared products were measured (A.O.A.C., 2005) using a glass electrode pH meter (SX811-BR Portable pH Meter, USA). Total soluble solids (TSS %) were determined using a refractometer (Atago, Japan) at 20 °C following the Association of Official Analytical Chemists (AOAC) (2005). Total soluble solids (TSS) and titratable acidity were used to measure the sugar to acid ratio (Lacey et al., 2001). Color was assessed using a Lovibond Schofield Tintometer (model IA, USA) following Ranganna (1977).
2.3 Analytical methods
2.3.1 Nutritional properties
Moisture, crude protein, ether extract, crude fiber, ash, total sugar, nitrogen-free extract, total titratable acidity (as citric acid % w/v), and ascorbic acid were determined following the AOAC (2005). The calorific value was 9 Cal gram−1 for fat and 4 Cal gram−1 for protein and carbohydrate (Joint F.A.O./W.H.O. expert committee on nutrition, 1970). The total pectin content was determined following Horwitz (1982).
2.3.2 Mineral composition
Thirteen key minerals (5 Macro-minerals, 5 Micro-minerals, and 3 Ultra-trace minerals) were assayed. Sodium (Na) and potassium (K) were determined using a Gallenkamp flame analyzer (Model PEP7, U.K.). Other minerals were measured using a Perkin Elmer atomic absorption spectrophotometer (Perkin Elmer 932AA, Australia), following AOAC (2005) Total phosphorus was estimated calorimetrically at 660 nm (Taussky and Shorr, 1953).
2.3.3 Phytochemical compounds
Total chlorophyll and β-carotene content (μg/g) were determined in the acetone extract (80%) using a spectrophotometer at 652 and 440 nm, respectively (A.O.A.C., 2005) Total flavonoids, phenol content, and antioxidant activities were determined in the methanol extract (80%) using a spectrophotometer. The methanol extract was formed by blending 1 g of sample with 10 mL of methanol (80%) and stirring it for 24 h at room temperature before filtering. The total flavonoid content (mg quercetin g−1) was estimated using a spectrophotometer at 510 nm (Zakaria and Tan, 2013). Then, the total polyphenols content (mg gallic acid 100 g−1) was determined using the Folin-Ciocalteu method with a spectrophotometer at 765 nm (Maurya and Singh, 2009). Antioxidant activity was determined using two radical scavenging spectrophotometric assays of DPPH (2, 2-diphenypicrylhydrazyl) at 517 nm (Park et al., 2010) and ABTS (2, 2′‐azino‐bis (3‐ethylbenzothiazoline‐6‐sulphonic acid) at 734 nm (Re et al., 1999; Nawirska-Olszańska et al., 2013). The total anthocyanins composition (μg cyaniding-3-glucoside equivalents 100 g−1) was determined in the methanol containing 1% (v/v) HCl using a spectrophotometer at 520 and 700 nm (Stanciu et al., 2010). The total tannins content (mg tannic acid 100 g−1) was determined in ethanol extract (70%) using a spectrophotometer at 700 nm using Folin-Denis reagent (Saxena et al., 2013).
2.3.4 Carbohydrate assay
Soluble sugars were extracted sequentially with three portions of boiling aqueous-ethanol 80%. The supernatant was mixed, and the ethanol was evaporated using a rotary evaporator (Eyela, N-1300S-W 115 V) at 45 °C until 15 mL, which was diluted to 50 mL with distilled water before being filtered to 0.2 mm for chromatographic assay. The separation was performed on an ion chromatograph (Dionex DX600) equipped with a column filled with polystyrene-divinylbenzene balls ranging in size from 5 to 10 μm, an anion-exchange column (250 mm × 4 mm, Dionex Carbo-Pac PA1), and an amper-ometric detector (PAD) (Zhang and Ritenour, 2016).
2.3.5 Amino acids assay
After 24 h of hydrolysis with 6 N HCl containing 0.1 % mercaptoethanol at 100 °C, amino acid compositions were measured by liquid chromatography using a Beckman amino acid analyzer 119CL-GB (Moore and Stein, 1963). Treptophan was destroyed by acid hydrolyzes. The colorimetric method was used to calculate the tryptophan in a Ba (OH) 2 hydrolysate (Lucas and Sotel, 1980).
2.3.6 Fatty acid assay
Fatty acid methyl esters were prepared as described before (A.O.A.C., 2012). Then, they were directly injected into the gas chromatograph (Agilent, Model GC6890), which was equipped with a flame-ionization detector (FID). A Supelcowax10 capillary column (SGE, Courtaboeuf, France; 0.32 mm internal diameter × 30 m length, 0.25 m film thickness) was used. Helium was used as the carrier gas, with a flow rate of 1 mL.min−1 and a splitting ratio of 1/100. The injector temperature was 250 °C and that of the FID was 270 °C. Fatty acids were identified by comparing them to commercially available fatty acid standards (Mannion et al., 2018). The peaks were identified using retention times and comparing them to standards.
2.3.7 Polyphenol analyses
For the high performance liquid chromatography (HPLC) analyses, the methanolic extracts of P. pruinosa fruit pulp were prepared by sonication of 0.5 g dry weight in 8 mL of methanol (HPLC grade, Merck). Next, the extracts were fractionated using HPLC Agilent 1100 (Agilent, Germany), equipped with column: Hypersil BDS-C18, 5 μm (150 mm × 4.6 mm, Altech, USA), UV–Vis (G1314B) detector operated at 254 (catechins and phenolic acids) and 273 nm (flavonoids). Elution was carried out with flow rat 0.3 mL/min at 25 °C and an injection volume: 10 μL. Mobile phase: solvent A: (acetic acid/ acetonitrile) (0.5/ 99.5, v/ v), and solvent B: acetic acid/ water (0.5/ 99.5, v/ v) were de-aerated in an ultrasonic bath after being filtered through 0.45-m Nylon filters. The gradient program was as follows: 0–20 min 100% B; 20–35 min 100–80% B; 35–55 min 80–60% B; 55–70 min 60–0% B; 70–75 min 0% B; 75–80 min 0–100% B; 80–90 min 100% B. The method was validated for range, precision, linearity, system suitability, sensitivity, and specificity (Niranjan et al., 2009). Agilent Chem-Station software was used to integrate the data. The retention times and UV–VIS spectra of phenolic compounds were compared to those of authentic Sigma Aldrich standards (Carranco et al., 2018).
2.4 Technological methods
P. pruinosa samples were manually de-husked, sorted to pick mature fruit and graded according to color, before being washed with tap water. For the duration of the experiment, whole fresh fruits pulp of P. pruinosa were stored at – 18 °C. The de-husked fruit were divided into three sections and processed as follows:
First Section: Canned and chocolate-coated dry fruit were processed using whole fruit.
Second Section: Using a fruit pulpier (Kenwood AT644, Japan), fruit were pulped, and the pulp was used to make jam. The prepared pulp was cold stored at −18 °C until it was used.
Third section: The extracted pulp was filtered through a cheese cloth to separate the seeds and skins before it was used to produce juice, jelly, and fruit leather. The fruit juice was cold stored at −18 °C until it was used.
Fig. 2(A&B) shows the detailed flow sheet used to prepare the selected products. All products in this study were manufactured at the Department of Food Industries, Damietta University, Egypt.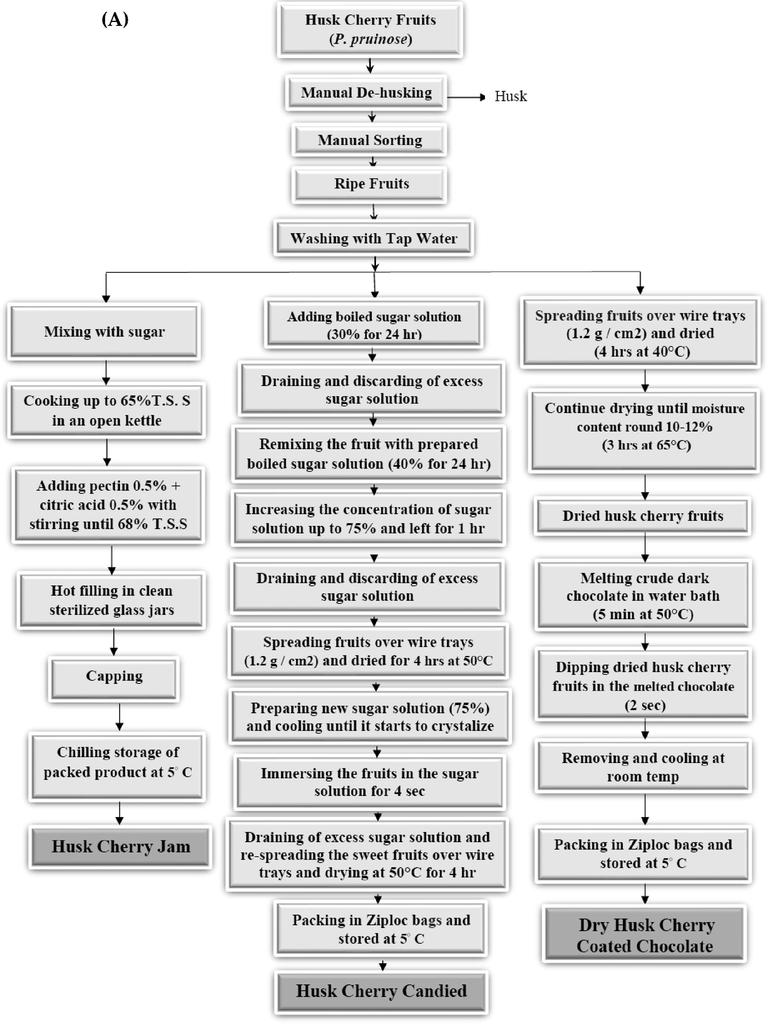
Flow sheet of prepared Husk cherry (P. pruinosa) products. A: products manufactured from whole Husk cherry fruits (jam, candied fruit, and chocolate-coated dry fruit); B: products manufactured from Husk cherry puree (juice, jelly, and fruit leather).
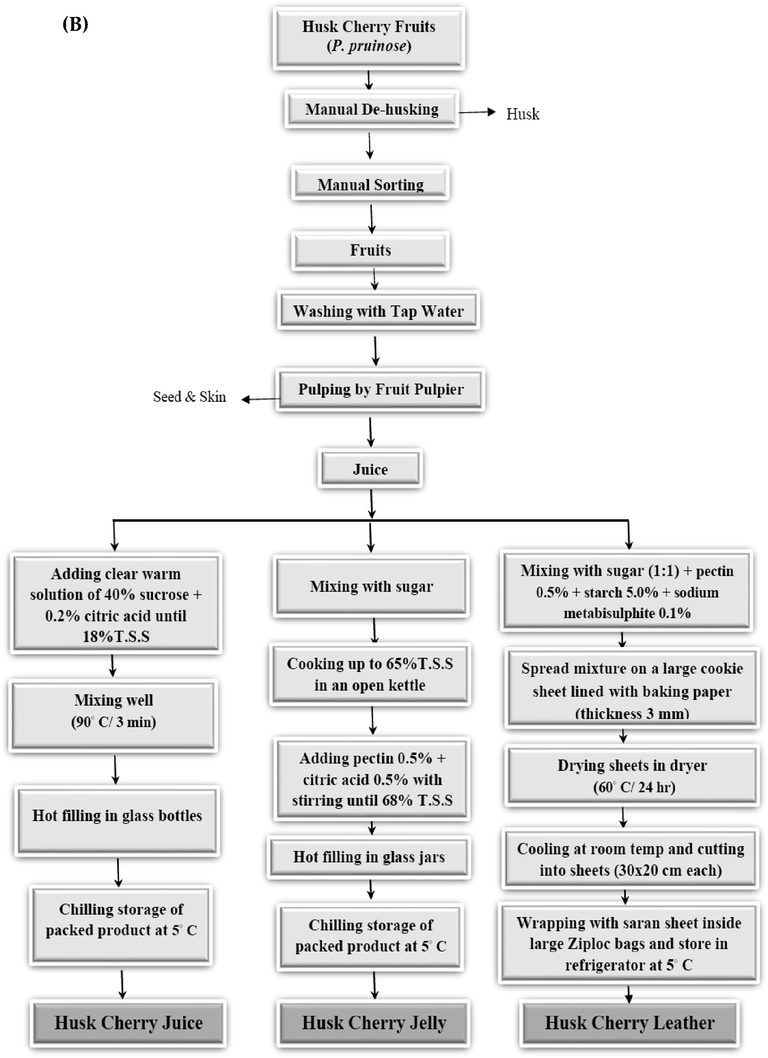
Flow sheet of prepared Husk cherry (P. pruinosa) products. A: products manufactured from whole Husk cherry fruits (jam, candied fruit, and chocolate-coated dry fruit); B: products manufactured from Husk cherry puree (juice, jelly, and fruit leather).
2.5 Sensory evaluation
Sensory evaluation of prepared P. pruinosa products was carried out using 25 trained panelists (11 females and 14 males, aged 23–50 years) with at least three years of experience. All panelists were staff, faculty and post grad students at the Food Industries Department, Damietta University, Egypt. Following a 60-minute orientation session, the panelists began documenting the aims of the study, vocabulary, as well as each sensory attribute and key points on the scale. The panelists were shown the 3-digit coded samples simultaneously and assessed them in a random order. A one-minute interval between samples was required to limit carryover effects. Panelists were provided with a drinkable water to clean their mouths after assessing each sample to limit taste interference (Iwe, 2002). For juice, jam, and jelly, the samples were packaged in coded transparent glass jars; however, canned and chocolate-coated dry fruit, and fruit leather were kept in coded plates filled with aluminum foil. All samples were shown under white lightening and the room temperature was set to 25 °C. The sensory quality attributes of the samples were general appearance, colour, taste, odor, texture, homogeneity, and overall palatability. The panelists were asked to rate the above attributes according to a hedonic scale of 1 (extremely dislike), 2–4 (dislike), 5–6 (fair), 7–8 (like), and 9–10 (extremely like) and the mean scores of the three evaluations were calculated. All sensory experiments were conducted under the academic supervision of a Food Industries Department.
2.6 Statistical analysis
The results were presented as means of triplicates ± standard deviation (SD). A one-way analysis of variance (ANOVA) with post-hoc Tukey’s Honestly Significant Difference (Tukey HSD) was performed using SAS software (Ver. 9.4) to test for significance variations between sample means at p < 0.05.
3 Results and discussion
3.1 Physical and technological properties of fresh P. Pruinosa fruit
The average weight, width, length, and fruit index of fresh P. pruinosa fruit were 3.91 g, 1.99 cm, 1.89 cm, and 1.05, respectively (Table 1). Each 1 kg sample contained an average of 275 fruit, each fruit contained an average of 203 seed and the average weight of 1000 seeds was 2.12 g. The fresh fruit husk comprised 6.60%, the pulp yield percentage was 93.40%, and the juice yield was 64.45%. Due to the high skin and seeds ratio (35.55%), the juice ratio (1.81/1) was low. Published work on this species is very limited. Therefore, this is the first comprehensive technological investigation of this species. Previously, one research group found that the fruit of P. pruinosa has comparable fruit characteristics and number of fruits kg−1, but they did not measure juice parameters, such as the juice yield and ratio (Abou-Farrag et al., 2013). Other studies on another species of the same genus, e.g., P. peruviana, have revealed lower numbers of fruit kg−1, higher husk content (8.02%), lower seed and skin ratio (21%), higher fruit weight (4.69 g), and higher ratio of extracted juice (79%) (Aamer, 2018). Another study on P. peruviana showed comparable mass of fruit (3.09 g) and fruit diameters (İzli et al., 2014). The variations among these findings might be attributed to species, harvest time, climate, cultivation conditions, and growing area. Values are shown as the mean ± standard deviation, n = 30.
Technological properties (%w/w)
Husk
6.60 ± 1.11
Pulp yield
93.40 ± 1.23
Juice yield
64.45 ± 0.78
Skin and seeds
35.55 ± 0.89
Juice ratio (Juice yield/seeds + skin)
1.81/1 ± 0.09
Physical properties
Number of fruits per kilogram
275.00 ± 2.06
Fruit average weight (g)
3.91 ± 0.32
Fruit average width (cm)
1.99 ± 0.94
Fruit average length (cm)
1.89 ± 1.03
Fruit index (width/length)
1.05 ± 1.42
Number of seeds per fruit
203 ± 0.79
Weight of one thousand seeds (g)
2.12 ± 0.52
3.2 Nutritional and phytochemical properties of P. Pruinosa fruit
The fruit samples contained high ratios of protein (14.56%), total sugar (41.65%), and crude fibers (11.59 %) as well as a moderate moisture ratio, as shown in Table 2. A previous study on P. pruinosa revealed a higher value of total sugar (54.22%) and comparable ash composition (5.98%) (Abou-Farrag et al., 2013). The fruits contained total phenols (178.53 mg gallic acid 100 g−1), anthocyanin (7.01 μg cyaniding-3-glucoside equivalents 100 g−1), flavonoids (6.69 mg quercetin g−1), and chlorophylls (19.03 μg g−1). These data were in agreement with El- Beltagi et al. (2019) who found that total phenols, and total flavonoids in P. peruviana fruits were125.44 mg gallic acid /g, and 6.39 mg quercetin/ g; respectively. Additionally, the fruits showed high antioxidant activities, as shown by the DPPH (567.12 μg trolox equivalent g−1) and ABTS (534.03 μg trolox equivalent g−1) assays (Table 2). The results showed that P. pruinosa could become a potential source of bioactive compounds that might be used as natural food additives rather than chemical artificial additives. Different species such as P. peruviana revealed lower ash (2.98 %) and protein (1.66 %) contents, a moderate antioxidant ratio (57.67 %), and lower phenolic composition (145.22 mg gallic acid /100 g) (İzli et al., 2014). The data was consistent with Ramadan and Mörsel(2007), that fresh cape gooseberry had 78 % antioxidant activity. According to Jéssica et al. (2013), antioxidant activity might be correlated with the quantity of total flavonoid, total phenolic, ß-carotene, and vitamin C content since these compounds function as scavengers of free radicals through oxidation. Values are shown as the mean ± standard deviation, n = 3; * on fresh weight basis ** on dry weight basis; DPPH–2, 2-diphenyl-1-(2, 4, 6-trinitrophenyl)-hydrazonyl, ABTS–2, 2′-azino-bis; (3-ethylbenzothiazoline-6-sulphonic acid).
Nutritional properties (%w/w)
Moisture
81.83 ± 1.34
Crude protein (T.N × 6.25) **
14.56 ± 1.12
Ether extract**
9.34 ± 0.53
Crude fiber**
11.59 ± 0.92
Ash **
5.84 ± 0.26
Total sugar**
41.65 ± 0.85
Nitrogen-free extract **
18.67 ± 0.86
Total Pectin content **
0.74 ± 0.11
Energy (kcal/100 g) **
308.90 ± 0.93
Phytochemical properties
Total chlorophyll (μg g−1) *
19.03 ± 0.94
Total anthocyanins (μg cyaniding-3-glucoside equivalents 100 g−1) *
7.01 ± 0.13
Total phenol content (mg gallic acid 100 g−1) **
178.53 ± 0.16
Total flavonoids (mg quercetin g−1) **
6.69 ± 0.32
Antioxidant activity
DPPH assay (μg trolox equivalent g−1) *
567.12 ± 0.61
ABTS assay (μg trolox equivalent g−1) *
534.03 ± 0.24
3.3 Amino and fatty acids profiles of P. Pruinosa fruit
The amino acid analyses of the fruit showed high contents of total essential amino acids (27.26 g 100 g−1), total semi-essential amino acids (11.45 g 100 g−1), and total non-essential amino acids (57.10 g 100 g−1) as presented in Table 3. The total amino acid composition was 95.81 g 100 g−1, and it contained several essential amino acids, such as phenylalanine, valine, leucine, threonine, lysine, isoleucine, and tryptophan, two semi-essential amino acids, including arginine and histidine, and non-essential amino acids, including glutamic acid, aspartic acid, proine, alanine, and tyrosine. The major amino acids in the current study were glutamic acid (19.82%), aspartic acid (17.49%), and arginine (9.44%). These amino acids were found at higher concentrations than for other species, such as P. pubescens. Interestingly, higher amounts of specific amino acids, such as the arginine, were found in the sampled P. pruinosa fruit than in other congeneric species in previous studies. A.A: amino acids; DR: daily recommendations for adults by WHO/ FAO/UNU’s 2007 Values are shown as the mean ± standard deviation, n = 3; SFA: saturated fatty acids; USFA: unsaturated fatty acids, MUFA: monounsaturated fatty acids; PUFA: polyunsaturated fatty acids.
Amino acid
Content
(g/100 g of protein)DR
(g/day)Fatty acid
Content (%of total fatty acids)
DR
(g/day)
Phenylalanine
4.90 ± 0.64
1.90
C12:0
Lauric
0.30 ± 0.23
Valine
4.51 ± 0.52
3.90
C14:0
Myristic
0.67 ± 0.14
Leucine
3.92 ± 0.84
5.90
C16:0
Palmitic
7.11 ± 0.26
Threonine
3.83 ± 0.34
2.30
C18:0
Stearic
2.51 ± 0.21
Lysine
3.24 ± 0.28
4.50
C20:0
Arachidic
2.08 ± 0.11
Isoleucine
3.15 ± 0.77
3.00
C22:0
Behenic
0.63 ± 0.16
Tryptophan
2.40 ± 0.16
6.00
C24:0
Lignoceric
0.74 ± 0.19
Methionine
1.33 ± 0.26
1.50
Total SFA
14.04 ± 0.19
21–34
Total Essential A. A
27.26 ± 0.25
27.70
C16:1
Palmitoleic
3.79 ± 0.12
Arginine
9.44 ± 0.92
_
C18:1n9
Oleic
20.16 ± 0.31
Histidine
2.01 ± 0.63
1.50
C20:1
Gadoleic
0.52 ± 0.22
Total Semi-Essential A. A
11.45 ± 0.21
C22:1n-9
Erucic
0.82 ± 0.19
Glutamic acid
19.82 ± 0.69
C24:1n-9
Nervonic
1.09 ± 0.15
Aspartic acid
17.49 ± 0.15
MUFA
26.37 ± 0.20
24–39
Proline
7.27 ± 0.43
C18:2n6
Linoleic
56.57 ± 0.17
Alanine
4.37 ± 0.17
C18:3n-3
Linolenic
0.59 ± 0.24
Tyrosine
3.62 ± 0.12
C20:3n-6
Eicosatrienoic
2.43 ± 0.11
Glycine
2.62 ± 0.83
PUFA
59.59 ± 0.17
11–17
Serine
2.39 ± 0.54
Total USFA
USFA/SFA
85.96 ± 0.19
Cysteine
0.52 ± 0.72
6.12
Total Non-essential A. A
57.10 ± 0.28
Total A. A
95.81 ± 0.23
12.20
First limiting amino acid
Lysine
Second limiting amino acid
Methionine& Cysteine
2.20
To the best of our knowledge, the fatty acid composition of the P. pruinosa fruit of this species had not been previously reported, and the current study revealed high ratios of saturated, monounsaturated, and polyunsaturated fatty acids, including palmitic, stearic, arachidic, oleic, palmitoleic, nervonic, linoleic, and linolenic acids (Table 3). The fruit contained saturated fatty acids (14.04%), such as palmitic, stearic, and arachidic acids, monounsaturated fatty acids (26.37%), such as oleic, palmitoleic, and nervonic acids, and polyunsaturated fatty acids (59.59%), such as linoleic and linolenic acids. The lack of short-chain fatty acids (such as caproic and caprylic acid) may indicate that there is no undesirable odor from P. pruinosa, which is one of the most important technical properties of the oil (Norma et al., 2004). The fruit contained considerable amounts of essential amino and fatty acids, which cover much of the dietary reference intake of World Health Organization (WHO)/ Food and Agriculture Organization (FAO)/United Nations University (UNU) for 2007, indicating that these fruits are highly suitable for daily consumption (WHO/FAO/UNU’s, 2007).
3.4 The mineral composition of P. Pruinosa fruits
In the investigated fruit, several minerals were found including potassium, phosphorus, sodium, and magnesium, as shown in Table 4. The highest mineral contents were of potassium (547.50 mg 100 g−1), phosphorus (156.87 mg 100 g−1), and sodium (111.83 mg 100 g−1). Sodium and potassium can regulate the body's blood pressure and water balance. Other trace and ultra-trace elements were found, including iron, zinc, cobalt, and boron. This is the first report on the mineral composition of P. pruinosa fruit. These minerals play a key role in the composition of teeth and bones, promote enzymatic processes, aid in regulation of body fluid compositions, and contribute to metabolisms as vitamins and hormones (Cobaleda-Velasco et al., 2017). Studies on P. peruviana found that potassium and magnesium were the major elements in the fruit pulp (689.2 ppm and 65.3 ppm of fresh weight, respectively) (Aamer, 2018). The mineral composition of the fruit pulp included a considerable amount of the WHO/FAO/UNU’s 2004 recommended daily intake, indicating that these fruits are highly suitable for daily consumption (DRIs, 2004). Values are shown as mean ± standard deviations, n = 3; M = meals; F = females. DR: daily recommendations for adults by WHO/ FAO/UNU’s 2004
Mineral
Content
(mg 100 g−1)DR
(mg/kg/day)
Macro-minerals
K
Potassium
547.50 ± 0.23
4700
P
Phosphorous
156.87 ± 0.19
700
Na
Sodium
111.83 ± 0.11
1500
Mg
Magnesium
32.66 ± 0.26
M: 400/ F:310
Ca
Calcium
11.84 ± 0.31
1000
Micro-minerals
Trace elements
Fe
Iron
2.06 ± 0.14
M: 9/ F:20
Zn
Zinc
1.29 ± 0.22
M: 11/ F:8
Cu
Copper
1.05 ± 0.16
0.9
Mn
Manganese
0.41 ± 0.11
M: 2.3/ F:1.8
Co
Cobalt
0.14 ± 0.24
1.5
Ultra-trace elements
B
Boron
0.06 ± 0.14
1–13
Cr
Chromium
0.009 ± 0.11
M:0.04/ F:0.03
Cd
Cadmium
0.005 ± 0.17
0.06
3.5 The polyphenolic profile of P. Pruinosa fruits
The methanolic extract of the fruit pulp contained twenty-nine polyphenols (Table 5). The major polyphenols were gallic acid, 4-hydroxybenzoic acid, benzoic acid, catechol, ellagic acid, chlorogenic acid, and epicatechin. Other estimated phenolic compounds, such as catechin, vanillic acid, and caffeic acid, were present at lower amounts. However, some flavonoids were available at high quantities, such as naringenin, luteolin, and rutin (Fig. 3). Rt: retention time in minutes, n = 3. Polyphenolic compounds’ molecular structures were obtained from http://www.chemspider/com database.
Compound
patternPolyphenols
Mass Weight
Molecular Formula
RT
(min)Content
1
Gallic acid
170.12
C7H6O5
4.92
180.22
2
4-Aminobenzoic acid
137.14
C7H7NO2
6.77
4.89
3
Catechin
290.27
C15H14O6
8.86
10.43
4
Protocatechuic acid
154.12
C7H6O4
10.69
7.17
5
Naringenin
272.25
C15H12O5
14.85
30.82
6
Chlorogenic acid
354.31
C16H18O9
15.65
12.62
7
Catechol
142.18
C6H6O2
16.78
20.78
8
Epicatechin
290.27
C15H14O6
17.11
11.98
9
Caffeine
194.19
C8H10N4O2
18.73
0.23
10
4-Hydroxybenzoic acid
138.12
C7H6O3
20.00
30.88
11
Caffeic acid
180.16
C9H8O4
21.03
8.92
12
Vanillic acid
168.15
C8H8O4
24.85
10.36
13
Syringic acid
198.17
C9H10O5
26.12
8.75
14
Vanillin
152.15
C8H8O3
29.00
2.32
15
o-Coumaric acid
164.158
C9H8O3
32.92
5.23
16
Ferulic acid
194.18
C10H10O4
33.45
4.48
17
Isoferulic acid
194.18
C10H10O4
35.21
5.74
18
Resveratrol
228.24
C14H12O3
36.43
2.82
19
Ellagic acid
302.19
C14H6O8
37.65
14.11
20
Benzoic acid
122.12
C7H6O2
38.65
24.85
21
3,4,5-trimethoxycinnamic acid
238.24
C12H14O5
39.42
1.51
22
Coumarin
146.14
C9H6O2
40.03
4.36
23
Salicylic acid
138.12
C7H6O3
41.86
8.38
24
Cinnamic
148.16
C9H8O2
45.61
2.73
25
Rutin
610.52
C27H30O16
63.14
14.02
26
Luteolin
286.24
C15H10O6
74.23
14.67
27
Kaempferol
286.24
C15H10O6
77.08
7.23
28
Quercetin
302.24
C15H10O7
79.05
8.71
29
Apigenin
270.24
C15H10O5
88.12
4.22
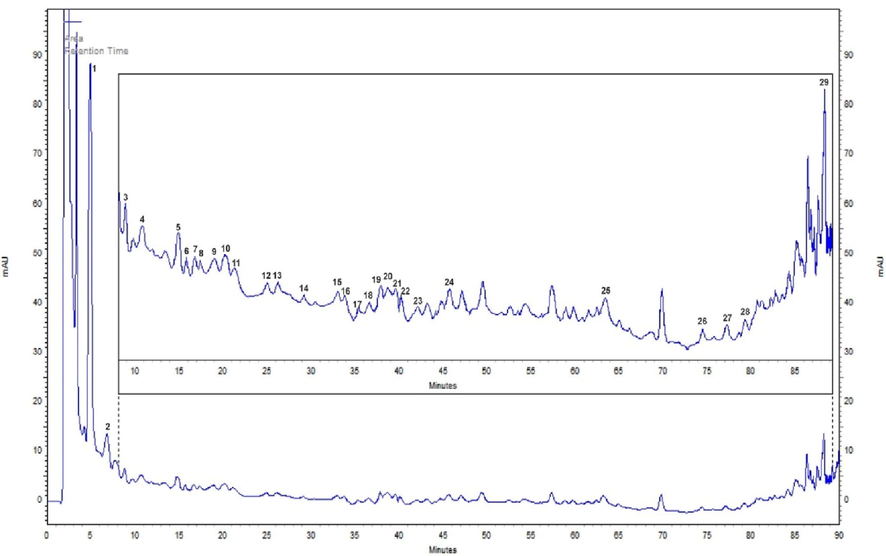
Representative HPLC chromatogram of the methanolic extract of P. pruinosa fruit pulp.
Previous investigation of P. peruviana fruit from Poland using fluorometry and Fourier transform infrared (FT-IR) revealed the availability of some polyphenols, such as gallic acid, ferulic acid, hesperidin, tannic acid, caffeic acid, and quercetin (Namieśnik et al., 2014). In another study, the leaves, fruits, and calyces of five wild Physalis species (P. angulata, P. subulata, P. solanacea, P. patula, and P. hederifolia var hederifolia) were investigated using HPLC with a diode-array detector (HPLC-DAD) and contained some polyphenols, such as quercetin-3-O-glycoside and kaempferol-3-O-glycoside (Medina-Medrano et al., 2015). HPLC-DAD on P. angulata, which is a medicinal plant from Mexico, revealed that the calyx of the plant contained chlorogenic acid, while the leaves and stems contained quercetin-3-O-glycoside (Cobaleda-Velasco et al., 2017). To the best of our knowledge, this is the first investigation of the polyphenolic profile of P. pruinosa fruit using HPLC.
3.6 The physicochemical, color, and nutritional properties of prepared P. Pruinosa food products
The physicochemical, color, and nutritional properties of P. pruinosa fruit and prepared products, including juice, jelly, jam, leather, candied fruit, and chocolate-coated dry fruit are shown in Table 6 and Fig. 4. The physicochemical properties included pH value, TSS (°Brix), titratable acidity (as citric acid %), and TSS/acidity. There were no significant differences between the pH values of the different products and the original fruit. The chocolate-coated dry fruit, candied fruit, and leather fruit showed higher TSS values than other food products, and they were followed by jam and jelly. The addition of sugar leads to an increase in the TSS values. The titratable acidity was highest in leather compared with other products owing to the loss of moisture throughout dehydration procedure. The TSS/acidity was higher in jam and jelly than other products. The color properties of the fruit and prepared products were measured using the Lovibond test, and they showed that the highest values of blue, red, and yellow colors were found in the leather compared with other products, followed by jelly, jam, and candied fruit. The color coordinates can of course be changed due to different manufacturing processes and effect of heating. The crude fiber, total sugar content, reducing sugars, and non-reducing sugars of the food products were measured to indicate their nutritional properties. The highest crude fiber composition was found in chocolate-coated dry fruit, followed by leather, jam, candied fruit, and jelly. The highest total sugar content was found for chocolate-coated dry fruit (82.21%) and candied fruit (80.00%), followed by jelly, leather, and jam. The fructose and glucose contents were higher in jam (31.21% and 24.26 %, respectively), jelly (29.11% and 23.12%, respectively), and leather (27.23% and 23.01%, respectively) than in other products. Additionally, the sucrose content was higher in chocolate-coated dry fruit and candied fruit compared with other products. The percentage of maltose was higher in juice, jelly, and leather than other products. The significant differences (p ≤ 0. 5) in sugar content between the products was due to the percentage of added sucrose in each manufacturing process, as well as the inclusion of chocolate. Also, some bioactive compounds including ascorbic acid, β carotene contents, total tannins, total phenol content, and total flavonoids, of prepared P. pruinosa products were determined (Table 6). The antioxidants activity might be associated with the compositions of β-carotene, vitamin C, flavonoids, and the total phenols, because these compounds act as free radical scavengers formed during the oxidation reaction. The ascorbic acid composition was significantly higher (p ≤ 0.05) in chocolate-coated dry fruit and candied fruit than other products. The β carotene composition was the highest in the fresh fruit, followed by chocolate-coated dry fruit and candied fruit products. Additionally, the total tannin content was higher in the fresh fruit than other products. The chocolate-coated dry fruit was high (p ≤ 0.05) in total phenol (165.44 mg gallic acid 100 g−1) and flavonoid contents (43.29 mg quercetin g−1). This could be explained by the high polyphenols and flavonoids compositions in dark chocolate (Vertuani et al., 2014). In contrary, the juice had lower amount of total phenol and flavonoid contents (5.02 mg gallic acid 100 g−1, and 0.59 mg quercetin g−1, respectively). A previous study on P. pruinosa fruit revealed higher values of total sugars (54.22%), titratable acidity (1.72%), ascorbic acid (178.88 mg/100 g), and comparable ash composition (5.98%) (Abou-Farrag et al., 2013) than our findings in this study. This previous study investigated the effect of drying methods on the drying behavior of the fruit. However, they did not investigate the possibility of obtaining products other than dried fruits products. The variations in some chemical compositions of the fruit of this species might be attributed to seasonal and environmental conditions. To the best of our knowledge, this is the first investigation on six food product processes from the fruit of P. pruinosa. Previous investigations on P. peruviana fruit revealed that their juice contained ascorbic acid at 51.8 mg 100 mL−1, 4.97% crude fiber, a pH value of 3.6, and 11.3% of total sugar (Sharoba and Hassanien, 2010). In general, obtained data for manufactured products differ according to several factors such as the fruit species, processing procedure, temperature, and ingredients. Values = the mean ± standard deviation, n = 3. Means in a raw that are not followed by the same letter are significantly different (p ≤ 0. 5). * on fresh weight basis and ** on dry weight basis.
Property
P. pruinosa Fruit
Prepared products
Juice
Jelly
Leather
Jam
Candied
Dry coated chocolate
Physicochemical properties
pH value
3.80 ± 0.08a
3.82 ± 0.11a
3.62 ± 0.18a
3.62 ± 0.19a
3.70 ± 0.12a
3.82 ± 0.18 a
3.37 ± 0.15a
TSS (°Brix) *
12.85 ± 0.96d
17.75 ± 0.52c
67.85 ± 1.21b
73.60 ± 1.42a
66.85 ± 1.86b
75.85 ± 1.34a
76.34 ± 1.33a
Titratable acidity (as citric acid %w/v)*
1.39 ± 0.28b
1.51 ± 0.36b
1.27 ± 0.42b
4.78 ± 0.19a
1.30 ± 0.12b
1.76 ± 0.15b
1.77 ± 0.25b
TSS/Acidity
9.24 ± 0.63d
11.75 ± 0.44 cd
53.43 ± 0.82a
15.40 ± 0.81c
51.42 ± 0.99a
43.10 ± 0.75b
43.13 ± 0.79b
Lovibond Color properties
Blue
1.36 ± 0.04c
5.88 ± 1.12b
5.57 ± 1.06b
8.89 ± 0.09a
5.59 ± 0.23b
5.54 ± 0.78b
0.94 ± 1.67 cd
Red
6.42 ± 0.03c
8.27 ± 0.89bc
9.96 ± 0.26ab
11.82 ± 0.09a
9.74 ± 0.45ab
10.18 ± 0.29ab
5.38 ± 1.02 cd
Yellow
21.46 ± 0.07b
34.12 ± 0.34a
21.78 ± 1.23b
34.01 ± 1.16a
23.01 ± 1.11b
23.94 ± 0.78b
12.63 ± 0.94c
Nutritional properties
Crude fiber (% w/w) **
11.59 ± 0.92bc
10.37 ± 1.06c
12.63 ± 0.49b
13.40 ± 1.21b
12.74 ± 0.56b
13.25 ± 0.08b
15.03 ± 0.67a
Total sugar (%w/w) **
41.65 ± 0.85c
22.53 ± 0.05d
71.91 ± 1.06b
78.83 ± 1.12b
71.73 ± 0.08b
80.00 ± 1.43a
82.21 ± 1.21a
Fructose (%of total sugar w/w) **
23.19 ± 0.19b
22.06 ± 1.06b
29.11 ± 0.07a
27.23 ± 0.66a
31.21 ± 1.23a
21.98 ± 1.41b
21.04 ± 0.57b
Glucose (%of total sugar w/w) **
20.62 ± 0.11b
19.45 ± 0.89b
23.12 ± 0.65a
23.01 ± 0.08a
24.26 ± 1.21a
18.82 ± 1.11b
19.00 ± 0.62b
Sucrose (%of total sugar w/w) **
52.83 ± 0.16a
55.23 ± 1.23a
44.64 ± 0.12b
46.98 ± 0.09b
42.53 ± 1.65b
57.33 ± 1.11a
58.12 ± 0.78a
Maltose (%of total sugar w/w) **
3.36 ± 0.08a
3.26 ± 0.09a
3.13 ± 1.01a
2.78 ± 0,06a
2.00 ± 0.23b
1.87 ± 1.01b
1.84 ± 1.24b
Ascorbic acid (mg/100 g) *
40.17 ± 0.53a
17.14 ± 0.08c
15.88 ± 1.02c
15.19 ± 1.14c
16.89 ± 0.78c
29.78 ± 0.52b
27.12 ± 0.06b
β carotene (μg/g) *
64.78 ± 0.62a
38.34 ± 0.44d
47.88 ± 0.14c
51.08 ± 0.58bc
44.98 ± 0.08c
54.58 ± 0.35b
55.84 ± 0.12b
Total tannins (mg tannic acid/100 g) **
36.65 ± 0.21a
24.86 ± 1.12c
30.96 ± 1.06b
33.31 ± 0.78b
32.26 ± 0.09b
32.96 ± 0.46b
33.12 ± 0.92b
Total phenol content (mg gallic acid 100 g−1) *
32.44 ± 0.16b
5.02 ± 2.63e
9.48 ± 1.12d
9.32 ± 0.63d
10.56 ± 1.43d
21.32 ± 1.34c
165.44 ± 1.82a
Total flavonoids (mg quercetin g−1) *
1.22 ± 0.32b
0.59 ± 0.31d
0.80 ± 0.22c
0.78 ± 0.52c
0.72 ± 0.55c
0.92 ± 0.62c
43.29 ± 0.82a
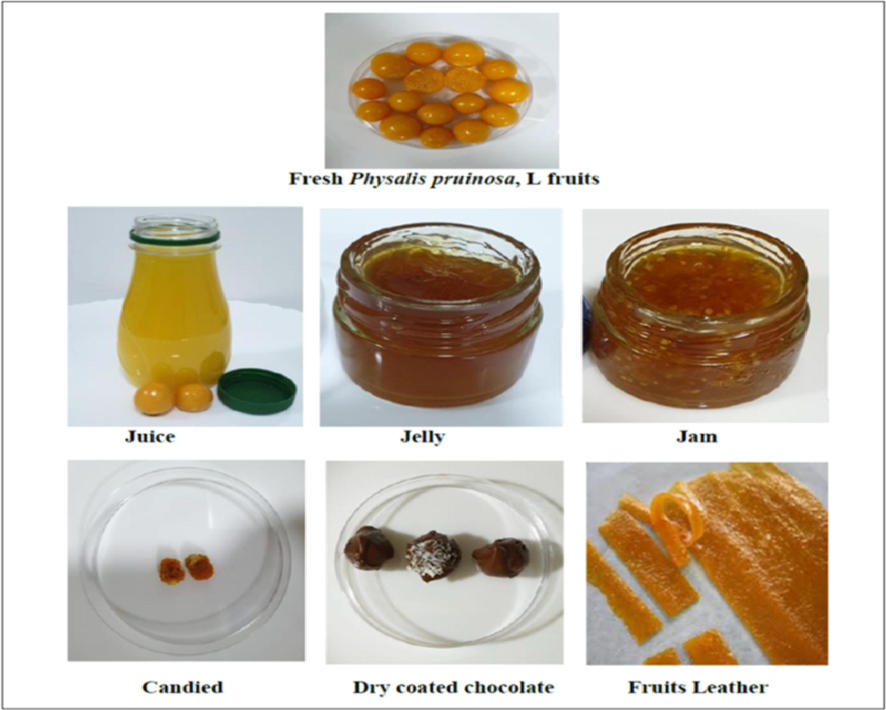
New P. pruinosa manufactured products. (Photos by E. A. Mahmoud).
3.7 The sensory evaluation profile of prepared P. Pruinosa foodstuff
The sensory evaluation profile of the prepared products is shown in Fig. 5. In general, the 25 panelists accepted all of the prepared products. Our data showed that the jelly had the highest overall acceptability score from the panelists. With regard to the general acceptability of the product, there is no significant differences among the prepared products, while the fruit leather product had the lowest value. In terms of general appearance and color, there were no significant differences (p ≤ 0.05) among fruit pulp (control sample), jelly, chocolate--coated dried fruits, candied fruits jam, and juice, while the fruit leather product received the lowest score. No significant difference in the odor and homogeneity values for the prepared products. The highest scores for odor were for the chocolate-coated dry fruit and jam products. However, the jelly and fruit leather showed the highest values for homogeneity. For taste attribute, the jelly, candied, jam, and chocolate--coated dried fruits were rated the highest. The candied fruit, jelly, chocolate-coated dry fruit, and, jam had the highest texture attribute values with non-significant differences. In previous research on P. peruviana fruit, several products had been produced, including compote, nectar, syrup, paste, jam and dehydrated fruits (Aamer, 2018), and there was no significant difference in the general acceptability of the investigated products, while dehydrated fruits had lower value.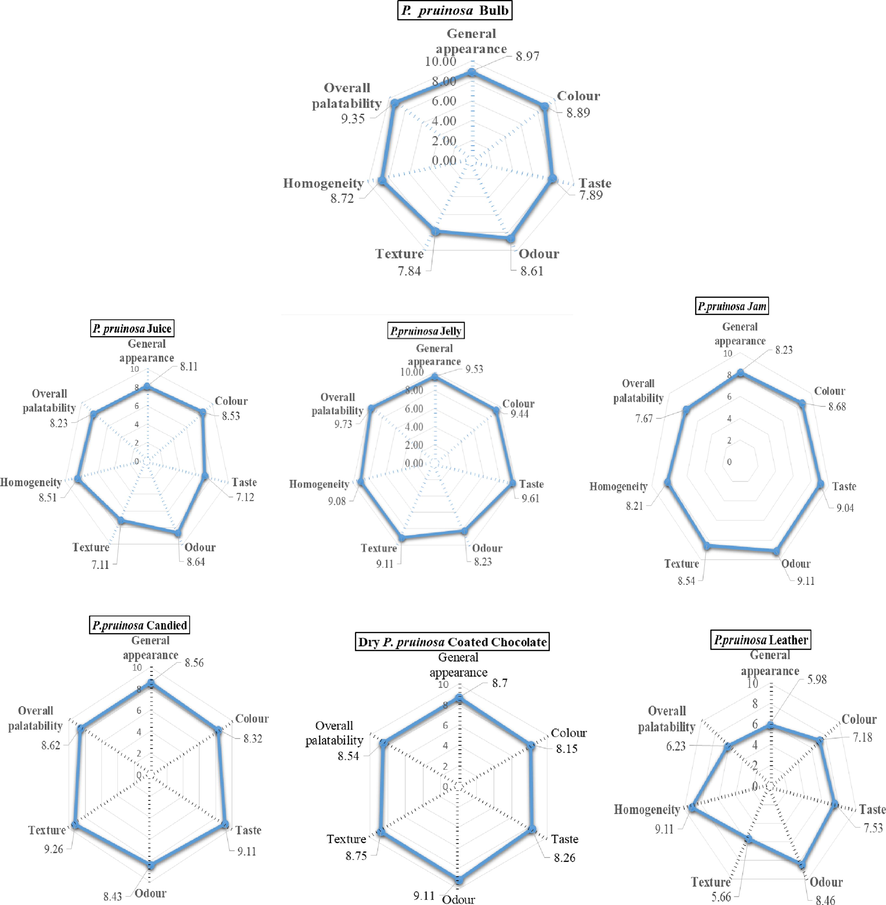
Sensory evaluation profile of prepared husk berry foodstuff; Values = the mean ± standard deviation, n = 20. Means in a column that are not followed by the same letter are significantly different (p ≤ 0. 5).
4 Conclusions
The current investigation sheds light mostly on the fruit of the P. pruinosa, which is already widely consumed fresh in most countries worldwide. There is strong evidence on the possibilities of developing six functional food products, such as jam, candied fruit, chocolate-coated dry fruit, juice, jelly, and fruit leather. P. pruinosa receive great attention for its good nutritional quality. The fruit contained high ratios of protein, total sugar, crude fiber, phenols, anthocyanin, flavonoids, and chlorophylls. High antioxidant activities were detected by the DPPH and ABTS assays. The major amino acids in the fruit pulp were glutamic acid, aspartic acid, arginine, phenylalanine, and alanine. The major polyphenols detected were gallic, p-OH-benzoic, benzoic, catechol, ellagic, chlorogenic, and epicatechin. Some flavonoids were available at high concentrations, such as naringenin, luteolin, and rutin. The fruit contained several minerals, including potassium, phosphorus, sodium, and magnesium. The physicochemical, color, and nutritional properties of the fruit and prepared products were determined. The highest crude fiber, ascorbic acid, β carotene, tannins, polyphenol, flavonoids, and total sugar contents were found in chocolate-coated dry fruit compared with other products. The sensory evaluation profile of the prepared products showed that all products were extremely acceptable based on its sensory attributes (general appearance, color, odor, texture, taste, homogeneity and overall palatability. Our findings suggest that, P. pruinosa fruit could be strong candidate for the processing of new functional foods and beverages for food industries. Future studies should be conducted on the antimicrobial activities, bioactive compounds, and texture properties of development functional products from P. pruinosa fruit in order to prolong the storage period.
Acknowledgement
This research was funded by the Deanship of Scientific Research at Princess Nourah bint Abdulrahman University through the Fast-track Research Funding Program to support publication in the top journal (Grant no. 42-FTTJ-50).
Declaration of Competing Interest
The authors declare that they have no known competing financial interests or personal relationships that could have appeared to influence the work reported in this paper.
References
- Evaluation of new non-traditional products processed from cape gooseberry (Physalis peruviana L.). Egyptian. J. Agri. Res.. 2018;96(4):1493-1511.
- [Google Scholar]
- Physicochemical and technological studies on husk tomato (Physalis pruinose L.) Alexandria Sci. Exchange J.. 2013;34:204-221.
- [Google Scholar]
- A.O.A.C., 2005. The Official methods of analytical, G.D.C. (Ed.), Horwitz, William, and George W. Latimer. Official methods of analysis of AOAC International. Gaithersburg, Md: AOAC International. https://www.worldcat.org/title/official-methods-of-analysis-of-aoac-international/oclc/62751475
- .O.A.C., 2012. Official method 969.33. Fatty acids in oils and fats. Preparation of methyl esters. Boron trifluoride method. In AOAC Official Methods of Analysis, 19th ed.; AOAC International: Gaithersburg, MD, USA. http://tera.chem.ut.ee/∼ivo/Chrom /GC/ AOAC_Me_BF3.pdf.
- Carranco,N ., Farrés-Cebrián,M., Saurina, J. , Núñez,O , 2018. Authentication and quantitation of fraud in extra virgin olive oils based on HPLC-UV fingerprinting and multivariate calibration. Foods, 7, 44; https://doi.org/ 10.3390/foods7040044
- Phenolic profiles and antioxidant properties of Physalis angulata L. as quality indicators. J. Pharm. Pharmacognosy Res.. 2017;5:114-128.
- [Google Scholar]
- DRIs (DIETARY REFERENCE INTAKES), 2004. Dietary Reference Intakesof Nutrients-Based Reference Values. These are Established by Nutrition Board of National Academy of Sciences, NationalAcademy Press, Wash-ington, DC. http://www.nap.edu.
- Chemical composition and biological activity of Physalis peruviana L. Gesunde Pflanzen. 2019;71(2):1-10.
- [CrossRef] [Google Scholar]
- Physico-chemical properties and biochemical composation of physalis (Physalis Pubescens L.) fruits. Food. 2008;2(2):124-130.
- [Google Scholar]
- Horwitz, W., 1982. Pearson’s Chemical Analysis of Foods, 8th Edition. Journal of Association of Official Analytical Chemists, 65(4), 1037-1037. https://doi.org/10.1093/jaoac/65.4.1037
- Handbook of Sensory Methods and Analysis. Rejoint Communication Services Ltd Uwani Enugu.; 2002. p. :40-83.
- İzli, G., İzli, N., Unal, H., Uylaser, V., 2014. Physical and chemical characteristics of goldenberry fruit (Physalis peruviana L.). Journal of Food Science and Technology, 52. https://doi.org/ 10.1007/s13197-014-1280-3
- Effect of dehydration temperature on physico chemical properties and antioxidant capacity of goldenberry (Physalis peruviana L.). Chilean. J. Agri. Res.. 2013;73(3):293-300.
- [CrossRef] [Google Scholar]
- Joint F.A.O./W.H.O. expert committee on nutrition, 1970. Eighth report, food fortification, protein-calorie malnutrition, Geneva, Switzerland, 9–18 November 1970. 1971, World Health Organization: Geneva. https://apps.who.int/iris/handle/10665/40921
- Kramer, A., and Twigg, B.A., 1971. Quality control for the food industry, Vol. 1 Fundamentals, 3rd ed., AVI Publishing Company, Inc.: Westport, CT, 1970. 19 Kapitel mit 556 Seiten, Starch- Stärke, 23(5), 190-190. https://doi.org/10.1002/star.19710230511
- Lacey, K., McCarthy, A., Foord, G., 2001. Maturity testing of citrus. Department of Agriculture, Western Australia. Available online: http://www.agric.wa.gov.au/ agency/pubns/farmnote/2000/f0300.htm. Farmnote
- Lucas, B., Sotel, A., 1980. Effect of different alkalis, temperature, and hydrolysis on food. Analytical Biochemistry, 109, 193-197. https://doi.org/ 10.1016/0003-2697(80)90028-7
- Mannion, D.T.; Furey, A.; Kilcawley, K.N., 2018. Development and validation of a novel free fatty acid butyl ester gas chromatography method for the determination of free fatty acids in dairy products. Journal of Agriculture and Food Chemistry, 67, 499-506. https://doi.org/ 10.1021/acs.jafc.8b05462
- Quantitative Analysis of Total Phenolic Content in Adhatoda vasica Nees Extracts. Int. J. Pharmtech Res. 2009;2
- [Google Scholar]
- Phytochemical composition and biological activity of Physalis spp.: A mini-review. Food Science and Applied. Biotechnology. 2020;3(1):56-70.
- [Google Scholar]
- Medina-Medrano, J.R., Almaraz-Abarca, N., González-Elizondo, M.S., Uribe-Soto, J.N., González-Valdez, L.S., Herrera-Arrieta, Y., 2015. Phenolic constituents and antioxidant properties of five wild species of Physalis (Solanaceae). Botanical studies, 56(1), 24-24. https://doi.org/ 10.1186/s40529-015-0101-y
- Mier-Giraldo, H., Díaz-Barrera, L.E., Delgado-Murcia, L.G., Valero-Valdivieso, M.F., Cáez-Ramírez, G., 2017. Cytotoxic and Immunomodulatory Potential Activity of Physalis peruviana Fruit Extracts on Cervical Cancer (HeLa) and Fibroblast (L929) Cells. Journal of Evidence-Based Complementary & Alternative Medicine, 22(4), 777-787. https://doi.org/ 10.1177/2156587217718751
- Chromatographic determination of amino acids by the use of automatic recording equipment. Meth. Enzymol. Academic Press. 1963;819–831
- [CrossRef] [Google Scholar]
- Comparative assessment of two extraction procedures for determination of bioactive compounds in some berries used for daily food consumption. Int. J. Food Sci. Technol.. 2014;49
- [CrossRef] [Google Scholar]
- Characteristics of antioxidant activity and composition of pumpkin seed oils in 12 cultivars. Food Chem.. 2013;139:155-161.
- [CrossRef] [Google Scholar]
- Rheological, chemical and physical characteristics of golden berry (Physalis peruviana L.) after Convective and Microwave Drying. Foods. 2017;6:60.
- [CrossRef] [Google Scholar]
- Niranjan, J, Barthwal, Lehri, A., Singh, D.P., Govindrajan, R., Rawat, A.K.S., Amla, D.V., 2009. Development and validation of an HPLC–UV–MS–MS method for identification and quantification of polyphenols in Artemisia pallens L. Acta Chromatographica 21(1), 105–116. https://doi.org/ 10.1556/AChrom.21.2009.1.9
- Reducing the smelly compounds (caproic, caprylic and capric acids) in noni by treating the juice with activated charcoal powder. In: Proceeding of the National Food Technology Seminar. 2004. p. :125-129.
- [Google Scholar]
- Antioxidant activity of extracts from Acanthopanax senticosus. Afr. J. Biotechnol.. 2010;5(23):2388-2396.
- [CrossRef] [Google Scholar]
- Fruit characteristics of table fig (Ficus carica) cultivars in subtropical climate conditions of the Mediterranean region. N. Z. J. Crop Hortic. Sci.. 2008;36:107-115.
- [CrossRef] [Google Scholar]
- Impact of enzymatic treatment on chemical composition, physicochemical properties and radical scavenging activity of goldenberry (Physalis peruviana L.) Juice. J. Sci. Food Agric.. 2007;87(3):452-460.
- [Google Scholar]
- Oil goldenberry (Physalis peruviana L.) J. Agric. Food. Chem.. 2003;51(4):969-974.
- [CrossRef] [Google Scholar]
- Solvent and enzyme-aided aqueous extraction of goldenberry (Physalis peruviana L.) pomace oil: impact of processing on composition and quality of oil and meal. Eur. Food Res. Technol.. 2008;226(6):1445-1458.
- [CrossRef] [Google Scholar]
- Ranganna, S., 1977. Manual of analysis of fruit and vegetable products. https://agris.fao.org/agris-search/search.do?recordID=US201300540990
- Antioxidant activity applying an improved ABTS radical cation decolorization assay. Free Radical Biol. Med.. 1999;26(9):1231-1237.
- [CrossRef] [Google Scholar]
- A comparative study on quantitative estimation of tannins in Terminalia chebula, Terminalia belerica, Terminalia arjuna and Saraca indica using spectrophotometer. Asian J. Pharm. Clin. Res.. 2013;6:242.
- [Google Scholar]
- Rheological behavior and physicochemical characteristics of goldenberry (Physalis peruviana) juice as affected by enzymatic treatment. J. Food Process. Preserv.. 2010;35:201-219.
- [CrossRef] [Google Scholar]
- Variation in growth, production and quality attributes of Physalis species under temperate ecosystem. Fruits. 2014;69:31-40.
- [CrossRef] [Google Scholar]
- Physalis pruinosa L. (Solanaceae): A new record to the flora of Maharashtra, India. Lifesciences Leaflets. 2014;58
- [Google Scholar]
- Stanciu, G., Lupşor, S., Savab, C., and Zăgan, S., 2010. Spectrophotometric study on stability of anthocyanins extracts from black grapes skins. Ovidius University Annals of Chemistry, 21(1), https://doi.org/ 101-104. 10.1.1.204.1556
- A microcolorimetric method for the determination of inorganic phosphorus. J. Biol. Chem.. 1953;202(2):675-685.
- [CrossRef] [Google Scholar]
- Physical and chemical characteristics of goldenberry (Physalis peruviana) grown in Lam Dong province. Vietnam. Food Res.. 2020;4(4):1217-1225.
- [Google Scholar]
- Vertuani S, Scalambra E, Vittorio T, Bino A, Malisardi G, Baldisserotto A, Manfredini S. 2014. Evaluation of antiradical activity of different cocoa and chocolate products: relation with lipid and protein composition. Journal Of Medicinal Food, 17 (4): 512-516. https://doi.org/ 10.1089/jmf.2013.0110
- WHO/ FAO/UNU’s, 2007. World Health Organization/Food and Agriculture Organization/United Nations University. Protein and Amino Acid Requirements in Human Nutrition Report of a Joint WHO/FAO/UNU Expert Consultation. WHO Technical Report Series no. 935. Geneva: WHO
- Determination of flavonoids in Citrus grandis (Pomelo) peels and their inhibition activity on lipid peroxidation in fish tissue. Int. Food Res. J.. 2013;20:313-317.
- [Google Scholar]
- Zhang,J., Ritenour,M.A., 2016. Sugar Composition Analysis of Commercial Citrus Juice Products. Proc. Fla. State Hort. Soc. 129,178–180. file:///C:/Users/drema/Downloads/106057-Article%20Text-139989-1-10-20180405%20(1).pdf


