

Translate this page into:
Identification of novel HDAC8 selective inhibitors through ligand and structure based studies: Exploiting the acetate release channel differences among class I isoforms
⁎Corresponding authors. vemaaparna@uohyd.ac.in (Aparna Vema), bcsdebnath@gmail.com (Sudhan Debnath), arunasreemk@uohyd.ac.in (Arunasree M. Kalle)
-
Received: ,
Accepted: ,
This article was originally published by Elsevier and was migrated to Scientific Scholar after the change of Publisher.
Abstract
Histone deacetylases (HDACs) are key regulators of gene expression and have emerged as crucial therapeutic targets for cancer. Among the HDACs, inhibition of HDAC8 enzyme has been reported to be a novel strategy in the treatment of female-specific cancers. Most of the HDAC inhibitors discovered so far inhibit multiple HDAC isoforms causing toxicities in the clinic thus limiting their potential. Therefore, the discovery of isoform-selective HDAC8 inhibitors is highly desirable. In the present study, a combination of ligand and structure based drug design tools were utilized to build a statistically significant pharmacophore based 3D QSAR model with statistical parameters R2: 0.9964, and Q2: 0.7154, from a series of 31 known HDAC8 inhibitors. Top 1000 hits obtained from Virtual screening of Phase database were subjected to docking studies against HDAC8. Top 100 hits obtained were redocked into HDAC Class I (HDAC 1,2,3) and Class II isoforms (HDAC 4, 6) and rescored with XP Glide Score. Based on fitness score, XP glide score and interacting amino acid residues, five HDAC8 inhibitors (1–5) were selected for in vitro studies. The HDAC8 activity assay followed by enzyme kinetics clearly indicated Compounds 1, 2 and 3 to be potent HDAC8 selective inhibitors with IC50 of 126 pM, 112 nM, and 442 nM respectively. These compounds were cytotoxic to HeLa cells where HDAC8 is overexpressed but not to normal cells, HEK293. Also, they were able to induce apoptosis by modulating Bax/Bcl2, cleavage of PARP and release of Cytochrome C. Molecular Dynamics simulations observed most favorable interaction patterns and presented a rationale for the activities of the identified compounds. Selectivity against HDAC8 was due to exploitation of the architectural difference in the acetate release channel among class I HDAC isoforms.
Keywords
Selective HDAC8 inhibitors
Pharmacophore
Phase 3D QSAR
Virtual screening
In vitro studies
Molecular dynamics

- HDAC
-
Histone Deacetylase
- HDACi
-
HDAC inhibitors
- ZBG
-
Zinc Binding Group
- VS
-
Virtual Screening
- IC50
-
half maximal Inhibitory Concentration
- HEK293
-
Human Embriyonic Kidney 293 cells
- HeLa
-
Human Cervical cancer cells
- 3D QSAR
-
Three-Dimensional Structure Activity Relationship Studies
- PDB
-
Protein Data Bank
- TSA
-
Trichostatin A
- PLS
-
Partial Least Squares
- RESP
-
Restrained Electrostatic Potential
Abbreviations
1 Introduction
The reversible acetylation and deacetylation of ε-amino groups of lysine residues on histones and non-histone proteins is regulated by histone acetyl transferases (HATs) and histone deacetylases (HDACs) (Yang and Seto, 2007). HDACs play a crucial role in biological process and diseases and thus emerged as an attractive drug target for cancer chemotherapy. Till date five HDAC inhibitors (HDACi): Vorinostat, Romidepsin, Panobinostat, Belinostat, and Pracinostat, have been approved by FDA for treating cancer either as mono therapy or in combination with other anti-tumor drugs in cutaneous T-cell lymphoma and other malignancies (Fig. 1) (Ho et al., 2020). As on date, more than 100 clinical trials are in progress testing HDAC inhibitors on both hematological and solid malignancies. Several of the HDACi failed in clinical trials as they exhibited severe toxicities due to the overlapping functions of 18 known HDACs classified into IV classes, implicating the need to develop isoform-specific and class-selective HDACi (McClure et al., 2018).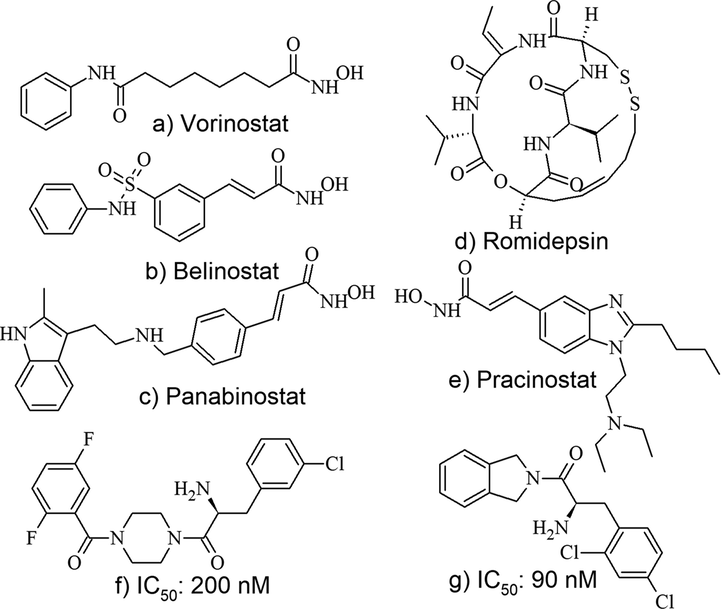
FDA approved HDAC inhibitors (a-e) and Alpha amino Ketone HDAC8 Selective Inhibitors (f,g) from Literature.
HDAC8 is a class I HDAC and is overexpressed in several cancers, specifically in female-specific cancers (Ediriweera et al., 2019; Liu et al., 2019). HDAC8 has been linked to some unique non-histone proteins like cohesion (Deardorff et al., 2012), estrogen receptor α (ERRα) (Wilson et al., 2010), or cortical actin-binding protein (cortactin) (Olson et al., 2014), all of which are implicated in tumorigenesis and metastasis in breast and ovarian cancer. Therefore, identifying HDAC8-selective inhibitors for the treatment of female-specific cancers is relatively achievable, although challenging due to the high structural similarity between the members of different class of HDACs.
Most of the HDAC inhibitors consist of zinc binding group (ZBG), a linker, and a surface recognition cap group (Ho et al., 2020). The hydroxamic acid group is the most common ZBG moiety among HDACs inhibitors owing to its ability to chelate active site zinc ion. Hydroxamic acid, although being the most efficient ZBG known in both natural and non-natural HDAC inhibitors, has several limitations such as unfavorable pharmacokinetic properties due to rapid clearance and severe toxicity due to nonspecific metal binding. To overcome these, several non-hydroxamic acid-based HDAC inhibitors have been designed and developed (Chakrabarti et al., 2015; Upadhyay et al., 2020; Banerjee et al., 2019).
Herein, we report a ligand- and structure-based virtual screening (VS) approach to identify novel non-hydroxamic HDAC8 selective inhibitors. Initially, a pharmacophore model was generated using known selective HDAC8 inhibitors followed by a 3D QSAR model, which is further validated to ensure the predictive capability of the model. This model was used for virtual screening of Phase database containing 4.3 million compounds. Docking studies were carried out for the hits obtained against HDAC8. Top 100 hits obtained were docked against other Class I and Class II HDAC isoforms. Top 5 hits were purchased and subjected to enzymatic assays that paved a way to the discovery of novel potential HDAC8 selective inhibitors that showed moderate selectivity to HDAC8 and induced apoptosis of HeLA cells with no cytotoxicity on normal HEK293 cells. Three Compounds were shortlisted having strong binding affinity towards HDAC8. The potential binding modes and the rationale for their isoform selectivity of these shortlisted compounds were further explored through molecular dynamics simulations.
2 Materials and methods
2.1 Pharmacophore and 3D QSAR model building
A set of 31 HDAC8 inhibitors (Fig. 2) with their corresponding half maximal inhibitory concentration (IC50) values was retrieved from the literature (Table 1) (Balasubramanian et al., 2008; Cao et al., 2016; Galletti et al., 2009; Hu et al., 2003; KrennHrubec et al., 2007; Kulandaivelu et al., 2014; Marek et al., 2013; Olson et al., 2013; Suzuki et al., 2014, 2012; Tang et al., 2014, 2011; Whitehead et al., 2011). The structures were built and optimised using LigPrep module (Schrödinger, LLC). Low energy conformers were generated and used for Pharmacophore and 3D-QSAR models using PHASE module (Schrödinger, LLC) (Dixon et al., 2006). An initial analysis showed that three chemical features - hydrogen-bond acceptor (A), hydrogen bond donor (D), and aromatic ring (R) could effectively map all molecules in the data set. These features were selected and used to build a series of hypothesis. Pharmacophore model was developed based on common pharmacophore features for all compounds, and the scores were calculated for both actives and inactives. The alignment was measured using survival score and the best hypothesis AADRR.2 was selected based on survival score and survival minus inactive score (Table S1). For 3D QSAR model building, AADRR.2 was selected. The grid spacing was maintained at 1 Å, maximum number of PLS factors was set to 4 and the training:test ratio at 70:30. The overall significance of the obtained model was evaluated for statistical parameters r2 and SD values (Table 2).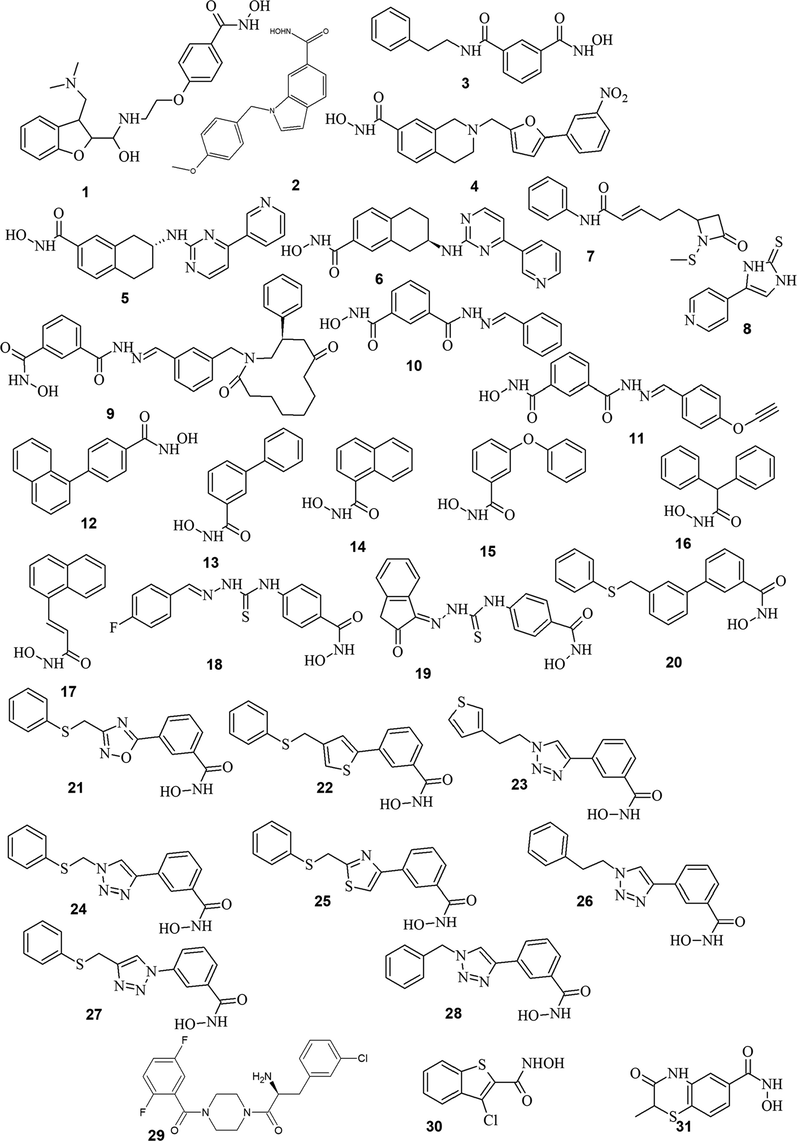
Training set molecules used to develop Pharmacophore based 3D-QSAR.
Compound
No.IC50 Values (μM)
QSAR set
Observed Activity pIC50
Predicted Activity pIC50
Fitness score
Refs
1
0.19
Training
6.721
6.79
1.47
(Cao et al., 2016)
2
0.01
Training
8
7.99
1.68
(Balasubramanian et al., 2008)
3
0.12
Training
6.921
6.96
1.64
(Olson et al., 2013)
4
0.03
Training
7.523
7.38
1.08
(Tang et al., 2014)
5
0.08
Training
7.097
7.08
1.47
6
0.39
Training
6.409
6.47
1.47
7
4.53
Training
5.344
5.34
1.29
(Galletti et al., 2009)
8
0.50
Training
6.301
6.38
0.71
(Hu et al., 2003)
9
0.023
Training
7.638
7.71
3
(Tang et al., 2011)
10
0.052
Test
7.284
7.17
2.39
11
0.029
Training
7.538
7.55
2.38
12
0.3
Test
6.523
6.36
1.68
(KrennHrubec et al., 2007)
13
20.0
Training
4.699
4.8
1.51
14
14.0
Training
4.854
4.93
1.72
15
6.6
Test
5.18
5.65
1.74
16
66.0
Training
4.18
4.12
1.34
17
0.7
Training
6.155
6.01
1.48
18
19.7
Training
4.706
4.69
1.85
(Kulandaivelu et al., 2014)
19
15.7
Training
4.804
4.78
1.49
20
1.4
Training
5.854
5.77
1.66
(Suzuki et al., 2014)
21
0.053
Training
7.276
7.25
1.48
22
0.15
Test
6.824
6.47
1.48
23
0.12
Training
6.921
6.94
1.48
24
0.22
Training
6.658
6.63
1.67
25
0.10
Test
7
6.65
1.67
26
0.35
Training
6.456
6.48
1.67
(Suzuki et al., 2012)
27
0.070
Test
7.155
6.58
1.67
28
0.18
Training
6.745
6.71
1.66
29
0.2
Test
6.699
6.34
1.26
(Whitehead et al., 2011)
30
3.1
Test
5.509
5.93
1.51
(Marek et al., 2013)
31
0.97
Test
6.013
6.46
1.7
ID
Factors
SD
r2
F
P
Stability
RMSE
q2
Pearson-R
AADRR.2
1
0.540
0.772
67.8
7.47E−808
0.109
0.466
0.598
0.942
2
0.206
0.968
290.4
5.71E−15
0.031
0.397
0.707
0.888
3
0.153
0.983
359.5
3.03E−16
0.094
0.398
0.706
0.913
4
0.073
0.996
1171.2
1.66E−20
0.014
0.392
0.715
0.906
2.2 Virtual screening using pharmacophore and docking studies
The PHASE module of Schrödinger 9.6 was used for virtual screening of a Phase Database containing ∼ 4.3 × 10⁶ previously prepared molecules that includes commercially available compounds obtained from different vendors. Initially, the database was filtered to remove duplicate molecules, molecular weight < 500 (to increase the chances of drug likeness and create provision for further tweaking the molecule), and molecules with highly undesirable properties. The resulting database was used to perform pharmacophore-based virtual screening (VS), as primary screen, and hits are scored using statistically significant 3D QSAR model as depicted in the flowchart (Fig. 3). As a secondary screen, molecular docking studies were performed using the Glide (Schrödinger, LLC) (Halgren et al., 2004). Docking was performed on X-ray structure of HDAC8 (PDB ID: 1T64) (Somoza et al., 2004). All the hits obtained from primary screen are initially docked using High Throughput Virtual Screening (HTVS) docking protocol. Top 100 Hits obtained are docked using Standard Precision (SP) protocol and the resultant hits were redocked/rescored using computationally more intensive Extra Precision (XP) (Friesner et al., 2006) protocol. Additionally, these hits are docked into HDAC1(PDB ID: 4BKX) (Millard et al., 2013), HDAC2 (PDB ID: 3MAX) (Bressi et al., 2010), HDAC3 (PDB ID: 4A69) (Watson et al., 2012), HDAC4 (PDB ID: 2VQM) (Bottomley et al., 2008) and HDAC6 (PDB ID:5WPB) (Harding et al., 2017) with Glide XP protocol. Details of Protein preparation, receptor grid generation and ligand docking are as described in our previous studies (Debnath et al., 2019).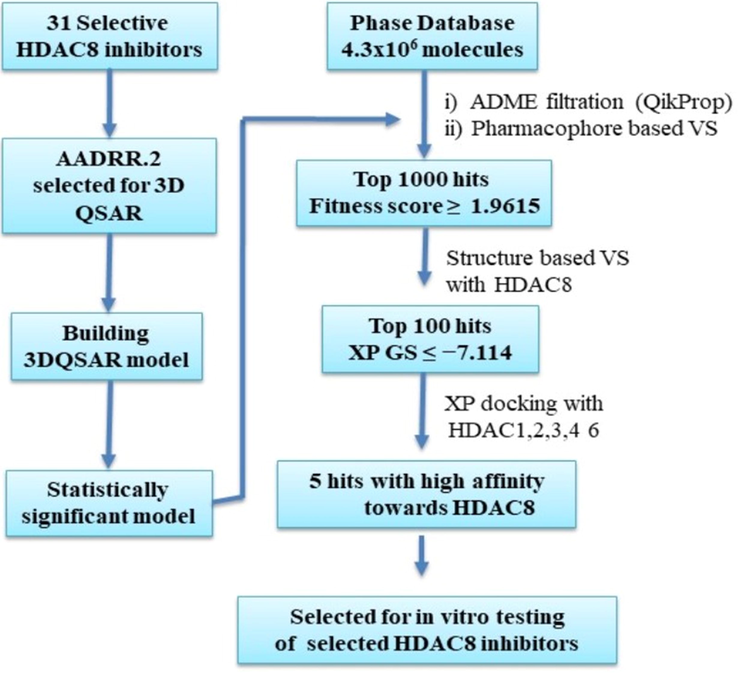
Flow diagram of combined ligand and structure based virtual screening protocol.
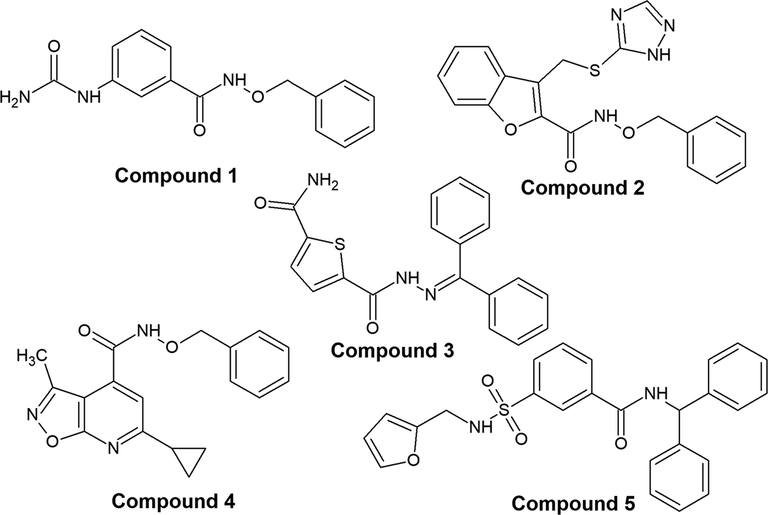
From the docking results, five most promising compounds viz., compound 1 (T6425387), compound 2 (T6142764), compound 3 (T6904657), compound 4 (T5765273), compound 5 (T6376568) were purchased from Enamine LLC, USA with purity 95% according to the manufacturer. The purchased compounds were verified through characterization of 1H and 13C NMR spectra using A Bruker Ascend 400 MHz spectrometer recorded at room temperature (400 MHz for 1H and 100 MHz for 13C) (see Supporting Information).
2.3 Enzymatic assays
HDAC8 activity was measured using recombinant human HDAC8 (GST-HDAC8) enzyme purified as described earlier (Pidugu et al., 2016) and FLUOR DE LYS® HDAC fluorometric activity assay kit (Enzo Life Sciences) as per manufacturer’s protocol. The fluorescence labeled acetylated lysine side chain substrate is incubated with the purified HDAC8 enzyme in presence or absence of the compounds (10 μM) for 30 min followed by measurement of fluorescence at 360 nm excitation and 460 nm emission wavelength on a plate reader. Trichostatin A (TSA), a known HDAC inhibitor was used as positive control. Enzyme kinetic study to determine the IC50 was performed for compounds 1–3 of the five compounds that showed better inhibition or equal inhibition compared to TSA at 10 nM.
For HDAC selectivity assay, various HDACs were immunoprecipitated using specific Protein-G-bound antibodies from HeLa cells. The bead bound HDACs were used as enzyme source and HDAC activity assay was carried out as described above in presence or absence of Compounds 1–3.
To determine the mode of inhibition (reversible or irreversible) recombinant human GST-HDAC8 enzyme was affinity bound to GST beads and was incubated with 0.01% DMSO, TSA, Compound 1 or compound 2 for 15 min in duplicates. After 15 min, one set was assayed for HDAC8 activity, and the other set of the enzyme-drug bound bead preparations were washed several times with assay buffer and then assayed for HDAC8 activity in the absence of drugs.
2.4 Cell based assays
2.4.1 Cell culture and analyses of cell viability
HEK293T (human embryonic kidney) and HeLa (Human Cervical cancer) cells were grown in DMEM medium supplemented with 10% heat inactivated fetal bovine serum (FBS), 100 IU/ml penicillin, 100 mg/ml streptomycin and 2 mM L-glutamine. Cultures were maintained in a humidified atmosphere with 5% CO2 at 37 °C. The cultured cells were sub-cultured twice each week, seeding at a density of about 2 × 10⁵ cells/ml. Cell viability was determined by the trypan blue dye exclusion method.
Cytotoxicity of the three compounds with HDAC8 inhibitory activity was determined by MTT assay. HEK293 and HeLa cells (5 × 10³ cells/well) were seeded to 96-well culture plate and cultured with or without Compound 1,2 and 3 at 8 different concentrations (viz., 0.000001, 0.00001, 0.0001, 0.001, 0.01, 1, 10 & 100 µM) for 24 h in a final volume of 200 µl. After treatment, the medium was removed and 20 µl of MTT (5 mg/ml in PBS) was added to the fresh medium. After 2 h incubation at 37 °C, 100 µl of DMSO was added to each well and plates were agitated for 1 min. Absorbance was read at 570 nm on a multi-well plate reader. Percent inhibition of proliferation was calculated as a fraction of control (without compound).
2.4.2 Apoptosis studies - immunoblot analysis
For immunoblot analysis, cells were lysed in a lysis buffer containing 20 mM Tris, 1 mM EDTA, 150 mM NaCl, 1% NP- 40, 0.5% sodium deoxycholate, 1 mM β-glycerophosphate, 1 mM sodium orthovanadate, 1 mM PMSF, 10 µg/ml leupeptin, 20 µg/ml aprotinin and phosphatase inhibitors with 100-fold dilution. After 30 min of shaking at 4 °C, the mixtures were centrifuged (10,000g) for 10 min, and the supernatants were used as the whole-cell extracts. The protein content was determined according to the Bradford method (Harding et al., 2017). Proteins (100 µg) were separated on 8–12% sodium dodecyl sulphate (SDS)-polyacrylamide gels along with protein molecular weight standards and electro transferred to nitrocellulose membrane. The membranes were blocked with 5% (w/v) non-fat dry milk after checking the transfer using 0.5% Ponceau S in 1% acetic acid and then probed with a relevant antibody (Bax, Bcl2, PARP at 1:1000 dilution) for 8–12 h at 4 °C followed by detection using peroxidase-conjugated secondary antibodies and chemiluminescence. Equal protein loading was detected by probing the membrane with GAPDH antibodies. Release of cytochrome c from mitochondria to cytosol was measured by Western blot as previously described (Arunasree, 2010).
2.5 Molecular docking and dynamics simulations
Molecular Dynamics simulations were carried out using GROMACS 2020.3 suite of programs (Abraham et al., 2015). X-ray structure of HDAC8 (PDB code: 3SFF) (Whitehead et al., 2011) was used for the simulations. Initial geometry of the ligands was obtained from geometry optimization at HF/6-31G* level using Gaussian09 software (Gaussian 09, 2009). Docking was carried out using AutoDock4 (Morris et al., 2009) with AutoDock4ZN force field (Santos-Martins et al., 2014) implemented within. The grid box of size 60 × 60 × 60 points centered at Zn ion with a spacing of 0.375 Å between the grid points was used. All the single bonds except the amide bonds were treated as active torsional bonds for the ligands in the study. 25 runs were generated using genetic algorithm search while keeping all other settings to default. Manual check was done to identify the best docking pose for each ligand to generate protein-ligand complexes.
Each complex generated from docking was placed in the center of a triclinic box with periodic boundary conditions, where the distance between the protein and the edge of the box is 1.0 nm. Explicit solvation was done with extended simple point charge (SPC/E) water model at standard density. Amber99sb-ildn force field was employed with modifications as described by Marina et al., to parameterize the zinc binding residues (Macchiagodena et al., 2020 , 2019) General AMBER force field 2 (gaff2) was applied to assign the parameters for ligands through antechamber. Partial charges for the docked conformation of ligands were derived from RESP. The protonation states of histidines were determined by Protein Prepare module in PlayMolecule server. A time step of 2 fs was used to integrate equations of motion. The protein-ligand complex obtained from docking was initially minimised at 0 K with a steepest descent and conjugate gradient for 5000 steps each. Then, each studied system was heated from 0 K to 300 K over 50 ps, with all the protein atoms restrained, followed by equilibration for 50 ps at 300 K in the NVT ensemble. Subsequently, equilibration was continued for 100 ps in NPT ensemble at 300 K under restrained conditions. Temperature was controlled using modified Berendsen thermostat and the pressure coupling done through Parrinello-Rahman method. SHAKE algorithm was applied to constrain the hydrogen atoms. Electrostatic interactions were treated using Particle Mesh Ewald method for long range electrostatics. Finally, unrestrained 10 ns production simulation was conducted for each system under NPT ensemble at 300 K and 1 atm pressure. Trajectory analysis was done using MDAnalysis (Michaud-Agrawal et al., 2011) and other tools in Gromacs.
3 Results and discussion
3.1 Pharmacophore and atom based 3D-QSAR studies
A set of 4 pharmacophore hypotheses were generated using a data set of 31 known HDAC8 inhibitors (Table S1). To limit the number of false positives and improve screening efficiency number of Pharmacophore features were restricted to five. Among the generated four pharmacophore hypotheses, AADRR.2 with highest survival score was selected. This model contains five features comprising two hydrogen bond acceptors (A1, A5); one hydrogen bond donor (D9) and two aromatic ring features (R12, R13) as shown in Fig. 4. Pharmacophore based 3D-QSAR model can be advantageous when the compounds are not from a congeneric series as in this case. Thus, a 3D-QSAR model was built from the best pharmacophore model generated above. The statistical parameters of pharmacophore based 3D QSAR model are summarized in Table 2. The model AADRR.2 with Partial Least Square (PLS) factor 4 has higher r2 value (0.99) and a standard deviation of 0.073. The efficiency of the model was measured by its predictive ability. The model proved to be efficient with a cross-validation correlation co-efficient (q2) value of 0.715 with moderate differences between observed and predicted activities of the test set molecules (Table 1). Scatter plots of observed and predicted activities for both the training and test set compounds are shown in Fig. 5.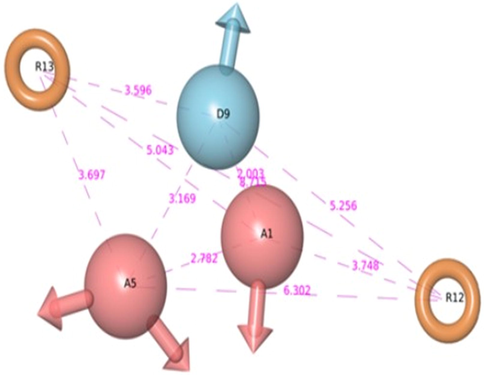
PHASE generated pharmacophore model AADRR.2 illustrating hydrogen bond donor (D9), hydrogen bond acceptor (A1, A5), and aromatic rings (R12, R13) with distances among features.
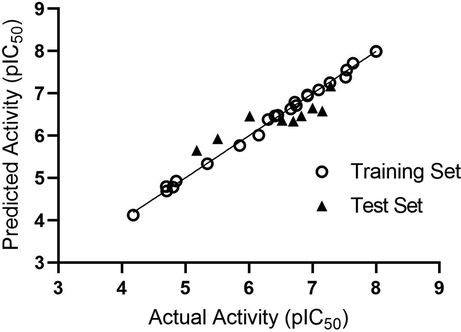
Scatter plot of actual and predicted pIC50 values of HDAC8 inhibitors of both Training and Test Sets.
3.2 Virtual screening
To identify novel HDAC8 inhibitors, a systematic virtual screening protocol was adopted as shown in Fig. 3. As a primary screen, the above selected AADRR.2 model was used to screen Phase Database. Among the hits obtained, the first 1000 hits based on fitness score were selected and used for our subsequent screening process. Docking against HDAC8 was used as a secondary screen with three different levels of docking and scoring protocols starting with HTVS followed by SP and finally with XP. Active sites of class I and II HDAC isoforms are highly conserved with minor differences. In order to screen HDAC8 selective compounds, top 100 hits based on XP Glide Score (XPGS) were redocked into other class I (HDAC 1, 2 and 3) and class II (HDAC 4 and 6) isoforms. Our focus was mainly on those hits that scored less in other HDAC isoforms. Based on manual inspection of the docking conformations and its XPGS on each HDAC isoform (Table 3), five compounds were identified and purchased for further studies (Fig. 6).
Comp ID
HDAC Class I
HDAC Class II
HDAC1
HDAC2
HDAC3
HDAC8
HDAC4
HDAC6
Compound 1
−6.1
−9.6
−5.2
−8.0
−6.8
−4.2
Compound 2
−5.4
−6.2
−5.4
−8.5
−6.8
−5.3
Compound 3
−3.1
−4.8
−5.0
−7.8
−5.3
−4.7
Compound 4
−5.3
−5.1
−5.3
−7.6
−4.0
−4.7
Compound 5
−5.6
−5.0
−6.3
−8.4
−4.9
−5.6
Hits obtained from Ligand and Structure based Virtual Screening Studies.
3.3 Enzyme based activity assay
All the five compounds procured were tested for their HDAC8 inhibitory activity at a concentration of 10 µM. Three of the five compounds (compound 1–3) showed inhibition more than TSA or at par with TSA at 10 nM concentration (Fig. 7a). Kinetic studies using different concentrations of these three compounds was carried out (Fig. S1). Compounds 1 and 2 showed a dose-dependent inhibition of HDAC8 activity with IC50 values in pico and nano molar range (Fig. 7 b-d). However, 3 did not show any dose dependent inhibition of HDAC8 activity. Next, the selectivity of compounds 1–3 in inhibiting HDAC8 was determined using immuno-precipitated class I HDACs (HDAC1, HDAC2, HDAC3) and class II HDACs (HDAC4, HDAC6) from HeLA cells as enzyme source and HDAC substrate from Enzo life sciences. The results indicated that both compounds 2 and 3 were moderately selective to HDAC8 over HDAC1 and compound 3 also inhibited HDAC2 and did not inhibit other class I or class II HDACs. (Table 4) However, compound 1 was more selective to HDAC8. Further, the mode of HDAC8 inhibition was determined to be partially reversible for Compound 1, completely reversible for Compound 2 similar to TSA and compound 3 showed irreversible mode of HDAC8 inhibition (Fig. 7e).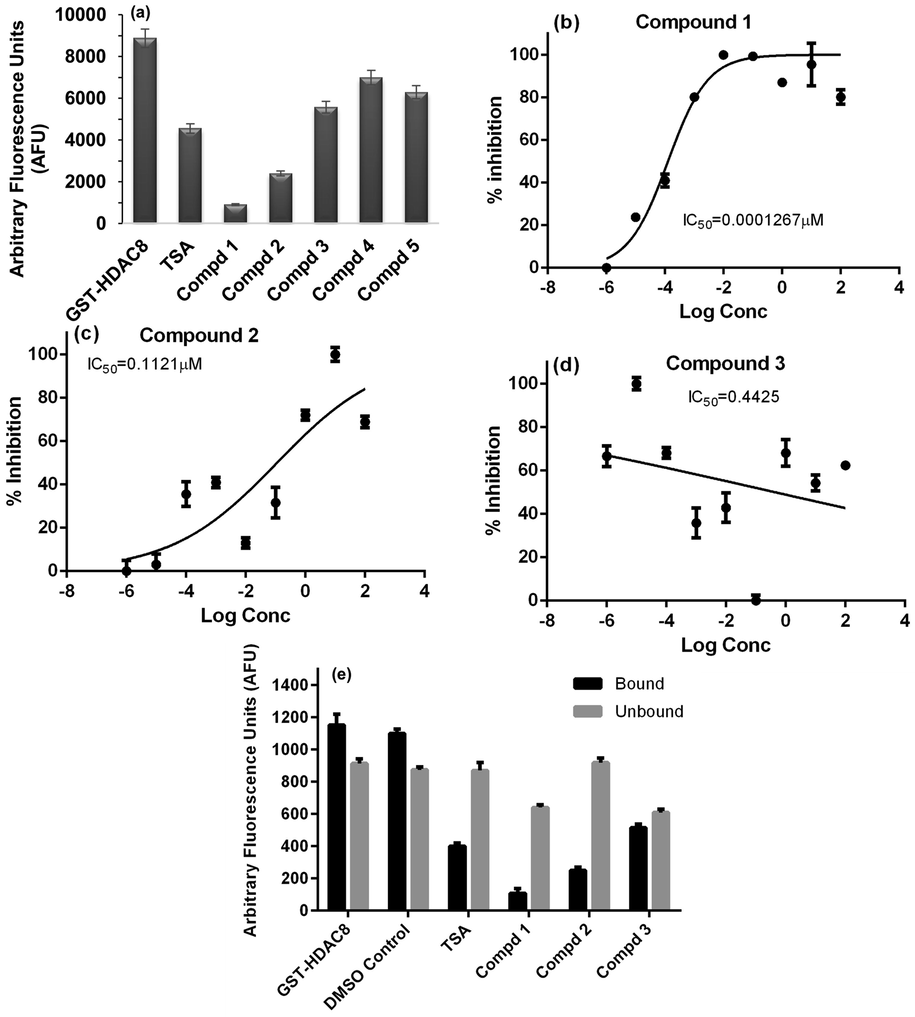
(a) Graph showing the HDAC8 activity in the absence and presence of test compounds (1–5), TSA (Trichostatin A) is the positive control (b) Dose response graphs of compounds (b) 1; (c) 2; and (d) 3 (e) Mode of Inhibition of HDAC8 activity.
IC50 concentration of HDAC Inhibition (µM)
S. No
HDAC1
HDAC2
HDAC3
HDAC8
HDAC4
HDAC6
Compound 1
>10
>10
>10
0.00001
>10
>10
Compound 2
5
>10
>10
0.0001
>10
>10
Compound 3
5
10
>10
0.5
>10
>10
3.4 Cell based anticancer studies
The MTT assay clearly showed that the compounds were cytotoxic to HeLa ovarian cancer cells, but not to normal HEK293T cells. The IC50 values were determined to be 8 nM for all the three compounds (1, 2 and 3). We analyzed the apoptotic cell death markers to evaluate the molecular mechanism of action of the compounds.
All the three compounds induced cleavage of PARP and cytochrome C release into the cytoplasm. Also induced expression of pro-apoptotic protein, Bax without significant change in anti-apoptotic protein Bcl2 expression (Fig. 8).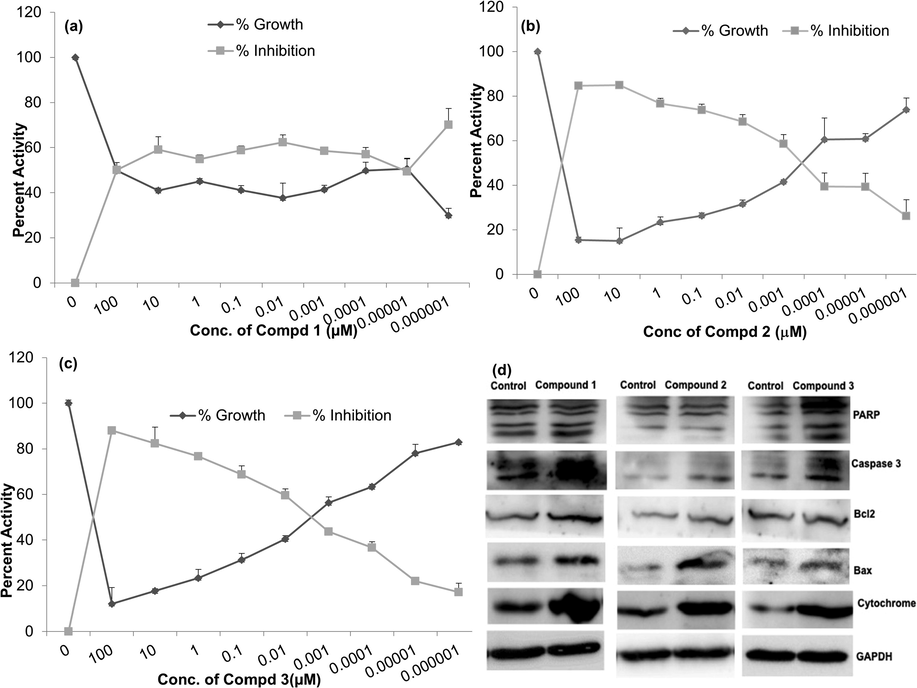
Effect on growth of HeLa cells in presence of: a) Compound 1, b) Compound 2, c) Compound 3, d) Immunoblot analysis of the apoptosis proteins in cells treated with the compounds 1 – 3.
3.5 Insights from molecular dynamics studies
To further explore the binding modes and sample the conformational space of the compounds that showed promising results in biological assays viz., compounds 1–3, molecular dynamic studies were carried out. X-ray structure of HDAC8 (PDB Code: 3SFF) was selected for docking, due to the similarity of the bound crystal ligand with the studied compounds. When compared to X-ray structure of full protein (PDB code:1T64) (Somoza et al., 2004), 3SFF (with partially missing loop2) was preferred as a good starting point wherein the indole side chain of W141 is in open conformation allowing the access to acetate release channel (Fig. S2). Cross docking into HDAC8 (3SFF) reconfirmed the hits and the complexes were further verified by the MD simulations. Further, the key interactions responsible for the differences in the binding affinity were identified.
3.5.1 Evaluating the stability of the protein-ligand complexes
The selected docking conformations of the compounds 1–3 in complex with HDAC8 were sampled by 10 ns MD simulations and the stability of the complexes was estimated by i) radius of gyration (Fig. 9) and ii) Root Mean Square Deviation (RMSD) analysis of the backbone atoms of HDAC8, heavy atoms of ligand and the backbone atoms of the active site residues (within 5 Å of ligand) of each complex (Fig. 10). In case of free protein, residues that are within 5 Å from HDAC8 −1 complex were considered as active site residues. It is observed that the average radius of gyration of HDAC8-1 complex is slightly lower than the free HDAC8 and its complex with 2 and 3, indicating binding of 1 effect the conformational space of the protein causing compaction slightly. Comparison of the RMSD plots clearly indicates that the binding of the ligand stabilizes the active site residues in all the complexes. This is predominantly seen because the active site comprised of only loop residues. Loop 5(F203 - L219) participates in the accommodation of inhibitor along with Loop 2. High Root Mean Square Fluctuations (RMSF) values in these regions for the free HDAC8 protein concurs with the fact that inhibitor binding brings order (Fig. 11).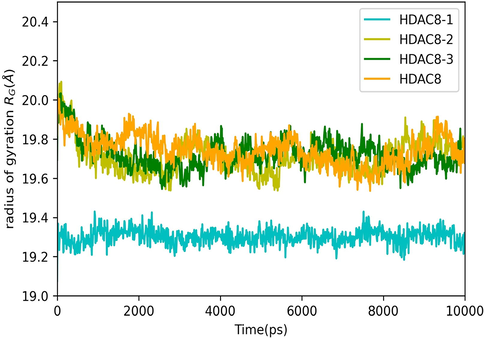
Radius of Gyration of HDAC8 and its complex with compounds 1–3.
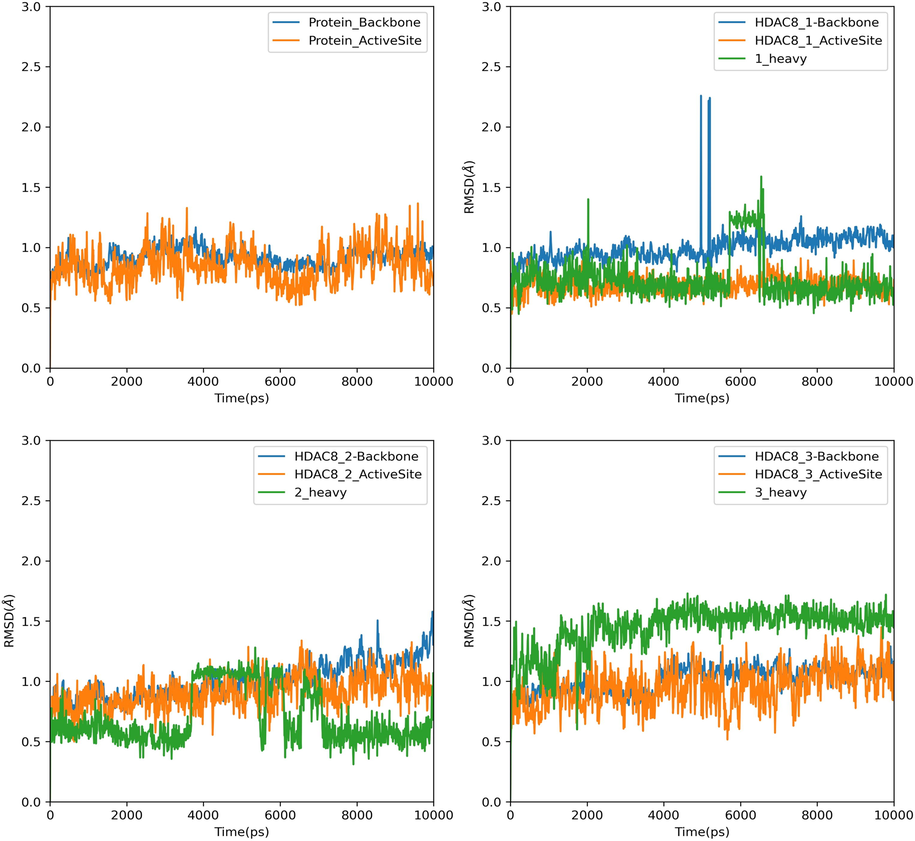
RMSD plots of Backbone atoms of HDAC8, back bone atoms of Active site residues and ligand heavy atoms of HDAC8 and its complex with compound 1–3.
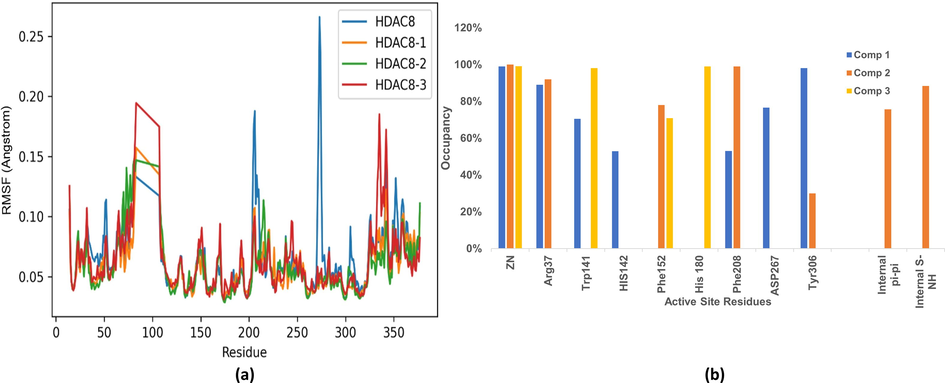
(a) RMSF of free HDAC8 and its complex with compounds 1–3, (b) Occupancy plots of Interactions between active site residues and compounds 1–3.
3.5.2 Interactions analysis of compound 1–3
Active site of HDAC isoforms can be recognized as four regions i) surface recognition site (Charrier et al., 2009); ii) Acetyl Lysine / Linker Binding channel (LB channel) (11 Å) (Vannini et al., 2004); iii) Zn chelation site and iv) Acetate Release channel (AR channel) or Foot pocket (14 Å) (Finnin et al., 1999). At the bottom of the LB channel is the 14 Å AR channel, extending from the Zn chelation site. AR channel facilitates the escape of the acetate, the by-product, of the deacetylation process (Wang et al., 2004). All the pan HDAC inhibitors have been designed to fit this LB channel through hydrophobic interactions with the amino acids lining the channel thereby supporting Zn chelation - the key recognition site (Micelli and Rastelli, 2015).
Docking and MD simulation studies showed that while compounds 1 and 2 interacts stably with all the four sites, 3 interacts with only three sites except surface recognition site. All the compounds 1–3 share a similar binding mode with alpha-amino ketone containing HDAC inhibitors (Fig. 1f and 1 g) (Whitehead et al., 2011). The carbonyl oxygen of amide moiety of Compounds 1–3 acts a Zn chelating group. In addition to this, the amide NH of 1 forms a hydrogen bond with His142. Both the linker O/N atom and the benzyl C-atom plays a key role in placing the benzyl group into the acetate release channel. The benzyl ring of Compounds 1–3 stacks with the indole ring of Trp141 (Fig. 12). In addition to this, the benzyl ring of 1 also stacks with Arg37. While 2 forms H-bonds with Tyr306, Phe 152 and π - π stacks with Phe 208, 3 forms π - π stacking interactions with His180, NH - π and CH - π stacking with Phe152. Although both 1 and 2 show similar binding modes, the presence of intramolecular π - π and NH-S bonds in 2 may reduce the number of thermally accessible conformers and decrease the conformational entropy of free ligand (Chan et al., 2021). Thus 1 upon binding to protein has minimal entropy loss compared to 2, with comparatively higher conformational entropy in free state. Thereby, exhibits higher IC50 value when compared to 2.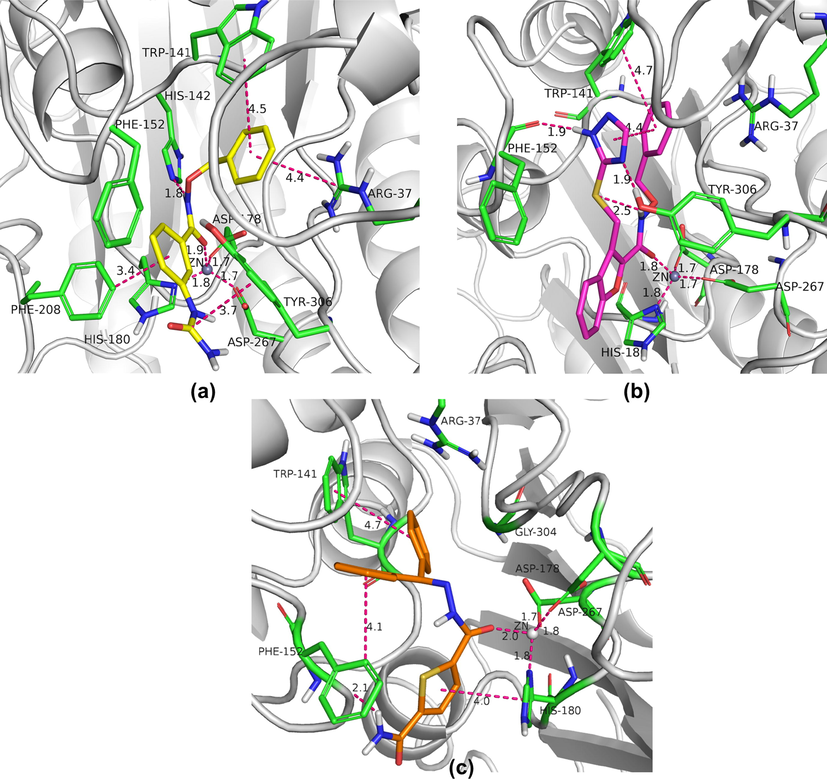
Key binding interactions within the active site of HDAC8 with, (a) Compound 1; (b) Compound 2; (c) Compound 3.
The ureido group of 1 stack with Tyr306 almost throughout the simulation. Additionally, the second phenyl ring of 1T-stacks with Phe208. Almost all the inhibitors in the series interacts with Phe208 hence fluctuations in this region viz., loop5 (203–219) are apparent in case of free protein, as evident with RMSF plots. An overlay of the average binding poses obtained from cluster analysis showed that the thiophene ring of 2 and second phenyl ring in 3 occupy same position (Fig. S3). A detailed analysis of the occupancy of all the binding interactions throughout the MD simulations explains the differences in the activity among 1, 2 and 3 (Fig. 11b).
3.6 Selectivity to HDAC8 isoform
Channels within the protein play crucial role not only in access and egress processes in the active site but also in the positioning of the substrates (Kreß et al., 2018). Interestingly, in case of HDACs exploitation of the AR channel showed isoform selectivity against HDAC1/2 and HDAC8 exclusively (Bressi et al., 2010; Whitehead et al., 2011). While the selectivity to HDAC8 is attributed to the π - π stacking interaction between the inhibitor and W141, selectivity to HDAC2 is ascribed to ligands accessing the AR channel itself. Computational tool CAVER (Stourac et al., 2019) was used to gain insights on the AR channel using crystal structures of HDAC1 (5ICN) (Watson et al., 2016), HDAC2 (3MAX) (Bressi et al., 2010), HDAC3(4A69) (Watson et al., 2012) and HDAC8 (3SFF). Possible channels that could be pathways for acetate release were identified (Fig. 13). The amino acids lining these channels are in agreement with alanine mutation studies (Wambua et al., 2014). CAVER analysis revealed the geometric differences in the AR channel among these HDAC1,2,3 and 8 isoforms. While the AR channel in HDAC1/2/3 is slightly tilted channel with uniform radius, in HDAC8 it takes a turn due to the obstruction caused by the presence of H-bond between Ser138 and Trp141 (Fig. S4). These results concur with the findings of Whitehead et al., where the AR channel has been identified as two volume components divided at a junction between amino acid residues L31, I 34, R37, S138, W141, as 12 Å + 14 Å channel pair (Whitehead et al., 2011). In other class I HDAC isoforms, S138 and W141 are replaced by Ala and Leu respectively, resulting in an almost straight AR channel (Fig. S5). Exploiting this attribute of the AR channel can bring in selectivity towards HDAC8. Crystal structures of HDAC8 show that alpha amino ketone inhibitors (Fig. 1f-g) having benzyl substitution fits snugly into the AR channel showing selectivity to HDAC8. MD analysis showed compounds 1–3 opt a similar binding mode inspite of being amide derivatives. Initially, we hypothesized that sp3 hybridised O/C linking atom between the chelating group and the aromatic group allows more flexibility in fitting the aromatic group into the AR channel as in case with 1 and 2. However, 3 with sp2 hybridised N/C atoms still proved to be effective. Concisely, aromatic amide derivatives with a two-atom spacing between the chelating group and the aromatic group appears to be crucial for HDAC8 selectivity. The spacer aids to fit the aromatic group into the otherwise bent AR channel.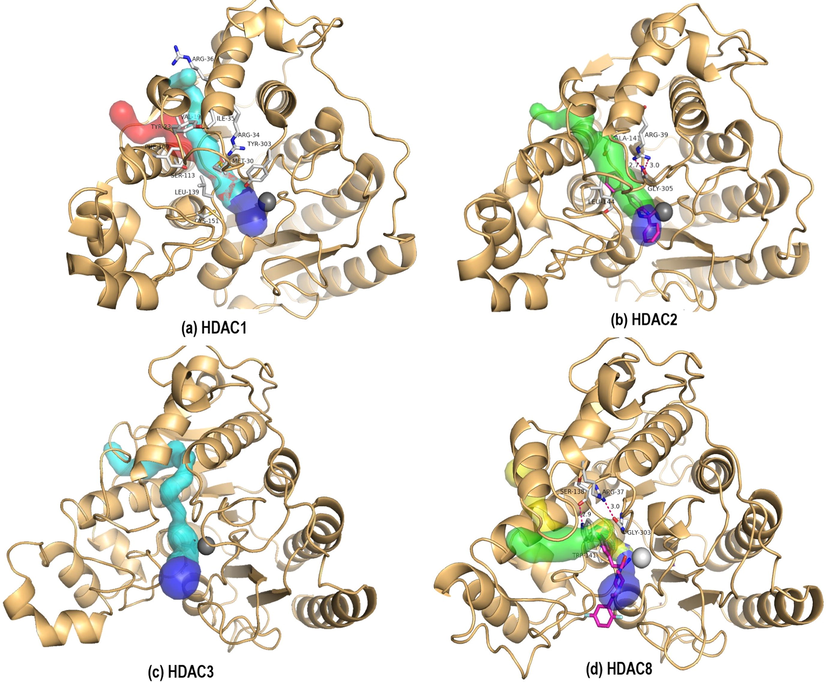
Possible acetate release channels (green, yellow, cyan, red) and acetyl lysine binding channel (blue) in (a) HDAC1, (b) HDAC2, (c) HDAC3 and (d)HDAC8 isoforms. Zinc is shown as grey sphere. Residues lining the channel are shown in sticks.
4 Conclusions
In conclusion, the present study demonstrates the identification of novel non-hydroxamic acid inhibitors selective to HDAC8, through VS. The VS process includes both ligand based studies (viz., Pharmacophore, 3D-QSAR) and structure based studies like docking. Careful implementation of docking studies with different HDAC isoforms and their analysis resulted in five hit compounds. Enzymatic activity assay clearly identified two compounds 1, and 2 to be promising lead molecules with selective HDAC8 inhibitory efficacy in nano and pico molar range. In vitro cell based assays showed that the compounds were cytotoxic to HeLa cells where HDAC8 is overexpressed and were able to induce apoptosis by modulating Bax/Bcl2, cleavage of PARP and release of Cytochrome C. MD studies were able to identify key elements in the molecular recognition process and rationalize the observed differences in the experimental activity. CAVER analysis deepens our understanding about the geometric differences among the AR channels of class I HDAC isoforms. Collectively, our results utilize the structural determinants imparting isoform selectivity and identify novel HDAC 8 selective inhibitors.
CRediT Author Contribution Statement
Aparna Vema: Conceptualization, Funding Acquisition, Methodology, Validation, Visualization, Writing - original draft, review and editing. Sudhan Debnath: Funding Acquisition, Data Curation, Formal Analysis, Methodology, Resources, Validation. Arunasree M. Kalle: Conceptualization, Funding Acquisition, Investigation, Methodology, Resources, Supervision, Validation, Writing - original draft, review and editing
Acknowledgements
VA and AMK acknowledge the Centre for Modelling, Simulation and Design (CMSD), University of Hyderabad for providing computational resources. SD acknowledges Prof. Swapan Majumder, Dept. of Chemistry, Tripura University for recording NMR.
Funding
This work was supported by Department of Health Research New Delhi, Govt. of India (grant No. R.12013/33/2020-HR); Department of Biotechnology, New Delhi, Govt. of India (F.No.BT/327/NE/TBP/2012).
Declaration of Competing Interest
The authors declare that they have no known competing financial interests or personal relationships that could have appeared to influence the work reported in this paper.
References
- Gromacs: High yormance molecular simulations through multi-level parallelism from laptops to supercomputers. SoftwareX. 2015;1–2:19-25.
- [CrossRef] [Google Scholar]
- Anti-proliferative effects of carvacrol on a human metastatic breast cancer cell line, MDA-MB 231. Phytomedicine. 2010;17:581-588.
- [CrossRef] [Google Scholar]
- A novel histone deacetylase 8 (HDAC8)-specific inhibitor PCI-34051 induces apoptosis in T-cell lymphomas. Leukemia. 2008;22:1026-1034.
- [CrossRef] [Google Scholar]
- Histone deacetylase 8 (HDAC8) and its inhibitors with selectivity to other isoforms: an overview. Eur. J. Med. Chem.. 2019;164:214-240.
- [CrossRef] [Google Scholar]
- Structural and functional analysis of the human HDAC4 catalytic domain reveals a regulatory structural zinc-binding domain. J. Biol. Chem.. 2008;283:26694-26704.
- [CrossRef] [Google Scholar]
- Exploration of the HDAC2 foot pocket: synthesis and SAR of substituted N-(2-aminophenyl)benzamides. Bioorgan. Med. Chem. Lett.. 2010;20:3142-3145.
- [CrossRef] [Google Scholar]
- QSAR modeling to design selective histone deacetylase 8 (HDAC8) inhibitors. Arch. Pharm. Res.. 2016;39:1356-1369.
- [CrossRef] [Google Scholar]
- HDAC8: a multifaceted target for therapeutic interventions. Trends Pharmacol. Sci. 2015
- [CrossRef] [Google Scholar]
- Understanding conformational entropy in small molecules. J. Chem. Theory Comput.. 2021;17:2099-2106.
- [CrossRef] [Google Scholar]
- Synthesis and modeling of new benzofuranone histone deacetylase inhibitors that stimulate tumor suppressor gene expression. J. Med. Chem.. 2009;52:3112-3115.
- [CrossRef] [Google Scholar]
- HDAC8 mutations in Cornelia de Lange syndrome affect the cohesin acetylation cycle. Nature. 2012;489:313-317.
- [CrossRef] [Google Scholar]
- Discovery of novel potential selective HDAC8 inhibitors by combine ligand-based, structure-based virtual screening and in-vitro biological evaluation. Sci. Rep.. 2019;9
- [CrossRef] [Google Scholar]
- PHASE: A new engine for pharmacophore perception, 3D QSAR model development, and 3D database screening: 1. Methodology and preliminary results. J. Comput. Aided. Mol. Des.. 2006;20:647-671.
- [CrossRef] [Google Scholar]
- Emerging role of histone deacetylase inhibitors as anti-breast-cancer agents. Drug Discov. Today 2019
- [CrossRef] [Google Scholar]
- Structures of a histone deacetylase homologue bound to the TSA and SAHA inhibitors. Nature. 1999;401:188-193.
- [CrossRef] [Google Scholar]
- Extra precision glide: Docking and scoring incorporating a model of hydrophobic enclosure for protein-ligand complexes. J. Med. Chem.. 2006;49:6177-6196.
- [CrossRef] [Google Scholar]
- Azetidinones as zinc-binding groups to design selective HDAC8 inhibitors. ChemMedChem. 2009;4:1991-2001.
- [CrossRef] [Google Scholar]
- Glide: a new approach for rapid, accurate docking and scoring. 2. Enrichment factors in database screening. J. Med. Chem.. 2004;47:1750-1759.
- [CrossRef] [Google Scholar]
- Small molecule antagonists of the interaction between the histone deacetylase 6 zinc-finger domain and ubiquitin. J. Med. Chem.. 2017;60:9090-9096.
- [CrossRef] [Google Scholar]
- Thirty years of HDAC inhibitors: 2020 insight and hindsight. J. Med. Chem. 2020
- [CrossRef] [Google Scholar]
- Identification of novel isoform-selective inhibitors within class I histone deacetylases. J. Pharmacol. Exp. Ther.. 2003;307:720-728.
- [CrossRef] [Google Scholar]
- Design and evaluation of “Linkerless” hydroxamic acids as selective HDAC8 inhibitors. Bioorgan. Med. Chem. Lett.. 2007;17:2874-2878.
- [CrossRef] [Google Scholar]
- Unlocked potential of dynamic elements in protein structures: channels and loops. Curr. Opin. Chem. Biol. 2018
- [CrossRef] [Google Scholar]
- Hydroxamates of para-aminobenzoic acid as selective inhibitors of HDAC8. Bioorg. Chem.. 2014;57:116-120.
- [CrossRef] [Google Scholar]
- The function of histone acetylation in cervical cancer development. Biosci. Rep. 2019
- [CrossRef] [Google Scholar]
- Upgraded AMBER force field for zinc-binding residues and ligands for predicting structural properties and binding affinities in zinc-proteins. ACS Omega. 2020;5:15301-15310.
- [CrossRef] [Google Scholar]
- Upgrading and validation of the AMBER force field for histidine and cysteine zinc(II)-binding residues in sites with four protein ligands. J. Chem. Inf. Model.. 2019;59:3803-3816.
- [CrossRef] [Google Scholar]
- Structural basis for the inhibition of histone deacetylase 8 (HDAC8), a key epigenetic player in the blood fluke Schistosoma mansoni. PLoS Pathog.. 2013;9:e1003645.
- [CrossRef] [Google Scholar]
- Advances and challenges of HDAC inhibitors in cancer therapeutics. In: Advances in Cancer Research. Academic Press Inc.; 2018. p. :183-211.
- [CrossRef] [Google Scholar]
- Histone deacetylases: structural determinants of inhibitor selectivity. Drug Discov. Today 2015
- [CrossRef] [Google Scholar]
- MDAnalysis: A toolkit for the analysis of molecular dynamics simulations. J. Comput. Chem.. 2011;32:2319-2327.
- [CrossRef] [Google Scholar]
- Class I HDACs share a common mechanism of regulation by inositol phosphates. Mol. Cell. 2013;51:57-67.
- [CrossRef] [Google Scholar]
- Software news and updates AutoDock4 and AutoDockTools4: Automated docking with selective receptor flexibility. J. Comput. Chem.. 2009;30:2785-2791.
- [CrossRef] [Google Scholar]
- An unbiased approach to identify endogenous substrates of “histone” deacetylase 8. ACS Chem. Biol.. 2014;9:2210-2216.
- [CrossRef] [Google Scholar]
- Discovery of the first histone deacetylase 6/8 dual inhibitors. J. Med. Chem.. 2013;56:4816-4820.
- [CrossRef] [Google Scholar]
- Design and synthesis of novel HDAC8 inhibitory 2,5-disubstituted-1,3,4-oxadiazoles containing glycine and alanine hybrids with anti cancer activity. Bioorgan. Med. Chem.. 2016;24:5611-5617.
- [CrossRef] [Google Scholar]
- AutoDock4Zn: an improved AutoDock force field for small-molecule docking to zinc metalloproteins. J. Chem. Inf. Model.. 2014;54:2371-2379.
- [CrossRef] [Google Scholar]
- Structural snapshots of human HDAC8 provide insights into the class I histone deacetylases. Structure. 2004;12:1325-1334.
- [CrossRef] [Google Scholar]
- Caver Web 1.0: Identification of tunnels and channels in proteins and analysis of ligand transport. Nucl. Acids Res.. 2019;47:W414-W422.
- [CrossRef] [Google Scholar]
- Design, synthesis, and biological activity of NCC149 derivatives as histone deacetylasea 8-selective inhibitors. ChemMedChem. 2014;9:657-664.
- [CrossRef] [Google Scholar]
- Rapid discovery of highly potent and selective inhibitors of histone deacetylase 8 using click chemistry to generate candidate libraries. J. Med. Chem.. 2012;55:9562-9575.
- [CrossRef] [Google Scholar]
- Identification of a novel aminotetralin class of HDAC6 and HDAC8 selective inhibitors. J. Med. Chem.. 2014;57:8026-8034.
- [CrossRef] [Google Scholar]
- Discovery of histone deacetylase 8 selective inhibitors. In: Bioorganic and Medicinal Chemistry Letters. Pergamon; 2011. p. :2601-2605.
- [CrossRef] [Google Scholar]
- Discovery of novel N-substituted thiazolidinediones (TZDs) as HDAC8 inhibitors: in-silico studies, synthesis, and biological evaluation. Bioorg. Chem.. 2020;100
- [CrossRef] [Google Scholar]
- Crystal structure of a eukaryotic zinc-dependent histone deacetylase, human HDAC8, complexed with a hydroxamic acid inhibitor. Proc. Natl. Acad. Sci. USA. 2004;101:15064-15069.
- [CrossRef] [Google Scholar]
- Mutagenesis studies of the 14 Å internal cavity of histone deacetylase 1: Insights toward the acetate-escape hypothesis and selective inhibitor design. J. Med. Chem.. 2014;57:642-650.
- [CrossRef] [Google Scholar]
- On the function of the 14 Å long internal cavity of histone deacetylase-like protein: implications for the design of histone deacetylase inhibitors. J. Med. Chem.. 2004;47:3409-3417.
- [CrossRef] [Google Scholar]
- Structure of HDAC3 bound to co-repressor and inositol tetraphosphate. Nature. 2012;481:335-340.
- [CrossRef] [Google Scholar]
- Insights into the activation mechanism of class i HDAC complexes by inositol phosphates. Nat. Commun.. 2016;7:1-13.
- [CrossRef] [Google Scholar]
- Human HDAC isoform selectivity achieved via exploitation of the acetate release channel with structurally unique small molecule inhibitors. Bioorgan. Med. Chem.. 2011;19:4626-4634.
- [CrossRef] [Google Scholar]
- An acetylation switch modulates the transcriptional activity of estrogen-related receptor α. Mol. Endocrinol.. 2010;24:1349-1358.
- [CrossRef] [Google Scholar]
- HATs and HDACs: From structure, function and regulation to novel strategies for therapy and prevention. Oncogene 2007
- [CrossRef] [Google Scholar]
Appendix A
Supplementary material
Supplementary data to this article can be found online at https://doi.org/10.1016/j.arabjc.2022.103863.
Appendix A
Supplementary material
The following are the Supplementary data to this article:Supplementary data 1
Supplementary data 1


