

Translate this page into:
In-situ manipulation of gel layer fouling into gel layer membrane formation on porous supports for water treatment
⁎Corresponding authors. shad3233@yahoo.com (Dilshad Hussain), dilshadhussain@iccs.edu (Dilshad Hussain), musharraf1977@yahoo.com (Syed Ghulam Musharraf)
-
Received: ,
Accepted: ,
This article was originally published by Elsevier and was migrated to Scientific Scholar after the change of Publisher.
Peer review under responsibility of King Saud University.
Abstract
The inaccessibility of clean water is one of the growing issues of this era. Indeed, cost-effective and sustainable methods for recycling wastewater are essential. Although membrane separation is an efficient technology for the recycling and purification of water, membrane fouling is still a major drawback of this technology. This work is aimed to develop a dynamic method to form gel layer membranes (GLMs) by manipulating the irreversible fouling process itself as a problem-solving approach. A microporous polyvinylidene fluoride (PVDF) support is subjected to gel layer formation by applying a supernatant of industrial aerobic sludge (containing soluble extracellular polymeric substances EPS) as a feed. Retention of polysaccharides and calcium during the filtration and the topographical analysis after the filtration show that EPS uniformly formed a gel layer on the PVDF support. No further decline in permeability is observed (i.e. remained around 27–33 L/m2 hr) when the formed GLM is subjected to fouling under similar conditions. Moreover, the percent flux recovery ratio (FRR) of the GLM is also significant (i.e. 90.1 ± 2.71). The retention ability, hydrophilicity, porosity, and water uptake capability of the formed GLM also increased significantly. The optimal performance and stability of GLMs are observed at room temperature (RT) under neutral pH and sub-critical trance membrane pressures (TMP). Based on these results it is suggested that the in-situ manipulation of gel layer fouling is a viable approach for preparing fouling resistant GLMs with high retention efficiency, potentially applicable to wastewater treatment under normal conditions.
Keywords
Gel layer membranes (GLMs)
Extracellular polymeric substances (EPS)
Membrane bioreactors (MBRs)
Polyvinylidene fluoride (PVDF)
Membrane fouling

1 Introduction
Water is indispensable, not merely to sustain life on Earth but, in the current era, it is also linked with economic growth as well. The limited resources of freshwater have brought the attention of the World to reuse the wastewater after various treatments. Membrane technology is the most efficient and viable option, especially membrane bioreactors (MBRs) (Krzeminski, Leverette, Malamis, & Katsou, 2017; Neto & Camkin, 2020). MBRs are gaining a reputation for their extraordinary competency in industrial and municipal wastewater treatment (W. Chen, Mo, Du, Zhang, & Zhang, 2019). Compared with than conventional activated sludge (CAS) system, membrane-based solid or liquid separation performed in MBRs have more than a few noticeable benefits such as enhanced effluent quality, increased biomass concentration, the requirement of less space for installment (Maletskyi, 2020; Tolny, Bartus, Kerekes, & Koris, 2019; Zhu, Chen, Luo, Zhang, & Meng, 2020). However, membrane fouling in MBRs is a major problem, chief foulants in MBRs are extracellular polymeric substances (EPS) (Chang, Le Clech, Jefferson, & Judd, 2002; Cheng et al., 2018; Shannon et al., 2010). The identified mechanisms of fouling by EPS are adsorption and gel/cake layer formation (Liao, Bokhary, Maleki, & Liao, 2018; W. Zhang & Jiang, 2019; W. Zhang, Liang, Zhang, & Hao, 2021). Interfacial interactions between the EPS and the solid surface during membrane filtration make EPS suitable for gel layer formation. In the last two decades, significant advancements have been made, but membrane fouling is an indistinguishable phenomenon and moderation approaches still need research efforts and industrial developments, particularly irreversible fouling has not been inspected effectively (Bagheri & Mirbagheri, 2018; Y. Shi et al., 2018).
Based on reversibility, membrane fouling is classified into the cake layer and gel layer formation. In recent years, gel layers have acquired more attention (Wang, Wu, Yin, & Tian, 2008). Since cake layers are reversible and can easily be removed by backwashing, while gel layers are irreversible and cannot be removed by physical cleaning (Martí-Calatayud, Schneider, Yüce, & Wessling, 2018; X. Shi, Tal, Hankins, & Gitis, 2014). Generally, gel layer formation takes place at sub-critical filtration conditions (Gao et al., 2011; Pollice, Brookes, Jefferson, & Judd, 2005; Wang et al., 2008). EPS and/or as soluble microbial products (SMP) dissolved in the supernatant play a major role in this process (Chang et al., 2002; Drews, 2010; Ly, Nghiem, Sibag, Maqbool, & Hur, 2018; Shannon et al., 2010). EPS have a very high binding ability than other materials or solid surface because they contain polar functional groups such as hydroxyl, carbonyl, carboxylic, and amine groups (d’Abzac et al., 2013; Y. Miao, Guo, Jiang, Zhang, & Wu, 2017; Sudmalis et al., 2020). The presence of these functional groups facilitates the EPS to form a complex with metals (Dignac et al., 1998; Meng et al., 2006; Priester et al., 2006), and metals act as a bridge between the EPS and membrane surface. Metals also act as a bridge between already adsorbed EPS on the membrane surface and new coming EPS during the filtration, increasing the gelling layer thickness.
Literature reveals that the composition of the EPS matrix in activated sludge is very complex, containing proteins, carbohydrates, nucleic acids, lipids, and humic substances. Conventional chemical colorimetric analyses can quantify their contents in EPS (L. Miao et al., 2018; Salama et al., 2016). Generally, the carbohydrate or polysaccharides (PS) content is measured by the phenol–sulfuric acid method (Dubois, Gilles, Hamilton, Rebers, & Smith, 1956; Frølund, Palmgren, Keiding, & Nielsen, 1996). The protein content is measured using the Lowry method, (Frølund et al., 1996) or the Microplate procedure of the Pierce BCA (bicinchoninic acid) Protein Assay Kit (Thermo Scientific) (Faust, 2014). Submicron particle (colloidal particles) concentration is determined using a Nanosight NS500 (De Temmerman, Maere, Temmink, Zwijnenburg, & Nopens, 2014). Inorganic ions such as Ca2+ and Na+ are quantified by inductively coupled plasma mass spectrometry (ICP-MS) and also by ion-chromatography (IC) (Michalski, 2006; B. Zhang et al., 2019).
EPS is significant, not only for understanding and developing wastewater treatment but also for refining the competence of such treatment by optimizing different operational parameters. In this research, we report an in-situ coating of EPS on low-cost porous supports (Polyvinylidene fluoride (PVDF) membranes) and used it for wastewater treatment. Different experimental parameters are optimized to get maximum efficiency. The objective is to manipulate the gel layer fouling into gel-layer membrane formation. The primary aim behind this manipulation is to reuse the gel-fouled membrane, the so-called gel layer membrane (GLM), for the treatment of the same feed (supernatant of the aerobic industrial wastewater) without compromising the efficiency of the membrane in terms of retention, fouling resistivity, hydrophilicity, and water uptake.
2 Materials and methods
2.1 Materials
Aerobic sludge was collected from the MBR of Yunus Textile Mills Limited, Karachi. After collection, the supernatant was stored at 4 °C until EPS extraction. Chemicals such as glucose, bovine serum albumin (BSA), phenol, sulphuric acid, nitric acid, and calcium chloride, were purchased from Sigma Aldrich (USA). Commercially available hydrophilic Polyvinylidene fluoride (PVDF) membranes with pore size 0.1 µm and 0.2 µm were purchased from Millipore Merck (China). PVDF membranes were used in all experiments as porous support for the formation of the gel layer on them. Mixed cellulose esters (MCE) filters with pore size 0.45 µm were also purchased from Millipore Merck (China). Aerobic sludge was directly centrifuged at 10,000 rpm and the supernatants were separated which were used as EPS solutions (feed) for the formation of gel layer on PVDF membrane. Also, aerobic supernatant was filtered with a 0.45 µm MCE filter, and the filtrate was also used for gel layer formation on a 0.2 µm PVDF membrane to understand the effect of collides.
2.2 Methods
2.2.1 Extraction/separation of EPS
The sludge samples were centrifuged at 10,000 rpm for 15 min at room temperature to separate the soluble EPS (Liu & Fang, 2002). Centrifugation was done as a control method to separate soluble from bound EPS. After centrifugation, the supernatant was separated from the solid phase. The obtained supernatant was mixed with three-volume of chilled ethanol and kept at 4 °C overnight. Soluble EPS were extracted and precipitated from the separated supernatant by ethanol extraction (Rättö et al., 2006). Precipitated EPS was collected by centrifugation at 10,000 rpm for 15 min. The supernatant was decanted and the collected precipitates containing EPS were dried at room temperature for 6 h and the dry weight of the extracted EPS (containing both biopolymers and humic substances) was measured.
For comparison, the separated supernatants (without extraction and precipitation) were heated at 80 °C for 30 min. The obtained solid material was collected, dried, and weighed. The dry weight (DW) content of the sludge was determined by drying the sample at 105 °C for 24 h. Then, the volatile dry weight (VDW) content was measured, corresponding to the mass loss after 2 h at 550 °C.
2.2.2 Characterization of EPS
First of all dried EPS collected through ethanol extraction was analyzed by FTIR. Individual components of the EPS within separated supernatants were determined by measuring the polysaccharides (PS), proteins (PN), humic acids (HA), chemical oxygen demand (COD), total organic carbon (TOC), particles size distribution, inorganic ions such as calcium and sodium. The zeta potential of the separated EPS was also measured (Fig. S1 (b)). FTIR spectra of EPS were recorded through FTS-65, Bio-Rad. COD was measured using Dr. Lange test kits (LCK, Hach Lange), heated in a thermostat (HT 200S, Hach Lange) to the desired temperature, and analyzed by a spectrophotometer (Thermo Scientific TM Evolution TM 300 UV–Vis Spectrophotometer) at 320–750 nm. Total organic carbon (TOC) was quantified by a Shimadzu TOC analyzer (TOC-VCPH, Shimadzu, Japan). Organic matter fractions (especially humic acids) were analyzed by a liquid chromatography-organic carbon detector (LC-OCD). PN (proteins) concentration in supernatants was determined by microplate reader Pierce BCA (bicinchoninic acid) Protein Assay Kit (Thermo Scientific) using BSA as standard. PS (polysaccharides) content was measured by the phenol–sulfuric acid method (Frølund et al., 1996) using glucose as standard. The concentration vs size of the submicron particle (colloidal particles) was determined in the 10–1000 nm range along with the zeta potential of EPS using a Nano-zeta sizer (Malvern, U.K). Inorganic ions such as Ca2+ and Na+ concentrations were measured by inductively coupled plasma mass spectrometry (ICP-MS) (Agilent Technologies, 7700 series).
2.2.3 Gel layer coating/formation
For gel layer coating/formation, filtration experiments were performed under cross-flow mode using filtration cell (FM1107-01.03, SUS316) with an effective membrane area of 0.0177 m2, purchased from Xiamen Filter and Membrane Technology Co., Ltd, China. PVDF Membrane coupons (diameter; 0.15 m, surface area; 0.0177 m2 and, pore size; both 0.1 µm and 0.2 µm) were placed in the cell, connected to a pressure machine (FlowMem-0015) with a maximum capability of 10 bar pressure. During the coating process, all filtrations were carried out at a constant transmembrane pressure (TMP) of 0.2 bars. Aerobically flocculated sludge was first filtered with 0.45 µm MCE filter and the filtrate (containing soluble EPS) was taken as a feed for the actual experiment. Permeates during and after gel layer coating/formation were collected in beakers for further analysis.
2.2.4 Characterization of gel layer
The formed/coated gel layer was characterized by scanning electron microscopy (SEM), atomic force microscopy (AFM). For surface analysis, surfaces of the gel membranes were investigated with a JEOL-6480LV SEM (Japan). Samples were fine coated with a thin (10 nm) Au (gold) layer under a high vacuum. ATR-FTIR of GLMs were recorded by Buker’s Tensor II with diamond accessory ATR. Change in the filterability of PVDF membranes due to gel coating/formation was also estimated. A specific procedure was adopted to estimate the change in the filterability of the PVDF membrane due to the gel layer coating/formation. A brief description of the adopted method is given as follows;
Before the filtration of supernatant (solution of EPS), Milli-Q water flux (MQW-Flux) of PVDF membrane was measured at constant (i.e. 0.2 bar) transmembrane pressure (TMP) until a quasi-steady flux was attained. After that, filtration of supernatant (solution of EPS) was performed again at constant TMP (i.e. 0.2 bars). During this filtration, the flux behavior of the investigated membrane was also measured and the samples of permeates were collected to estimate the retention of the constituents present in the feed solution. For the final step, again, MQW-Flux of the PVDF membrane was measured after the coating/formation of the gel layer on it, again at 0.2 bar TMP (for sub-critical flux measurements) and also at higher pressures (for critical flux measurements) until a quasi-steady flux was attained. With this procedure, we estimated the change in MQW-Flux of the PVDF membrane (before and after the gel layer coating) which was due to the formed gel layer (and/or maybe fouling layer as well).
2.2.4.1 Porosity and water uptake study
1 g of both membrane samples were taken. The ends of both membranes were sealed via epoxy resin and were placed at a 40 °C oven to achieve constant weight. The samples were submerged in MQW for 24 h. afterward, the adsorbed water on the membrane surfaces was cleaned via blotting paper and wet weight (Ww) was measured. Finally, the membranes were dried completely and dry weights (Wd) were measured.
The % water uptake was calculated by the following equation.
The porosity (ε) of the membranes was determined gravimetrically as defined in the below equation (2). where ‘Ww’ and ‘Wd’ are the wet and dry weight of the membrane, ‘A’ is the area of the membrane (cm2), is the density of pure water (0.998 g cm−3) and is the thickness of the membrane (cm).
2.2.4.2 Permeation study
Both the membranes were characterized by measuring the MQW-Flux and contaminant rejection using a lab-scale cross-flow module at RT. The permeation and rejection studies were carried out at 0.2 bar pressure. To reach a steady state, all the membranes were compacted for 35 min at 0.5 bar before testing. Later MQW-Flux, Jw (L/m2h) was calculated using the below equation (3). where ‘Q’ is the volume of permeated water (L), ‘A’ is the effective area of hollow fiber membrane (m2) and Δt is the permeation time (h)
The rejection experiments were conducted using the data of TOC in the respective feeds and permeate of both membranes. The percentage rejection, ‘R’ was determined using the equation given below. where ‘Cp’ and ‘Cf’ are the solute concentration in permeate and feed respectively.
2.2.4.3 Antifouling study
The antifouling performance of both membranes was calculated using 300 ppm BSA solution at pH 7 as feed at room temperature and 0.5 bar pressure. In brief, to calculate the BSA flux (Jp), MQW-Flux (Jw1) was studied for 1 h, subsequently, the feed tank was refilled with BSA solution and allowed for another 1-hour filtration. Subsequently, the membrane was washed with MQW for 1 hr. Again MQW-Flux (Jw2) of the cleaned membrane was measured. To evaluate the antifouling performance, flux recovery ratio (FRR) was measured using the below-mentioned equation.
To understand the fouling process in detail, total organic fouling (Rt, the degree of total flux drop owing to total fouling), reversible fouling (Rr, fouling due to concentration polarization), and irreversible fouling (Rir, fouling due to adsorption of protein molecules) were also studied by below equations.
3 Results and discussion
3.1 Composition of separated supernatants
To investigate the composition of separated supernatant, EPS present in supernatants are extracted by chilled ethanol. FTIR spectra of the ethanol extract (EPS) are recorded under normal conditions and the results are presented in Fig. S1. In addition, ATR-FTIR spectra of the original PVDF filter and the GLM produced after filtration of SP were also recorded, analyzed, and briefly described in the supplementary information Fig. S11. Furthermore, the size distribution is also determined by dynamic light scattering (DLS). Fig. S2 and S3 show the obtained size distribution in the aerobic supernatants The extensive characterization in terms of the IR and DLS spectra are given in supplementary information.
Moreover, the individual concentrations of the key foulants in the supernatant which were previously identified by the IR analysis such as (PN), polysaccharides (PS), humic acids (HA), and also other influencing components/factors such as inorganic ions, COD, and TOC are measured individually by the state of the art methods as discussed in section 2.2.2. The obtained results are given in Table 1.
Analytes/Components
Amount (mg/L)
Ethanol extract
180–197
PS
40–48
PN
152–203
Humic acids
30–37
TOC
69–86
COD (mg/L of O2)
203–217
Calcium
49–56
Sodium
151–16
Although, it is difficult to compare the values of individual components of the supernatant with the literature as these values vary from source to source, however, ratios of the measured values are compared. The obtained values of COD and TOC are comparable with the literature in terms of the ratio of COD to TOC which is equal to 2.9 (Dubber & Gray, 2010). Similarly, PN is higher than PS which may be due to wastewater proteins. Many studies have revealed that in various MBR set-ups, the PN concentration is relatively higher than the PS concentration (Yao, Zhang, & Cui, 2010). Obtained COD is almost 5 times of polysaccharides in the sludge. The concentrations of calcium ions are 40–55 mg/L and sodium ions are 140–150 mg/L. Concentrations of these inorganic ions especially calcium ions are in the range that is reported already (Arabi & Nakhla, 2008; van den Brink, Zwijnenburg, Smith, Temmink, & van Loosdrecht, 2009). In this perspective, the selected feed is to some extent valid for comparison of gel layers produced by it with gel layers that other similar sources can produce, ignoring exact concentration and some minor composition differences. It is important to mention that the amount of extracted/precipitated EPS is less than the sum of directly measured PN, PS, and humic acids present in the supernatant. This shows that by the described method of ethanol extraction/precipitation, it is not possible to extract or precipitate all EPS or organic materials present in the supernatants.
To investigate the amount of total supernatant matrix (organics, inorganics, and colloids), the supernatant is evaporated at 80 °C until a white solid weighed as 290 mg/L is obtained. This amount shows that besides organic materials, a lot of inorganic content is also present in the supernatant. These are important characteristics of supernatant for gel layer coating on the porous support/membrane during the filtration, as the objective of this work is concerned. According to literature, The obtained EPS values (soluble + colloidal particles) especially PS and calcium ions show that the supernatant (feed) is capable of making a gel layer on a porous support, as normally 10–70 mg/L of EPS and 1–2 milli-molar calcium ion concentration is considered enough to form gel layer and/or fouling layer (Gkotsis & Zouboulis, 2019; Ly, Hu, Li, Cho, & Hur, 2019).
3.2 Gel layer coating on 0.2 µm PVDF membrane and its characterization
A commercially available 0.2 µm PVDF membrane is chosen as porous support for gel layer coating/formation. There are three important reasons for this choice: 1) this membrane is iso-porous, which can avoid the influence of membrane pore size distribution during the formation of the gel layer, 2) hydrophilic PVDF membranes are charged, so the membrane surface may bridge with the carboxyl groups of the EPS by calcium ions, and 3) the aim is to coat gel layer on porous supports that are commercially available with different pore sizes and to reuse them as GLMs to avoid changing of original support material after their primary use. For the coating of a gel layer on a 0.2 µm PVDF membrane, soluble EPS and/or colloidal particles with a comparable size to the pore size of the membrane are required. Therefore, filtration of separated aerobic supernatant (after centrifugation) is done through a 0.45 µm MCE filter, as aerobic supernatant has wide particle size distribution. The obtained 0.45 µm supernatant filtrate (SF) is used as a feed to form the gel layer on 0.2 µm PVDF membrane by cross-flow filtration at a constant TMP of 0.2 bar. For the formation of the gel layer, filtration at cross-flow mode with constant pressure is favorable (in literature it is also called fouling layer or a combination of the gel layer and fouling layer).
3.2.1 AFM analysis
After the filtration of SF, the surface of the formed gel layer on the 0.2 µm PVDF membrane is analyzed by Atomic Force Microscopy (AFM). Multiple conclusions can be drawn from the AFM images given in Fig. 1. The 3D images i.e. Fig. 1 (a) and (b) corresponds to the membrane surface of the original 0.2 µm PVDF membrane while (c) and (d) corresponds to the membrane surface after filtration of SF (gel layer membrane). The first thing obvious from the images is that a gel layer (it may be a fouling layer or both gel and fouling layer) is formed on the surface of the 0.2 µm PVDF membrane. It shows that the gel layer has evenly covered the surface of the 0.2 µm PVDF membrane.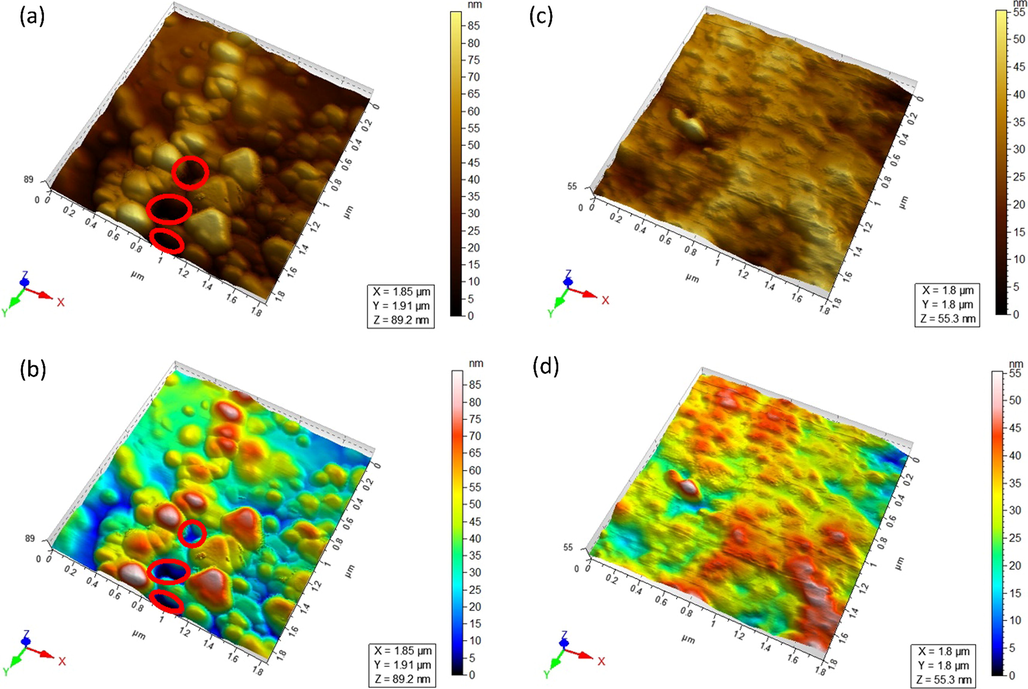
Images; (a) and (b) are AFM pictures (in 3D view) of original 0.2 µm PVDF membrane. Images (c) and (d) are 3D views of GLM (i.e. after filtration of SF over original 0.2 µm PVDF membrane).
Secondly, the pore size of the original membrane is significantly reduced (i.e. more than one-half reduction). The pores are clear and visible in the images of the original PVDF membrane and are indicated by red circles however, after gel layer formation no visible pore can be observed when compared on the same scale. This narrowing of pore size is transforming the microfiltration PVDF support into a narrower pore size (e.g. Ultrafiltration) Gel-layer membrane. Furthermore, the depth scale of Fig. 1 (b) and (d) is making it clear by indicating the pores of the original PVDF membrane (b) in deep blue regions which either fade or disappear in the GLM(d). Point to be noted, more homogenous the colors in colored AFM images, the smoother the surface will be. Thus the surface of 0.2 µm PVDF membrane is rougher while the GLM surface is smoother. This is would be a good reason for no further fouling of GLMs as fouling is linearly correlated to the surface roughness of the membrane. The same observations were witnessed in the case of PVDF membrane with pore size 0.1 µm. top view images are shown in Fig. S4. (supplementary information). One of the drawbacks of narrowing the pore size is that it significantly reduces the permeate flux. Thus, GLMs obtained from 0.2 µm PVDF membranes were more significant in terms of their permeate flux as compared to the 0.1 µm PVDF membranes. Therefore only GLMs that were produced from the 0.2 µm PVDF membranes were further studied thoroughly.
3.2.2 Porosity and water uptake study
The water absorption testing was determined as previously described. Results from Table 2 reveal The water uptake of the GLM is higher than the 0.2 µm PVDF membrane i.e., with the formation of gel layer on the original PVDF porous support, the water uptake significantly increased. Water uptake by the membranes depends on membrane porosity. As the porosity of the membranes increase, the water uptake ability of the membranes also increases. Although membrane hydrophilicity also contributes to the water uptake phenomenon, however, in the case of gel layers, it is the porosity that is more significantly correlated (J. Chen et al., 2016; Lei et al., 2016). Thus the GLM is better in terms of the porosity and water uptake capability as compared to the 0.2 µm PVDF porous support.
Membrane
Water uptake (%)
Porosity (%)
0.2 µm PVDF
80.6 ± 1.4
78.7 ± 1.31
GLM
90.2 ± 3.3
89.7 ± 0.71
3.2.3 Retention efficiency of 0.2 µm PVDF vs GLM
The concentration of major components (contaminants) of feed and obtained permeate before and after gel layer coating (i.e. 0.2 µm PVDF membrane vs GLM) is determined and the results are shown in Fig. 2. The obtained values of PS, TOC, and COD in the SF and permeate show that around 50% of organic material is retained by 0.2 µm PVDF membrane which forms the gel layer. Particularly, the retention of PS with calcium (as calcium is also significantly retained) is a sign of gel layer formation, because calcium can only be retained by 0.2 µm PVDF membrane if this is combined with the retained organic material, and this is a favorable condition for gel layer formation. Furthermore, around 80% retention of the same organics after gel layer coating/formation suggests that the formed gel layer has higher retention efficiency as compared to the original PVDF membrane. This is due to the narrowing of the pore size of the original PVDF porous support by the formed gel layer.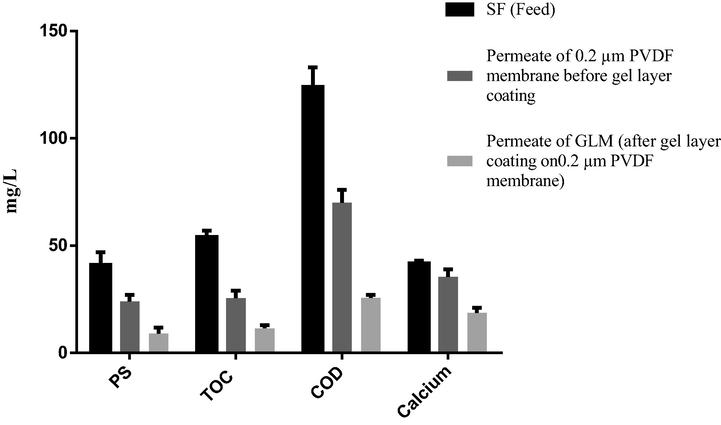
Important components present in aerobic SF (feed solution for formation of gel layer), permeate of 0.2 µm PVDF membrane (permeate during the gel layer coating) and permeate of GLM (permeate after gel layer coating).
To estimate the retention efficiency of both membranes, retention coefficients for individual contaminants of both membranes are calculated.
The retention coefficient with a single solute, Ri, is generally expressed and accordingly calculated as; where Ci' and Ci are the individual solute concentrations in the permeate and the feed, respectively.
From Table 3 it is evident that the retention coefficients (in terms of the above-mentioned contaminants) of the GLM are found to be significantly greater than the original 0.2 µm PVDF membrane. It is important to mention that the retention efficiencies mentioned above are only valid if the GLMs are reused after proper drying. Direct use of GLMs without drying can lead to inconsistent results because of instability issues.
Components
Retention Coefficients
% increase in retention efficiency of GLM
PVDF membrane
GLM
PS
0.4
0.775
51.6%
TOC
0.49
0.77
63.6%
COD
0.435
0.792
54.9%
Calcium ion
0.148
0.553
26.7%
3.2.4 The hydrophilicity of 0.2 µm PVDF vs GLM
The hydrophilicity of both membranes was evaluated in terms of contact angle measurements. A simple experimental apparatus was designed to measure the static contact angle of an MQW drop in contact with the membrane surface. The image of the drop is generated with a simple digital camera by taking a picture and magnifying it with an optical lens. The drop was analyzed with a free software named ImageJ (Schneider, Rasband, & Eliceiri, 2012). The ImageJ contact angle plugin detects the edge of the drop and fits its profile to a circle or an ellipse. The tangent to the triple line contact is calculated and drawn by the ImageJ software, thus, returning the value of the contact angle with acute precision on the measurement (Brugnara, 2010). From the image (Fig. 3..), it is clear that the gel layer coating has significantly increased the hydrophilicity of the new membrane as compared to the parent one. This property can be utilized to develop new GLMs with enhanced water flux as a consequence of higher hydrophilic nature.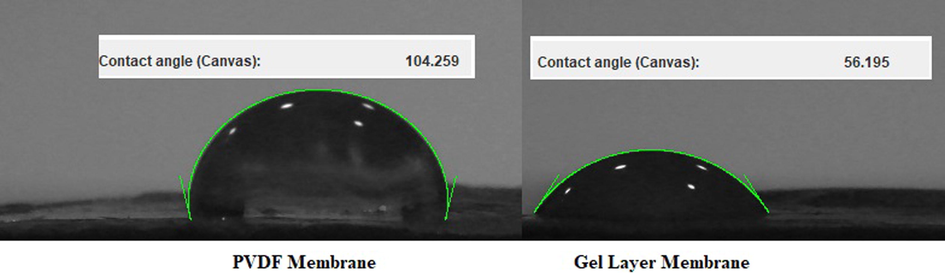
Contact angle measurement of PVDF membrane (left) and GLM (right).
3.2.5 Filterability measurements
To investigate the change in filterability of 0.2 µm PVDF membrane due to the gel layer coating, three flux profiles of PVDF 0.2 µm membrane using MQW and SF are measured. The data are shown in Fig. 5 (a), (b), and (c) which indicates that the MQW-Flux of 0.2 µm PVDF membrane after the gel layer coating is quite lower than the MQW-Flux before the gel layer coating. This may be due to the decrease in pore size of the PVDF membrane which is evident from the AFM analysis shown in Fig. 1.
The top view of the original PC 0.2 µm membrane in (left) and after filtration of 0.45 µm supernatant filtrate (right) of gel layer is given in Figure S5. To confirm the gel layer and its thickness, the cross-sectional analysis was undertaken via SEM as shown in Fig. 4.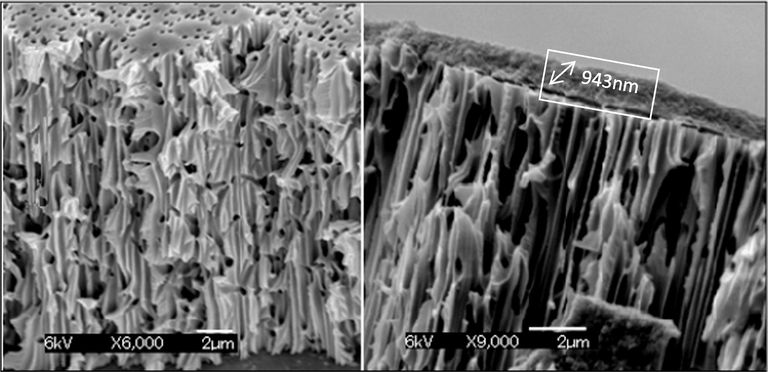
Cross-section view by SEM of 0.2 µm PVDF membrane: (left) before gel layer coating/formation (6000x), (right) after gel layer coating/formation (9000x).
It should also be noted that the gradual decline in MQW-Flux of the respective flux profiles (i.e. Fig. S6 in the supplementary document) is due to the pore size compaction phenomenon. The reason may be related to compression of membrane pores, and thereby, causing reduction of water passage. Fig. 4 represents the SEM crossectional analysis of the porous support before and after the filtration of the feed solution. It is evident from the images that a 943 nm thick gel layer is formed on the surface of the PVDF 0.2 µm membrane. Thus the decrease in MQW-Flux in Fig. 5 (c) can be attributed to a consequence of this gel layer.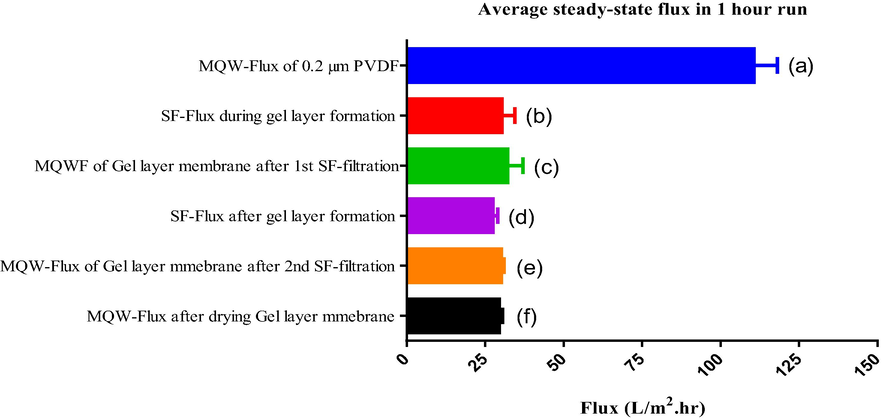
(a): MQW-Flux before gel layer coating by the SF, (b): SF-Flux during the gel layer coating by the filtrate of 0.45 µm filter, (c): MQW-Flux after the gel layer coating by the filtrate of 0.45 µm filter. (d): SF-Flux during second time filtration of SF on already formed gel layer (e): MQW-Flux after the second time filtration of SF. (f): MQW-Flux after drying the gel layer that formed after filtration of SF.
However, the steady-state flux of SF and MQW after gel layer coating is similar, which is unusual, as the flux of feed (i.e. 0.45 µm supernatant filtrate) is normally less than the MQW-Flux during the membrane filtration because of the membrane fouling and/or due to concentration polarization.
Logically, this is only possible when the formed gel layer has a strong antifouling tendency and no more fouling layer (layer by layer gel fouling) formation is happening during the further filtration of the SF. In a perspective, the results indicate that the formed gel layer has a strong antifouling tendency. For further investigation of the antifouling tendency of the GLM, once again SF is filtered through the formed GLM, and MQW-Flux of the GLM is again measured after the 2nd time filtration of SF. The obtained results are given in Fig. 5, bars (d) and (e). From Fig. 5 (bars: “d” and “e”) it is evident that the steady-state SF-Flux (0.45 µm supernatant filtrate flux) of both 0.2 µm PVDF and GLMs are almost similar and the MQW-Flux following both experiments also shows similar behavior. This can be explained if we theorize, the formed gel membrane has a strong antifouling tendency. In other words, there is no layer-by-layer fouling or gel layer formation after a certain time i.e. after achieving steady-state flux. This may be due to the two reasons; the first reason might be the smoother surface of GLM as compared to the original PVDF membrane as discussed earlier, secondly the charge repulsions between EPS of the gel layer and EPS of feed solution (both carry the same charge) during second-time filtration of SF (0.45 µm supernatant filtrate). However, this hypothesis is challenging because, during the first time filtration of SF, a thick gel layer is formed on the original PVDF surface. However, the reason for this initial fouling might be due to the bridging of calcium between EPS to the membrane surface and also EPS to EPS consequently, a 1000 nm thick gel layer appeared on the PVDF surface. MQW-Flux of gel membrane or after second-time filtration of SF (feed) is slightly lower than the MQW-Flux after the first-time filtration of SF (feed) on the same 0.2 µm PVDF membrane. This may be due to calcium ion bridging between EPS of the gel layer and EPS of SF during second-time filtration.
The effect of the MQW-flux immediately after the SF-filtration and after drying the formed gel layer was also investigated. This was done to investigate and exclude the effect of the shear velocity stress on the fouling layer which also contributes to the detachment of the foulants from the fouling layer of the membrane. During the process, the cake layer, or reversible fouling layer can be recovered by immediately measuring the MQW- flux while it is difficult if it is dried. In this regard, we did another filtration of SF on 0.2 µm PVDF membrane but this time after the filtration, the membrane is taken out from the filtration cell and dried at room temperature while on other membranes previously, MQW-Flux was measured directly (without any drying process). The obtained water flux after drying and without drying the GLM is given in Fig. 5, bars (c) and (f). It is evident from Fig. 5 that the MQW-Flux after drying the gel layer is lower than the water flux measured immediately after gel layer formation on 0.2 µm PVDF membrane. This shows that may be a small reversible part of fouling due to cake layer formation being removed when water flux was measured immediately after the formation of the gel layer and after the drying process, it may be difficult to remove.
From these results, it is obvious that the sheer velocity stress of the feed does negatively affect the fouling of the membrane but the contribution is not much significant as the difference in the MQW-Flux for the dried and undried GLMs are very small. This is interesting as it supports our basic assumption about the fouling resistivity of the GLM. Complete flux profiles of individual filtration experiments are given in Figure S6-S9 (supporting information).
To understand the fouling process in detail, total organic fouling (Rt, the degree of total flux drop owing to total fouling), reversible fouling (Rr, fouling due to concentration polarization), and irreversible fouling (Rir, fouling due to adsorption of protein molecules) were also studied using BSA as a model feed solution.
The results, particularly the flux reduction ratios of both membranes are interesting and strongly correlate with the above-mentioned interpretation of fouling resistivity (See Table 4). The higher the FRR the higher the fouling resistivity. GLM showed significantly higher FRR (around 90) as compared to the 0.2 µm PVDF membrane (around 30).
Filter
Fouling (%)
FRR
Rt
Rr
Rir
0.2 µm PVDF
31.2 ± 0.7
67.3 ± 1.5
1.5 ± 0.13
38.8 ± 0.34
GLM
90.1 ± 2.71
13.9 ± 1.06
2.77 ± 0.43
9.01 ± 0.51
Furthermore, the weight of membranes is measured before and after every step of filtration, also after drying the gel layer formed on the membrane at room temperature. The obtained values are interesting and strongly correlate with the flux values (Table 5). Higher the weight of the PVDF membrane after filtration higher the flux decline. It is due to more adsorption of EPS on the PVDF membrane.
Weight of/after
Membrane 1
Membrane 2
Membrane 3
Original 0.2 µm PVDF membranes used
0.0996 g
0.0989 g
0.0988 g
1st-time filtration of SF followed by MQW-Flux
0.4563 g
–
–
2nd-time filtration of SF following MQW-Flux
0.4686 g
–
–
Filtration of SF then drying
–
0.5131 g
–
Filtration of SF then drying then MQW-Flux
–
0.5121 g
–
Filtration of the WS followed by MQW-Flux
–
0.6081 g
Moreover, the filtration of the whole supernatant (WS) on a 0.2 µm PVDF membrane followed by MQW-Flux is also recorded (Fig. S10). It is clear from the obtained flux data that in the case of the whole supernatant, larger colloidal particles with soluble EPS are present in the feed solution. Therefore, the simultaneous formation of the gel layer and cake layer is possible. Due to cake layer formation with time, flux decreased to zero during the whole aerobic supernatant filtration. However, this is not the case for SF. When MQW is passed immediately after filtration of the whole supernatant, then the formed cake layer is partially removed and again converted into colloidal particles. Therefore, water flux becomes higher than the flux during the filtration of the whole aerobic supernatant. However, water flux is still less than the water flux of the gel layer that is formed during the filtration of SF. The cake layer is not removed completely during this process, which can only be removed completely by back-flushing.
3.2.6 Stability tests
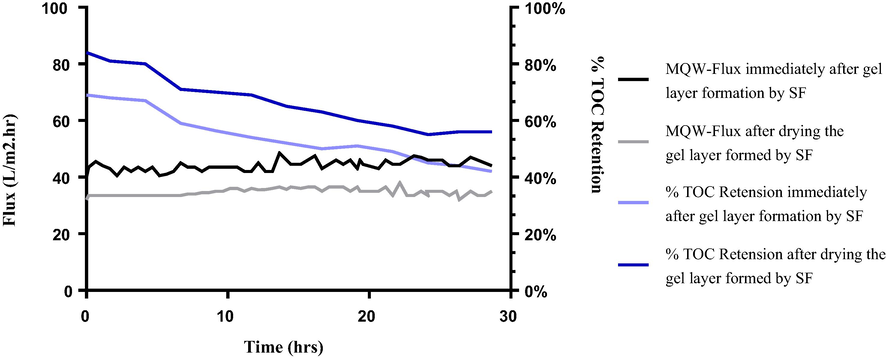
Besides the sub-critical flux studies, to investigate the stability of the GLM, Critical flux measurements using different TMP conditions were also performed. Moreover, short-term (24 hrs.) filtration studies were undertaken to see the consistency of flux behavior and retention efficiency over time as shown in Figs. 6 and 7. The flux and retention trends of dried GLMs were in correspondence to the subcritical conditions. This is because once the gel layer is dried and is reused for wastewater treatment, it becomes more stable against higher pressures and longer filtration times as compared to the undried one. The undried membranes when reused directly were comparatively a bit prone to destabilize over long-run times and also at higher pressures. One reason behind this behavior might be the swelling effect. More briefly, once the gel layer dries, some of the cake layer (reversible fouling layer on the top) which was continuously removed by shear velocity in case of the undried GLM, remains on the top of the gel layer and gets harden. Thus, upon reusing, it takes more time to destabilize as it becomes more resistant to swelling as compared to the undried one.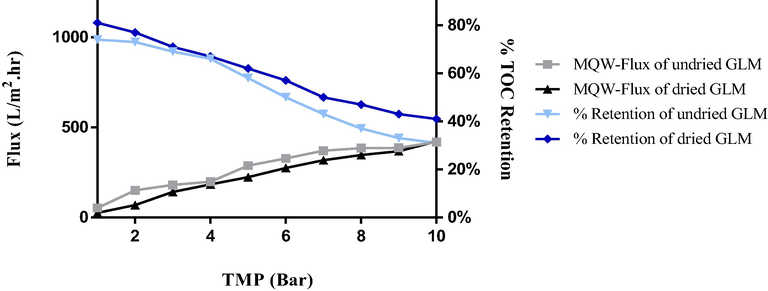
Flux and % retention profile of GLMs over 25 hrs. run. (Grey squares) MQW-Flux immediately after the gel layer coating by the filtrate of 0.45 µm supernatant. (Black triangles) MQW-Flux after drying the gel layer formed after filtration of SF. (Deep blue squares) Percent retention of TOC by dried GLM. (Light blue triangles) Percent retention of TOC by undried GLM used immediately after the formation of the gel layer.
Flux profile of GLM at critical TMP conditions. (Black squares) Variation in the flux of dried GLM over increasing TMP. (Grey triangles) Variation in the flux of GLM used immediately after gel layer formation without drying. (Light blue) Percent retention of TOC by undried GLM. (Dark blue) Percent retention of TOC by dried GLM.
3.2.7 Size distribution of submicron colloidal particles in respective permeates
To correlate the size of submicron colloidal particles in permeates and the pore size of respective membranes, Particle size distribution (PSD) of their respective feeds (i.e. SF), and permeates are also determined. The results are shown in Fig. 8.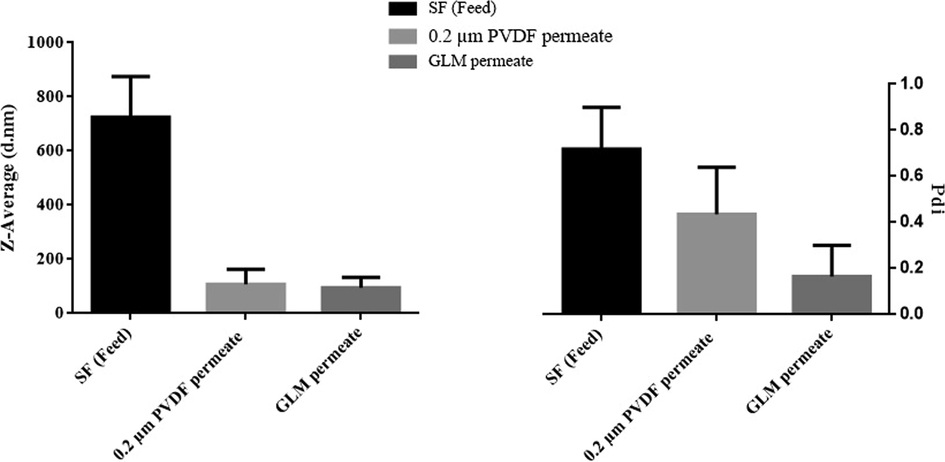
Particle size distribution (PDS) of; permeate of 0.45 µm MCE filter (the feed), permeate of 0.2 µm PVDF membrane, and permeate of GLM.
It is evident from Fig. 8 that both the size and polydispersity index (PDI) of the particles from permeate of the GLM (i.e. 94.7 d.nm and 0.166 respectively) are relatively small as compared to permeate of 0.2 µm PVDF membrane (i.e.108 d.nm and 0.43 respectively). However, the PDS of the feed shows the highest values for its particle’s size and PDI (i.e. around 700 d.nm and 0.7 respectively). A decrease in particle sizes of permeates can be attributed to the fact that the GLM has a smaller pore size as compared to the original PVDF porous support.
4 Conclusion
In this study, we have successfully developed a membrane on a porous supporting material using soluble biopolymers (EPS) which are the major problematic contaminants in the wastewaters. A dynamic gel layer is formed on a very cheap porous support material i.e. existing microfiltration PVDF membranes, and this combination is used as a membrane, named GLMs. Instead of expensive membranes (i.e. normally used during filtration in MBRs), a cheaper support material is used for the formation of the new GLM. No further decline in the permeability/Flux once the gel layer is formed (27–33 L/m2.hr), and a high % FRR value (90.1 + 2.71) confirms that the new GLM has a strong antifouling tendency. Furthermore, the retention ability, hydrophilicity, porosity, and water uptake capability of the new GLM also increased significantly. Once the GLM is dried and then reused, it can perform with significant stability for at least 30 h of continuous operation provided neutral pH, RT, and subcritical pressure conditions. Based on all obtained results, it can be concluded that newly developed GLMs have shown better performance as compared to the PVDF porous support. Thus, the proposed membrane could be a low-cost alternative to the brand new membranes (i.e. the PVDF support) being fouling resistant with high retention efficiency for wastewater treatment.
Authors Contributions
Syed Sibt-e-Hassan (methodology, material preparation)
Dilshad Hussain (data analysis, characterization, supervision)
Ghulam Mustafa (writing—original draft preparation)
Ghayas Uddin Siddiqui (writing—review, and editing)
Syed Ghulam Musharraf (validation, supervision)
Consent to Publish
All authors have read and agreed to the published version of the manuscript.
Funding
Financial support of this work by the Higher Education Commission of Pakistan under a start-up research grant program is appreciatively recognized. The authors would also like to gratefully acknowledge the support from the Deanship of Scientific Research at King Khalid University (Grant No. RGP.2/117/42)
Availability of data and materials
All data generated or analyzed during this study are included in this published article.
Ethical Approval
Not applicable
Consent to Participate
Not applicable
Declaration of Interest
The authors declare no conflict of interest.
References
- Impact of calcium on the membrane fouling in membrane bioreactors. J. Membr. Sci.. 2008;314(1–2):134-142.
- [Google Scholar]
- Critical review of fouling mitigation strategies in membrane bioreactors treating water and wastewater. Bioresour. Technol.. 2018;258:318-334.
- [Google Scholar]
- Contact angle plugin. Trento, Italy: University of Trento; 2010.
- Membrane fouling in membrane bioreactors for wastewater treatment. J. Environ. Eng.. 2002;128(11):1018-1029.
- [Google Scholar]
- Membrane fouling in a membrane bioreactor: high filtration resistance of gel layer and its underlying mechanism. Water Res.. 2016;102:82-89.
- [Google Scholar]
- Anaerobic membrane bioreactors for antibiotic wastewater treatment: performance and membrane fouling issues. Bioresour. Technol.. 2018;267:714-724.
- [Google Scholar]
- Metal binding properties of extracellular polymeric substances extracted from anaerobic granular sludges. Environ. Sci. Pollut. Res.. 2013;20(7):4509-4519.
- [Google Scholar]
- Salt stress in a membrane bioreactor: dynamics of sludge properties, membrane fouling and remediation through powdered activated carbon dosing. Water Res.. 2014;63:112-124.
- [Google Scholar]
- Chemical description of extracellular polymers: implication on activated sludge floc structure. Water Sci. Technol.. 1998;38(8–9):45-53.
- [Google Scholar]
- Membrane fouling in membrane bioreactors—characterisation, contradictions, cause and cures. J. Membr. Sci.. 2010;363(1–2):1-28.
- [Google Scholar]
- Replacement of chemical oxygen demand (COD) with total organic carbon (TOC) for monitoring wastewater treatment performance to minimize disposal of toxic analytical waste. J. Environ. Sci. Health Part A. 2010;45(12):1595-1600.
- [Google Scholar]
- Colorimetric method for determination of sugars and related substances. Anal. Chem.. 1956;28(3):350-356.
- [Google Scholar]
- Bioflocculation of Wastewater Organic Matter at Short Retention Times. Wageningen University; 2014.
- Extraction of extracellular polymers from activated sludge using a cation exchange resin. Water Res.. 1996;30(8):1749-1758.
- [Google Scholar]
- Membrane fouling control in ultrafiltration technology for drinking water production: a review. Desalination. 2011;272(1–3):1-8.
- [Google Scholar]
- Biomass characteristics and their effect on membrane bioreactor fouling. Molecules. 2019;24(16):2867.
- [Google Scholar]
- Membrane bioreactors–a review on recent developments in energy reduction, fouling control, novel configurations, LCA and market prospects. J. Membr. Sci.. 2017;527:207-227.
- [Google Scholar]
- A novel insight into membrane fouling mechanism regarding gel layer filtration: Flory-Huggins based filtration mechanism. Sci. Rep.. 2016;6(1):1-9.
- [Google Scholar]
- A review of membrane fouling and its control in algal-related membrane processes. Bioresour. Technol.. 2018;264:343-358.
- [Google Scholar]
- Extraction of extracellular polymeric substances (EPS) of sludges. J. Biotechnol.. 2002;95(3):249-256.
- [Google Scholar]
- Characteristics and influencing factors of organic fouling in forward osmosis operation for wastewater applications: A comprehensive review. Environ. Int.. 2019;129:164-184.
- [Google Scholar]
- Effects of COD/N ratio on soluble microbial products in effluent from sequencing batch reactors and subsequent membrane fouling. Water Res.. 2018;134:13-21.
- [Google Scholar]
- Maletskyi, Z., 2020. Advances in Membrane Materials and Processes for Water and Wastewater Treatment Multidisciplinary Advances in Efficient Separation Processes (pp. 3-35): ACS Publications.
- Interplay between physical cleaning, membrane pore size and fluid rheology during the evolution of fouling in membrane bioreactors. Water Res.. 2018;147:393-402.
- [Google Scholar]
- Effect of filamentous bacteria on membrane fouling in submerged membrane bioreactor. J. Membr. Sci.. 2006;272(1–2):161-168.
- [Google Scholar]
- Characterization of EPS compositions and microbial community in an Anammox SBBR system treating landfill leachate. Bioresour. Technol.. 2018;249:108-116.
- [Google Scholar]
- Mechanisms of microbial community structure and biofouling shifts under multivalent cations stress in membrane bioreactors. J. Hazard. Mater.. 2017;327:89-96.
- [Google Scholar]
- Ion chromatography as a reference method for determination of inorganic ions in water and wastewater. Crit. Rev. Anal. Chem.. 2006;36(2):107-127.
- [Google Scholar]
- What rights and whose responsibilities in water? Revisiting the purpose and reassessing the value of water services tariffs. Utilities Policy. 2020;63:101016
- [Google Scholar]
- Sub-critical flux fouling in membrane bioreactors – a review of recent literature. Desalination. 2005;174(3):221-230.
- [Google Scholar]
- Enhanced exopolymer production and chromium stabilization in Pseudomonas putida unsaturated biofilms. Appl. Environ. Microbiol.. 2006;72(3):1988-1996.
- [Google Scholar]
- Colanic acid is an exopolysaccharide common to many enterobacteria isolated from paper-machine slimes. J. Ind. Microbiol. Biotechnol.. 2006;33(5):359.
- [Google Scholar]
- Characterization, structure, and function of extracellular polymeric substances (EPS) of microbial biofilm in biological wastewater treatment systems: a review. Desalin. Water Treat.. 2016;57(35):16220-16237.
- [Google Scholar]
- Shannon, M.A., Bohn, P.W., Elimelech, M., Georgiadis, J.G., Marinas, B.J., Mayes, A.M., 2010. Science and technology for water purification in the coming decades. Nanoscience And Technology: A Collection of Reviews from Nature Journals (pp. 337-346): World Scientific.
- Fouling and cleaning of ultrafiltration membranes: a review. J. Water Process Eng.. 2014;1:121-138.
- [Google Scholar]
- Evaluation of soluble microbial products (SMP) on membrane fouling in membrane bioreactors (MBRs) at the fractional and overall level: a review. Rev. Environ. Sci. Bio/Technol.. 2018;17(1):71-85.
- [Google Scholar]
- Cation exchange membrane behaviour of extracellular polymeric substances (EPS) in salt adapted granular sludge. Water Res.. 2020;178:115855
- [Google Scholar]
- The Brand New Idea of Disposable Bioreactor Production in the Hungarian Laboratory Market (A Case Study for Exponential Marketing Strategy) In: Paper presented at the Proceedings of FIKUSZ Symposium for Young Researchers. 2019.
- [Google Scholar]
- Effect of free calcium concentration and ionic strength on alginate fouling in cross-flow membrane filtration. J. Membr. Sci.. 2009;345(1–2):207-216.
- [Google Scholar]
- Membrane fouling in a submerged membrane bioreactor (MBR) under sub-critical flux operation: membrane foulant and gel layer characterization. J. Membr. Sci.. 2008;325(1):238-244.
- [Google Scholar]
- Characterization of protein–polysaccharide ratios on membrane fouling. Desalination. 2010;259(1–3):11-16.
- [Google Scholar]
- Comparison of water-soluble inorganic ions and trace metals in PM2. 5 between online and offline measurements in Beijing during winter. Atmos. Pollut. Res.. 2019;10(6):1755-1765.
- [Google Scholar]
- Membrane fouling in aerobic granular sludge (AGS)-membrane bioreactor (MBR): effect of AGS size. Water Res.. 2019;157:445-453.
- [Google Scholar]
- Aerobic granular sludge (AGS) scouring to mitigate membrane fouling: performance, hydrodynamic mechanism and contribution quantification model. Water Res.. 2021;188:116518
- [Google Scholar]
- Gravity-driven biomimetic membrane (GDBM): An ecological water treatment technology for water purification in the open natural water system. Chem. Eng. J.. 2020;399:125650
- [Google Scholar]
Appendix A
Supplementary material
Supplementary data to this article can be found online at https://doi.org/10.1016/j.arabjc.2021.103526.
Appendix A
Supplementary material
The following are the Supplementary data to this article:Supplementary data 1
Supplementary data 1


