

Translate this page into:
Influence of extractions on physicochemical characterization and bioactivity of Piper nigrum oils: Study on the non-isothermal decomposition kinetic
⁎Corresponding authors at: Institute of Chemical Technology, Vietnam Academy of Science and Technology, Ho Chi Minh City, Viet Nam (T.D. Nguyen). truong.nguyen@ttu.edu.vn (Dinh-Truong Nguyen), nguyenthanhdanh3@duytan.edu.vn (Thanh-Danh Nguyen) danh5463bd@yahoo.com (Thanh-Danh Nguyen)
-
Received: ,
Accepted: ,
This article was originally published by Elsevier and was migrated to Scientific Scholar after the change of Publisher.
Peer review under responsibility of King Saud University.
Abstract
Black pepper oils have been investigated frequently in the recent years. However, there is a significant variation in physicochemical properties and bioactivity of oils depended on extraction techniques. In this study, the systemic investigation of four various extraction methods was performed to evaluate the physicochemical characterizations, antioxidant and antibacterial activity. The investigation of 1H NMR, FTIR and UV–Vis spectra confirmed presence of non-volatile components in oils extracted through supercritical CO2 and hexane-soaking extractions which induced their typical thermal properties. The isothermal behaviour of extracted oils related to evaporation was within range of 3.2–7.3% (w/w) at 27 °C. The SEM images of the black pepper confirmed different operation manners of mechanism between extractions using the solvents and heating process. The lowest MIC for both essential oils from conventional hidrodistillation and microwave-assisted hidrodistillation against two bacteria including E. coli and B. subtilis were found to be 137 µg mL−1. The non-isothermal decomposition kinetics were investigated on the essential oil of microwave-assisted hydrodistillation extraction. The activation energies and pre-exponent factors of non-isothermal decomposition were found to be in range of 36.5–73.7 KJ mol−1 and 4.98 × 10³–1.97 × 10⁸ s−1, respectively, dependent on conversional fractions of the oil. The results revealed that chemical components, physicochemical properties and bioactivity of black pepper essential oils depended on the extraction techniques.
Keywords
Black pepper
Essential oil
Extraction
Antimicrobial activity
Non-isothermal decomposition kinetic

- EO
-
Essential Oil
- HDEO
-
Hydrodistillation Essential Oil
- MAEO
-
Microwave-assisted hydrodistillation Essential Oil
- SCEO
-
Supercritical carbon dioxide Essential Oil
- HEEO
-
Hexane-soaking Essential Oil
- HDBP
-
Hydrodistillation black pepper
- MABP
-
Microwave-assisted hydrodistillation black pepper
- SCBP
-
Supercritical carbon dioxide black pepper
- HEBP
-
Hexane-soaking black pepper
- EC50
-
Half maximal effective concentration
- IC50
-
Half maximal inhibitory concentration
- RI
-
Retention index
- DPPH
-
1,1-diphenyl-2-pycrylhydrazile
- TGA
-
thermogravimetric analysis
- DSC
-
differential scanning calorimetry
- Ea
-
Activation Energy
- FWO
-
Flynn-Wall-Ozawa
- KAS
-
Kissinger-Akahira-Sunose
Abbreviations
1 Introduction
Essential oils (EOs) which are defined as secondary metabolites from various organs of plants have long been used in traditional medicine due to therapeutic and preservative properties (Freitas and Cattelan, 2018). The chemical profiles and pharmaceutical properties of EOs can vary in quantity, quality and components according to climate, age of plant, geographical location and extraction methods (Bakkali et al., 2008). Several techniques have been employed to obtain EOs from the aromatic plant such as steam distillation, expression under pressure, supercritical fluid and microwave-assisted extractions, etc. Recent trends have focused on green extraction techniques and toward a cost-effective production of high-quality EOs (Baptista-Silva et al., 2020).
Black pepper, Piper nigrum belong to family of Piperaceae is known as an industrial crop species grown popularly in tropical regions including India and South Asia. The black pepper fruits can be used not only for the flavour spice and traditional medicine but also for insecticides and cosmetic industry (Jaramillo and Manos, 2001; Ahmad et al., 2012). The plant is one of the most abundant herbal spices in Vietnam and used as a traditional seasoning. It is inexpensive and available for low socioeconomic population (Kaefer and Milner, 2008; Tran et al., 2019). Thus, the black pepper essential oil (EO) is significantly considered for studies on potential bioactivity (Kamble and Patil, 2008; Sangha et al., 2017; Li et al., 2020). However, its bioactivity is depended on the particular cultivar and the geographical location (Meghwal and Goswami, 2013).
There have been numerous studies on the essential oils of the black pepper fruit. The main compounds presenting in the black pepper oil included piperine, β-pinene, 3-carene, limonene, sabinene and β-caryophyllene have been reported in literature. Content of each components is dependent on the extraction techniques (Bakha et al., 2020; Zhao et al., 2020). Wang and coworkers (2018) reported that the oil from ultrasonic-microwave assisted extraction possessed 3-carene (33%) and limonene (19%) as abundant compounds and their free radical scavenging activity varied by the extraction conditions. Bagheri et al. (2014) have found β-caryophyllene, limonene and sabinene as the major volatile compounds in EOs extracted by hydrodistillation and supercritical CO2 extractions. The antioxidant activity of EO extracted by supercritical CO2 (EC50 = 103.3 µg mL−1) was higher than that of hydrodistillation (EC50 = 316.2 µg mL−1). Grinevicius and coworkers (2017) reported that the major volatile components of the pepper oils obtained by supercritical CO2 extraction included piperine (32.1–60.4%), caryophyllene (20.1–45.3%) and β-copaene (4.3–8.9%). There is a significant variation in chemical compositions, physical properties and bioactivity of oils extracted by different techniques. However, the effect of the extraction technique on chemical composition, physical properties and bioactivity of the oils has not been studied systematically so far.
On the other hand, Nisha et al. (2009) have investigated the decomposition kinetics of black pepper flavor at isothermal and non-isothermal conditions using cooking methods at the constant gas flow. This work had important significance in evaluation of temperature influence on the evaporation of the flavor during use of the black pepper as food. In this work, the physicochemical characterizations and bioactivity of the black pepper oils obtained by four different extraction methods including hydrodistillation (HDEO), microwave-assisted hydrodistillation (MAEO), supercritical carbon dioxide (SCEO) and hexane-soaking (HEEO) have been evaluated. The non-isothermal decomposition kinetics of MAEO are investigated by using iso-conversional models which were calculated from the TGA data.
2 Experimental
2.1 Plant materials and chemical reagents
Hexane and anhydrous Na2SO4 were purchased from Acros (Belgium). Distilled water was used throughout. Pepper fruits purchased in Ho Chi Minh City were dried in air atmosphere and well grinded with particle size of 0.5–1.0 mm by using an electronic blender.
2.2 Extraction of essential oils
2.2.1 Conventional hydrodistillation
Each sample of ground dry material (100 g) were charged into 1000 mL Clevenger apparatus. Distillated water (500 mL) was added into each sample. The mixture was refluxed for 4 h. The hydrodistilltion essential oil (HDEO) were separated from mixture and dried in anhydrous Na2SO4.
2.2.2 Microwave-assisted hydrodistillation
Microwave-assisted hydrodistillation extraction was performed employing a modified domestic microwave oven, (SANYO EM-G205AW). Dry material (100 g) was added to distilled water (500 mL) into a ground bottom flask-1000 mL assembled with a Clevenger trap positioned outside. The essential oil (MAEO) were obtained by microwave irradiation at the power level of 500 W for 1 h after dried in anhydrous Na2SO4.
2.2.3 Supercritical CO2 extraction
The supercritical CO2 method was carried out according to Perakis et al. (2005). Briefly, ground dry material (500 g) was charged into a high pressure vessel (2000 mL) connected with the separators operating up to 200 bar. The extraction was performed at 40 °C and 100 bar in supercritical CO2 flow rate of 0.5 g/min. After reducing pressure, the CO2 and essential oil (SCEO) were separated. All EOs were stored at 0–5 °C for further studies.
2.2.4 Hexane extraction
The dry material (100 g) was soaked in n-hexane (300 mL) for 24 h at room temperature. The extract was filtered and HEEO was obtained by concentrating under vacuum at 45 °C.
2.3 GC and GC-MS analysis
Gas chromatography (GC) and Gas chromatography - mass spectrometer (GC-MS) measurements were carried out as previous report (Nguyen et al., 2018). Briefly, the EOs (25 µL) were analyzed on GC (Agilent 6890 N) coupled with HP-5MS Capillary Column (30.0 length × 0.25 mm i.d. × 0.25 μm film thickness). The temperature program was carried out from 50 to 150 °C at the rate of 5 °C min−1, from 150 − 200 °C at the rate of 3 °C min−1, from 200 to 280 °C at the rate of 10 °C min−1 and kept at 280 °C for 20 min. The retention index was calculated on the basis of a standard sample containing homologous series of n-alkanes (C8-C30, Sigma Co.). To identify the essential oils, their retention index was compared with the published data (Adams, 2007). For GC analysis, essential oils were also injected to Agilent 6890 N GC with a HP-5MS column fitted with FID detector in conditions equal to GC–MS analysis.
2.4 Measurements
The EOs diluted in hexane were used to measure ultraviolet–visible (UV–Vis) absorption spectra (UV–Vis JASCO V-630 spectrophotometer). A BRUKER EQUINOX 55 IR spectrophotometer was used to measure infrared spectra. 1H NMR (BRUKER AVANCE 500 NMR spectrometer) was recorded by using CDCl3 as solvent and tetramethylsilane (TMS) as internal standard. Thermoanalyzer (TGA/DSC 3 + Mettler-Toledo, USA) was used for simultaneous thermal analysis combining thermogravimetric analysis (TGA) and differential scanning calorimetry (DSC), temperatures range 30–600 °C with a different heating rate in the air flow at 20 mL min−1. Isothermal volatilization of the essential oils utilized TGA measurement in the air flow at 20 mL min−1 from 27 °C for 120 min. Surface morphology of the spent pepper solids was evaluated by using a microscope and scanning electron microscope (SEM, S-4800 HI-9057-0006).
2.5 Antioxidant assay
Antioxidant activity of EOs was determined according to 1,1-diphenyl-2-pycrylhydrazile (DPPH) radical scavenging method (Nguyen et al., 2018). Briefly, Four EO samples diluted with different concentrations was mixed with DPPH solution (0.2 mM) in methanol. The mixture then was incubated at room temperature in dark for 20 min and absorbance was measured at 517 nm. Vitamin C (ascorbic acid) purchased from Sigma (USA) was used as a standard antioxidant. Reducing absorbance of the mixture revealed the free radical scavenging. IC50 values (μg/mL) which were expressed as the sample concentration required for the half decrease in absorbance of the blank sample was used to evaluate the antioxidant activity of the essential oils.
2.6 Antibacterial assay
The antibacterial activity of EOs was evaluated via the disk diffusion method (Nguyen et al., 2018). A Gram-positive bacterium (Bacillus subtilis) and a Gram-negative bacterium (Escherichia coli) procured originally from School of Biotechnology, Tan Tao University, Vietnam, were used for biotests. The standard antibiotic ampicillin (0.01 mg/mL) was used as a positive control and Luria Bertani broth was used as a negative control. The inoculated disks were incubated at 37 °C and diameters of inhibition zone around the paper disks in millimeter was recorded after 12 h.
2.7 Non-isothermal decomposition kinetic study
Non-isothermal kinetic of EOs was analysed using isoconversional method. This method based on free models allows the determination of parameters such as activation energy (Ea) and pre-exponential factor (A). The activation energy is identified as energy needed to provide for a chemical reaction to take place (Rueda-Ordóñez and Tannous, 2015). It is also known as the potential barrier to break the bonds among molecules creating an active transition-state complex. The pre-exponential factor is known as the number of collisions per unit time in obtaining the proper orientation to react.
In this work, the sample of MAEO was selected to investigate non-isothermal decomposition kinetics. The thermal decomposition of EO is carried out at varied heating rates (10, 15, 20 and 25 K min−1). Each samples (25 mg) was measured under air atmosphere at a flow rate of 20 mL min−1. The conversional fraction is defined as the mass fraction of degraded sample as shown in the Eq. (1).
The integral form of reaction model is often used to perform kinetic calculations.
According to the non-isothermal model free methods, evaluation of activation energy is based on the iso-conversional rate which is only dependent on reaction temperature. Thus, the reaction rate at a specific conversional value (α) for a certain heating rate (β) is a function of temperature (T) while model reaction (f(α)) remains unchanged. In this work, two integral iso-conversional methods including Flynn-Wall-Ozawa (FWO), Kissinger-Akahira-Sunose (KAS) and a differential iso-conversional method namely Friedman were used to determine activation energy of thermal decomposition from the TGA data while Kissinger method was used to calculate values of pre-exponential factor (A).
2.7.1 Integral iso-conversional methods
Flynn-Wall-Ozawa (FWO) method (Flynn, 1997) is obtained by integrating Eq. (5) and implementing Doyle’s approximation to the temperature integral (Doyle, 1962).
For each corresponding values of α, each pairs of ln β and 1/T data point from four different heating rates were plotted and fitted to a linear model. The values of Ea were consequently calculated from the slope of relating straight lines.
Kissinger-Akahira-Sunose (KAS) method (Akahira and Sunose, 1971) determined Ea values based on approximation given by Murray and White (Murray and White, 1955) via Eq. (7).
Value of Ea could be calculated from Eq. (7) by determining the slope of pairs of ln (β/T2) and 1/T plotted for each corresponding value of α.
2.7.2 Differential iso-conversional methods
Friedman method (Friedman, 1964) is the simplest type of iso-conversional method and the most widely used for non-thermal kinetic analysis, derived by taking the logarithm for both sides of Equation (4). The Friedman equation is expressed as follows,
The combination between (3) and (8) can derive Eq. (9)
For each corresponding values of α, value of Ea could be calculated from Eq. (9) by determining the slope of pairs of ln (βdα/dT) and 1/T plotted.
2.7.3 Determination of pre-exponential factor
Although the mentioned iso-conversional methods could provide an accurate way to calculate Ea, the reaction model or pre-exponential factor (A) of decomposition could not be obtained. Kissinger method was a useful tool to determine both of Ea and A through the equation given as,
3 Results and discussion
3.1 Comparative analysis of physicochemical properties
3.1.1 Volatile compositions of essential oils
The components of EOs from different extractions were determined by GC-MS methods. There are significant differences in the yields and the components. The yield of EOs obtained in order of hexane (3.60 ± 0.05%), superficial CO2 (3.10 ± 0.05%), HD (2.70 ± 0.03%) and MW (2.10 ± 0.03%). In spite of the highest yield of hexane extract, some solids are precipitated during the storage process. It can be due to aggregation of compounds with high molecular mass such as fatty acids and steroids (Hoerr and Harwood, 1951; Peng et al., 2001). The HD and MA extractions obtain EOs with a high volatility. Meanwhile, the advantages of extraction using superficial CO2 are not only reduced usage of organic solvents with potential risk of storage but obtained a high yield of essential oils with high volatility.
The results of compositional analysis are shown in Table 1. The relative percentage content of compounds was calculated by area integration method from GC and GC-MS data and the results are expressed retention index and percentage values. A total of 25 identifiable volatile compounds are found in all samples. It is clear that the major components identified in P. nigrum EOs are dependent on the extraction methods. Hydrocarbons were identified as the abundant composition in all EOs. The content of volatile component that cannot be identified from GC-MS data is the highest in HEEO sample with 16.7% while non-identifiable component in samples MAEO and CSEO is only 1.0% and 0.6%, respectively. GC data of the non-identifiable volatile components in HEEO find at high retention time which can relate to the compounds possessing the high boiling point. The major compounds found in both samples, CSEO and HEEO, are similar to dominate content of sesquiterpenes. CSEO showed β-caryophyllene (48.4%), 3-carene (12.1%), d-limonene (10.8%), β-pinene (5%), copaene (4.8%), δ-3-elemene (4.6%), humulene (2.4%) while the major volatile compounds in HEEO consist of β-caryophyllene (38.0%), d-limonene (8.8%), 3-carene (8.4%), piperine (5.7%), copaene (3.9%), β-pinene (3.8%), δ-3-elemene (3.1%), humulene (2.1%). β-Caryophyllene are known as a natural bicyclic sesquiterpene possessed many valuable bioactivities including anti-inflammatory and anticancer. The analysis shows that the method using supercriticial CO2 is not only obtained very high content of β-caryophyllene but excluded piperine which is responsible for pungency of the pepper (Gorgani et al., 2017). Recently, supercriticial CO2 extraction (Grinevicius et al., 2017) obtained different contents of β-caryophyllene (20.06–45.27%) depending on relative extraction conditions.
No
Compounds
RIa
RIb
% GC
Method
HDEO
MAEO
SCEO
HEEO
1
α-thujene
925
924
0.1
–
–
–
RI, MS
2
α-pinene
932
931
7.1
4.8
2.2
1.6
RI, MS
3
Camphene
949
946
0.2
–
–
–
RI, MS
4
Sabinene
973
970
0.4
0.4
–
0.2
RI, MS
5
β-pinene
974
974
12.7
10.4
5.0
3.8
RI, MS
6
β-myrcene
988
988
2.5
2.1
1.1
0.8
RI, MS
7
α-phellandrene
1003
1002
5.2
2.7
2.1
1.6
RI, MS
8
3-carene
1010
1008
21.6
21.5
12.1
8.4
RI, MS
9
o-cymene
1026
1022
1.0
1.5
0.5
0.2
RI, MS
10
D-limonene
1030
1036
21.6
20.5
10.8
8.8
RI, MS
11
terpinolene
1090
1083
0.3
0.2
–
–
RI, MS
12
β-linalool
1095
1097
–
0.3
–
–
RI, MS
13
δ-3-elemene
1333
1333
1.5
1.1
4.6
3.1
RI, MS
14
α-cubebene
1349
1346
–
–
0.2
–
RI, MS
15
copaene
1376
1373
1.6
2.5
4.8
3.9
RI, MS
16
β-cubebene
1388
1386
0.2
0.2
0.6
0.5
RI, MS
17
β-elemene
1389
1388
0.3
0.5
0.8
0.8
RI, MS
18
β-caryophyllene
1418
1418
17.6
26.5
48.4
38.0
RI, MS
19
humulene
1452
1450
0.9
1.4
2.4
2.1
RI, MS
20
germacrene D
1480
1478
–
–
0.2
0.3
RI, MS
21
β-selinene
1483
1484
–
0.5
0.5
0.7
RI, MS
22
α-selinene
1494
1492
–
0.4
0.4
0.7
RI, MS
23
δ-cadinene
1519
1518
0.5
0.8
1.4
1.6
RI, MS
24
caryophyllene oxide
1578
1579
–
1.1
0.9
0.5
RI, MS
25
piperine
2933
2912
–
–
–
5.7
RI, MS
Class of substance:
Monoterpenes
72.7
64.4
33.8
25.4
Hydrocarbons
72.772.7
64.1
33.8
25.4
Alcohols
–
0.3
–
–
Sesquiterpenes
22.6
35.0
65.2
52.2
Hydrocarbons
22.6
33.9
64.3
51.7
EpoxyEpoxy
–
1.1
0.9
0.5
Alkaloids
–
–
–
5.7
Not identified
4.7
0.6
1.0
16.7
The major components of both MAEO and HDEO identified are monoterpenes. The volatile compounds of MAEO also showed a high content of β-caryophyllene (26.5%), 3-carene (21.5%) and d-limonene (20.5%), followed by β-pinene (10.4%), α-pinene (4.8%), α-phellandrene (2.7%) and copaene (2.5%). These compounds found in HDEO were d-limonene (21.6%), 3-carene (21.6%), β-caryophyllene (17.6%), β-pinene (12.7%), α-pinene (7.1%) and α-phellandrene (5.2%). The previous report showed similarly major compositions including β-caryophyllene (13.0–33.4%), 3-carene (23.1–33.2%) and d-limonene (15.9–23.2%) from microwave-assisted extraction (Wang et al., 2018).
3.1.2 1H NMR analysis
Fig. 1 shows 1H NMR spectra for all pepper essential oils. Similar signals are observed for each respective pairs of essential oils including HDEO and MAEO; SCEO and HEEO. Due to abundance of hydrocarbons in EOs, relative signals of all spectra are concentrated in resonance area of 0.5–2.5 ppm and 4.6–5.8 ppm which are respectively assigned to the methylene protons of saturated and unsaturated fatty chains and protons of double bond (C⚌C). These protons of β-caryophyllene presented in all EOs are observed at two intense peaks of 1.0 ppm and 5.1 ppm while d-limonene is found at two relative peaks of 1.7 ppm and 5.4 ppm (Grau and Mecking, 2013; Carbajal-Valdez et al., 2017). The intense peaks at 0.6 ppm and 1.6 ppm represented for protons of methyl groups in 3-carene molecule (Utenkova et al., 2017). Particularly, two samples, SCEO and HEEO appear some peaks at around 3.2–3.6 ppm and 6.0–7.5 ppm which characterize for methylene protons binding with specifically functional groups e.g. OH and NH, and protons of aromatic compounds, respectively (Hatzakis, 2019). This result reveals the presence of non-identifiable volatile compounds or/and non-volatile compounds which could not be identified by GC-MS method. It is clear that the extraction using solvents including supercritical CO2 and hexane can destruct plant cell leading to release of many phytochemicals into the extraction solvent.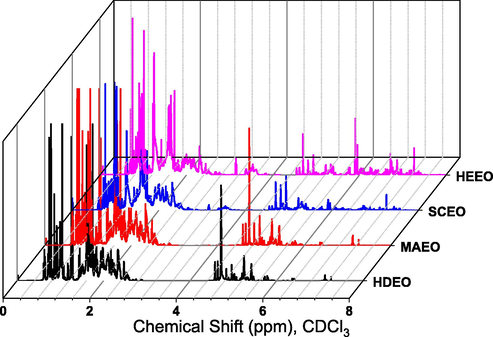
1H NMR spectra (500 MHz, CDCl3) of essential oils extracted by different methods.
3.1.3 FTIR analysis
FTIR spectra for all oils are shown in Fig. 2. The typical absorption bands of the oils are similar, excepted in HEEO. The characteristic peaks at around 2960 and 2860 cm−1 are assigned to asymmetrical and symmetrical stretching vibrations of the aliphatic methylene groups. The hydrocarbons in all oils including β-caryophyllene, d-limonene, 3-carene, α-pinene, β-pinene and the others are characterized by intense bands at 1640 cm−1, 1440 cm−1 and 885 cm−1 corresponding to stretching and bending vibrations of the C—C, C⚌C, and C—H bonds, respectively (Tongnuanchan et al., 2012; Dang and Nguyen, 2019). In particular, although the volatile compositions of HEEO are not so different from the others (Table 1), some of the typical peaks appear in its spectrum. The sharp bands appearing at 1735 cm−1 and 1251 cm−1 respectively correspond to stretching vibration of carbonyl (C⚌O) and C—O groups relating esters of fatty acids and/or ketones that are well-dissolved in the hexane solvent during soaking process (Fleming and Williams, 2019). The peak at 1502 cm−1 associates to stretching vibration of aromatic rings that are also confirmed from 1H NMR data.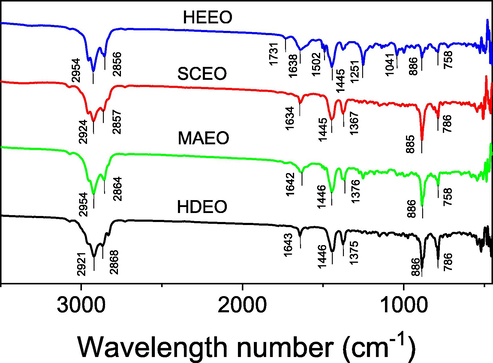
FTIR spectra of essential oils extracted by different methods.
3.1.4 UV–Vis spectroscopy
The UV–Vis spectra of pepper oils are shown in Fig. 3. The spectra of all extracted oils were measured using hexane as a solvent in the wavelength region of 200–400 nm. All oils show a broad absorbance peak in region of 245–300 nm which relates to the energy gap for π -π* transitions of double bond (C⚌C) in hydrocarbons. Both the oils, HDEO and MAEO show a maximum peak at 261 nm while the peak at 256 nm is observed for SCEO and HEEO. Moreover, the appearance of broad peaks in region of 315–390 nm is observed for both oils, SCEO and HEEO. It is assigned to the absorption of n-π* transitions in these oils. Two weak peaks at 338 and 352 nm can relate to aromatic compounds that cannot identify in the relative oils by GC-MS method. Additionally, value of absorbance at these peaks in HEEO is higher than the absorbance in SCEO, indicating that HEEO contains greater content of non-identifiable compounds which is confirmed from NMR and FTIR data.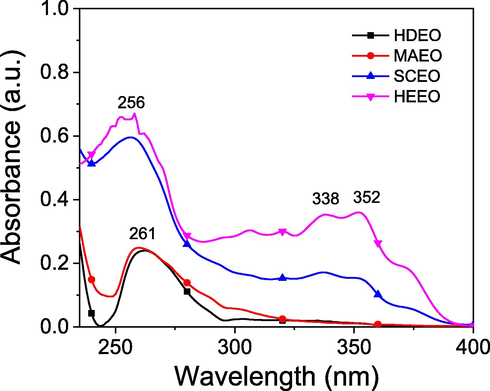
UV–Vis spectra of essential oils extracted from different methods.
3.1.5 Isothermal volatilization
Isothermal volatilization at room temperature is an important fragrant property for use of EOs as the scent essences. Proper understanding of the EO evaporation allows effective application of EO in the real life. Isothermal analysis of EO at room temperature can be evaluated by TGA measurement that investigates changes in the sample weight as a function of exposition time. In this study, the TGA measurement was carried out at 27 °C for 2 h in air flow rate of 20 mL min−1. The results are shown in Fig. 4. The TGA curves show that the weight loss is in range of 3.2–7.3% and it is dependent on the extraction of EO. Evaporation of SCEO is as low as 3.2% whereas the evaporation percentages of MAEO and HEEO are around 7.0%. Moreover, the evaporation behaviour of EOs is similar, excepted HEEO. TGA data of three the samples, HDEO, MAEO and SCEO showed a linear function of the weight loss according to exposition time which probably relates to zero order of the evaporation (Rosbrugh et al., 2000). The similar results have been observed in the previous reports on the other EOs (Le et al., 2020; Nguyen et al., 2018). Increase of evaporation rate is found in order of SCEO, HDEO and MAEO. Particularly, the weight loss rate of HEEO is observed as a quadratic function of time that showed a reaction order of the evaporation above zero. An exponential equation (R2 = 99.99) found after fitting process is y = 7.65*exp(-t/41.0) + 92.2; where y is loss weight; t is exposition time (min). The typical evaporation behaviour of HEEO can be because the presence of non-volatile molecules induces interruption with volatile molecules during evaporation process which may lead to the reaction order above zero. The evaporation of the pepper EOs is appreciably greater than Cinnamomum cassia EOs but lower than that of Citrus microcarpa EOs (Le et al., 2020; Nguyen et al., 2018).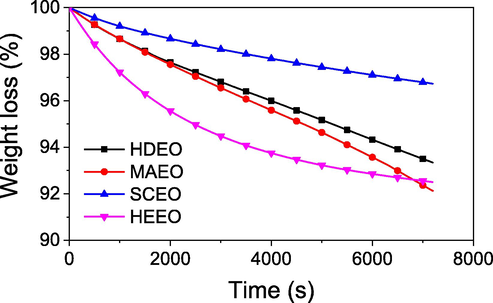
Isothermal property of essential oils using TGA measurement at 27 °C for 2 h.
3.1.6 Thermal behaviour
The thermal behaviour of EOs was evaluated by using simultaneous measurement of TGA and DSC in range of 30–500 °C at heating rate of 10 °C. The results are illustrated in Fig. 5 and the thermal data are listed in Table 2. The difference of thermal profiles is observed for the various oils. TGA curves of all samples showed that the thermal stability of all oils is above 70 °C and mass loss of 5% is around 115 °C. It allows the EOs used as a seasoning in the food technology with insignificant mass change. The difference of the thermal property is observed at region of high temperature (above 150 °C). The TGA curves of HDEO and MAEO showed a single stage of mass loss according to increase of heating temperature. The weight of HDEO (98.1%) and MAEO (96.8%) is almost completely lost at Td values of 232 °C and 242 °C, respectively. The simultaneous DSC data showed the endothermic peaks of 180 °C for HDEO and 184 °C for MWEO that correspond to evaporation of relative EOs. The complete evaporation at the low temperature region reveals that these EOs abundantly contain the volatile compounds. Although Td value of overall mass loss in SCEO (251 °C) is not so different comparing with the values of HDEO and MWEO, a slower mass loss process is obviously observed from TGA curve of CSEO. The half of sample weight loss at 217 °C is found for CSEO while the much lower temperature (∼190 °C) are observed for both HDEO and MAEO. An endothermic peak at 234 °C found for SCEO can also relate to evaporation of the volatile compounds in this EO. A special thermal profile of HEEO can be seen from Fig. 5. The mass loss of this EO with increasing heating temperature obviously occurs in two stages of TGA curve. Only 48.1% of sample weight lost in temperature region of 70–258 °C corresponds to an endothermic peak at 179 °C in the first stage. The second stage in temperature region of 258–460 °C with a loss weight of 47.2% relates to an exothermic peak at 381 °C which may be attributed to oxidation of organic compounds in the sample. The difference in thermal profiles among EOs can be because difference in their compositions of volatile and/or non-volatile compounds which is in agreement with 1H NMR, FTIR and absorption analysis.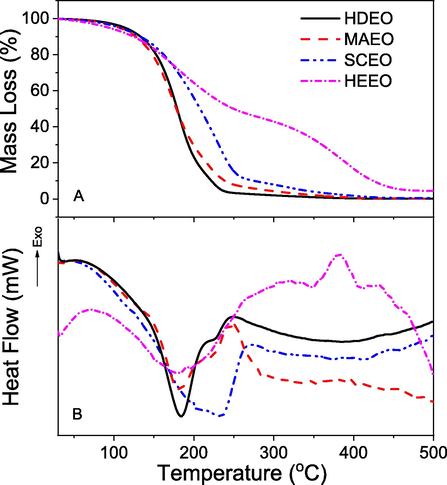
Thermogravimetric analysis (A) and differential scanning calorimetry (B) of essential oils extracted from different methods.
Samples
Variables
Stages or Peaksa
First
Second
HDEO
Td (°C)/mloss (%)
70–232/98.1
–
TDSC (°C)
184 (endothermic)
–
MWEO
Td (°C)/mloss (%)
72–242/96.8
–
TDSC (°C)
180 (endothermic)
–
SCEO
Td (°C)/mloss (%)
70–251/85.1
251–410/14.4
TDSC (°C)
234 (endothermic)
HEEO
Td (°C)/mloss (%)
70–258/48.1
258–460/47.2
TDSC (°C)
179 (endothermic)
381 (exothermic)
3.2 Influence of extractions on spent black pepper
3.2.1 Surface morphology
Raman and Gaikar (2002) reported the mechanism of piperine extraction from black pepper using hydrotropic compounds. They described that the solvent molecules disorganize the cellulosic cell wall after absorption process and then penetrate into the protein cell membrane, followed by release of piperine. Recently, Olalere et al. (2017) showed microwave irradiation ruptured the cell walls during oleoresin release from the black pepper. The mechanism of EO extraction can be investigated through studying surface morphology of the oil-spent black pepper. In the present work, all black peppers before and after extraction were investigated surface morphology using microscopy and SEM analysis. The images are shown in Fig. 6. The results revealed that all extraction methods induced obvious changes in the morphology of black pepper surface. Photos showed change in colors of oil-spent samples in comparison with the pre-extraction pepper. The HD and MA extractions induce black color on the pepper surface indicating carbonatation by heating process which can be obviously observed in the microsopic images while the color and surface of black pepper are insignificantly changed in extraction using the solvents (Fig. 6D & 6E). The stone-like cells can be seen clearly from SEM igmages of pre-extraction black pepper (Fig. 6A3). The size of cells is found in range of 2–6 µm. The cell wall is almost completely destroyed under heating energy in both samples of HDBP and MABP. It also shows that the rupture capability by microwave irradiation is more remarkable than that of HD extraction. Under water penetration and application of heat, cellulose cell walls are swelled and different levels of pressure inside the cell led to the reduction of surface area. Although no changes in the surface of black pepper has been recognized from the microscope images of SCBP and HEBP, destruction of the cells still is observed from the respective SEM analysis as shown in Fig. 6D3 and E3 but it seems shape of the cells maintained after the release of essential oils into the solvents. Therefore, extraction using supercritical CO2 and hexane as solvents showed operation manners different from using polar solvents and application of heating process.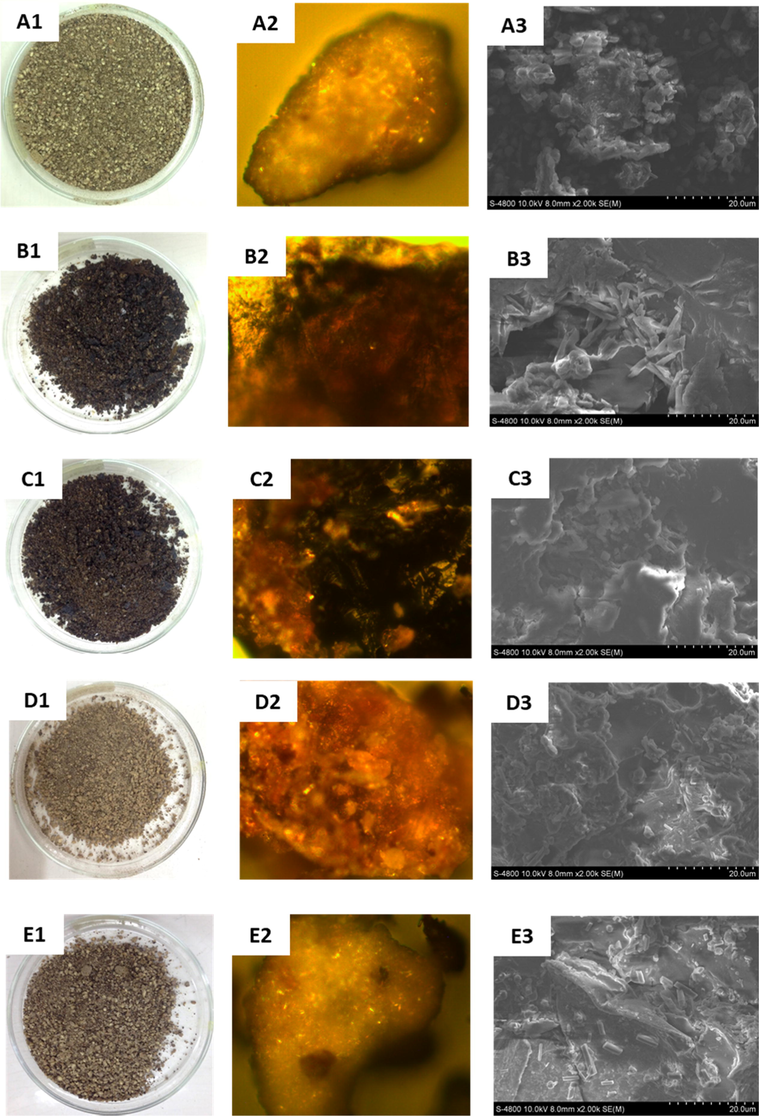
Photos (left), microscopy (middle) and FE-SEM (right) images of the pre-extraction pepper (A1-A3), extraction by hydrodistillation (B1-B3), microwave-assisted hydrodistillation (C1-C3), supercritical CO2 (D1-D3) and hexane (E1-E3).
3.2.2 Thermal properties of black peppers
To study extraction-dependent thermal properties of the spent black pepper, the pre-extraction and post-extraction solid samples were characterized by TGA measurement. The TGA curves of all peppers are shown in Fig. 7. The results showed that the thermal behaviour is slightly different among all samples. The weight loss of HDBP and MABP slower than that of the pre-extraction sample in temperature range of 30–300 °C (inset of Fig. 7) confirmed their carbonation whereas thermal behavior of SCBP and HEBP is similar to pre-extraction black pepper, indicating unambiguous change in the structure of the black peppers. Moreover, the weight of ash remained after heat process of all the post-extraction samples are remarkably greater than solid ash of the pre-extraction sample. It reveals the good extraction yields of EO for all methods.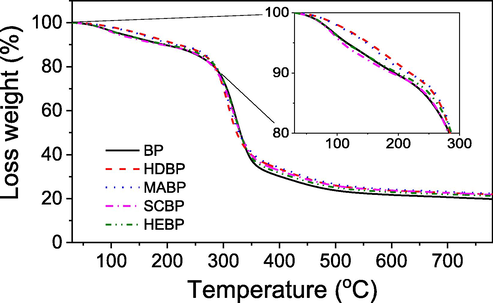
TGA curves of pre-extraction black pepper (BP), extraction by hydrodistillation (HDBP), microwave-assisted hydrodistillation (MABP), supercritical CO2 (CSBP) and hexane (HEBP).
3.3 Antioxidant assay
Extraction-dependent antioxidant activity of black pepper essential oils is described in Fig. 8. The antioxidant assay based on DPPH radical scavenging method. The SCEO shows the highest activity with IC50 value of 20.7 ± 1.5 µg/mL, followed by HEEO (22.5 ± 1.5 µg/mL), MAEO (22.8 ± 0.7 µg/mL) and HDEO (24.1 ± 1.3 µg/mL). DPPH radical scavenging ability of these oils showed the better activity in comparison with previous reports (Jeena et al., 2014; Bagheri et al., 2014). Although the antioxidant activity of all oils slightly lower than vitamin C (15.9 ± 0.4 µg/mL), these EOs can be considered as an important natural source of antioxidant reagents.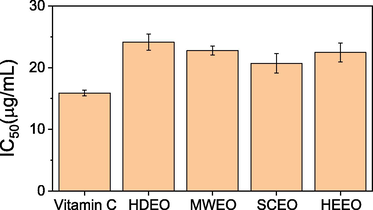
DPPH radical scavenging activity of black pepper oils.
3.4 Antibacterial assay
In order to study extraction-dependent antibacterial activity, all of the essential oils were tested against a Gram-negative, E. coli and a Gram – positive, B. cereus. The test environment and solvent (DMSO) were used as the negative control and ampicillin (1 mg mL−1) was used as the positive control. The results showed that oils extracted by using solvents (SCEO and HEEO) did not exhibit anti-bacterial activity even used pure EOs whereas HDEO and MAEO exhibited high activity against the tested bacteria. Their antibacterial activity is plotted in Fig. 9 where the different concentrations of the samples (117, 137, 164, 205 µg mL−1) are quantitatively determined by inhibition zones in millimeter. It shows that the different antibacterial activity between the EOs against the tested bacterial strains is found. MAEO showed the higher activity than HDEO in inhibition of E. coli but slightly lower in inhibition of B. cereus. It can be due to the difference in the structure of bacterial cell wall (Joe et al., 2011). Increase of inhibition zone according to the sample concentrations is observed for both bacterial strains and MIC values are found to be 137 µg mL−1 for both the essential oils. Therefore, the EOs in the present study exhibit higher activity in comparison with the recent reports (Tu et al., 2018; Gomez-Garcia et al., 2019).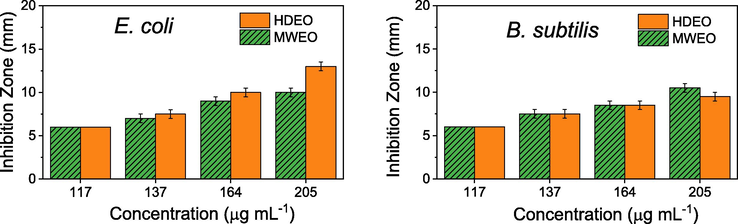
Antibacterial activity of HDEO and MWEO against E. coli and B. subtilis.
3.5 Kinetics of non-isothermal decomposition
Because HDEO and MAEO, which are obtained from the most common extraction methods, showed similar chemical composition and physicochemical properties, MAEO was selected to investigate non-isothermal decomposition kinetics in the present work. Fig. 10 shows TGA and DTG curves described the conversional fractions and time derivative against the temperature increase at four different heating rates (10, 15, 20 and 25 °C min−1). An apparent shift of TGA curves is attributed to the variation of heat flow rate inside the oil. Due to thermal lag within the oil, the higher heating rates may reduce the distribution of heat, led to the volatilization of oils at higher temperature region (Santos et al., 2011). The TGA curves show that the maximum conversional fractions take place rapidly in a temperature range of 400–500 K. A shift of temperature peaks toward the higher temperature zone with increase of heating rates is found in DTG curves which reveal the reactions taken place more rapidly at the same time. Moreover, small shoulders relating to the conversion of EO in high temperatures is also observed in conversion fraction of 0.9. Thus, conversional fractions in range of 0.1–0.8 were used to evaluate the EO decomposition kinetic. Previous researches on the non-isothermal decomposition kinetic of solids (Chong et al., 2019; Cai et al., 2018) requested the conversional range of 0.2–0.7 to avoid inaccuracy due to DTG peak tail and the moisture evaporation of solid sample. In the present work, the volatilisation kinetic evaluation of the oil can be calculated from conversional fraction of 0.1.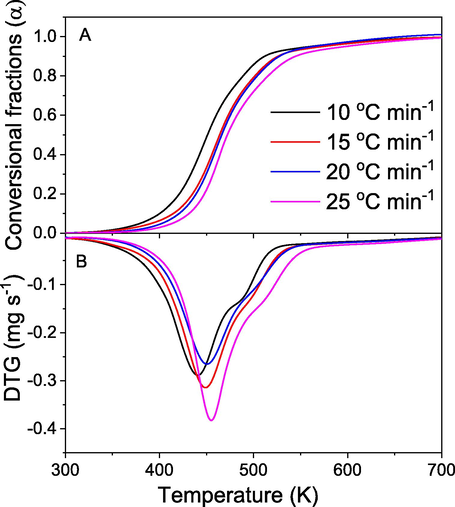
TGA (A) and DTG (B) curves of MAEO at four different heating rates.
The non-isothermal model free methods including two integral iso-conversional methods (FWO and KAS) and a differential iso-conversional method (Friedman) were utilized to determine activation energy of the non-isothermal decomposition via Eqs. (6), (7) and (9), respectively. Pre-exponential factors (A) of the non-isothermal decomposition were calculated via Kissinger method by using Eq. (10). The linear graphs for all methods are clearly observed in Fig. 11. High degree of parallelism at all conversional levels results average correlation coefficients of 0.948, 0.926 and 0.932 for FWO, KAS and Friedman, respectively (Table 3). The linearity demonstrated that these iso-conversional methods can be used to evaluate the non-isothermal kinetics of the oil.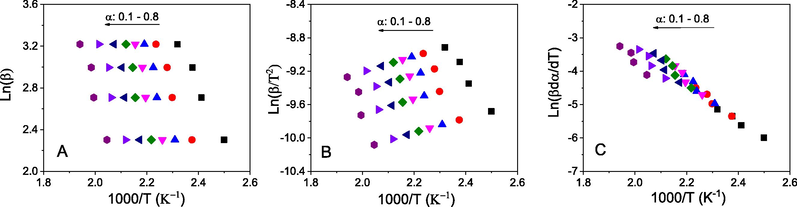
Plots of iso-conversional methods for MAEO: Flynn–Wall–Ozawa (A) and Kissinger–Akahira–Sunose (B), and Friedman (C).
α
FWO
KAS
Friedman
Ea (kJ mol−1)
A (s−1)a
R2
Ea(kJ mol−1)
A (s−1)a
R2
Ea (kJ mol−1)
A(s−1)a
R2
0.1
41.2
1.99 × 10⁴
0.980
36.5
4.98 × 10³
0.972
40.3
1.50 × 10⁴
0.978
0.2
52.9
5.67 × 10⁵
0.960
48.4
1.59 × 10⁵
0.947
51.9
4.30 × 10⁵
0.952
0.3
61.7
6.91 × 10⁶
0.942
57.6
2.13 × 10⁶
0.927
61.9
7.19 × 10⁶
0.935
0.4
68.6
4.75 × 10⁷
0.931
64.6
1.57 × 10⁷
0.916
68.6
4.77 × 10⁷
0.922
0.5
73.1
1.66 × 10⁸
0.919
69.2
5.66 × 10⁷
0.901
73.2
1.69 × 10⁸
0.910
0.6
73.7
1.97 × 10⁸
0.935
69.7
6.45 × 10⁷
0.920
73.6
1.92 × 10⁸
0.925
0.7
71.9
1.19 × 10⁸
0.935
67.6
3.56 × 10⁷
0.920
71.8
1.15 × 10⁸
0.925
0.8
71.0
9.26 × 10⁷
0.925
66.3
2.52 × 10⁷
0.905
70.2
7.42 × 10⁷
0.915
Mean
64.3
7.87 × 10⁷
0.948
60.0
2.50 × 10⁷
0.926
63.9
7.57 × 10⁷
0.932
Plots of Eα and Aα versus α are shown in Fig. 12. It is clear that values of Ea change along with different conversional fractions indicated a complex process with a multi-step mechanism during volatilisation of oil molecules. The lowest activation energy is found at α = 0.1. It is steadily increased with values of α and achieved a maximum Eα at α = 0.6 before decreasing again at high conversion fractions. The initial conversional fractions may relate to volatilisation of monoterpenes with low molecular weight such as α- and β-pinene. The increase of Eα is attributed to the evaporation of compounds with higher molecular weights while the decrease of Eα at high conversional fractions indicates exothermic process e.g. oxidation, competing the volatilisation process taken place in the oil. Appearance of an exothermic peak at 250 °C in the DSC data (Fig. 5B) confirms this competition.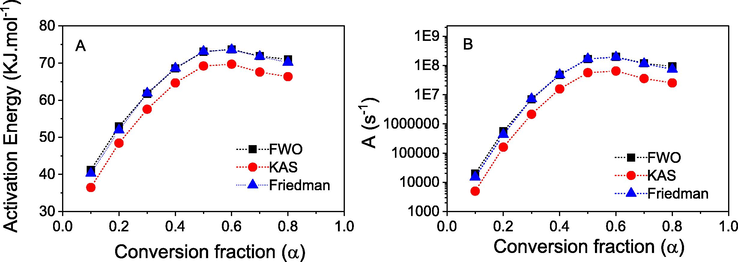
Plots of activation energy (A) and pre-exponential factor (B) versus conversional fractions of MAEO.
Although trend of Ea versus α is similar for all three methods, the lowest values are found by Friedman method. KAS method shows the Ea of oil around 36.5–69.7 KJ mol−1 while these values found from FWO and Friedman methods are in higher range of 41.2–73.7 KJ mol−1 and 40.2–73.6 KJ mol−1, respectively. Mean Ea values are found in a decreasing order of FWO (64.3 KJ mol−1), Friedman (63.9 KJ mol−1) and KAS (60.0 KJ mol−1). It should be noted that at low conversional fractions the Ea value of Friedman method is slightly lower than that of FWO but it becomes slightly higher in the high conversional fractions while the Ea trend of KAS and FWO methods is similar for entire conversion process. The difference in trend of Ea obtained from Friedman method compared with both integral methods is due to their relating mathematical models where Friedman analysis adopts via differential method (Eq. (9)) while both integral methods based on the assumption of temperature integral. The Ea of pepper oil is very similar to C. cassia oils and biodiesels (50–70 KJ mol−1) however it is much lower than that of palm oils (170–180 KJ mol−1) (Le et al., 2020; Santos et al., 2014; Oliveira et al., 2013). It may relate to difference in evaporation point of their main compounds.
The values of Aα are derived by substitution of relating Ea values into equation of Kissinger method (Eq. (11)). Thus, the Aα vs α dependence is similar to the Ea trend. Values of Aα at heating rate of 10 °C min−1 for all methods are found in range of 4.98 × 10³–1.97 × 10⁸ s−1 in entire conversional levels. The broad change of A values can be attributed to the complex decomposition of the oil. The lowest A value found at α = 0.1 indicates a system with less reactivity which is attributed to collision of oil molecules on the surface. Increase of A values with high conversional fractions reveals increasing interaction among the molecules. It is a fact that evaporation of compounds with great molecular weights involves many more complex progress including collisions and breakdown/decomposition of molecules in the oil.
4 Conclusion
The EOs of black pepper were extracted by four different methods which confirmed as an important factor influencing the physicochemical properties of the oils. The extract using solvents showed the higher yields compared to the others. A total of 25 volatile compounds including monoterpene and sesquiterpene hydrocarbons was identified by GC-MS technique. The essential oils extracted by using solvents possessed the high non-volatilisable compositions which were obviously demonstrated by 1H NMR, FTIR, UV–Vis and TGA technique. The evaporation of all essential oils was in range of 3.2–7.3% at 27 °C. For studies on the spent black peppers, the extractions using the solvents showed operation manners different from the extractions using heating process. Both HDEO and MAEO were found to exhibit the highest antibacterial activity. Due to low-cost and rapid extraction, microwave technique possesses potential applications for preparation of black pepper EO. The isoconversional methods showed an appropriate model to study non-isothermal decomposition kinetics of the black pepper essential oil. The activation energy and pre-exponent factor of non-isothermal decomposition were calculated by four different kinetic models. The kinetic parameters were found to be in range of 36.5–73.7 KJ mol−1 for the activation energy and 4.98 × 10³–1.97 × 10⁸ s−1 for pre-exponent factors.
Acknowledgement
The authors thank Mr. Ngo Dinh Nghi, Soongsil University, South Korea for taking microscope images.
Declaration of Competing Interest
The authors declare that they have no known competing financial interests or personal relationships that could have appeared to influence the work reported in this paper.
References
- Identification of Essential Oil Components by Gas Chromatography/Mass Spectrometry. Corp, Carol stream, IL: Allured publ; 2007.
- Method of determining activation deterioration constant of electrical insulating materials. Res. Rep. Chiba Inst. Technol. (Sci. Technol.). 1971;16:22-31.
- [Google Scholar]
- Biological role of Piper nigrum L. (black pepper): A review. Asian Pacific J. Trop. Biomed.. 2012;2:S1945-S1953.
- [CrossRef] [Google Scholar]
- Antioxidant activity of Piper nigrum L. essential oil extracted by supercritical CO2 extraction and hydrodistillation. Talanta. 2014;121:220-228.
- [CrossRef] [Google Scholar]
- Intraspecific chemical variability of the essential oils of Moroccan endemic Origanum elongatum L. (Lamiaceae) from its whole natural habitats. Arab. J. Chem.. 2020;13:3070-3081.
- [Google Scholar]
- Biological effects of essential oils – A review. Food Chem. Toxicol.. 2008;46:446-475.
- [Google Scholar]
- Baptista-Silva, S., Borges, S., Ramos, O.L., Pintado, M., Bruno Sarmento, 2020. The progress of essential oils as potential therapeutic agents: a review, doi:10.1080/10412905.2020.1746698.
- Processing thermogravimetric analysis data for isoconversional kinetic analysis of lignocellulosic biomass pyrolysis: Case study of corn stalk. Renew. Sustain. Energy Rev.. 2018;82:2705-2715.
- [CrossRef] [Google Scholar]
- Thermal properties of centrifuged oils measured by alternative photothermal techniques. Thermochimca Acta. 2017;657:66-7167.
- [CrossRef] [Google Scholar]
- Pyrolysis characteristics and kinetic studies of horse manure using thermogravimetric analysis. Energy Convers. Manage.. 2019;180:1260-1267.
- [CrossRef] [Google Scholar]
- Physicochemical characterization of Robusta coffee ground spent oil for biodiesel manufacturing. Waste Biomass Valorization. 2019;10:2703-2712.
- [CrossRef] [Google Scholar]
- Estimating isothermal life from thermogravimetric data. J. Appl. Polym. Sci.. 1962;6:639-642.
- [CrossRef] [Google Scholar]
- Infrared and Raman Spectra. In: Spectroscopic Methods in Organic Chemistry. Cham: Springer; 2019. p. :85-121.
- [Google Scholar]
- The «temperature integral»-its use and abuse. Thermochi. Acta. 1997;300:83-92.
- [CrossRef] [Google Scholar]
- Freitas, I.R., Cattelan, M.G., 2018. Chapter 15 - Antimicrobial and antioxidant properties of essential oils in food systems—an overview. In: Holban, A.M., Grumezescu, A.M. (Eds.), Microbial Contamination and Food Degradation. São Paulo State University, São José do Rio Preto, São Paulo, Brazil, pp. 443–470.
- Kinetics of thermal degradation of char-forming plastics from thermogravimetry. Application to a phenolic plastic. J. Polym. Sci. Part C: Polym. Symposia. 1964;6:183-195.
- [CrossRef] [Google Scholar]
- Antimicrobial activity of a selection of organic acids, their salts and essential oils against swine enteropathogenic bacteria. Porcine Health Manage.. 2019;5:32.
- [CrossRef] [Google Scholar]
- Piperine—The bioactive compound of black pepper: from isolation to medicinal formulations. Compr. Rev. Food Sci. Food Saf.. 2017;16:124-140.
- [CrossRef] [Google Scholar]
- Polyterpenes by ring opening metathesis polymerization of caryophyllene and humulene. Green Chem.. 2013;15:1112-1115.
- [CrossRef] [Google Scholar]
- Antitumor activity of conventional and supercritical extracts from Piper nigrum L. cultivar Bragantina through cell cycle arrest and apoptosis induction. J. Supercrit. Fluids. 2017;128:94-101.
- [CrossRef] [Google Scholar]
- Nuclear Magnetic Resonance (NMR) Spectroscopy in Food Science: A Comprehensive Review. Compr. Rev. Food Sci. Food Saf.. 2019;18:189-220.
- [CrossRef] [Google Scholar]
- Solubilities of high molecular weight aliphatic compounds in n-hexane. J. Org. Chem.. 1951;16:779-791.
- [CrossRef] [Google Scholar]
- Phylogeny and patterns of floral diversity in the genus Piper (Piperaceae) Am. J. Bot.. 2001;88:706-716.
- [CrossRef] [Google Scholar]
- Antioxidant, Anti-inflammatory and Antinociceptive Properties of Black Pepper Essential Oil (Piper nigrum Linn) J. Essential Oil Bearing Plants. 2014;17:1-12.
- [CrossRef] [Google Scholar]
- Comparative evaluation of antibacterial activity of silver nanoparticles synthesized using Rhizophora apiculata and glucose. Colloids Surfaces B: Biointerfaces. 2011;88:134-140.
- [CrossRef] [Google Scholar]
- The role of herbs and spices in cancer prevention. J. Nutrit. Biochem.. 2008;19(6):347-361.
- [CrossRef] [Google Scholar]
- Spice-derived essential oils: Effective antifungal and possible therapeutic agents. J. Herbs Spices Med Plants. 2008;14:129-143.
- [CrossRef] [Google Scholar]
- Physicochemical characterizations, antimicrobial activity and non-isothermal decomposition kinetics of Cinnamomum cassia essential oils. J. Essent. Oil Res.. 2020;32:158-168.
- [CrossRef] [Google Scholar]
- Analysis of chemical components and biological activities of essential oils from black and white pepper (Piper nigrum L.) in five provinces of southern China. LWT. 2020;117(108644)
- [CrossRef] [Google Scholar]
- Piper nigrum and Piperine: An Update. Phytother. Res.. 2013;27:1121-1130.
- [CrossRef] [Google Scholar]
- Kinetics of the thermal dehydration of clays. Part IV. Interpretation of the differential thermal analysis of the clay minerals. Trans. J. British Ceramic Soc.. 1955;54:204-238.
- [Google Scholar]
- Physicochemical characterization, bioactivity evaluation of essential oil from Citrus microcarpa Bunge flower and leaf. J. Essent. Oil Res.. 2018;30(4):285-292.
- [CrossRef] [Google Scholar]
- The degradation kinetics of flavor in black pepper (Piper nigrum L.) J. Food Eng.. 2009;92:44-49.
- [CrossRef] [Google Scholar]
- Extraction, radical scavenging activities and physicochemical fingerprints of black pepper (Piper nigrum) extract. J. Food Meas. Charact.. 2017;11:2195-2201.
- [CrossRef] [Google Scholar]
- Kinetic and thermodynamic parameters of volatilization of biodiesel from babassu, palm oil and mineral diesel by thermogravimetric analysis (TG) J. Therm. Anal. Calorim.. 2013;111:155-160.
- [CrossRef] [Google Scholar]
- Solid–liquid equilibria based on an equation of state for chain fluids. Fluid Phase Equilib.. 2001;180:299-311.
- [CrossRef] [Google Scholar]
- Supercritical fluid extraction of black pepper oil. J. Food Eng.. 2005;71:386-393.
- [CrossRef] [Google Scholar]
- Extraction of piperine from Piper nigrum (black pepper) by hydrotropic solubilization. Ind. Eng. Chem. Res.. 2002;41:2966-2976.
- [CrossRef] [Google Scholar]
- Isoconversional kinetic study of the thermal decomposition of sugarcane straw for thermal conversion processes. Bioresour. Technol.. 2015;196:136-144.
- [CrossRef] [Google Scholar]
- Evaporation kinetics in short-chain alcohols by optical interference. J. Chem. Educ.. 2000;77:1047.
- [CrossRef] [Google Scholar]
- Ovicidal, larvicidal, and behavioural effects of some plant essential oils on diamondback moth (Lepidoptera: Plutellidae) Can. Entomol.. 2017;149:639-648.
- [CrossRef] [Google Scholar]
- Characterization and kinetic study of sunflower oil and biodiesel. J. Therm. Anal. Calorim.. 2011;106:747-751.
- [CrossRef] [Google Scholar]
- Kinetic study and thermoxidative degradation of palm oil and biodiesel. Thermochim. Acta. 2014;592:18-22.
- [CrossRef] [Google Scholar]
- Properties and antioxidant activity of fish skin gelatin film incorporated with citrus essential oils. Food Chem.. 2012;134:1571-1579.
- [CrossRef] [Google Scholar]
- The study on extraction process and analysis of components in essential oils of black pepper (Piper nigrum L.) seeds harvested in Gia Lai Province, Vietnam. Processes. 2019;7:56.
- [Google Scholar]
- Comparison of antibacterial effects and fumigant toxicity of essential oilsextracted from different plants. Ind. Crops Prod.. 2018;124:192-200.
- [Google Scholar]
- NMR and GC analyses of 3-carene isomerization products over activated glauconite. J. Appl. Spectrosc.. 2017;83:1026-1030.
- [Google Scholar]
- Green and solvent-free simultaneous ultrasonic-microwave assisted extraction of essential oil from white and black peppers. Ind. Crops Prod.. 2018;114:164-172.
- [Google Scholar]
- An improved method to obtain essential oil, flavonols and proanthocyanidins from fresh Cinnamomum japonicum Sieb. leaves using solvent-free microwave-assisted distillation followed by homogenate extraction. Arab. J. Chem.. 2020;13:2041-2052.
- [Google Scholar]
Appendix A
Supplementary material
Antibacterial activity images of oils extracted by hydrodistillation and microwave-assisted hydrodistillation are available electronically from website or from the corresponding author on request. Supplementary data to this article can be found online at https://doi.org/10.1016/j.arabjc.2020.08.008.
Appendix A
Supplementary material
The following are the Supplementary data to this article:Supplementary data 1
Supplementary data 1


