

Translate this page into:
Influence of N sources on the photocatalytic activity of N-doped TiO2
⁎Corresponding author. stilve@unigoa.ac.in (S.G. Tilve)
-
Received: ,
Accepted: ,
This article was originally published by Elsevier and was migrated to Scientific Scholar after the change of Publisher.
Peer review under responsibility of King Saud University.
Abstract
Abstract
Influence of nitrogen precursors urea, semicarbazide and N,N’-dimethyl urea on the photocatalytic activity of the N-doped TiO2 were studied by a simple decomposition method. The nano N-TiO2 catalysts were synthesized via two different modified approaches by calcination at 500 °C. The synthesized samples were characterized by IR, UV-DRS, Raman, TG-DTA, XRD, EDX, XPS, SEM, TEM and BET analysis. Of the synthesized six samples of N-TiO2 five samples showed better photocatalytic activity towards direct sunlight photo-degradation of methylene blue (MB) and rhodamine B (RhB) than Degussa P25. The catalysts obtained using semicarbazide samples F3 and F4 having large surface area of 76 and 85.8 m2/g displayed maximum photocatalytic activity. The sample F4 was 1.5 times more active than Degussa P25 for the decolourisation of MB and 1.9 times more active for the decolourisation of RhB. The presence of nitrogen, large surface area and coupling of rutile-anatase phases were found to be the main responsible factors for the enhanced photocatalytic activity. The exclusive formation of the anatase phase in the case of urea precursor is attributed to the slow evaporation of urea due to the formation of melamine derived products. The calcination temperature is the deciding factor responsible for the photocatalytic activity of the N-TiO2 samples prepared from precursors which can potentially form the melamine and its oligomerized products on the surface of TiO2.
Keywords
TiO2
N-doped TiO2
Photocatalyst
Photo-degradation
Urea

1 Introduction
Different semiconductor materials are researched for photocatalytic applications (Nguyen et al., 2020a, 2020b; Ahadi et al., 2019; Haghighatzadeh et al., 2019; Nguyena et al., 2020; Zhaia et al., 2020, 2011; Zhai et al., 2013, 2019). Among them titania is one of the most interesting materials widely used in heterogeneous photocatalysis. In comparison with other semiconductor metal oxides, titania is more chemically and structurally stable. This robustness of TiO2 has made it more popular in environmental remediation, for example, in wastewater treatment and removal of hazardous organic pollutants.
In semiconductor mediated photocatalysis, photo-excitation of the material is a key step and this depends on the magnitude of band-gap of the material. Titania is a wide band-gap semiconductor, utilizes very little part of sunlight. Hence, to maximize its use, modifications in its properties are required. One of the ways to do it is to increase its surface-active sites by decreasing its size, thereby shifting its blue band. However, this has its limitations to exploit abundantly available sunlight. The other routes pursued to improve the catalytic activity by reducing the band-gap are to incorporate metallic or non-metallic elements in the TiO2 matrix. The foreign elements help in producing additional permissible energy levels for the absorption of photons and trapping of electrons to decrease the electron-hole combinations.
The first non-metal used as a dopant for TiO2 was nitrogen reported in 1986 (Sato, 1986). However, N-TiO2 systems gained much interest after the use of TiO2-xNx films in the visible range in 2001 (Asahi et al., 2001). Since then, the N-TiO2 system is extensively explored for visible photocatalytic activity. Nitrogen doping significantly improves the optical absorption and hence photocatalytic degradation efficiency of TiO2 in the visible region. Nitrogen is a more suitable non-metal dopant due to its size being similar to an oxygen atom, as well as low ionization energy. Consequently, its substitution of oxygen in TiO2 lattice is easier (Asahi et al., 2014; Kusano et al., 2017; Wang et al., 2009; Oropeza et al., 2010; Zhang et al., 2010; Nolan et al., 2012; Sauthier et al., 2012; Li et al., 2015, 2018; Ansari et al., 2016; Tran et al., 2017; Chen et al., 2019; Basavarajappa et al., 2020). Interstitial doping reduces band gap (∼2.46 eV) to a greater extent than substitutional (∼3.06 eV). Peng et al. (2012) have reported that interstitial doping is more photoactive than substitutional which is in variance with Valentin’s theoretical prediction (Livraghi et al., 2006) and Xie et al.’s claim (Zeng et al., 2014). Nitrogen doping can be achieved by sputtering, laser ablation, ion implantation, chemical vapor deposition, microwave, microemulsion, sol–gel, hydrothermal, solvothermal, mechanochemical, decomposition, spray pyrolysis and oxidation of TiN (Apopei et al., 2020; Jin et al., 2019; Fiorenza et al., 2020; Zeng et al., 2016; Kumaravel et al., 2019; Kong et al., 2020; Kalantari et al., 2016; Xu et al., 2019; Sadi et al., 2020; Dong et al., 2009; Kometani et al., 2008; Cong et al., 2007; Nosaka et al., 2005; Marques et al., 2019; Kobayakawa et al., 2005; Yuan et al., 2006; Mitoraj and Kisch, 2008; Gandhe and Fernandes, 2005a, 2005b; Sivaranjani and Gopinath, 2011). The enhanced activity of these materials is mainly the result of two different reasons. It is either due to the substitution of oxygen or the incorporation of nitrogen into the TiO2 lattices. In addition to method of preparation (Ansari et al., 2016), the nitrogen source used is also considered to be an important factor (Cong et al., 2007). Various compounds of nitrogen are employed in the preparation of N-doped titania. These include ammonia, triethylamine, ethyl methyl amine, triethanol amine, t-butyl amine, ammonium nitrate, hydrazine hydrate, a guanidine derivative, 1,3-diamino propane, urea, thiourea, nitrogen dioxide etc. (Asahi et al., 2014; Kusano et al., 2017; Wang et al., 2009; Oropeza et al., 2010; Zhang et al., 2010; Nolan et al., 2012; Sauthier et al., 2012; Li et al., 2015, 2018; Ansari et al., 2016; Tran et al., 2017; Chen et al., 2019; Basavarajappa et al., 2020; Peng et al., 2012; Livraghi et al., 2006; Zeng et al., 2014, 2016; Apopei et al., 2020; Jin et al., 2019; Fiorenza et al., 2020; Kumaravel et al., 2019; Kong et al., 2020; Kalantari et al., 2016; Xu et al., 2019; Sadi et al., 2020; Dong et al., 2009; Kometani et al., 2008; Cong et al., 2007; Nosaka et al., 2005; Marques et al., 2019; Kobayakawa et al., 2005; Yuan et al., 2006; Mitoraj and Kisch, 2008; Gandhe and Fernandes, 2005a, 2005b; Sivaranjani and Gopinath, 2011; Valentin et al., 2005'; Cong et al., 2007; Nosaka et al., 2005).
Doping with urea is claimed to produce an effective N-doped material (Marques et al., 2019; Kobayakawa et al., 2005; Yuan et al., 2006; Mitoraj and Kisch, 2008; Gandhe and Fernandes, 2005a, 2005b; Sivaranjani and Gopinath, 2011). Wormhole mesoporous TiO2 obtained by the combustion method using urea shows high photocatalytic activity (Sivaranjani and Gopinath, 2011).
It has been shown that when urea was used to incorporate nitrogen in TiO2, the melamine and its oligomerized products melam, melom, melon, and graphitic carbon nitride deposited on the surface of TiO2 are responsible for the enhanced photo-activity and also the yellow color of N-TiO2 (Mitoraj and Kisch, 2008). In this report, the authors had mixed preformed TiO2 with urea and further calcined at 350–400 °C to get yellow-colored TiO2. It is interesting to note that the majority claims of nitrogen-doped TiO2 also mention the yellow color of the catalyst where urea is not used. Even when ammonia or hydrazine was used where there was no possibility of melamine formation, the color of the catalyst is yellow. This observation led us to investigate in detail the role of urea precursor in the enhancement of the photo-activity of N-TiO2, particularly at a higher temperature where organic part remaining will be minimal. For this study we selected urea, semicarbazide and N,N’-dimethyl urea as precursors. We felt that the yellow color of the resultant TiO2 could be due to the presence of substitutional nitrogen and interstitial nitrogen as NO, NO2, NHx causing reduction in band gap rather than the melamine derived oligomers. Furthermore, introduction of –NH2 group on the surface would result in an increase in surface area and increased adsorption of acidic dyes. In addition, in the case of urea, when the catalyst is prepared at 350–400 °C along with surface nitridation, the melam and other polymeric products can act as photo dyes.
The present study deals with knowing the role of urea in enhancing photocatalytic activity of the TiO2 catalyst synthesized at high temperature. Further the obtained catalyst was compared with the catalysts prepared from two urea derivatives, semicarbazide and N,N’-dimethyl urea under identical conditions.
2 Experimental
2.1 Materials
Titanium tetraisopropoxide (TIP) (purity, 97%), Ti(OC3H7)4, urea, semicarbazide, N,N’-dimethyl urea, were purchased from Spectrochem, methylene blue (MB) from Merck and rhodamine B (RhB) and isopropyl alcohol (IPA) from Loba Chemicals.
2.2 Synthetic procedure
Procedure 1: A mixture of TIP (4.68 g, 16.48 mmol) and urea in a 1:2 ratio was heated at 100 °C with constant stirring till a powder is formed. The powder was then calcined at 500 °C for three hours in an oven. A dark yellow colored powder was obtained (F1 = 0.94 g).
Procedure 2: TIP (4.68 g, 16.48 mmol) was heated at 100 °C with constant stirring. In the solid obtained, urea was added in a 1:2 ratio (TIP: urea) and mixed by grinding. The mixture then further calcined at 500 °C for three hours. A dark yellow colored powder was obtained (F2 = 1.29 g).
The experiments were then repeated with semicarbazide and N,N’-dimethyl urea in place of urea, to get light yellow and light brown to greyish green colored powders (F3 = 1.20 g, F4 = 0.86 g, F5 = 1.98 g, F6 = 0.90 g). The colors of the powders shown in Fig. $1 (supplementary data). The samples prepared are accordingly grouped in pairs and labeled as F1, F2, F3, F4 F5 and F6 (Table 1). The undoped sample (F0) was prepared by the same way without addition of urea.
Precursor used
Sample code
Urea (1)
F1
Urea (2)
F2
Semicarbazide (1)
F3
Semicarbazide (2)
F4
N,N’-dimethylurea (1)
F5
N,N’-dimethylurea (2)
F6
2.3 Characterization techniques
The Infrared spectra were recorded using Shimadzu IR Prestige-21 FTIR in the range of 4000–400 cm−1. The crystallite size and crystal phase composition were recorded using Bruker D8 ADVANCE X-ray diffractometer with Cu Kα radiation (1.5406 Å) in the 2θ scan range of 10-80°. Thermal stability was tested by thermogravimetric analysis (TG-DTA) in N2 atmosphere up to 1000 °C at the heating rate of 10 °C min−1 using STA 409 PC Luxx simultaneous TG-DTA analyzer (Netzsch, Germany). Surface area porosity analyzer (Micromeritics ASAP 2020 V3.00H) at liquid nitrogen temperature was used to obtain nitrogen adsorption/desorption isotherms. The samples were degassed at 150 °C for 12 h with a continuous flow of nitrogen before analysis. Zeiss Avo18 scanning electron microscopy (SEM) was used to study the morphology of the samples. PHILIPS CM 200 field emission transmission electron microscope operating at 200 kV was used to investigate the size and selected area electron diffraction (SAED) pattern. UV–visible diffuse reflectance spectra were recorded on Shimadzu UV-2450 with BaSO4 as the background standard. The room temperature Raman spectra were recorded in the range of 150–800 cm−1 on HORIBA JOBIN YVON HR-800 Raman spectrophotometer to identify different type of vibration modes. A 632.8 nm He-Ne laser source with the power of 10 mW was used as excitation source. X-ray photoelectron spectroscopy (XPS) was performed with a PHI 5000 Versa Probe II (FEI Inc.) to determine the oxidation states of the respective elements.
2.4 Photocatalytic degradation procedure
The photocatalytic activity was studied by monitoring photo-decomposition of an aqueous solution of MB and RhB of 10 and 20 ppm concentrations respectively. For comparison, standard Degussa P25 was the reference material.
In a typical degradation experiment, 10 mg of the catalyst was added to 25 mL of aqueous dye stock solutions (0.010 g/L – MB and 0.020 g/L – RhB), prepared in deionized water and equilibrated for 30 min in the dark. The solution was then exposed to sunlight for 120 min, between 10:00 am to 12:00 noon for MB and for 6h, between 10:00 am to 4:00 pm for RhB, with intermittent swirling. At specified intervals of time, the decolorization of dyes monitored at their absorption maximum (650 nm for MB and 450 nm for RhB), as a function of time against appropriate blanks.
The experiments were repeated for three times, and the average of three readings was considered. The extent of photo-degradation of dye was calculated using a calibrated relationship between the measured absorbance and concentration. The recyclability was tested for three cycles. The kinetic studies were carried out to determine the rate of dye degradation. Selected samples were also tested for UV and visible light degradation for comparative studies using Lelesil innovative systems Model no. LIS-4D.
3 Results and discussion
Earlier, we had studied the effect of different carboxylic acid templates on the properties of resultant TiO2 by sol–gel method (Bakre et al., 2016, 2018, Bakre and Tilve, 2017, 2018). Long chain and sterically crowded acids produced phase pure anatase TiO2 with high surface area and small size with enhanced photo- activity. With dicarboxylic acids, the additional functional groups determined the phase formation. When organic acids are used as templates in sol–gel synthesis, formation of metal carboxylate controls the hydrolysis and condensation process. Further, during calcination the non-hydrolytic decomposition controls the phase selection. Amino acids were found to behave differently when used in excess. Recently synthesis of mixed phase anatase–rutile was achieved by a non-aqueous sol–gel route Bakre and Tilve, 2020).
For the present study, we chose semicarbazide and N,N’-dimethyl urea, hitherto unreported for N-doping and compared with urea using the decomposition method. The probable thermal decomposition pathways for these compounds are depicted in Schemes 1–3. Urea on decomposition gives ammonia, isocyanic acid and cyanic acid, the precursors of melamine. Similarly, semicarbazide can form ammonia, hydrazine, isocyanic acid and cyanic acid. In contrast, N,N’-dimethyl urea does not give these intermediates.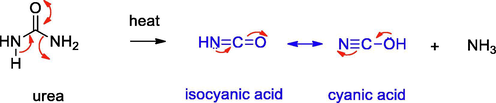
Decomposition pathway for urea.
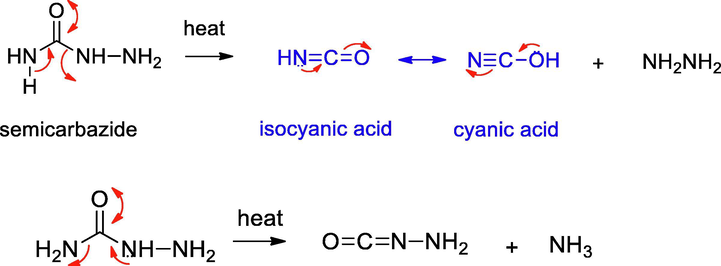
Decomposition pathway for semicarbazide.
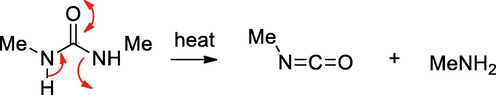
Decomposition pathway for N,N’-dimethyl urea.
Our initial studies dealt with selecting a temperature for the synthesis of N-TiO2. We wanted to select conditions where in melamine derived products are totally burned off. Hence, to select the temperature for calcination studies, the requisite quantities of the precursors were heated at 400 °C for one hour. Both the semicarbazide and N,N’-dimethyl urea got decomposed completely while in the case of urea, some residue remained. Further heating for one more hour at the same temperature, the residue persisted. This could be due to the formation of melamine related oligomerized products. When heated at 500 °C for one hour, urea was found to decompose completely with no trace of residue. Considering the above observations, the calcination temperature for our experiments selected was 500 °C for 3 h.
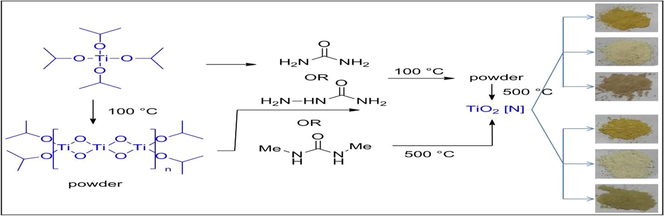
For preparing the catalysts, we followed two routes to get the bulk and surface incorporation of nitrogen. In the first protocol to get bulk incorporation, a mixture of titanium tetraisopropoxide (TIP) and urea was heated at 100 °C to get a powder. In the second approach, the first powder was obtained by heating TIP at 100 °C, and then this powder was mixed with urea. Both the powders were then calcined separately at 500 °C. During the heating with urea, isopropoxide ligand may get replaced by urea, as shown in Method 1 (Scheme 4). Elimination of propene then would release the hydroxyl ligand which would further polymerize to nitrogen-doped TiO2. Similarly, as shown in Method 2, the initial release of propene leads to the powder by oligomerization, which on further heating with urea leads to nitrogen-enriched TiO2.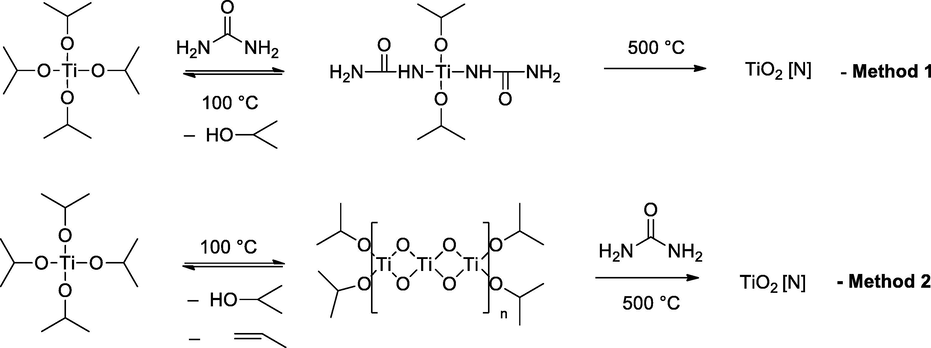
Schematic presentation of preparation methods.
3.1 Characterization
3.1.1 FTIR spectroscopy
The Fig. 1a shows IR spectra of all precursor (uncalcined) samples. The strong, broad band at 3500–2500 cm−1 was assigned to the Ti—OH and —NH2 stretching of urea and semicarbazide. The other strong bands in the region of 1600–1100 cm−1 were due to the amide bond and C—O, C—N bonds of the organic precursors. The IR spectra of calcined samples (Fig. 1b) showed a broad band at 3400 cm−1 and another weak band at 1623 cm−1 originating from adsorbed water and the surface hydroxyl groups (Suda and Morimoto, 1987; Tanaka and White, 1982). Tiny bands at 2044 cm−1 (Ti—N⚌C⚌O), 2207 cm−1 (Ti—NH—CN) and 2340 cm−1 (Ti—O—CN) cm−1 were seen in all the six samples. These bands could arise from the linkage of isocyanic acid or cyanuric acid units to the Ti via oxygen or nitrogen during the initial decomposition of precursors. Ab-initio IR frequencies of Ti—N⚌C⚌O, Ti—NH—C≡N and Ti—O—C≡N were computed using Hartree-Fock Theory with 6-31G basis set using Gaussian 09 W program (Frisch et al., 2009). The corresponding values for these were 2370 cm−1 (Ti—N⚌C⚌O), 2495 cm−1 (Ti—NH—CN) and 2541 cm−1 (Ti—O—CN) respectively. Such bands were observed by Kröcher et al. (Bernhard et al., 2013) and some of them were assigned by them for adsorbed isocyanic acid and cyanamide. Similar bonding with other metals like Al-NCO and Fe-NCO is reported form the same laboratory (Czekaj et al., 2008) and also predicted by DFT calculations (Czekaj et al., 2013).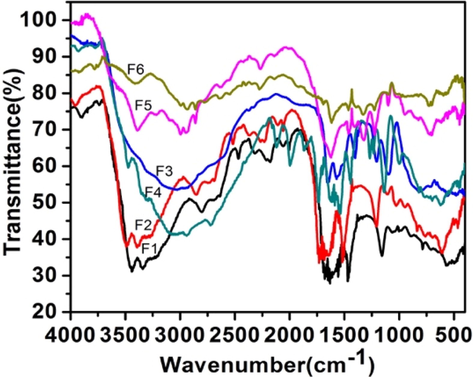
IR spectra of precursor samples.
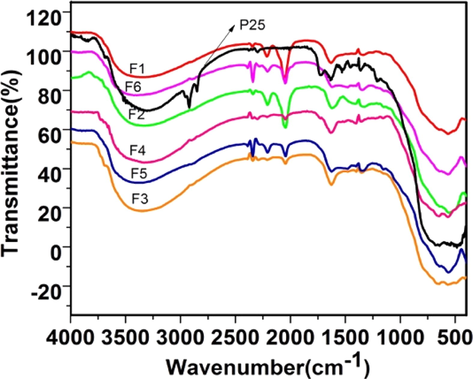
IR spectra of calcined samples.
There is a claim that the TiO2 surface appears yellow when heated with urea because of the melam, melom, melon, and graphitic carbon nitride present on the surface of the TiO2 (Mitoraj and Kisch, 2010). In our case, though the samples appeared yellow in the case of urea and semicarbazide, the corresponding multiple strong bands in the region 1640–1200 cm−1 due to these intermediates were not seen. IR spectrum of decomposed urea (residue remained after heating at 400 °C) displayed a band at 1734 cm−1 in the carbonyl stretching region, suggesting the formation of ammelide intermediate (Fig. $2, supplementary data). This band also appeared when the Degussa sample was milled with urea and heated at 400 °C for one hour. The above observation suggests that urea follows the same decomposition pathway over TiO2.
The IR studies confirmed that the urea (El-Gamel et al., 2007; Mitoraj and Kisch, 2010; Sattler et al., 2009) and semicarbazide decompose in a similar pathway resulting in the formation of isocyanic/ cyanuric acid. A probable mechanistic route for the formation of various intermediates during the decomposition of urea and semicarbazide on the surface of TiO2 is depicted in Fig. $3 (supplementary data) to account for the observed IR data. However, in the case of N,N’-dimethyl urea though such a pathway was not available as ammonia is not liberated (Scheme 3), it also showed additional very tiny bands at 2044–2144 cm−1. To account for this a speculative mechanism is proposed (Fig. $4, supplementary data).
Further support of the nitrogen incorporation could be seen from the the spectra of samples heated at 1000 °C where a weak band at 415 cm−1 was observed which can be assigned to N-Ti-N bonds (Fig. $5 and enlarged image inset, supplementary data) (Jackson et al., 2006; Etacheri et al., 2010).
3.1.2 Raman spectroscopy
Raman spectroscopy technique can be useful for characterizing microstructural and surface stoichiometric information of inorganic oxides. The Raman spectra of all the samples show (Fig. 2) four resolved peaks between 145.1–146.6, 398.8–399.0, 515.0–516.0 and 640.0–641.8 cm−1. These peaks could be assigned to Eg, B1g, A1g and Eg modes of anatase phase of TiO2, respectively (Yu et al., 2005). No additional peaks due to the nitrogen or rutile phase were seen. When these samples are compared with undoped TiO2 (F0), all the samples showed a slight shift towards longer wavelengths of the Eg modes which might be due to the incorporation of nitrogen in the lattice (Wang et al., 2007). Interestingly, the most photoactive samples F3 and F4 showed a more shift compared to other samples (inset Fig. 2).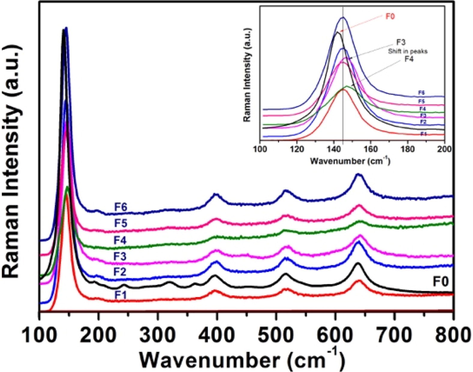
Raman spectra of calcined samples.
3.1.3 Diffuse reflectance spectroscopy
The absorption spectra of all samples show strong absorption in the region 390–400 nm due to the intrinsic properties of TiO2. The absorption bands of samples F1, F2, and F5, F6 are observed to be remarkably red-shifted compared to undoped sample (F0) (Fig. 3). The observed redshift in the absorption edge is attributed to the formation of the new electron state above the valence band by N-doping (Wu et al., 2008). The samples F3 and F4, though are pale-yellow in color, exhibit a slightly lower shift in absorption wavelength compared to other samples, probably because of smaller particle size (quantum effect) and the presence of a slight rutile phase. The presence of the rutile phase in less concentration is reported to exhibit a blue shift of absorption edge. It is attributed to the band-filling mechanism, based on increasing n-type doping level by N-incorporation into TiO2 lattice (Diwald et al., 108 (2004)).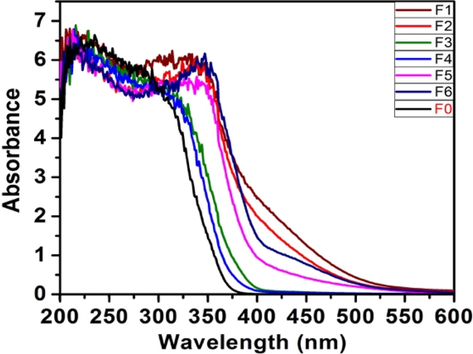
UV-DRS spectra of calcined samples.
Table 2 depicts the absorption wavelength (λmax) of all the samples. The band-gap values are found to be in the range 2.70–3.14 eV, which are observed to be smaller than that of Degussa (3.35 eV).
3.1.4 X-ray diffraction (XRD)
X-ray powder diffraction analysis was carried out to evaluate the phase composition and the crystallite size. Fig. 4a shows the XRD patterns of calcined N-TiO2 powders at 500 °C. It displays sharp peaks, signifying the crystalline nature of the catalysts prepared.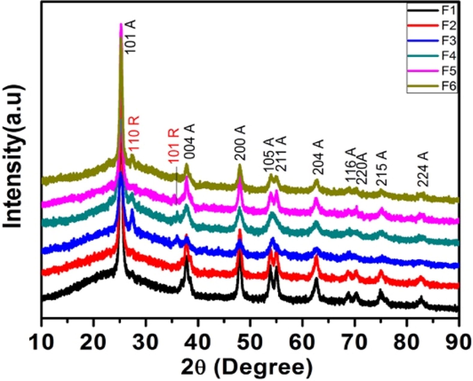
XRD plots for samples (500 °C).
From the figure, it is clear that samples F1, F2, and F5 possess pure anatase phase (denoted by A), whereas, for samples F3, F4 and F6, display 31.5, 13.7, and 9.6% rutile phase (denoted by R) respectively (calculated by Spur equation). The anatase phase is confirmed by JCPDS card # 21-1272 and the rutile phase by JCPDS card # 21-1276
The samples obtained from semicarbazide (F3 and F4), and N,N’-dimethyl urea (F6) shows some rutile phase formation, whereas urea showed only anatase phase formation. In the case of urea, while decomposing intermediates like cyanuric acid, ammelide, ammeline, etc., are formed, which takes time to evaporate completely. This was also observed when only urea was heated at 400 °C for two hours, where some residual material had remained. Hence, in the case of urea, because of its slow decomposition, the resultant TiO2 (anatase) formed does not get enough energy to rearrange to rutile phase. This suggests that urea may not be creating oxygen vacancies at that temperature to stabilize the rutile phase (Shannon and Pask, 1965). In literature it is reported that the urea changes the condensation pathway due to which rutile forms at higher temperature (Pillai et al., 2007). Our results suggest that the condensation pathway do not change. It is also claimed that the anatase–rutile ratio can be tuned to some extent by adjusting the factors such as synthetic method, precursor material, or calcination temperature (Girish Kumar and Koteswara Rao, 2014). In the case of N,N’-dimethyl urea and semicarbazide because of rapid decomposition no organic part remains as residue, and hence one can see some rutile phase formation. In the case of F5, being a bulk doping, it takes more time for N,N’-dimethyl urea to decompose from the matrix, while in surface doping, sample F6, it decomposes faster and hence is the observation. Melamine derived products may be responsible for higher photo-activity of samples calcined <400 °C using urea while it may not be the sole factor in the case of samples calcined at 500 °C as most of the organic products evaporate at this temperature. EDX of these samples showed presence of nitrogen (0.4 to 1.68) in all the samples. The samples prepared from semicarbzide had maximum nitrogen while the N,N’-dimethyl urea had the least. As expected the second method of preparation showed slightly more presence of nitrogen on the surface (Fig. $6, supplementary data).
Further, these samples when calcined at 1000 °C for one hour were completely converted to rutile phase (Fig. 4b). EDX of these samples (calcined at 1000 °C) prepared from urea and semicarbazide showed about 0.8 to 1.2% nitrogen, while it was 0% of the sample obtained via N,N’-dimethyl urea (Fig. $7, supplementary data). Thus, in the urea and semicarbazide samples, the surface —NH2 and —NH-NH2 groups are more than the -NHMe group in case of N,N’-dimethyl urea.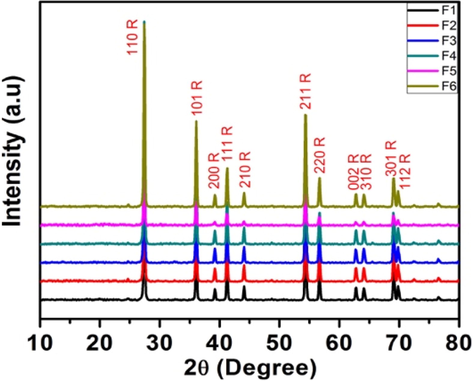
XRD plots for samples (1000 °C).
The prepared catalysts were found to be smaller in size (calculated using Scherrer’s formula) as compared to Degussa P25 (25 nm) in the range of 6–12 nm (Table 2). The samples F3, F4, and F6 (having a mixed phase) display relatively smaller values of crystallite sizes.
XRD data of one of the recovered catalysts after photodegradation was recorded which did not deviate much in its appearance (Fig. $8, supplementary data).
3.1.5 TG-DTA analysis
Fig. 5 displays the TG-DTA curves exhibited by the catalysts. TG curve is found to be declining in a straight line with overall weight loss, indicating the thermal instability of the samples. A higher value of weight loss observed for samples prepared by the second method imply that there was more nitrogen content on the surface, and the surface desorption of it takes place. This was also seen in the EDX analysis of these samples.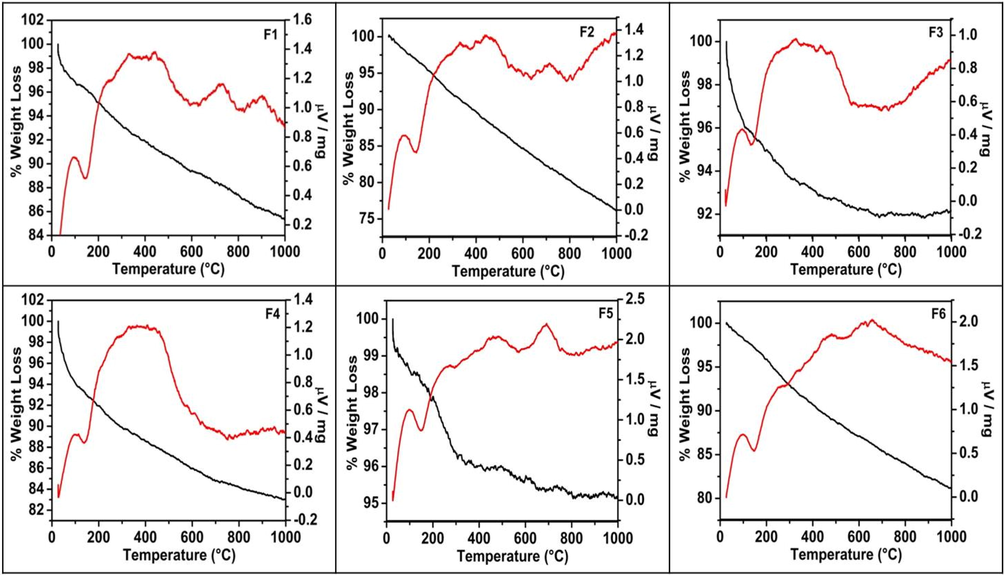
TG-DTA studies of calcined N-TiO2 nanoparticles.
DTA analysis was used to detect phase transformations taking place. A small endothermic peak at around 140 °C seen in all the samples due to the evaporation of the surface adsorbed water. A small exothermic peak displayed above 700 °C, for samples F1, F2 and at a slightly lower value for samples F5 and F6 attributed to phase transition from anatase to rutile. No such exo peak observed for samples F3 and F4 suggested that the phase transition from anatase to rutile was gradual for these samples as these samples contained a slight rutile phase in the beginning.
3.1.6 BET surface area analysis
The N2 adsorption–desorption isotherm curves are of type IV, characteristic of a mesoporous material associated with capillary condensation (Fig. 6). The hysteresis loops in the BJH adsorption study are intermediate between H2- and H3-type for samples F1, F2 (prepared from urea), starting at a relative pressure of 0.4 P/P0 and slight leveling off near the saturation vapor pressure (P = P0). The pronounced hysteresis loop of these samples is typical of mesoporous materials resulting from clustering of particles with slit-shaped pores. Samples F3, F4 (prepared from semicarbazide) depict similar nature of H3-type hysteresis loop with the absence of plateau at high relative pressure and starting at a relatively higher value (∼0.5 P/P0). The observed shape of isotherm curves designates the non-rigid nature of the mesopores in this case. The broad pore size distribution curves of these four samples (F1-F4) also support their mesoporous nature.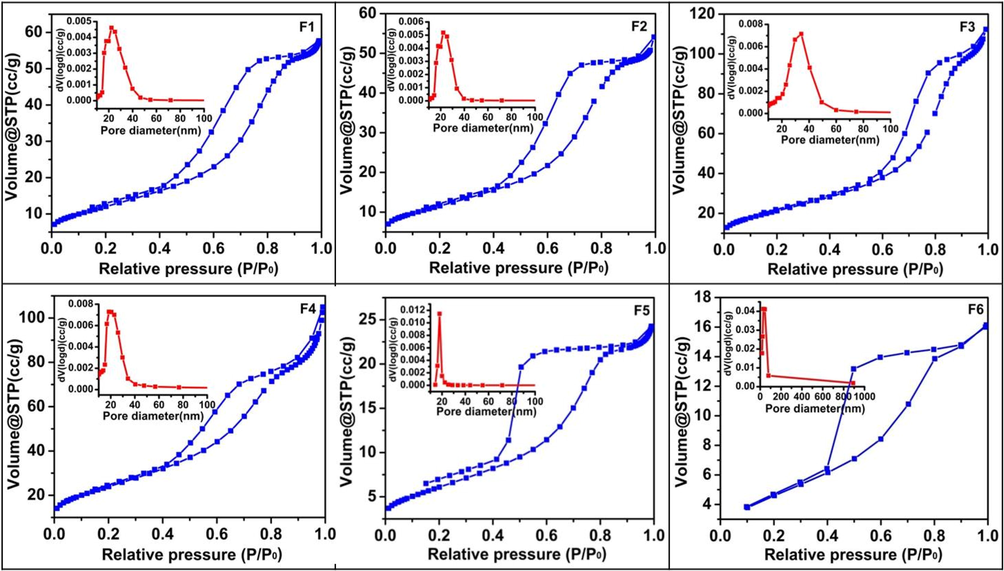
Nitrogen adsorption–desorption isotherms and pore size distribution (inset) of N-TiO2 nanoparticles.
Whereas for catalysts F5, F6 (synthesized from N,N’-dimethyl urea precursor), H2-type hysteresis loops with a well-defined plateau at high P/P0 values are seen suggesting the presence of practically rigid structures among the particles. The hysteresis loop of both the samples has a broad shape and an open lower end in the case of sample F5. The absence of closure of the hysteresis loop below a relative pressure of 0.45 is assumed to be caused by swelling of particles. The effect can also be ascribed to the lower value of the surface area and probably maybe the reason for the comparatively lower photocatalytic activity of these samples. Their narrow pore size distribution also supports the rigid pore structure (Gregg and Sing,1982, Sing and Williams, 2004).
The different starting precursor materials employed for the synthesis of these samples may be responsible for the observed differences like the hysteresis loop, the pore size distribution curve, and other surface properties. However, there is no such difference observed for the catalysts obtained from different synthetic methods. These results imply that the slight variation of the synthesis process, in this case, does not contribute to altering the surface properties of the catalysts obtained, but it is more dependent on the starting precursor material used.
Table 2 shows the BET surface area of all the catalysts. Samples, F3 and F4, having more surface area displayed a better photocatalytic activity, while the sample F6 having low surface area value showed less photocatalytic activity.
3.1.7 Morphological analysis
The surface morphology was carried out by using scanning electron microscopy (SEM). Fig. 7a displays the SEM images of the prepared catalysts. The images show that most of the particles are well detached, although some of them are partially aggregated, consisting of smaller groups formed by finer primary particles. All the samples display similar morphology exhibiting uniform spherical shape of particles. The effective particle size is difficult to measure due to their existence in cluster form. SEM image of a recovered catalyst after photo-degradation study was also recorded which showed no change in the morphology (Fig. $9–10, supplementary data).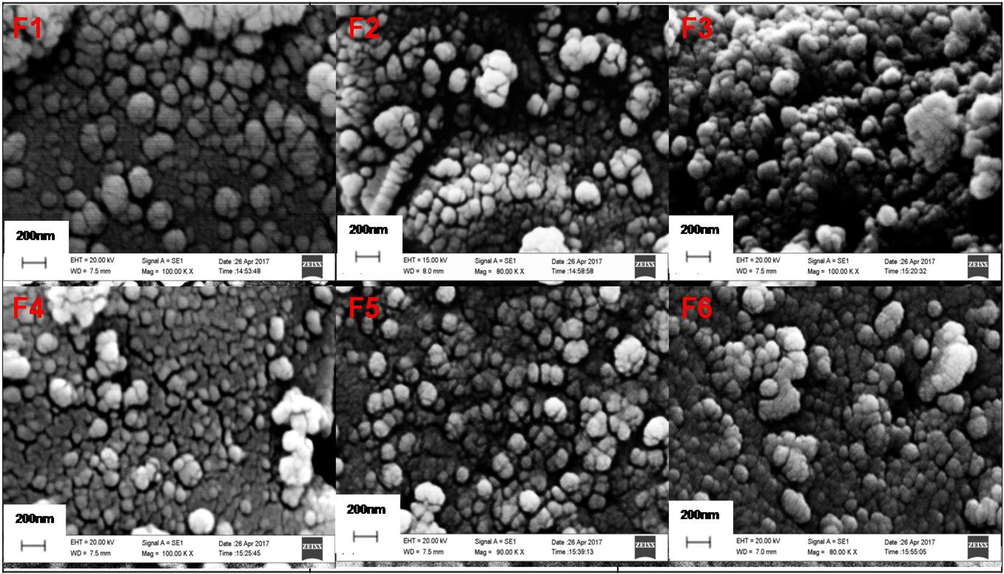
SEM images of TiO2 nanoparticles for samples F1- F6.
TEM images further confirmed the surface morphology. The Fig. 7b display randomly packed particles with spherical morphology and pore channels created by particle packing, which is in support of the observation drawn from the SEM images. Shadow areas in the picture suggest that the particles have aggregated. Samples F5 and F6 display high agglomeration and the finer particles are seen in aggregated form to produce larger clusters. The average particle size was found to be in the range of 6–12 nm and is consistent with the XRD data. The comparatively weak activity of sample F6 though having a smaller particle size might be a result of the observed agglomeration.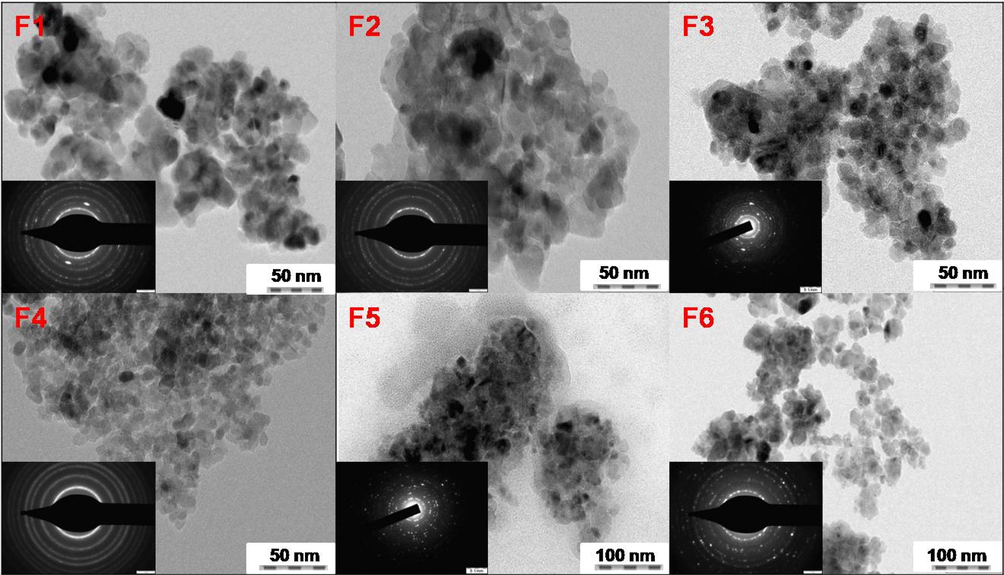
TEM images with corresponding SAED patterns (inset) of TiO2 nanoparticles for samples F1- F6.
Fig. 7b in the inset displays the selected area electron diffraction pattern (SAED) of the nanoparticles, which gives information about the crystallinity and structure. The SAED shows a concentric ring diffraction pattern typical of the anatase phase with the polycrystalline nature of the prepared samples.
3.1.8 XPS studies
XPS studies were done to understand the fate of nitrogen in the samples (Figs. 8a–8c). The peaks at binding energies 399.4–399.8, 464.1–464.4, 458.4–458.7 and 529.6–530.0 eV confirmed the presence of N, Ti and O. These values are related to N1s, Ti2p1/2, Ti2p3/2 and O1s, respectively. Literature binding energy for substitutional nitrogen is in the range of 396 to 398 eV and for interstitial nitrogen at 399–406 eV (Oropeza et al., 2010; Zhang et al., 2010). The obtained values of N1s suggest that the N is incorporated in an interstitial manner as NO or NHx species (Asahi et al., 2014). The O1s peak was deconvoluted into two contributions. The peak at ∼530 eV could be attributed to lattice oxygen (OL) and the small peak at ∼532 eV due to surface OH group (OH). The surface hydroxyl groups in TiO2 play an important role in photocatalytic activity. The intensity ratio of OH/ OL was found to be 0.194, 0.157, 0.181, 0.201, 0.177, 0.169 for samples F1, F2, F3, F4, F5, F6 respectively. Expectedly for sample F4 which shows maximum activity it was the highest.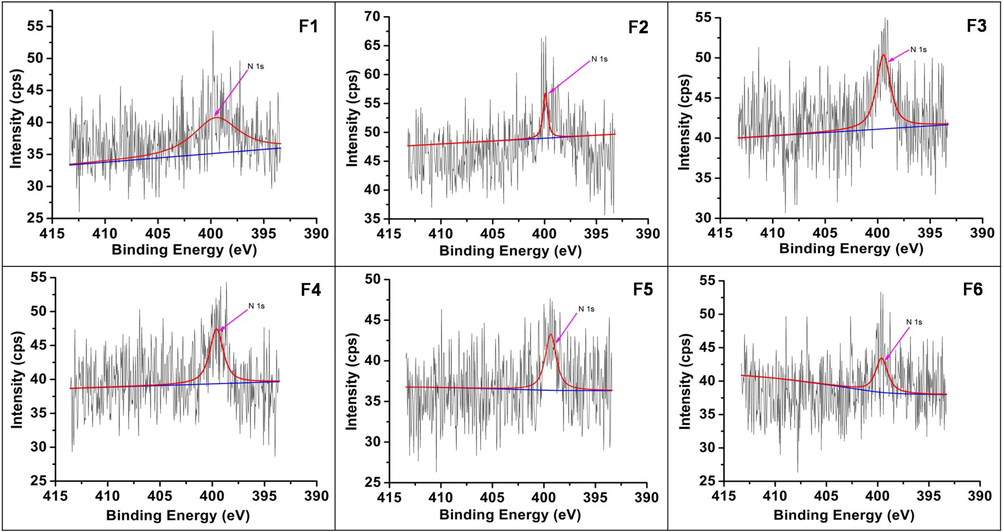
High-resolution XPS – N1s spectra of samples F1-F6.
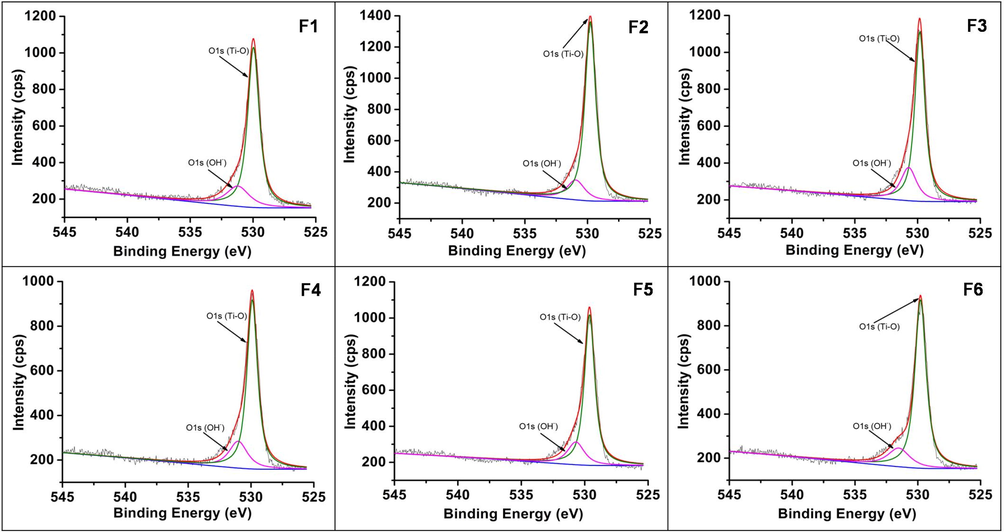
High-resolution XPS – O1s spectra of samples F1-F6.
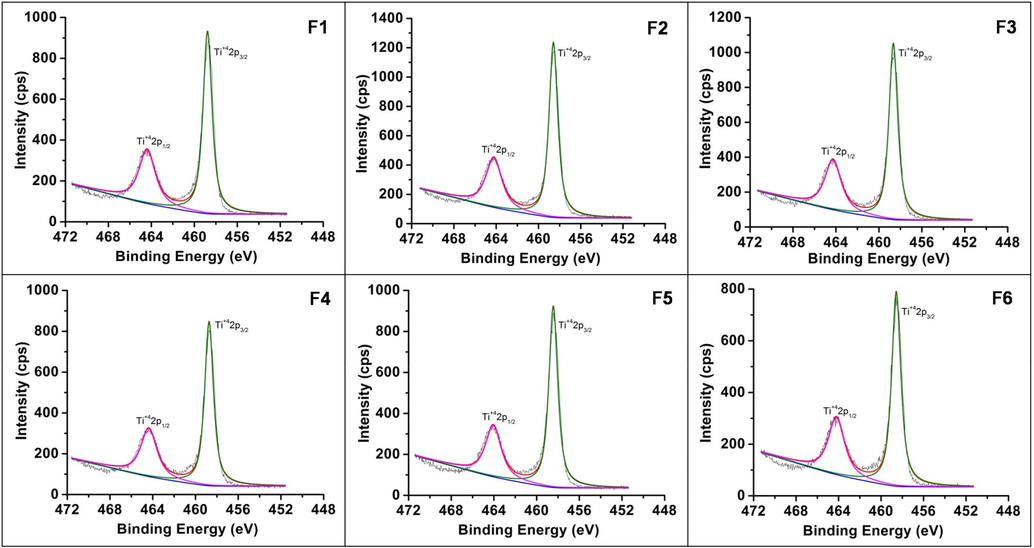
High-resolution XPS – Ti2p spectra of samples F1-F6.
3.2 Photocatalytic activity
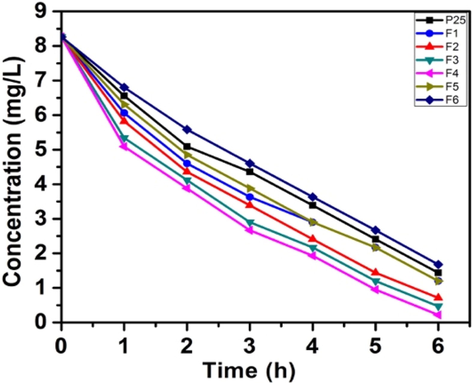
The photo-degradation studies of MB and RhB under natural sunlight irradiation in comparison with Degussa P25 tested the effectivity of the catalysts. Cationic dyes are regarded as toxic pollutants and cause harmful effects. We had observed earlier the complete degradation of MB under direct sunlight (Chen et al., 2019; Basavarajappa et al., 2020). RhB (C28H31ClN2O3) is a basic dye, which is an important member of xanthene dyes. The results obtained for MB are depicted in graphical form (Fig. 9a). All the catalysts except F6 shows rapid degradation than Degussa P25. As stated in the literature, the introduction of nitrogen in TiO2 lattice is responsible for the improvement of the photocatalytic activity of these samples. The detailed degradation studies revealed that, among the six samples, those prepared using semicarbazide precursor (samples F4 and F3) showed the highest photo-decomposition rate and the sample F4 being the most active of all. Furthermore, the samples prepared from urea (F1, F2), though having more visible light absorbance, show activity lower than that of samples F3 and F4. The highest photocatalytic activity of the sample F4 could be attributed to the optimum nitrogen doping, anatase–rutile coupling, smaller size, large surface area, efficient charge separation and presence of more surface hydroxyl groups. The low surface area of the two samples F5 and F6 are responsible for the poor adsorption of the reactant molecules on the catalytic surface, thus resulting in comparatively lower activity.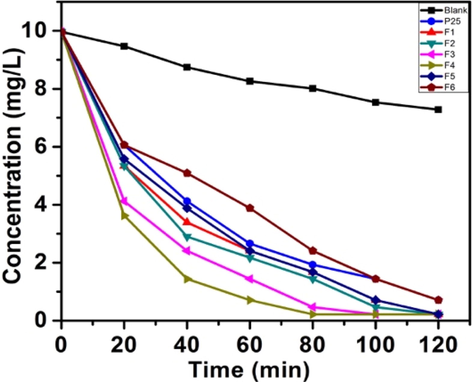
Sunlight degradation plots for MB.
The results of photo-degradation of the RhB (Fig. 9c) further confirmed the catalytic activity of the samples. The degradation behaviors were similar and were at a slower rate than that of the MB.
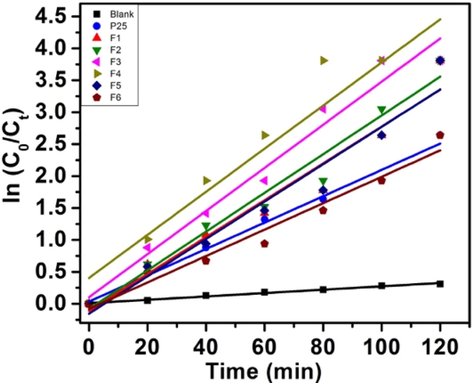
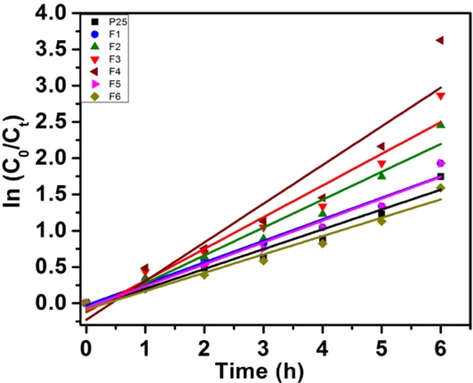
Langmuir–Hinshelwood kinetic model was used to study the kinetics of the degradation reaction under optimized conditions, and Table 2 gives the rate constant k values for both the dyes. The respective plots of ln (C0/Ct) versus time for MB and RhB (Figs. 9b and 9d respectively) represents the straight line, which indicates the photocatalytic degradation follows pseudo-first-order kinetics in both the cases. All the photocatalysts show linear relationships and the apparent reaction rate constant is highest for sample F4. Further the catalyst F1, F3 and F5 were evaluated for UV and visible light degradation of MB where again similar degrdation trend was observed ($11–12, supplementary data). The comparative data is presented in Table 3.
Sample
Cryst.
Particle
BET surf.
Pore vol.
λmax
Rate constant k
size
size
area
(cc/g)
(nm)
MB
RhB
(nm)
(nm)
(m2/g)
(min−1)
(min−1)
F1
11.9
11.4
43.6
0.089
460
0.0289
0.0049
F2
12.5
12.1
41.5
0.084
430
0.0303
0.0064
F3
7.8
7.4
76.0
0.174
414
0.0338
0.0073
F4
6.6
6.5
85.8
0.162
395
0.0342
0.0089
F5
10.9
11.4
22.0
0.038
461
0.0293
0.0050
F6
6.2
6.8
16.9
0.028
444
0.0207
0.0042
P25
25.0
21.0
56.0
0.250
370
0.0206
0.0046
Kinetics of MB degradation.
Sunlight degradation plots for RhB.
Kinetics of RhB degradation.
Sample
Rate constant k (min−1)
Sunlight
UV light
Vis light
F1
0.0289
0.0295
0.0162
F3
0.0338
0.0347
0.0193
F5
0.0293
0.0245
0.0139
P25
0.0206
0.0193
0.0118
Recyclability studies of the catalysts were done for three cycles (Fig. $ 13–14, supplementary data). The recovery of the catalysts was made by centrifugation and drying. Negligible loss in activity was seen in all the catalysts.
3.3 Plausible mechanistic pathway of photocatalysis
On exposure to light absorption of photon takes place and electron-hole pairs are generated. These electron and holes can either take part in a photochemical reaction or recombine. The nano junction between anatase and rutile facilitate transfer of holes and electrons (Fig. 10) which reduces the possibility of recombination of charges thereby making the photocatalyst process more facile.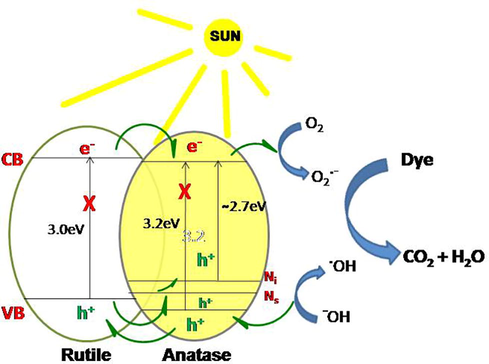
Plausible mechanism.
4 Conclusion
In the present work we have shown that the photocatalysis reaction of N-TiO2 catalyst prepared by calcination of nitrogen precursors at 500 °C which can potentially form melamine derived oligomers is due to nitrogen incorporation in the lattice of TiO2 and not by surface deposited melamine oligomers. The present report is the first report on urea derivatives, semicarbazide and N,N’-dimethyl urea, as a nitrogen source for doping studies. Of all the samples, those prepared using semicarbazide as a precursor gave the best catalysts for photo-degradation studies. The slow evaporation of urea due to the formation of melamine derived products is responsible for the exclusive formation of the anatase phase. The N-source primarily decides the surface properties of the catalysts rather than the variability of the synthetic method. Other than the presence of nitrogen, a large surface area, smaller size and a critical rutile-anatase couple helps in enhancing visible light photocatalytic activity of N-TiO2. The present catalyst can be utilized for for other photochemical processes.
Acknowledgments
The authors thank SAIF IIT Bombay, IIT Madras, IIT Kanpur, MNIT Jaipur and Solapur University for instrumental analysis. Pratibha V. Bakre acknowledges UGC, India for the award of BSR fellowship.
Declaration of Competing Interest
The authors declare that they have no known competing financial interests or personal relationships that could have appeared to influence the work reported in this paper.
References
- Layer-wise titania growth within dimeric organic functional group viologenperiodic mesoporous organosilica as efficient photocatalyst for oxidative formic acid decomposition. ChemCatChem. 2019;11:4803-4809.
- [CrossRef] [Google Scholar]
- Nitrogen-doped titanium dioxide (N-doped TiO2) for visible light photocatalysis. New J. Chem.. 2016;40:3000-3009.
- [CrossRef] [Google Scholar]
- Diclofenac removal from water by photocatalysis- assisted filtration using activated carbon modified with N-doped TiO2. Process Saf. Environ. Prot.. 2020;138:324-336.
- [CrossRef] [Google Scholar]
- Visible-Light Photocatalysis in Nitrogen-Doped Titanium Dioxide. Sci.. 2001;293:269-271.
- [CrossRef] [Google Scholar]
- Nitrogen-Doped Titanium Dioxide as Visible-Light-Sensitive Photocatalyst: Designs, Developments and Prospects. Chem. Rev.. 2014;114:9824-9852.
- [CrossRef] [Google Scholar]
- Dicarboxylic Acids as Soft Templates for the Sol-Gel Synthesis of Mesoporous Nano TiO2 with Enhanced Photocatalytic Activity. ChemistrySelect 2017:7063-7072.
- [CrossRef] [Google Scholar]
- Photocatalytic activity of mixed-phase of TiO2 synthesized by non-aqueous methodology. Indian J. Chem.. 2020;59A:768-774.
- [Google Scholar]
- Investigation of amino acids as templates for the sol–gel synthesis of mesoporous nano TiO2 for photocatalysis. Monatsh. Chem. 2018;149:11-18.
- [CrossRef] [Google Scholar]
- Direct access to highly crystalline mesoporous nano TiO2 using sterically bulky organic acid templates. J. Phys. Chem. Solids. 2018;116:234-240.
- [CrossRef] [Google Scholar]
- Influence of Acid Chain Length on the Properties of TiO2 Prepared by Sol-Gel Method and LC-MS Studies of Methylene Blue Photodegradation. J. Colloid Interface Sci.. 2016;474:58-67.
- [CrossRef] [Google Scholar]
- Recent progress in metal-doped TiO2, non-metal doped/codoped TiO2 and TiO2 nanostructured hybrids for enhanced photocatalysis. Int. J. Hyd. Energy. 2020;45:7764-7778.
- [CrossRef] [Google Scholar]
- Adsorption and catalytic thermolysis of gaseous urea on anatase TiO2 studied by HPLC analysis, DRIFT spectroscopy and DFT calculations. Appl. Catal. B. 2013;134–135:316-323.
- [CrossRef] [Google Scholar]
- The fabrication of self-floating Ti3+/N co-doped TiO2/diatomite granule catalyst with enhanced photocatalytic performance under visible light irradiation. Appl. Surf. Sci.. 2019;467–468:514-525.
- [CrossRef] [Google Scholar]
- Synthesis and Characterization of Nitrogen-Doped TiO2 Nanophotocatalyst with High Visible Light Activity. J. Phys. Chem. C. 2007;111:6976-6982.
- [CrossRef] [Google Scholar]
- Theoretical studies of HNCO adsorption at stabilized iron complexes in the ZSM-5 framework. Micropor. Mesopor. Mater.. 2013;169:97-102.
- [CrossRef] [Google Scholar]
- DFT calculations, DRIFT spectroscopy and kinetic studies on the hydrolysis of isocyanic acid on the TiO2-anatase (101) surface. J. Mol. Catal. A: Chem.. 2008;280:68-80.
- [CrossRef] [Google Scholar]
- The Effect of Nitrogen Ion Implantation on the Photoactivity of TiO2 Rutile Single Crystals. J. Phys. Chem. B. 2004;108:52-57.
- [CrossRef] [Google Scholar]
- Band Structure and Visible Light Photocatalytic Activity of Multi-Type Nitrogen Doped TiO2 Nanoparticles Prepared by Thermal Decomposition. J. Hazard. Mater.. 2009;162:763-770.
- [CrossRef] [Google Scholar]
- The Tautomeric Forms of Cyameluric Acid Derivatives. Chem. Eur. J.. 2007;13:1158-1173.
- [CrossRef] [Google Scholar]
- Highly Visible Light Active TiO2–xNx Heterojunction Photocatalysts. Chem. Mater.. 2010;22:3843-3853.
- [CrossRef] [Google Scholar]
- Molecularly imprinted N-doped TiO2 photocatalysts for the selective degradation of o-phenylphenol fungicide from water. Mater. Sci. Semicond. Process.. 2020;112:105019
- [CrossRef] [Google Scholar]
- Frisch, M.J., Trucks, G.W., Schlegel, H.B., Scuseria, G.E., Robb, M.A., Cheeseman, J.R., Scalmani, G., Barone, V., Mennucci, B., Petersson, G.A., Nakatsuji, H., Caricato, M., Li, X., Hratchianm, H.P., Izmaylov, A.F., Bloino, J., Zheng, G., Sonnenberg, J.L., Hada, M., Ehara, M., Toyota, K., Fukuda, R., Hasegawa, J., Ishida, M., Nakajima, T., Honda, Y., Kitao, O., Nakai, H., Vreven, T., Montgomery Jr., J.A., Peralta, J.E., Ogliaro, F., Bearpark, M., Heyd, J.J., Brothers, E., Kudin, K.N., Staroverov, V.N., Kobayashi, R., Normand, J., Raghavachari, K., Rendell, A., Burant, J.C., Iyengar, S.S., Tomasi, J., Cossi, M., Rega, N., Millam, J.M., Klene, M., Knox, J.E., Cross, J.B., Bakken, V., Adamo, C., Jaramillo, J., Gomperts, R., Stratmann, R.E., Yazyev, O., Austin, A.J., Cammi, R., Pomelli, C., Ochterski, J.W., Martin, R.L., Morokuma, K., Zakrzewski, V.G., Voth, G.A., Salvador, P., Dannenberg, J.J., Dapprich, S., Daniels, A.D., Farkas, O., Foresman, J.B., Ortiz, J.V., Cioslowski, J., Fox, D.J., 2009. Gaussian, Inc., Wallingford, CT.
- A Simple Method to Synthesize N-Doped Rutile Titania with Enhanced Photocatalytic Activity in Sunlight. J. Solid State Chem.. 2005;178:2953-2957.
- [CrossRef] [Google Scholar]
- A Simple Method to Synthesize Visible Light Active N-Doped Anatase (TiO2) Photocatalyst. Bull. Catal. Soc. India. 2005;4:131-134.
- [Google Scholar]
- Polymorphic Phase Transition Among the Titania Crystal Structures using a Solution-Based Approach: from Precursor Chemistry to Nucleation Process. Nanoscale. 2014;6:11574-11632.
- [CrossRef] [Google Scholar]
- Adsorption, surface area, and porosity (second ed.). New York: Academic Press; 1982. p. :303. https://doi.org/10.1002/bbpc.19820861019
- Improved photocatalytic activity of ZnO-TiO2 nanocomposite catalysts by modulating TiO2 thickness. Mater. Res. Express. 2019;6:115060
- [CrossRef] [Google Scholar]
- Amorphous and Nanocrystalline Titanium Nitride and Carbonitride Materials Obtained by Solution Phase Ammonolysis of Ti(NMe2)4. J. Solid State Chem.. 2006;179:1383-1393.
- [CrossRef] [Google Scholar]
- Photocatalytic degradation of norfloxacin using N-doped TiO2: Optimization, mechanism, identification of intermediates and toxicity evaluation. Chemosphere. 2019;237:124433
- [CrossRef] [Google Scholar]
- Synthesis and characterization of N-doped TiO2 nanoparticles and their application in photocatalytic oxidation of dibenzothiophene under visible light. Ceram. Int.. 2016;42:14834-14842.
- [CrossRef] [Google Scholar]
- Visible-Light Active N-Doped TiO2 Prepared by Heating of Titanium Hydroxide and Urea. J. Photochem. Photobiol. A 170 2005:177-179.
- [CrossRef] [Google Scholar]
- Synthesis of N-doped Titanium Oxide by Hydrothermal Treatment. J. Mater. Sci.. 2008;43:2492-2498.
- [CrossRef] [Google Scholar]
- Nanolayered Heterostructures of N-Doped TiO2 and N-Doped Carbon for Hydrogen Evolution. ACS Appl. Nano Mater.. 2020;3:1373-1381.
- [CrossRef] [Google Scholar]
- Photocatalytic hydrogen production using metal doped TiO2: A review of recent advances. Appl. Catal. B. 2019;244:1021-1064.
- [CrossRef] [Google Scholar]
- Influence of Electronic Structure on Visible Light Photocatalytic Activity of Nitrogen-Doped TiO2. RSC Adv.. 2017;7:1887-1898.
- [CrossRef] [Google Scholar]
- Nitrogen Doped 3D Titanium Dioxide Nanorods Architecture with Significantly Enhanced Visible Light Photoactivity. J. Phys. Chem. C. 2015;119:4397-4405.
- [CrossRef] [Google Scholar]
- Facile synthesis of nitrogen doped ordered mesoporous TiO2 with improved humidity sensing properties. J. Alloy Compd.. 2018;742:814-821.
- [CrossRef] [Google Scholar]
- Origin of Photoactivity of Nitrogen-Doped Titanium Dioxide under Visible Light. J. Am. Chem. Soc.. 2006;128:15666-15671.
- [CrossRef] [Google Scholar]
- A new route for the synthesis of highly-active N-doped TiO2 nanoparticles for the visible light photocatalysis using urea as nitrogen precursor. Catal. Today. 2019;326:36-45.
- [CrossRef] [Google Scholar]
- The Nature of Nitrogen-Modified Titanium Dioxide Photocatalysts Active in Visible Light. Angew. Chem. Int. Ed.. 2008;47:9975-9978.
- [CrossRef] [Google Scholar]
- On the Mechanism of Urea-Induced Titania Modification. Chem. Eur. J.. 2010;16:261-269.
- [CrossRef] [Google Scholar]
- Photocatalytic NOx abatement: Recent advances and emerging trends in the development of photocatalysts. J. Clean. Prod.. 2020;270:121912
- [CrossRef] [Google Scholar]
- Novel Architecture Titanium Carbide (Ti3C2Tx) MXene Cocatalysts toward Photocatalytic Hydrogen Production: A Mini-Review. Nanomater.. 2020;10:602.
- [CrossRef] [Google Scholar]
- MXenes: Applications in electrocatalytic, photocatalytic hydrogen evolution reaction and CO2 reduction. Mol. Catal.. 2020;486:110850
- [CrossRef] [Google Scholar]
- Effect of N-doping on the photocatalytic activity of sol–gel TiO2. J. Hazard. Mater.. 2012;211:88-94.
- [CrossRef] [Google Scholar]
- Nitrogen-Doped Titanium Dioxide Photocatalysts for Visible Response Prepared by using Organic Compounds. Sci. Technol. Adv. Mater.. 2005;6:143-148.
- [CrossRef] [Google Scholar]
- A critical evaluation of the mode of incorporation of nitrogen in doped anatase photocatalysts. Phys. Chem. Phys.. 2010;12:960-969.
- [CrossRef] [Google Scholar]
- About the Nitrogen Location in Nanocrystalline N-Doped TiO2: Combined DFT and EXAFS Approach. J. Phys. Chem. C.. 2012;116:1764-1771.
- [CrossRef] [Google Scholar]
- Synthesis of High-Temperature Stable Anatase TiO2 Photocatalyst. J. Phys. Chem. C. 2007;111:1605-1611.
- [CrossRef] [Google Scholar]
- Low temperature design of titanium dioxide anatase materials decorated with cyanuric acid for formic acid photodegradation. J. Saudi Chem. Soc.. 2020;24:351-363.
- [CrossRef] [Google Scholar]
- Photocatalytic Activity of NOx-Doped TiO2 in the Visible Light Region. Chem. Phys. Lett.. 1986;123:126-128.
- [CrossRef] [Google Scholar]
- Melamine-Melem Adduct Phases: Investigating the Thermal Condensation of Melamine. Chem. Eur. J.. 2009;15:13161-13170.
- [CrossRef] [Google Scholar]
- Laser Synthesis and Characterization of Nitrogen-Doped TiO2 Vertically Aligned Columnar Array Photocatalysts. J. Phys. Chem. C. 2012;116:14534-14540.
- [CrossRef] [Google Scholar]
- Kinetics of the Anatase-Rutile Transformation. J. Am. Ceram. Soc.. 1965;48:391-398.
- [CrossRef] [Google Scholar]
- Physisorption Hysteresis Loops and the Characterization of Nanoporous Materials. Adsorpt. Sci. & Technol.. 2004;22:773-782.
- [CrossRef] [Google Scholar]
- Porosity Driven Photocatalytic Activity of Wormhole Mesoporous TiO2-xNx in Direct Sunlight. J. Mater. Chem.. 2011;21:2639-2647.
- [CrossRef] [Google Scholar]
- Molecularly Adsorbed H2O on the Bare Surface of TiO2 (Rutile) Langmuir. 1987;3:786-788.
- [CrossRef] [Google Scholar]
- Characterization of Species Adsorbed on Oxidized and Reduced Anatase. J. Phys. Chem.. 1982;86:4708-4714.
- [CrossRef] [Google Scholar]
- Appl. Surf. Sci.. 2017;399:514-522.
- [CrossRef]
- Characterization of paramagnetic species in N-doped TiO2 powders by EPR Spectroscopy and DFT calculations. J. Phys. Chem. B. 2005;109:11414-11419.
- [CrossRef] [Google Scholar]
- An Efficient Two-Step Technique for Nitrogen-Doped Titanium Dioxide Synthesizing: Visible-Light-Induced Photodecomposition of Methylene Blue. J. Phys. Chem. C. 2007;111:1010-1014.
- [CrossRef] [Google Scholar]
- Origin of Photocatalytic Activity of Nitrogen-Doped TiO2 Nanobelts. J. Am. Chem. Soc.. 2009;131:12290-12297.
- [CrossRef] [Google Scholar]
- Visible Light Induced Electron Transfer Process over Nitrogen Doped TiO2 Nanocrystals Prepared by Oxidation of Titanium Nitride. J. Hazard. Mater.. 2008;157:57-63.
- [CrossRef] [Google Scholar]
- Effects of N Doping on the Microstructures and Optical Properties of TiO2. J. Wuhan Univ. Technol.-Mat. Sci. Ed.. 2019;34:55-63.
- [CrossRef] [Google Scholar]
- Enhancement of photocatalytic activity of mesoporous TiO2 by using carbon nanotubes. Appl. Cata. A: Gen.. 2005;289:186-196.
- [CrossRef] [Google Scholar]
- Preparations and Photocatalytic Hydrogen Evolution of N-Doped TiO2 from Urea and Titanium Tetrachloride. Int. J. Hydrog. Energy. 2006;31:1326-1331.
- [CrossRef] [Google Scholar]
- Comparative study on the visible light driven photocatalytic activity between substitutional nitrogen doped and interstitial nitrogen doped TiO2. Appl. Catal. A: Gen.. 2014;488:239-247.
- [CrossRef] [Google Scholar]
- A modular calcination method to prepare modified N-doped TiO2 nanoparticle with high photocatalytic activity. Appl. Catal. B. 2016;183:308-316.
- [CrossRef] [Google Scholar]
- Preparation and visible-light photocatalytic properties of BiNbO4 and BiTaO4 by a citrate method. J. Solid State Chem.. 2013;202:6-14.
- [CrossRef] [Google Scholar]
- Ti-based Electrode Materials for Electrochemical Sodium Ion Storage and Removal. J. Mater. Chem. A. 2019;7:22163-22188.
- [CrossRef] [Google Scholar]
- Construction of 1D-MoS2 nanorods/LiNb3O8 heterostructure for enhanced hydrogen evolution. Appl. Mater. Today. 2020;18:100536
- [CrossRef] [Google Scholar]
- Abnormal phase transition in BiNbO4 powders prepared by a citrate method. J. Alloy Compd.. 2011;509:10230-10233.
- [CrossRef] [Google Scholar]
- Development of modified N doped TiO2 photocatalyst with metals, nonmetals and metal oxides. Energy Environ. Sci.. 2010;3:715-726.
- [CrossRef] [Google Scholar]
Appendix A
Supplementary material
Supplementary data to this article can be found online at https://doi.org/10.1016/j.arabjc.2020.09.001.
Appendix A
Supplementary material
The following are the Supplementary data to this article:Supplementary Data 1
Supplementary Data 1


