

Translate this page into:
Influence of neck slaughtering in broiler chicken meat on physicochemical analysis and metabolites ‘fingerprinting’ to enhance meat quality
⁎Corresponding author at: Programme of Food Biotechnology, Faculty of Science and Technology, Universiti Sains Islam Malaysia, 71800 Nilai, Negeri Sembilan, Malaysia. nazariyah@usim.edu.my (Nazariyah Yahaya)
-
Received: ,
Accepted: ,
This article was originally published by Elsevier and was migrated to Scientific Scholar after the change of Publisher.
Abstract
Animal slaughtering is the most vital step in the preparation of chicken meat. The step ensures the meat is safe for human consumption since the procedure of animal slaughtering can affect the meat quality. In this study, we compare the quality of chicken meats obtained via two common slaughtering procedures: neck slaughtering (NS) and neck pocking (NP). The meat quality was assessed based on physicochemical analyses (ultimate pH, colour, heme iron content, drip and thaw loss measurements and TBARS value) and metabolite profiling (FTIR, GC–MS and UHPLC with PCA and PLS-DA). The study found that, relative to the NP-, the NS-chicken meat had slightly acidic pH, and much lower values of the following parameters: L* (lightness) (P = 0.023), heme iron content (P < 0) and TBARS (P < 0.01). Comparing FTIR spectra, the metabolite fingerprints of both meats looked slightly different. This was confirmed to be due to a set of differential metabolites present in the NS and the NP-chicken meats, as recorded by GC–MS and UHPLC-TOF-MS data after analyzing with PCA and PLS-DA. Compared to the NP, the NS-chicken meat was rich in metabolites with health benefits, including n-3-polyunstaurated fatty acids (PUFA), triglyceride (TG), cytadine and uridine. In addition, the NS-chicken meat also contained much lower concentrations of free amino acids. This is desirable as free amino acid-deficiency is able to suppress the production of biogenic compounds, a group of chemicals that produce toxicological effects on human heath when taken excessively.
Keywords
Broiler chickens
Neck slaughtering
Neck poking
Metabolite ‘fingerprinting’
Physicochemical analysis

1 Introduction
Demand for meat and meat products which are considered as an important protein group of food has been growing constantly worldwide (Daghir et al. 2020; Wong et al. 2017). According to the Food and Agriculture Organization (FAO), global poultry meat consumption was recorded to be 13.2 kg/person in 2013; the figure is predicted to increase by 1.7 kg per person in 2023. Nowadays, consumers are demanding for a good quality of meats as they become more aware of the food safety and quality (Gonzalez et al. 2020). Meat quality can be affected by various intrinsic and extrinsic factors, include slaughtering methods. Slaughtering methods have been a worldwide discussion due to the fact that animal welfare and meat quality produced become a serious concern (Bonnet et al. 2020).
Various slaughtering procedures for poultry production have been practiced, and amongst them are neck slaughtering (NS) and neck poking (NP). The NS involves severing four veins, trachea, esophagus, carotid artery and jugular vein (Gibson et al. 2015). The procedure is carried out carefully to avoid severing the spine because the continued functioning of the nervous system will allow the heart to beat and pump blood out. The NS procedure is believed to be able to maximize blood removal. Meanwhile, the NP procedure uses a long steel to poke the neck of the chicken, allowing little blood drainage (Hafiz et al. 2015). The chicken is then immediately drowned in water. This is to shorten the death and the processing time besides ensuring the produced meat is free of bruises. These slaughtering procedures were chosen in order to assess the bleeding efficiency on meat quality and metabolite profiles of chicken meat.
In order to obtain a good quality of meat, optimizing blood loss during the slaughtering procedure is essential. This is because residual blood in the carcass is usually linked to a decrease in shelf life and meaty flavor. It has been reported that blood retained in the meat can promote microbial growth due to its high nutritive value and favorable pH (Addeen et al., 2014). Besides, the myoglobin and haemoglobin can catalyze lipid oxidation, likely decreasing the meat quality (Sabow et al., 2016; Thiansilakul et al., 2012). Therefore, bleeding efficiency during slaughter becomes a major concern in order to enhance product quality, shelf life and reduce defects (Sabow et al., 2016).
Metabolomics approach has been used widely as a discriminatory technique to understand biological processes at a system level, such as assess the adulteration of meat (Trivedi et al., 2016), determination of Halal and non-Halal meat (Ali et al., 2020) and understand the interaction between host and pathogen during infection (Yahaya et al., 2017). Metabolomics data requires a classification tool to identify metabolite signature patterns with different experimental treatments. It can be obtained using multivariate statistical analysis from unsupervised or supervised algorithms including hierarchical clustering heat map, Principle Component Analysis (PCA) and Partial Least Square – Discriminant Analysis (PLS-DA) (Xia et al., 2015). Recently, it has been reported that between chicken subjected to slaughtering method of NS and completely detaching neck, signifying the different metabolites content which belong to nucleotides, compound in plasma membrane, peptides, amino acids, glycosides, neurotransmitter and some plant metabolites (Abbas et al. 2020). Abbas et al. performed the metabolomics approach by using Liquid Chromatography Quadrupole Time-of-Flight Mass Spectrometry (LC-Q-TOF-MS) and combining with PCA analysis. Hence, our study was to elucidate the meat quality of chicken meat from the NS and the NP procedures using physicochemical analysis and metabolomics fingerprinting by combining GC–MS and UHPLC-TOF-MS data with PCA and PLS-DA.
2 Experimental
2.1 Ethics statement
The full procedure, including consent protocols, was approved by the Animal Ethics Committee of Universiti Sains Islam Malaysia (USIM/AEC/AUP/2018(3), after specific consideration of the ethical factors relating to the animals involved.
2.2 Chicken slaughtering procedures
A group of four to five male broiler chickens (Gallus domesticus) were used in each slaughtering procedure (NS and NP). Each of them aged 60 days and weighed approximately 1.5 kg. For the NS procedure, trachea, esophagus, jugular veins, and carotid arteries of the chickens were severed using a sharp knife. No stunning was conducted throughout the procedure. In the scalding process, the chickens were immediately immersed in hot water for 20 s, eviscerated by removing their feathers, and then cleaned using flowing water. This method or practices are called scalding, and this was performed to aid the removal of feathers from the whole chicken. The process does not affect the overall quality of meat as the skin is still intact (Zhuang et al., 2013). Overall, this process takes around 20 s at the range 50–60 °C depending on the size of the bird. Subsequently, breast muscles (Pectoralis major muscle) were taken from the slaughtered chickens and labelled as ‘NS-chicken meat’.
In the event of NP procedure, the chicken necks were poked with a sharp pointed object, creating a small hole for blood drainage. The chickens were quickly drowned in water. After immersing in hot water for 20 s, the chickens were eviscerated by removing their feathers, followed by further cleansing using flowing water. The breast muscle (Pectoralis major muscle) was taken and labelled as ‘NP chicken meat’. The chicken meats were kept at 4 °C for 24 h before physicochemical analyses and kept at at −80 °C prior to undergoing the metabolite extraction.
2.3 Physicochemical analyses on chicken meat
2.3.1 Ultimate pH
According to the protocol of Dadgar et al. (2010), chicken meat (5 g) was mixed with deionised water (20 mL) and homogenised using a homogenizer (Yellow line DI 25 basic, Colonial Scientific, Richmond, VA) at 13,600 r.p.m for 1 min. The pH of the homogenate was measured by a Mettler Toledo pH meter.
2.3.2 Color
As recommended by Dadgar et al. (2010), a specific area of chicken meat, free of any obvious color defects, bruises, and blood spots, was analysed by a Hunter Labscan colorimeter (Minolta CR-300, Minolta Corp., Ramsey, NJ). The resultant lightness (L*), redness (a*), and yellowness (b*) values were recorded.
2.3.3 Drip loss measurement
The procedure for drip loss measurement was followed as reported by Wang et al. (2005). The measurement was conducted by using the Eq. (1).
= Sample weight before freezing
= Sample weight after 24 h refrigeration
2.3.4 Thaw loss measurement
After 24 h, samples were removed from 4 °C storage. The samples were thawed at room temperature for 30 min (Dadgar et al. 2010). Thaw loss measurement was obtained by using the Eq. (2).
= Sample weight before freezing
= Sample weight after thawing
2.3.5 Heme iron content
The method of Pourkhalili et al. (2013) was adopted, but with modifications. An acidified-acetone solution was prepared by mixing acetone, deionized water and hydrochloric acid at a ratio of 90:8:2% v/v. Subsequently, ground chicken meat (2 g) was mixed with the acidified-acetone. The resultant mixture was allowed to stand at room temperature for 1 h and later filtered through a filter paper (Whatman No-1). The filtrate was analysed by UV–Vis Spectrophotometer (Varian Cary 50, Varian Inc., USA) and its absorbance was recorded at 640 nm (against an acid-acetone mixture as blank). The analysis was also performed on chicken-meats stored at 4 °C for 1, 3, 5, 7 and 9 days. The following equation was employed to calculate the heme iron content.
Heme iron content (mg/100 g of wet sample) = To × 0.0822
Here, To: total heme pigment (ppm) (A640 × 680)
2.3.6 Thiobarbituric acid reactive substances (TBARS)
The experiment was followed as being reported by Benjakul & Bauer (2011). Ground-chicken meat (1 g) was added to 5 mL solution (0.375% of 2-thiobarbituric acid (TBA), 15% trichloroacetic acid (TCA) and 0.25 N HCl,). The mixture was incubated in a water bath at 95 °C for 15 min, cooled to room temperature, and later centrifuged at 3600 r.p.m. at 4 °C for 20 min. The supernatant was collected; its absorbance was read at 532 nm using a UV–VIS Spectrophotometer (Varian Cary 50, Varian Inc., USA). TBARS value (expressed as mg malonaldehyde per kg wet sample) was determined from a calibration curve of malonaldehyde standards (2, 4, 6, 8, 10 μmole/L). The analysis was repeated using chicken meats stored at 4 °C for extended periods (3, 5, 7 and 9 days).
2.4 Metabolite extraction for metabolite ‘Fingerprinting’ and profiling
Four male broiler chickens were used in each slaughtering procedure (NP or NS). The extraction followed the method described by González-Peña et al. (2017), but with modifications. The Frozen chicken meat (stored at −80 °C in liquid nitrogen) was homogenized to a fine powder in liquid nitrogen using a pestle and mortar. The powder (500 mg) and cold methanol (1 mL) were mixed on a vortex mixer for 10 s. The resultant mixture was immersed in ice for 10 min, vortex mixing for 10 s and later centrifuged at 14,000 r.p.m. for 10 min (at room temperature). The supernatant was collected in 1.5 mL centrifuge tubes (Eppendorf) and stored at −80 °C prior to analyzing by: fourier-transform infrared spectroscopy (FTIR), gas chromatography-mass spectrometry (GC–MS), and ultra-high performance liquid chromatography-time of flight-mass spectrometry (UHPLC-TOF-MS).
2.4.1 FTIR
The supernatants were analysed using a spectrum 100 Perkin Elmer equipped with a detector of deuterated triglycine sulphate (DTGS) and a beam splitter of KBr/Germanium. They were placed on an attenuated total reflectance (ATR) crystal which positioned on a multibounce plate. The recorded profiles were compared using the FTIR software Spectrograph version 1.2.8. Meanwhile, a Nicolet iS50 FTIR spectrometer was used to obtain a full spectrum in the mid-infrared region (650–4000 cm−1) at the number of scans of 32 with a resolution of 4 cm−1.
2.4.2 GC–MS
The supernatants were analyzed on a GCMS (Agilent Technologies) equipped with, an Agilent J&W DB-5 column (length 30 m, internal diameter 0.25 mm, film thickness 1.00 μm). The column oven was programmed as follows: temperature was held at 70˚C 4 min, increased to 300˚C at 10˚C/min, and finally maintained at 300˚C for 6 min. Other conditions were: helium carrier gas (velocity of 39.0 cm/s) at a flow rate 3 mL/min, and injection port temperature of 250 °C. The supernatant (1 μL) was injected in split injection mode with a split ratio of 10:1. Quadrupoles were used for MS mass separation, and electron impact was used for ionisation. The ion source temperature was 200 °C, the interface temperature was 280 °C, and the ionisation voltage was 70 eV. The measurement was carried out in the scan mode in the range of 45–600 m/z. Each recorded spectrum was compared with the standard mass spectra library of National Institute of Standards and Technology (NIST).
2.4.3 UHPLC-TOF-MS
The supernatants were passed through a column (ACQUITY UPLC HSS T3, 100 mm × 2.1 mm × 1.8 μm) at 40 °C, with an injection volume of 1 μL and at a flow rate of 0.6 mL/min. A linear binary gradient of water (0.1% formic acid) and acetonitrile (mobile phase B) was used as mobile phase A and B respectively. The mobile phase composition was changed during the run as follows: 0 min, 1% B; 0.5 min, 1% B; 16.00 min, 35% B; 18.00 min, 100% B; 20.00 min, 1% B. A Vion IMS QTOF hybrid mass spectrometer from Waters (Manchester, UK) was used to obtain MS data. Analysis was performed in negative ion mode with the following settings: capillary voltage, 1.50 kV; reference capillary voltage, 3.00 kV; source temperature, 120 °C; desolvation gas temperature, 550 °C; desolvation gas flow, 800 L/h, and cone gas flow, 50 L/h. Data were acquired in high-definition MSE (HDMSE) mode in the range m/z 50–1500 at 0.1 s/scan. Standard mass spectra library from WATERS, UK was used for compound identification.
2.5 Statistical analysis
2.5.1 Mean difference analysis
All collected data of the physicochemical properties of the NP- and the NS-chicken meats (ultimate pH, colour, heme iron content, and TBARS value) were analysed using MINITAB-16 software (Minitab Ltd, Coventry, UK) and analysis of variance (ANOVA) available in the software. Mean difference analysis was conducted using the Tukey’s method, with significant differences were defined between the sample means (P < 0.05).
2.5.2 Metabolite profiling by multivariate analysis
All acquired data from GC–MS and UHPLC-TOF-MS were converted to Microsoft Excel and then processed by the Metaboanalyst 4.0 software in which a data integrity check and normalization was performed. The process data was subjected to principle component analysis (PCA) and partial least square-discriminant analysis (PLS-DA). The quality of resultant PLS-DA models were assessed by predictive ability (Q2) and goodness-of-fit (R2) parameters. Then, the significant metabolites obtained were further identified using MassBank and annotated on the exact mass measurement by using Gallus (chicken) in Kyoto Encyclopedia of Genes and Genomes (KEGG) pathway database.
3 Results
3.1 Physicochemical analysis on chicken meats
The consumer acceptability and quality of meat depends on the conversion of muscle to meat structures. It has been reported that the biochemical process of the conversion becomes maximum after 24 h (Warner, 2016). Owing to this, this study analysed the pectoralis major muscles (breast muscle) of the NS- and the NP-chicken meats, stored at 4 °C for 24 h.
3.1.1 Ultimate pH
The measurement in Table 1 reveals that the pH of the NS- (6.01 ± 0.02) was slightly acidic compared to the NP-chicken meats (6.34 ± 0.04) (P = 0.021). The colour of meat is known to reflect the pH value. This is evidenced by a study of Gigaud et al. (2010) that categorized chicken meats into three groups based on their pH values: (1) normal (5.70 < pH < 6.20), (2) Pale, Soft and Exudative (PSE) (pH < 5.70), and (3) Dark, Firm and Dry (DFD) (pH > 6.20). Considering this, it is clear that the NP-chicken meat falls into the DFD group, whereas the NS-chicken meat seems not to belong to any aforementioned groups simply because its pH is rather normal. The correlation between color and pH of chicken meat is associated with myofibrillar refraction, contributing to differences in light scattering (Swatland, 2008). Note: Values are from average of five determinations ± standard deviation. Different alphabet within the same column differ significantly (P < 0.05). Note: Values are from average of five determinations ± standard deviation. Different lowercase letters within the same storage time in the same row denotes the significant difference (P < 0.05). Different uppercase letters within the same sample in the same column differ significantly (P < 0.05).
Sample
pH
Lightness (L*)
Redness (a*)
Yellowness (b*)
NS Chicken Meat
6.01 ± 0.02a
52.73 ± 2.62a
6.97 ± 1.50a
21.31 ± 2.26a
NP Chicken Meat
6.34 ± 0.04b
45.52 ± 2.83b
8.06 ± 2.54a
18.42 ± 2.22a
Heme iron content
TBARS Value
Storage Time (Days)
NS Chicken Meat
NP Chicken Meat
NS Chicken Meat
NP Chicken Meat
1
3.28 ± 0.13a A
5.72 ± 0.18b A
0.17 ± 0.03a A
0.30 ± 0.04b A
3
2.09 ± 0.25a B
3.83 ± 0.01b B
0.22 ± 0.02a B
0.49 ± 0.05b B
5
1.82 ± 0.03a BC
3.42 ± 0.04b B
0.29 ± 0.02a C
0.59 ± 0.03b B
7
1.79 ± 0.02a BC
2.57 ± 0.06b BC
0.49 ± 0.02a C
0.67 ± 0.03b B
9
1.54 ± 0.17a C
1.79 ± 0.02a C
0.68 ± 0.10a C
0.95 ± 0.05b B
3.1.2 Colour
The effect of slaughtering procedures on color (lightness: L*, redness: a*, and yellowness: b*) of chicken meat is also presented in Table 1. Relative to the NP, the NS-chicken meat exhibited a higher L* value (P = 0.023), a slight decrease in a* value (P = 0.561), and an increase in b* value (P = 0.187) by 15%. A lower L* value for the NP-chicken meat might be due to inefficient blooming process caused by high pH (Wideman et al., 2016). A previous study categorized breast fillet into three groups according to L* value: (1) lighter-than-normal (L* > 53), (2) normal (48 < L* < 53), and (3) darker-than-normal (L* < 46) (Zhuang & Savage, 2010). Based on this, it was concluded that the NS- and the NP-chicken meat were identified as being normal and darker-than-normal, respectively.
3.1.3 Drip loss and thaw loss of chicken meat
Drip loss and thaw loss of chicken was measured to access water binding capacity of the meat. Water holding capacity is defined as the ability to retain inherent water even though external pressure is applied (Huff-Lonergan, 2009). This property is important as it affects both the yield and the end product quality. Drip loss and thaw loss value of NS- and NP-chicken meat are shown in Table 3. Result from this analysis showed no significant difference in drip loss and thaw loss value between samples, however NP-chicken meat has lower drip loss and thaw loss value relative to NP-Chicken meat. Note: Values are from average of three determinations ± standard deviation. Different alphabet within the same column denotes the significant difference (P < 0.05).
Sample
Drip Loss (%)
Thaw Loss (%)
NS-Chicken Meat
0.87 + 0.12a
1.38 + 0.31a
NP-Chicken Meat
0.70 + 0.17a
0.81 + 0.25a
3.1.4 Heme iron content
As overall, both NS- and NP-chicken meats displayed a decreasing trend in the heme iron content with extending storage time (the data is shown in Table 2). Two reasons could be linked to the observed trend: break down of heme iron (Benjakul & Bauer, 2011); and drip losses from meat during storage that contain a significant amount of iron and particularly soluble heme iron, as observed by Purchas et al. (2003) and Ahmed et al. (2018). Interestingly, regardless of the storage time, the obtained values for the NS-chicken meat were much lower than those of the NP-chicken meat (Table 2). A plausible explanation to this might be that, in the NS method, all four (veins trachea, esophagus, jugular veins and carotid arteries) were severed, ensuring maximum blood removal from the chicken.
3.1.5 TBARS value
The analysis resulted in two findings. The first reveals that irrespective of storage day, the TBARS values for the NS-chicken meat (P < 0.01) were found to be much lower than those of the NP-chicken meat (P = 0.034) (data shown in Table 2). Higher TBARS values in the NP-chicken meat believed to be due to improper bleeding method, resulting in higher iron and myoglobin contents in the muscle meat. Iron can catalyze the production of hydroxyl radical that can induce lipid oxidation (Min et al., 2010). Meanwhile, the interaction between metmyoglobin and hydrogen peroxide results in the production of ferrylmyoglobin that consequently initiates free radical chain reaction, thus leading to lipid oxidation (Min et al., 2010; Min et al., 2008). The second finding shows that, irrespective of the slaughtering method (NS or NP), it was found that the longer the storage time, the higher the TBARS value (Table 2).
3.2 Metabolite fingerprinting of NS and NP chicken meats
3.2.1 FTIR
Fig. 1 compares FTIR spectra of supernatants of chicken meats obtained from different conditions. Overall, the recorded spectra of NS- and NP chicken meats showed characteristic IR bands of metabolities: 3293 cm−1 (O—H stretching), 2154 cm−1 (C⚌C stretching), and 1014 cm−1 (C—N stretching). Interestingly, irrespective of storage days, the spectra of NP-chicken meats showed an increase in the intensity of C—N stretching band (relative to the NS-chicken meats). This suggests that the NS- and the NP-chicken meats might have had different metabolite fingerprints. To confirm this, the supernatants were analysed by GC–MS and UHPLC-TOF-MS, and the resultant data was then subjected to PCA and PLS-DA analyses.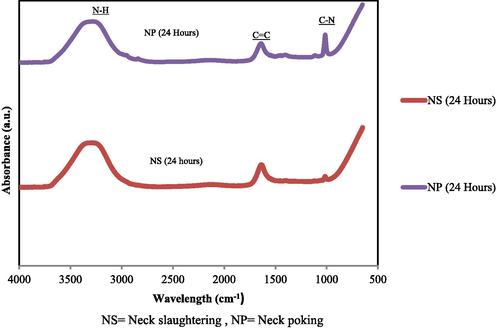
FTIR spectra of metabolite profile for neck slaughtering (NS) and neck poking (NP) chicken meats. The experiment was repeated three times.
3.2.2 GC–MS and UHPLC-TOF-MS with PCA
In this study the metabolites from the chicken meat were obtained by using methanol as an extraction solvent. Methanol was used to extract metabolites in meat powder since it is a simplify method to minimize the processing steps and also to avoid the usages of large quantities of toxic solvents like chloroform, n-hexane and even dichloromethane (Biswas et al. 2011). In addition, the usage of methanol as extraction solvent resulted the best recovery values (Sun et al. 2012). The metabolites obtained were analyzed by GC–MS and UHPLC-TOF-MS, and the resultant data was then subjected to PCA and PLS-DA analyses.
The outcomes of PCA clearly discriminate the NS- and the NP-chicken meat, corroborating with FTIR analysis. This indicates that the slaughtering procedure (NS and NP) resulted in meats having different component profiles. The discrimination is clearly demonstrated by GC–MS-PCA plot shown in Fig. 2(a); the profile of the NS-chicken meat clustered in a PC1-negative direction, while the NP-chicken meat clustered in a PC1-positive direction. As for UHLPC-TOF-MS data (Fig. 2(b)), both PC1 and PC2 accounted for 65% of accumulative total variance. Unlike GC–MS (Fig. 2(a), the profiles of the NS- and the NP-chicken meat were slightly diverse, but, the differences in the component profiles remain noticeable.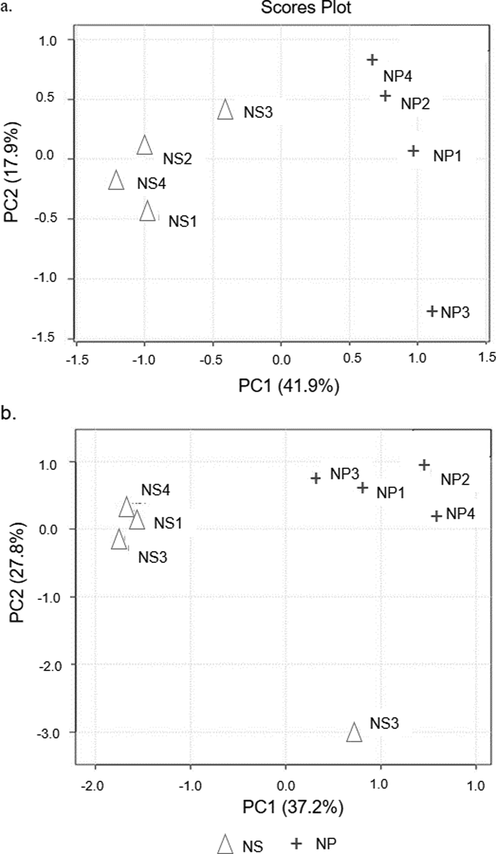
Scores plot between the selected principle components obtained from applying; (a) GC–MS and (b) UHPLC-TOF-MS data set on PCA analysis from four biological replicates of broiler chicken subjected to NS and NP procedures.
3.2.3 GC–MS and UHPLC-TOF-MS with PLS-DA
PLS-DA distinguishes the NS- and the NP-chicken meats employing a supervised method, used to build models that discriminate between labeled data. Fig. 3(a) and (b) show PLS-DA models (Component 2 plotted against Component 1) on the recorded data of GC–MS (Q2 = 0.85; R2 = 0.98) and UHPLC-TOF-MS (Q2 = 0.68; R2 = 0.98), respectively. Both models were statistically significant as they had a better fitting (Q2 and R2 values closer to 1) and met the threshold value. For both GC–MS and UHPLC-TOF-MS plots, it is clear that Component 1 clearly discriminates the NS- and the NP-chicken meats.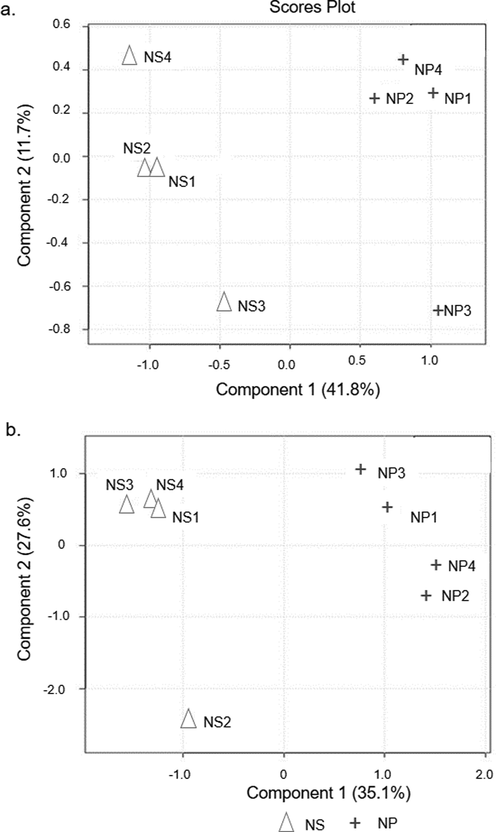
Scores plot between the selected principle components obtained from applying (a) GC–MS (b) UHPLC-TOF-MS data set on PLS-DA analysis from four biological replicates of broiler chicken subjected to NS and NP procedures.
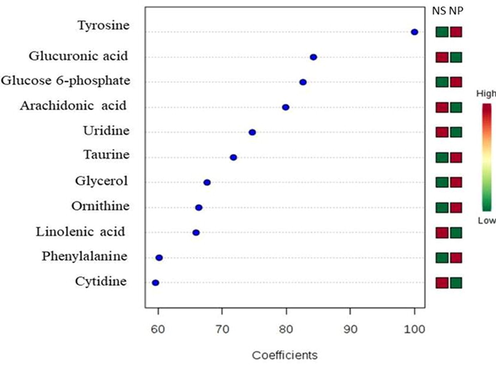
Following the above analysis, PLS-DA coefficients with a score range between 60 and 100 for the NS- and the NP-chicken meats were further investigated; the outcomes of the statistical analysis are showed in Fig. 4 (GC–MS) and Fig. 5 (UHPLC-TOF-MS). Coefficient score is a weighted sum of absolute measurements between the mean values of a variable in NS-chicken meat and the corresponding mean value of the variable in NP-chicken meat (Xia et al., 2015). A total of eighteen metabolites were found in both chicken meats (seven and eleven metabolities by GC–MS and UHPLC-TOF-MS, respectively). Relative to the NS-, the NP-chicken meat appeared to enrich with the following metabolites: tryptophan, glycine, cholanoic acid, tyrosine, glucose 6-phosphate, taurine, glycerol, ornithine and phenylalanine.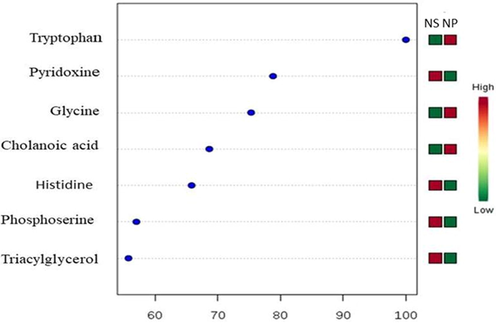
Important features with coefficient scores between 60 and 100 obtained from applying GC–MS data set on PLS-DA analysis. The coloured boxes on the right indicate the relative intensity of the corresponding metabolites between NS-chicken meat (box at the left) and NP-chicken meat (box at the right).
Important features with coefficient scores between 60 and 100 obtained from applying UHPLC-TOF-MS data set on PLS-DA analysis. The coloured boxes on the right indicate the relative intensity of the corresponding metabolites between NS-chicken meat (box at the left) and NP-chicken meat (box at the right).
4 Discussion
4.1 Amino acids and heme iron contents in chicken meats
The overall findings of this study have shown that the slaughtering method affect the physicochemical properties and metabolite fingerprint of the processed chicken meat. The NP-chicken meat contained much higher concentrations of free amino acids (phenylalanine, tryptophan, tyrosine and ornithine) and heme iron content than found in the NS-chicken meat. Its pH was also found to be slightly acidic than the NS-chicken meat, as evidenced by the ultimate pH measurement of the supernatants. We speculate that higher iron content coupled with acidic pH would be able to create a favorable condition for the growth of lactic acid bacteria, consequently generating biogenic amines from the amino acids in the meat. Biogenic amines are thermostable, meaning that if present in food, they are difficult to be destroyed either by cooking or pasteurization. Consuming low levels of biogenic amines can be tolerated, but excessive intake of them may led to toxicological effects on human health, such as nausea, migraine, gastric and intestinal problems (Suzzi & Torriani, 2015; Victor et al., 2010). Biogenic amines are derived from decarboxylation of free amino acids contained in the food. The reaction is facilitated by a decarboxylase enzyme, likely to be produced by dominant lactic acid bacteria, under certain conditions (Liu et al., 2010; Doeun et al., 2017; Barbieri et al., 2019). We also anticipate that the production of biogenic amines in the NS-chicken meat may not be as higher as that in the NP-chicken. This is due lower concentrations of free amino acids in the meat, as detected by GC–MS and UHPLC-TOF-MS with PLS-DA.
4.2 PUFA and nucleotides in chicken meats
Based on the metabolomics analysis, both the NS- and the NP-chicken meat contained n-3 polyunstaurated fatty acids (PUFA) such as arachidonic acid (AA, 20:4n-6), linolenic acid (LA, 18:2n-6), and triglyceride (TG). However, the concentrations of these compound were much higher in the NS- meat than the NP-chicken meat. The consumption of meat with a higher concentration of PUFA is beneficial as the diet can reduce inflammation and cardiovascular disease (Dorota et al., 2013; Seah et al., 2017). It has been reported that the concentrations of AA, LA and TG in broiler chickens varies depending on the animal diets (Shin et al., 2011). However, chickens used in this study were taken from the same farm, thus, the diet should be similar.
It is worthwhile to highlight that, relative to the NP-, the NS-chicken meat contained much higher concentrations of cytidine and uridine metabolites. In human diet, consuming these metabolites can enhance brain function, including learning and memory (Holguin et al., 2008; Wurtman, 2014). Lower concentrations of cytidine and uridine metabolites in the NP-chicken meat might be due to the enhanced nucleotide degradation in the tissue.
5 Conclusion
As overall, the presented outcomes of the study appear to suggest that the NS slaughtering procedure can enhance the meet quality with enriched metabolite contents, which are beneficial for human consumption. This was successfully accomplished through integrating physicochemical analysis and metabolomics methods. Such an integration was able to provide a greater insight into the occurrences that might have happened to broiler chickens when subjected to the NS and the NP procedures.
Acknowledgements
Author contribution to this paper: Nazariyah Yahaya: Writing-Reviewing and Editing and Supervision, Mohd Nazmi Abdul Manap: Project administration. Shikh Mohd Shahrul Nizan Shikh Zahari: Writing-Reviewing. Nurfatin Syahirah Mohamed Ali: Investigation and Writing-Original draft preparation. Atiqah Ruqayyah Zabidi: Investigation. Dzulfadli Rosli; Synthesize study data. Special thanks to Late Dr Mohd Adib Yahya for his contribution in proposal writing. This research is supported by Malaysian Ministry of Higher Education, FRGS/1/2017/WAB01/USIM/02/1.
Declaration of Competing Interest
The authors declare that they have no known competing financial interests or personal relationships that could have appeared to influence the work reported in this paper.
References
- Untargeted-metabolomics differentiation between poultry samples slaughtered with and without detaching spinal cord. Arab. J. Chem.. 2020;13:9081-9089.
- [CrossRef] [Google Scholar]
- Effect of Islamic slaughtering on chemical compositions and post-mortem quality changes of broiler chicken meat. Int. Food Res. J.. 2014;21:897-907.
- [Google Scholar]
- Physico-chemical changes and microbiological quality of refrigerated broiler chicken meat slaughtered by two different methods. Food Res.. 2018;25:913-920.
- [Google Scholar]
- Effect of different slaughtering methods on metabolites of broiler chickens using Ultra High-Performance Liquid Chromatography-Time of Flight-Mass Spectrometry (UHPLC-TOF-MS) Food Res.. 2020;4:133-138.
- [Google Scholar]
- Biogenic amine production by lactic acid bacteria: a review. Foods (Basel, Switzerland). 2019;8:17.
- [Google Scholar]
- Biochemical and physicochemical changes in catfish (Silurus granis Linne) muscle as influenced by different freeze-thaw cycles. Food Chem.. 2011;72:207-217.
- [Google Scholar]
- A simple UV-Vis spectrophotometric method for determination of β-carotene content in raw carrot, sweet potato and supplemented chicken meat nuggets. LWT – Food Sci. Technol.. 2011;44:1809-1813.
- [Google Scholar]
- Viewpoint: Regulating meat consumption to improve health, the environment and animal welfare. Food Policy. 2020;32:101847.
- [Google Scholar]
- Effect of micro climate temperature during transportation of broiler chickens on quality of the pectoralis major muscle. Poult. Sci.. 2010;89:1033-1041.
- [Google Scholar]
- Poultry production and its effects on food security in the mena region. J. Appl. Poult. Res. 2020 Journal Pre-proof (in press)
- [Google Scholar]
- Metabolism of Arachidonic acid, its concentration in animal products and influence on inflammatory processes in the human body: a review. Ann. Anim. Sci.. 2013;13:177-194.
- [Google Scholar]
- Effect of neck cut position on time to collapse in halal slaughtered cattle without stunning. Meat Sci.. 2015;110:310-314.
- [Google Scholar]
- Inventory of quality problems currently facing chicken fillets in french slaughterhouses. J. Muscle Sci. Technol. Special Issue. 2010;13:216.
- [Google Scholar]
- Metabolomic fingerprinting in the comprehensive study of liver changes associated with onion supplementation in Hypercholesterolemic Wistar rats. Int. J. Mol. Sci.. 2017;18:1-16.
- [Google Scholar]
- Meat consumption: which are the current global risks? A review of recent (2010–2020) evidences. Food Res. Int.. 2020;137:109341.
- [Google Scholar]
- Effect of slaughtering methods on meat quality indicators, chemical changes and microbiological quality of broiler chicken meat during refrigerated storage. J. Agric. Vet. Sci.. 2015;8:12-17.
- [Google Scholar]
- Dietary uridine enhances the improvement in learning and memory produced by administering DHA to gerbils. FASEB J.. 2008;22:3938-3946.
- [Google Scholar]
- Fresh meat water-holding capacity. improving the sensory and nutritional quality of fresh meat. Woodhead Publ. Series Food Sci. Technol. Nutr.. 2009;6:147-160.
- [Google Scholar]
- The proteolytic system of lactic acid bacteria revisited: a genomic comparison. BMC Genomics. 2010;11:36.
- [Google Scholar]
- Effect of NaCl, Myoglobin, Fe(II), and Fe(III) on lipid oxidation of raw and cooked chicken breast and beef loin. J. Agric. Food Chem.. 2010;58:600-605.
- [Google Scholar]
- Endogenous factors affecting oxidative stability of beef loin, pork loin, and chicken breast and thigh meats. J. Food Sci.. 2008;73:439-446.
- [Google Scholar]
- Heme iron content in lamb meat is differentially altered upon boiling, grilling, or frying as assessed by four distinct analytical methods. Sci. World J. 2013:1-5.
- [Google Scholar]
- Variation in the form of iron in beef and lamb meat and losses of iron during cooking and storage. Int. J. Food Sci. and Technol.. 2003;38:827-837.
- [Google Scholar]
- Bleeding efficiency, microbiological quality and oxidative stability of meat from goats subjected to slaughter without stunning in comparison with different methods of pre-slaughter electrical stunning. PLoS ONE. 2016;11
- [Google Scholar]
- Consumption of red meat, but not cooking oils high in polyunsaturated fat, is associated with higher arachidonic acid status in singapore chinese adults. Nutrients. 2017;9:101.
- [Google Scholar]
- Effects of dietary combination of n-3 and n-9 fatty acids on the deposition of linoleic and arachidonic acid in broiler chicken meats. Poult. Sci.. 2011;91:1009-1017.
- [Google Scholar]
- Application of accelerated solvent extraction in the analysis of organic contaminants, bioactive and nutritional compounds in food and feed. J. Chromatogr. A. 2012;1237:1-23.
- [Google Scholar]
- How pH causes paleness or darkness in chicken breast meat. Meat Sci.. 2008;80:396-400.
- [Google Scholar]
- Retardation of myoglobin and haemoglobin-mediated lipid oxidation in washed bighead carp by phenolic compounds. Food Chem.. 2012;134:789-796.
- [Google Scholar]
- Meat, the metabolites: an integrated metabolite profiling and lipidomics approach for the detection of the adulteration of beef with pork. Analyst. 2016;141:2155-2164.
- [Google Scholar]
- Toxicological effects of dietary biogenic amines. Curr. Nutr. Food Sci.. 2010;6:145-156.
- [Google Scholar]
- Biochemical properties of natural actomyosin extracted from normal and pale, soft, and exudative pork loin after frozen storage. J. Food Sci.. 2005;70:313-320.
- [Google Scholar]
- Factors affecting poultry meat colour and consumer preferences – a review. World's Poult. Sci. J.. 2016;1:1-14.
- [Google Scholar]
- Small-scale poultry and food security in resource-poor settings: a review. Glob. Food Sec.. 2017;15:43-52.
- [Google Scholar]
- A nutrient combination that can affect synapse formation. Nutrients. 2014;6:1701-1710.
- [Google Scholar]
- MetaboAnalyst 3.0-making metabolomics more meaningful. Nucleic Acids Res.. 2015;43:W251-W257.
- [Google Scholar]
- Changes of metabolites status in plant pathogen interaction. Adv. Sci. Lett.. 2017;23:4623-4626.
- [Google Scholar]
- Comparisons of sensory descriptive flavor and texture profiles of cooked broiler breast fillets categorized by raw meat color lightness values. Poult. Sci.. 2010;89:1049-1055.
- [Google Scholar]
- Effects of broiler carcass scalding and chilling methods on quality of early-deboned breast fillets1. Poult. Sci.. 2013;92:1393-1399.
- [Google Scholar]


