

Translate this page into:
Influence of the external electric field distribution on α-Ni(OH)2 electrochemical-synthesis from a NiCl2 solution
⁎Corresponding author. zta2000@163.net (Ting'an Zhang)
-
Received: ,
Accepted: ,
This article was originally published by Elsevier and was migrated to Scientific Scholar after the change of Publisher.
Abstract
Electrolytic systems of a symmetric, an asymmetric and a two-compartment were established in the present work to investigate the effect of the external electric field distribution on α-Ni(OH)2 electrochemical-synthesis from a NiCl2 solution. Results demonstrate the sample particle size increased in the order of symmetric, two-compartment and asymmetric systems, with a sharpened diffraction peak of the (1 0 1), (0 1 5) and (1 1 0) plane, and a broadened diffraction peak of (0 0 3) plane. However, the reversibility of the redox reactions and the energy transferred in the redox reactions in the electrodes assembled by the samples from the three electrolytic systems increased based on the contrary order. In terms of the electrolysis process, the energy consumption per unit mass increased in the order of symmetric, two-compartment and asymmetric systems. The catholyte pH for both symmetric and asymmetric systems were more stable than that for the two-compartment system. The external electric filed distribution affected the transportation of Ni2+ from the anolyte to the catholyte. At the end of electrolysis, the Ni2+ concentration in the anolyte of two-compartment system was obviously higher than that of symmetric and asymmetric systems.
Keywords
α-Ni(OH)2
Electrochemical-synthesis
External electric field distribution
NiCl2 solution

1 Introduction
Ni(OH)2, featuring excellent electrochemical properties (Shangguan et al., 2015), is widely used in Ni-based batteries (Uesato et al., 2019; Cheng et al., 2005), supercapacitors (Wang et al., 2014), catalyst for hydrogen evolution reaction (Liu et al., 2019), sensors of ethanol and drugs (Nai et al., 2013; Fan et al., 2014). Ni(OH)2 crystallizes in α-Ni(OH)2 and β-Ni(OH)2 polymorphs (Li et al., 2012a; 2012b). During oxidation of α-Ni(OH)2, more electrons are transferred, increasing the capacity of devices assembled using α-Ni(OH)2 (Li et al., 2010; Vishnu Kamath et al., 1994). Thus, many studies have focused on α-Ni(OH)2. However, α-Ni(OH)2 is unstable in strongly alkaline solutions and can easily change into β-Ni(OH)2, which not only restricts its applications but also renders its preparation difficult (Yao et al., 2013; Li et al., 2018; Jayashree and Kamath, 2011).
Methods such as chemical precipitation, hydrothermal synthesis, and electrochemical synthesis have been developed to prepare α-Ni(OH)2 (Ramesh and Vishnu Kamath, 2006; Dong et al., 2008; Ash et al., 2015). Electrochemical synthesis is the most suitable method due to its low cost, short process time, and excellent product properties (Ash et al., 2015; Subbaiah et al., 2002; Murthy et al., 1996). Ni(NO3)2 is the most reported raw material for preparation using this method (Ash et al., 2015; Watanabe et al., 1995). However, the high yield of OH− per mole electrons (10:8) produced during electrolysis contributes to a strongly alkaline atmosphere around the cathode, which induces a tough condition for the electrochemical synthesis of α-Ni(OH)2 from this system (Zhang et al., 2021; Jayashree and Vishnu Kamath, 1999). In addition, NO3− intercalated into the α-Ni(OH)2 interlayer can increase the self-discharge effect of devices, which is wanted to be avoided (Sasaki and Yamashita, 1998).
Considering the problems persistent in Ni(NO3)2 electrolysis, a NiCl2 system was proposed. Currently, limited studies are devoted to the electrochemical synthesis of α-Ni(OH)2 from a NiCl2 solution. Yao conducted the first investigation on this system in a typical three-compartment system (Yao et al., 2019). Subsequently, a membrane electrolysis system based on cation-exchange membrane (CEM) was designed in our previous study to further investigate this system (Zhang et al., 2021; Zhang et al., 2020).
In our previous study, an electrolytic cell divided into two anodic chambers by using two pieces of CEMs is used (Zhang et al., 2021; Zhang et al., 2020). During membrane electrolysis, when the electrolytic cell is divided into two chambers with a CEM piece or into three chambers with two CEM pieces, different external electric field systems are established. Electrolysis is a process in which charged ions move in a directional manner under the action of electric field force. Thus, the external electric field system selected may influence ion transportation, electrolyte properties, and ion consumption in each chamber. The properties of Ni(OH)2 are related to its preparation process (Vishnu Kamath et al., 1994; Subbaiah et al., 2002). Thus, the resultant products may exhibit external electric-field-related properties. However, few studies are devoted to these aspects.
In the present work, a symmetric system constituting two anodic chambers assembled using two anodes with identical sizes, an asymmetric electrolytic system constituting two anodic chambers assembled using two anodes with different sizes, and a two-compartment electrolytic system constituting one anodic and cathodic chambers were developed. With the aforementioned three electrolytic systems, the effects of the external electric field distribution around the electrode on membrane electrolysis and product properties were investigated.
2 Experimental section
2.1 Materials and equipment
The reactants, analytical grade NiCl2·6H2O and un-hydrous ethanol, were pursed and used directly.
The devices for investigating the influence of electric field distribution are shown in Fig. 1a1–c1.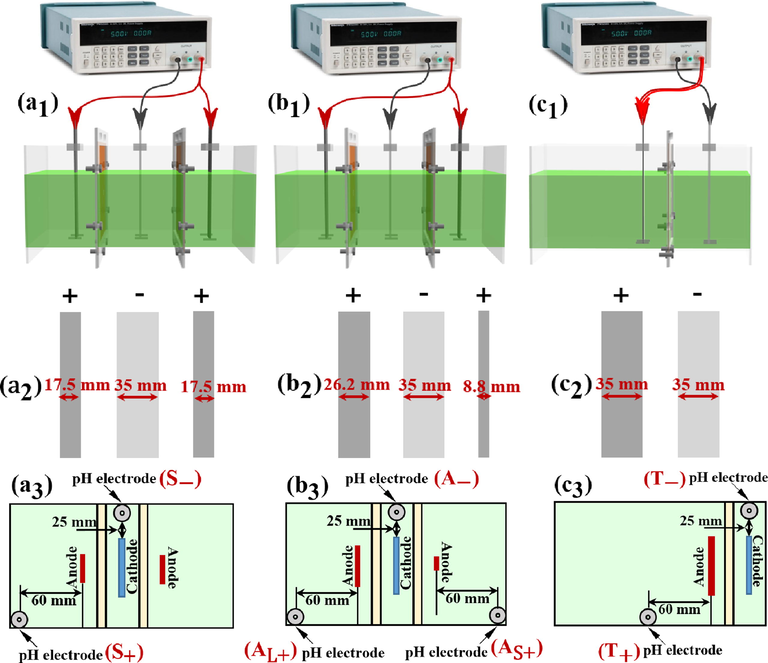
Set-up for the symmetric system (a1), asymmetric system (b1) and two-compartment system (c1); the electrodes sizes for the symmetric system (a2), asymmetric system (b2) and two-compartment system (c2); the relative position of the electrode plates and the pH electrode during the electrolysis process in the symmetric system (a3), asymmetric system (b3) and two-compartment system (c3).
All the electrolytic cells were of the same sizes (190 × 90 × 80 mm, LWH). Their cathodic chamber and cathode sheet shared the same sizes of 30 × 90 × 80 mm (LWH) and 1 × 35 × 90 mm (LWH), respectively. All the anodes had an identical height of 90 mm and length of 1 mm. The material for anode was ruthenium & iridium coated titanium and that for cathode was 304 stainless-steel (Zhang et al., 2021). All the anode sheets were cut from a large ruthenium & iridium coated titanium plate. The cutting surface was sealed with paint, and its influence on the electrolysis process was not considered in the present work. All the cathode sheets were cut from a large 304 stainless-steel plate. The electrolysis was driven by a DC power supply with an accuracy of 0.1 mA (L3055PL, eTM, China). The connection between the DC power supply and the electrodes were done by the crocodile clips.
2.2 Methods
To establish various electric fields on both the sides of the cathode, the numbers and widths of the anode were varied (Fig. 1a2–c2). In the three-compartment electrolytic cell, the combined width of the two anodes was the same as that of the cathode. In the two-compartment electrolytic cell, the size of the anode and cathode was the same. All anode and cathode chambers were separated using a cation-exchange membrane (CEM, HETECH-18231123, HUAMO TECH, China). A constant distance of 30 mm was maintained between the anode and cathode.
For the membrane electrolysis system shown in Fig. 1a1, the cell was divided into two anodic chambers and one cathodic chamber. Two anodes with the same size were symmetrically distributed on both the sides of the cathode (Fig. 1a2 and a3). This system was marked as the symmetric system. For the system presented in Fig. 1b1, the electrolytic cell constituted two anode chambers and one cathode chamber. The two assembled anodes had a width ratio of 3:1 (Fig. 1b2 and b3). This system was marked as the asymmetric system. Based on the anode width in the asymmetric system, the two anode chambers were marked as large anodic chamber and small anodic chamber. For the system illustrated in Fig. 1c1, only one anode chamber was used; and the width of this anode chamber was twice as that of aforementioned two anode chambers. This system was labelled as the two-compartment system. The two electrodes in the two-compartment system had the identical size (Fig. 1c2 and c3). For convenience, the symmetric system, two-compartment system and the asymmetric system are abbreviated as S, T and A, respectively.
In a typical electrolysis process, the concentration of the electrolyte was 0.2 M (Ni2+ concentrating about 11.8 g/L). The solvent for the anolyte was pure water and that for the catholyte was water–ethanol mixture at a volume ratio of 1:1. The total volume for both anolyte and catholyte used every case separately was 600 and 130 mL, which could lead to a liquid level of 40 mm after assembling electrodes. Notably, the volumes (600 and 130 mL) are larger than that calculated according to the actual size of the electrolytic cell. This is mainly because the cathodic chamber and the anodic chamber are separated by the cation-exchange membrane, whose thickness (∼0.3 mm) is much smaller than that of the organic glass plate (5 mm) used to make the electrolytic cell. As shown in Fig. 2, the electrode was fixed in the electrolytic cell and the inserted height for each electrode was 2 mm, which can not contact with the electrolyte during electrolysis. The current intensity used was kept at 420 mA, corresponding to a current density related to the cathode of ∼ 15 mA/cm2.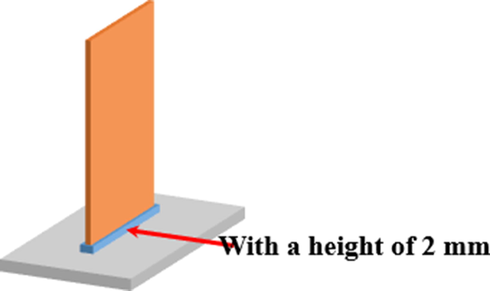
Schematic image of the fixing mode between the electrode and the electrolytic cell.
2.3 Membrane electrolysis system related characterization
The cell voltage variation for each membrane electrolysis system was recorded every 2 min by the DC power supply. To eliminate the influence of voltage division on the wire, the two wires for connecting anodes in a three-chamber electrolytic cell were all connected to the anode of the two-compartment electrolytic cell, as shown in Fig. 1c1. The pH values for both the anolyte and catholyte during electrolysis was observed on a PHS-25-2F acidimeter (China). Notably, the pH electrode immersed in the electrolyte would affect the cell voltage. However, because the pH electrode was directly immersed in the electrolyte in each case. Thus, the influence caused by the pH electrode was ignored in the cell voltage measurement. The Ni2+ concentration in the electrolyte was measured by a Leeman Prodigy XP inductively coupled plasma atomic emission spectroscopy (ICP, USA). The Ni2+ concentration was measured by sampling (the sampling volume was 2 mL) and the pH value was measured directly in the electrolyte. The Ni2+ concentration was sampled at the same location as the pH value. The measurement positions for each system were labeled as Fig. 1a3–c3. All the observations were done three times. The measurement related to the anodic chamber of the symmetric system and the two-compartment system are abbreviated as S+ and T+, respectively. The measurement related to the electrode chamber corresponding to the large-sized anode and the small-sized anode of the asymmetric system are abbreviated as AL+ and AS+, respectively. The measurement related to the cathodic chamber of the symmetric system, two-compartment system and asymmetric system are abbreviated as S-, T- and A-, respectively.
2.4 Samples related characterization
Samples were collected from the cathode chamber and then were washed with deionised water, filtered, dried in an oven at 60 ℃ for 6 h, and weighed. The sample phase was analysed through X-ray diffraction (XRD, Bruker D8 X-ray diffractometer, USA), Fourier-transform infrared spectroscopy (FT-IR, Nicolet iS50 infrared spectrometer, USA) and Raman spectra (HR800, USA). The particle size distribution analysis of the samples was performed on a Mastersizer 3000 laser particle size analyser (UK). The product morphology was observed using scanning electron microscopy (SEM, SU8010, Japan).
The cyclic voltammetry (CV) tests were conducted in the samples in 6 M KOH using an electrochemical workstation (Zennium-pro, Zahner PP211, Germany). A disc (D = 13 mm) constituting 2 mg of the sample and 48 mg of a nickel powder was prepared at 6 MPa. Subsequently, this disc was sandwiched between two bare nickel foam sheets (13 × 13 mm) at 1 MPa to form a working electrode. The counter and reference electrodes were a bare nickel foam sheet (13 × 13 mm) and Hg/HgO electrode, respectively. Before CV tests at the scan rates of 20, 10, and 2 mV/s from 0 to 600 mV, the working electrode underwent eight circle sweeps from 0 to 600 mV at 4 mV/s for complete activation.
3 Results and discussion
3.1 Analysis for the electrolytic systems
As shown in Fig. 3 a–c, the area near the cathode distributed external electric field and electric field formed by the positively charged electric double layer and negatively charged cathode sheet.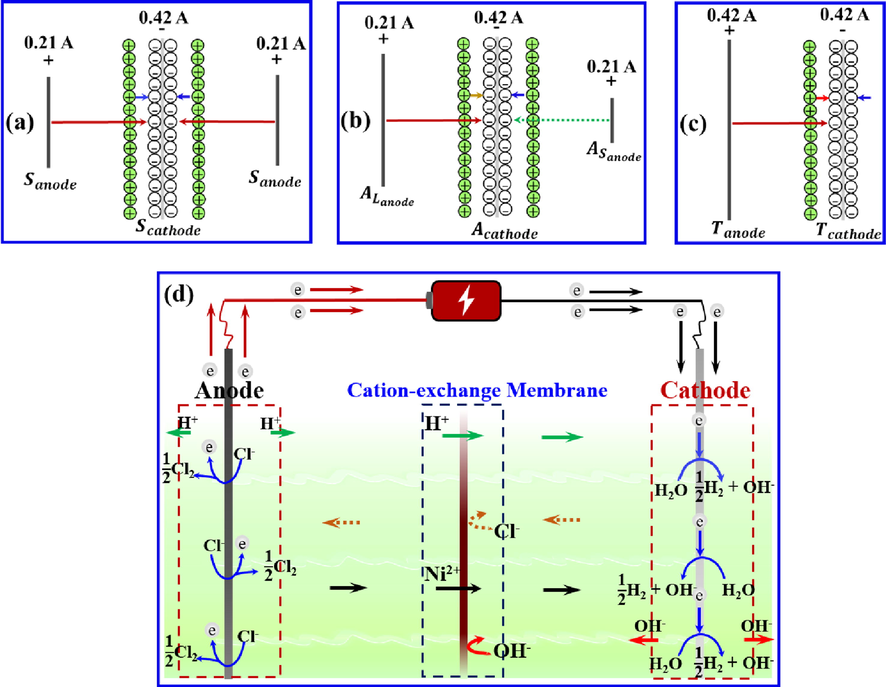
(a–c) Electric field distribution on both the sides of the cathode in the symmetric, asymmetric, and two-compartment systems, respectively; and (d) movement of the ions between the anode and cathode during membrane electrolysis.
In the symmetric system (S, Fig. 3a), the sizes of the two anodes and their locations in relation to the cathode were identical; a current of the equal magnitude flowed through them. Therefore, two symmetrically distributed external electric fields of the equal magnitude were formed on either side of the cathode in this system. In the asymmetric system (A, Fig. 3b), the sizes of the two anodes set on either side of the cathode presented were different. During electrolysis, the same intensity currents passed through the two anodes. The external electric fields between the two anodes and cathode exhibited the same intensity. The distribution of the electric field lines between the two anodes and cathode was not symmetrical in space with respect to the cathode. In the two-compartment system (T, Fig. 3c), the external electric field was distributed only on one side of the cathode sheet.
Fig. 3d illustrates the ion transportation process between the anode and cathode during electrolysis.
At the inert anode surface, Cl− was oxidised as shown in Eq. (1) to form Cl2, which further reacted with H2O as presented in Eq. (2) to form HCl and HClO. H+ formed from the ionisation of HCl and HClO (Eqs. (3) and (4)), making the anolyte acidic. At the cathode surface, H2O reduced to H2 and OH− (Eq. (5)). Subsequently, OH− precipitated with Ni2+ (Eq. (6)). In the electrolyte, Ni2+ and H+ in the anolyte moved towards the catholyte (Fig. 3d). Cl− and OH− available in the catholyte were transported towards the anolyte, whose trans-membrane movement was prevented by CEM.
3.2 Samples related characterizations
3.2.1 XRD analysis
Fig. 4a shows the XRD patterns of the samples collected from the three systems after 3-h electrolysis. The diffraction peaks at about 11.5°, 23°, 33.5°, 38.5°, 60° can be indexed as the (0 0 3), (0 0 6), (1 0 1), (0 1 5) and (1 1 0) planes of a hydrous nickel hydroxide (Ni(OH)2·0.75H2O, α-Ni(OH)2).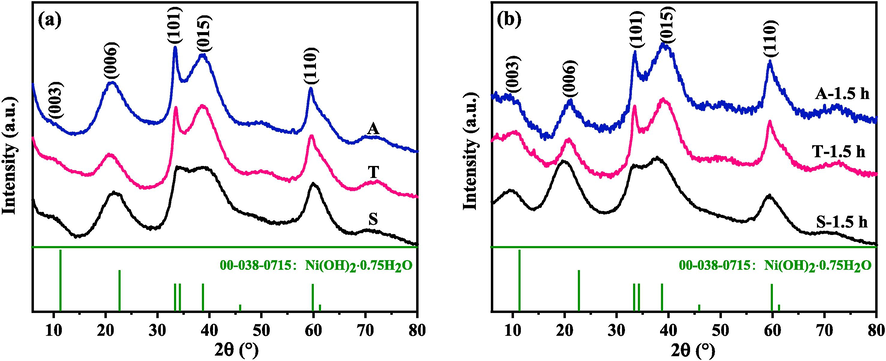
XRD patterns for the samples collected from the three systems after various hours of electrolysis: (a) 3 h, (b) 1.5 h.
Based on the order of the symmetric, two-compartment, and asymmetric systems, the diffraction peaks corresponding to the (1 0 1), (0 1 5), and (1 1 0) planes sharpened (Fig. 4a), whereas those corresponding to the (0 0 3) plane broadened. To validate the results, additional 1.5-h electrolysis was performed for the three systems. Fig. 4b presents the XRD patterns for the resultant samples. The sharpening of the (1 0 1), (0 1 5) and (1 1 0) planes and broadening of the (0 0 3) plane were detected among the samples based on the order of the symmetric, two-compartment, and asymmetric systems. These two observations indicated that the samples synthesised in the two-compartment and asymmetric systems exhibited a certain degree of preferred orientation compared with those formed in the symmetric system. This finding may be attributed to the presence of different forces in all the directions of crystal growth in different external electric field systems. In the symmetric system, forces in all the directions may tend to be uniform during crystal growth. By contrast, in the two-compartment and asymmetric systems, the forces may be dominant in certain directions.
3.2.2 FT-IR and Raman analysis
The diffraction peaks in Fig. 4a are inconspicuous due to the hydrotalcite-like structure of α-Ni(OH)2 (Li et al., 2012a; 2012b; Vishnu Kamath et al., 1994). α-Ni(OH)2 is a hydroxyl-deficit form and exhibits a layered structure formed by stacking Ni(OH)2 layers (Li et al., 2011; Andrate et al., 2018). H2O molecules and charge compensating anions such as CO32−, Cl−, SO42−, and NO32− were observed in the interlayer (Hu et al., 2011; Zheng et al., 2017; Khan et al., 2002). The various numbers, sizes, and orientations of different interlayer species led to a disordered internal structure in α-Ni(OH)2, which resulted in low symmetry and inconspicuous diffraction peaks in its XRD pattern (Fig. 4a) (Jayashree and Vishnu Kamath, 1999; Khan et al., 2002).
To offer a complementary to the phase determination by XRD pattern, FT-IR and Raman analysis for samples were down in Fig. 5.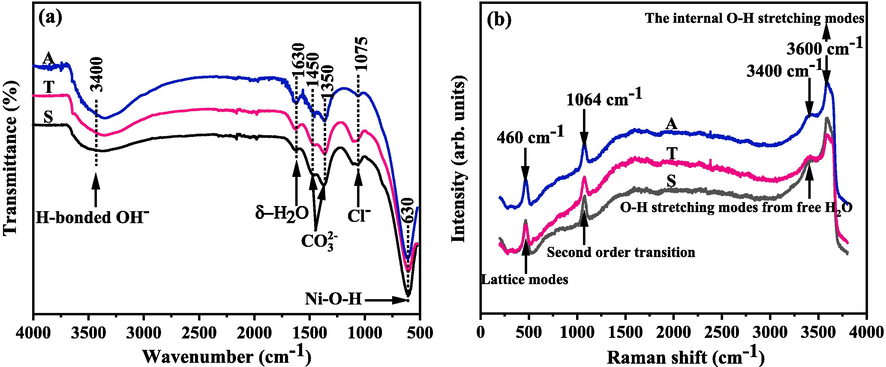
FT-IR (a) and Raman (b) spectrums of the samples.
For further characterisation, the FT-IR results for the samples are presented in Fig. 5a. The number and location of the peaks in the FT-IR spectra of the samples were identical, indicating the existence of the same groups in the three samples. The broad peak and weak absorption peak appearing at approximately 3400 and 1630 cm−1 corresponded to the stretching vibration of the hydrogen-bonded hydroxyl of H2O molecules in the interlayer and the bending vibration of interlayer H2O molecules, respectively (Patnaik et al., 2013; Li et al., 2012a; 2012b). The two bands observed at approximately 1450 and 1350 cm−1 represented the symmetric and asymmetric stretching vibrations of CO32− inserted in the interlayer (Li et al., 2018; Jayashree and Kamath, 2011). The intercalation of CO32– is resulted from CO2 dissolved in the solution for preparing α-Ni(OH)2 (Li et al., 2010; Pan et al., 2003). The weak peak near 1075 cm−1 was assigned to the vibration of intercalated Cl− from the raw material (Zhang et al., 2021; Zhang et al., 2020). The sharp absorption obtained at 630 cm−1 corresponded to the vibration of in plane Ni–O–H (Shangguan et al., 2015; Jayashree and Kamath, 2011). The samples prepared from different external electric field systems exhibited identical phase features with α-Ni(OH)2.
As shown in Fig. 5b, four main peaks can be observed on the Raman spectrums of the three samples. The vibrational mode at about 460 cm−1 is ascribed to the lattice mode (Hall et al., 2012). The mode at about 1064 cm−1 is related to a 2nd order lattice mode, which is useful for identifying the disordered structure in a sample (Hall et al., 2015). The broad vibrational mode at about 3400 cm−1 corresponds to the O-H stretching mode from free H2O (Wu et al., 2018). The high mode at about 3600 cm−1 results from the vibration of the O-H in lattice of the sample and the inter-sheet H2O molecules (Hall et al., 2012; Hall et al., 2015). From the Raman analysis, the sample can be found have a disorder structure.
3.2.3 Particle size analysis
The particle size was related to sample crystallinity (Shangguan et al., 2015). The crystallinity of the sample (Fig. 4a) synthesized from the symmetric system was approximately 3%, which increased to approximately 6% and 8% in that from the two-compartment and asymmetric systems.
Fig. 6a presents the particle size distribution of the samples measured by the Laser particle size analyzer. The mean particle size (D50) for the samples based on the order of symmetric, two-compartment, and asymmetric systems were 23.09, 29.11 and 32.67 μm. The D90 (The value that 90% of the particles has the size lower than) were 60.77, 88.59 and 92.02 μm. The D97 (The value that 97% of the particles has the size lower than) were 104.2, 124.4 and 131.7 μm. The particle size was increased with the increasing crystallinity of the sample. The number of the small size particles can be found decrease in the order of symmetric system, two-compartment system, and asymmetric system. It is reported that the broader the diffraction peaks are, the smaller the crystal size is (Cabanas-Polo et al., 2011). From the XRD patterns for the three samples in Fig. 3, (1 0 1), (0 1 5) and (1 1 0) planes are obviously sharpened based on the order of symmetric system, two-compartment system, and asymmetric system. Thus, there were more and more large size particles among the samples based on the order of symmetric system, two-compartment system, and asymmetric system.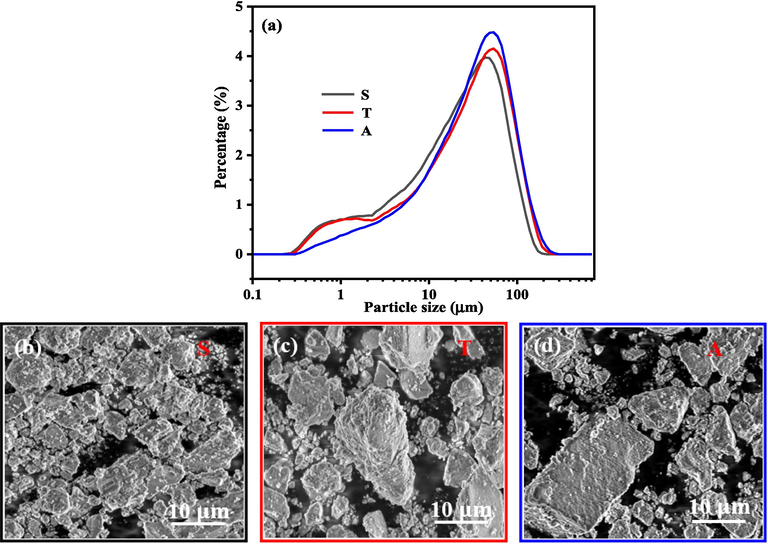
The particle size distribution of the samples (a) and the SEM images for the samples collected from the symmetric system (b), two-compartment system (c) and asymmetric system (d).
Irrespective of crystallinity and particle size distribution, the morphology of the samples collected from different external electric filed systems exhibited no differences. The samples constituted irregular-shaped small and large particles (Fig. 6b–d).
3.2.4 Electrochemical performance analysis
Fig. 7 shows the CV curves for the electrodes fabricated using the samples collected from the three electrolytic systems at the scan rates of 2, 10 and 20 mV/s.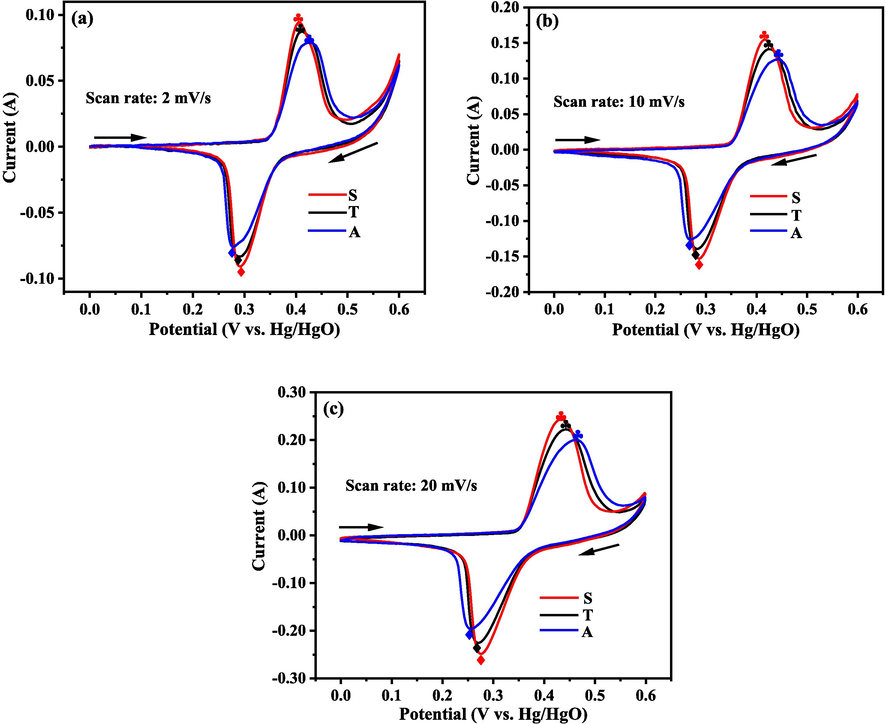
CV curves for the electrodes made by the samples collected from the three electrolytic systems at various scan rates: (a) 2 mV/s, (b) 10 mV/s, and (c) 20 mV/s.
All the curves indicate a couple of redox reactions, which correspond to the oxidation of α-Ni(OH)2 to γ-NiOOH and the reduction of γ-NiOOH to α-Ni(OH)2 (Eq.7).
Irrespective of the scan rate, based on the order of the symmetric, two-compartment and asymmetric systems, the oxidation and reduction peak potentials for the three electrodes moved positively and negatively, respectively (Fig. 7). Thus, the separation between the oxidation and reduction peaks decreased from the asymmetric to two-compartment to symmetric systems, indicating that the reversibility of redox reactions for the corresponding electrodes enhanced (Shangguan et al., 2015; Li et al., 2012a; 2012b). The relative intensity of the oxidation and reduction peaks increased in the asymmetric, two-compartment and symmetric systems (Fig. 7), indicating the energy transfer occurred in the redox reactions for the resultant electrodes became higher (Cheng et al., 2005). The reasons for the improving reversibility of the electrodes and the increasing energy transferred in the redox reactions based on the above order may be related to the particle size and crystallinity of the sample. It is reported that lower crystallinity (Bernard et al., 1996; Sierczynska et al., 2010; Ramesh and Vishnu Kamath, 2009) and smaller particle size lead to better electrochemical performance of the α-Ni(OH)2 (Subbaiah et al., 2002; Bernard et al., 1996). Based on the order of asymmetric system, two-compartment system and symmetric system, the crystallinity of the samples decreased and the small size particles among the samples increased. Thus, the electrochemical performances of the electrodes became better following the order of asymmetric system, two-compartment system and symmetric system, which was coincided with the observations from the CV curves.
3.3 Electrolytic systems characterization
3.3.1 Cell voltage and energy consumption of the electrolytic systems
The cell voltage curves for the three systems are displayed in Fig. 8a. Each curve presents a positive trend with an increase in the electrolytic time due to three reasons. First, the conductivity of the electrolyte decreased due to a decrease in Cl− and Ni2+ concentration with electrolysis. Second, precipitates were attached onto the cathode sheet, which was detrimental to both the conductivity of the cathode sheet and ion transportation near the cathode (Fig. 8b–d). Finally, the precipitates accumulated in the catholyte minimised the solution conductivity.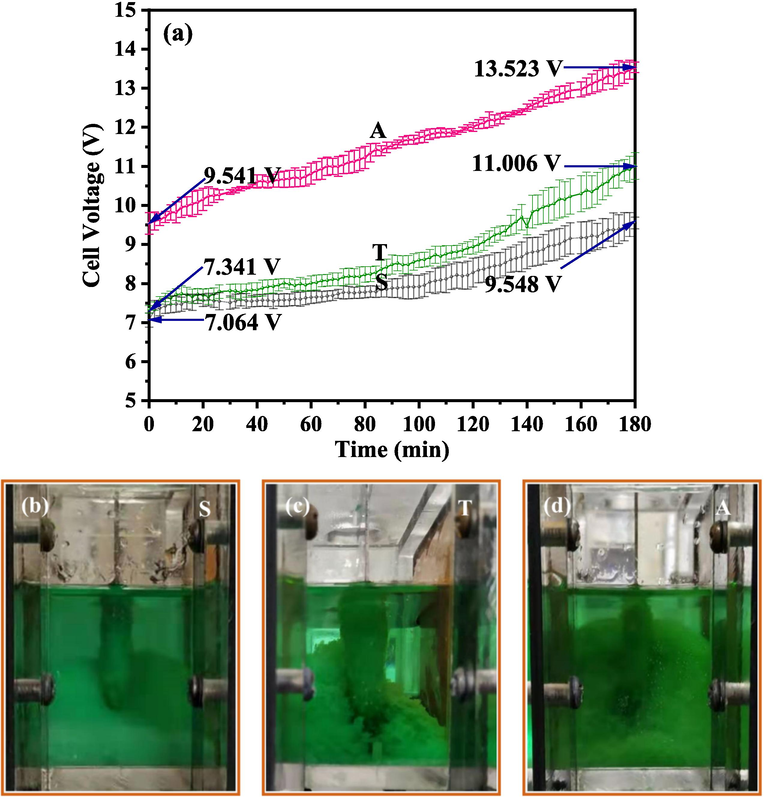
Cell voltage variation for the three membrane electrolysis systems (a), images collected for the cathodic chamber of the three electrolysis systems at the end of the electrolysis: (b) symmetric system, (c) two-compartment system and (d) asymmetric system.
The cell voltage was evaluated according to the order of the symmetric, two-compartment, and asymmetric systems from Fig. 8a. In the three electrolytic systems, the resistance per unit volume of the anode and cathode can be labelled as Ra and Rc, respectively. The volume of the anode and cathode for the two-compartment system can be marked as Va and Vc, respectively. The current passing through the cathode can be marked as I. Subsequently, the voltage divided on the electrodes for the symmetric system (Use), asymmetric system (Uae), and two-compartment system (Ute) are expressed as Eqs. (8)–(10).
The voltage divided on the electrodes followed the order of = .
The voltage divided on CEM for the symmetric system (Usc), asymmetric system (Uac), and two-compartment system (Utc) should follow the relationship: Usc = Uac = 2Utc.
The aforementioned expressions are ideal according to the electrolysis system. These expressions were applied only at the beginning of the electrolysis and did not consider variations in the divided voltage for the electrodes and CEMs due to ion transportation, electrochemical and chemical reactions.
According to these results, the voltage divided on the electrolytic cell for the symmetric and asymmetric systems were identical, whereas at the beginning of electrolysis, the cell voltages for the symmetric and asymmetric systems were 7.064 and 9.541 V, respectively, (Fig. 8a). This separation may be resulted from ion transportation and electrochemical-chemical reactions occurring in the two systems. With the progress of electrolysis, more precipitates accumulated upward around the cathode sheet in the asymmetric system, which led to a further increase in the cell voltage difference between the symmetric and asymmetric systems (Fig. 8b and d). Subsequently, the cell voltage separation for the asymmetric and symmetric systems increased from 2.477 to 3.975 V from the beginning to the ending of electrolysis (calculated from the data shown in Fig. 8a).
In the two-compartment system, although only one CEM piece was in the system, the voltage divided on the electrodes was higher than that in the symmetric system. In addition, the precipitate generated in the two-compartment system was highly likely to attach onto the cathode sheet (Fig. 8b and c). The synergistic effect of the voltage divided on the electrolytic cell, ion transportation, and electrochemical and chemical reactions in the system made the cell voltage of the two-compartment system higher than that of the symmetric system.
A relation exists between the cell voltage and energy consumption. Energy consumption is a measure for the economy of a process. Table 1 presents the data regarding the total mass of the precipitate, the current efficiency, and energy consumption per unit mass for the three electrolytic systems.
Mass, g
Current efficiency, %
Energy consumption, Wh/g
Symmetric system
2.569
103
3.8728
Asymmetric system
2.8379
114
5.1721
Two-compartment system
2.3958
96
4.6824
The current efficiency and energy consumption per unit mass for the electrolysis process were calculated according to Eqs. (11) and (12) (Pan et al., 2020).
The product mass and current efficiency increased in the following order: two-compartment, symmetric, and asymmetric systems (Table 1). In particular, the current efficiency for the symmetric and asymmetric systems was >100%, which agrees with the literature (Streinz et al., 1995a; 1995b). Due to the species inserted in the interlayer, α-Ni(OH)2 is considered nonstoichiometric (Huang et al., 2018). From the FT-IR spectra (Fig. 5a), Cl−, CO32−, and water molecules were intercalated in the interlayer of α-Ni(OH)2·0.75H2O. The actual molecular weight of α-Ni(OH)2·0.75H2O was, therefore, higher than106.2 g/mol. Eq. (11) indicates that a low molecular weight leads to a high current efficiency.
According to Eq. (12), the energy consumption per unit mass was determined using both the product mass and total energy consumption. When the same current intensity and identical electrolytic time were applied, higher cell voltage induced higher total energy consumption. According to Fig. 8a, total energy consumption should follow the order: symmetric system < two-compartment system < asymmetric system. Energy consumption per unit mass for the symmetric, two-compartment, and asymmetric systems were 3.8728, 4.6824, and 5.1721 Wh/g, respectively, which increased in the provided order.
3.3.2 pH variation of the electrolytic systems
Fig. 9 illustrates the pH variation of the anolyte and catholyte for the three electrolytic systems.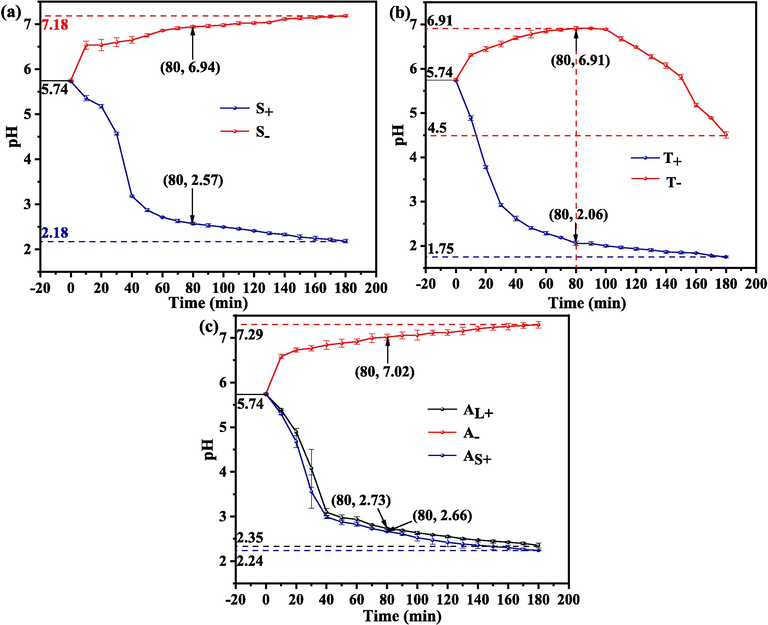
pH variation of both the anolyte and catholyte for different electrolytic systems: (a) symmetric system, (b) two-compartment system and (c) asymmetric system.
In the symmetric and asymmetric systems (Fig. 9a and c), the pH of the anolyte and catholyte decreased and increased, respectively, with electrolysis. At the end of electrolysis, catholyte pH for the asymmetric system was slightly higher than that for the symmetric system. The anolyte pH for the symmetric system was similar to that for the small anode chamber of the asymmetric system, which was slightly lower than that for the large anode chamber.
In the two-compartment system as shown in Fig. 9b, the anolyte pH was decreased from 5.74 to 1.75 at the end of electrolysis, which was slightly lower than that of 2.18–2.35 in both the symmetric and asymmetric systems. The catholyte pH increased from 5.74 to 6.91 after 80 min electrolysis, then it decreased from 6.91 to 4.50, which was more volatile than that of the symmetric and asymmetric systems (Fig. 9a-c). During electrolysis, H+ formed by Eqs. (3) and (4) was able to be transported from the anodic chamber to the cathodic chamber through the CEM (Han et al., 2019; Shi et al., 2020). Thus, the observation of the catholyte pH was a result of the combined action of H+ transferred from the anodic chamber and the OH– transferred from the cathode surface. The catholyte pH began to decrease, indicating that the concentration ratio of H+/OH– in the catholyte became higher. An increase in the concentration of H+ or a decrease in the concentration of OH– was likely the cause.
Table 2 collects the pH of each observation point and the pH separation between the catholyte and anolyte for the electrolytic systems at electrolysis time of 80 min. It can be seen from Table 2 that the anolyte pH (2.06) for the two-compartment system was apparently lower than that of the other two, which demonstrated a higher concentration of H+ can be used to transport from the anolyte of the two-compartment system to its catholyte. While, the pH separation between the catholyte and anolyte (4.85) for two-compartment system was obviously higher than that of the other two, indicating a higher concentration difference of H+ in the catholyte and anolyte of the two-compartment system can be used to drive the H+ in the anolyte moving towards the catholyte. Thus, the decrease of the catholyte pH for the two-compartment system after 80 min electrolysis may be dominated by an increasing concentration of H+ in the catholyte.
S
A
T
S-
S+
A-
AL+
AS+
T-
T+
pH
6.94
2.57
7.02
2.73
2.66
6.91
2.06
ΔpH
4.37
4.29/4.36
4.85
3.3.3 Variation of Ni2+ concentration for the electrolytic systems
Fig. 10 shows the Ni2+ concentration in both the anolyte and catholyte for the three systems during electrolysis.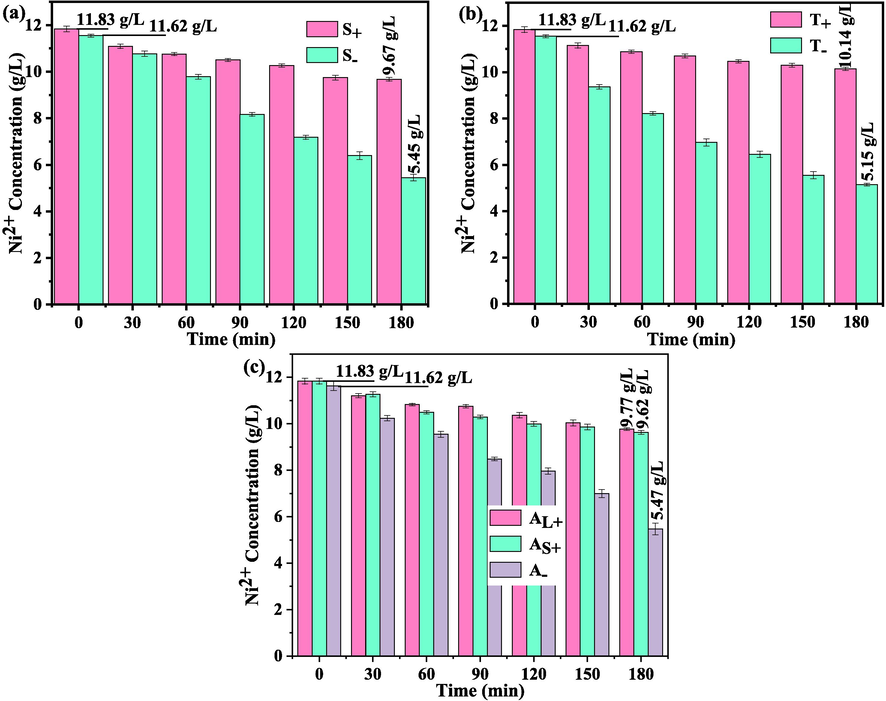
Ni2+ concentration in both the anolyte and catholyte for the three electrolysis systems: (a) symmetric system, (b) two-compartment system and (c) asymmetric system.
The Ni2+ concentration in the catholyte for the three systems was considerably lower than that in the anolyte, indicating that Ni2+ ions in the catholyte were preferably consumed during electrolysis. The transportation of Ni2+ from the anode to cathode chamber balanced its concentration difference between the two chambers and led to charge conduction.
Table 3 presents the Ni2+ concentration of each observation point at the end of electrolysis and concentration separation between the initial and final electrolyte for the electrolysis systems. The concentration separation for the catholyte and anolyte in the symmetric and asymmetric systems exhibited a small difference; however, this difference for the two-compartment system varied from them. Ni2+ available in the catholyte and anolyte for the two-compartment system was consumed the most and least, respectively. The consumption of Ni2+ present in the catholyte and anolyte was used to form precipitate and to conduct charges through a directional movement from the anodic to cathodic chamber, respectively. At the same current intensity and electrolysis time, the amount of charges required to be transmitted through the directional movement of the cations in the electrolysis systems should be the same. To transmit the same amount of charges, when Ni2+ transmitted less charges, H+ transmitted more charges. Thus, when a small amount of Ni2+ was transferred from the anolyte to catholyte, more H+ was transferred from the anolyte to catholyte. From pH variations for the two-compartment system, more H+ was considered to be transported from the anolyte to catholyte. Due to the small amount of Ni2+ transported from the anolyte to catholyte of the two-compartment system, Ni2+ consumed in the precipitation reaction could not be replenished in time. Thus, the final Ni2+ concentration in the catholyte for the two-compartment system was lower than that in the symmetric and asymmetric systems.
S
A
T
S-
S+
A-
AL+
AS+
T-
T+
Ce, g/L
5.45
9.67
5.47
9.77
9.62
5.15
10.14
ΔCi-e, g/L
6.17
2.16
6.15
2.06
2.21
6.47
1.69
The analysis for the variation of the Ni2+ concentration and pH in the anolyte and catholyte for the three systems indicated that the external electric field distribution affected ion transportation in the electrolyte and rendered the concentration of H+ (pH) and Ni2+ different in various anodic and cathodic chambers.
4 Conclusions
In summary, the following conclusions can be drawn from the present work.
-
(1)
The sample particle size was increased in the order of symmetric, two-compartment and asymmetric systems, with a sharpened diffraction peak of the (1 0 1), (0 1 5) and (1 1 0) plane, and a broadened diffraction peak of (0 0 3) plane.
-
(2)
The reversibility of the redox reactions and the energy transferred in the redox reactions in the electrodes assembled by the samples from the three electrolytic systems increased based on the order of asymmetric, two-compartment and symmetric system.
-
(3)
The energy consumption per unit mass increased in the order of symmetric, two-compartment and asymmetric systems.
-
(4)
The catholyte pH for both symmetric and asymmetric systems were more stable than that for the two-compartment system.
-
(5)
The external electric filed distribution affected the migration of Ni2+ from the anolyte to the catholyte. At the end of electrolysis, the Ni2+ concentration in the anolyte of two-compartment system was obviously higher than that of symmetric and asymmetric systems.
From this paper, a systematic understanding of the external electric filed distribution on α-Ni(OH)2 electrochemical-synthesis from a NiCl2 solution can be got, which provides guidance for setting the external electric field in the corresponding industrial process.
CRediT authorship contribution statement
Junjie Zhang: Resources, Investigation, Visualization, Formal analysis, Writing – original draft. Ting’an Zhang: Methodology, Conceptualization, Writing – review & editing, Supervision, Funding acquisition. Sen Feng: Software, Visualization, Formal analysis.
Acknowledgement
This study was financially supported by the National Natural Science Foundation of China (No. U1710257).
Declaration of Competing Interest
The authors declare that they have no known competing financial interests or personal relationships that could have appeared to influence the work reported in this paper.
References
- Effect of precipitating agents on the structural, morphological, and colorimetric characteristics of nickel hydroxide particles. Colloid Interf. Sci.. 2018;23:6-13.
- [Google Scholar]
- Electrochemical studies on electrolytic preparation of battery grade nickel hydroxide – effect of (OH–) to Ni2+ ratio. J. Power Sources. 2015;275:55-63.
- [Google Scholar]
- Structural defects and electrochemical reactivity of β-Ni(OH)2. J Power Sources. 1996;63(2):247-254.
- [Google Scholar]
- Effect of reaction conditions on size and morphology of ultrasonically prepared Ni(OH)2 powders. Ultrason. Sonochem.. 2011;18(4):901-906.
- [Google Scholar]
- Y(OH)3-coated Ni(OH)2 tube as the positive-electrode materials of alkaline rechargeable batteries. J. Power Sources. 2005;150:255-260.
- [Google Scholar]
- Controllable synthesis of nickel hydroxide and porous nickel oxide nanostructures with different morphologies. Chem. Eur. J.. 2008;14(16):5064-5072.
- [Google Scholar]
- Hierarchical macro-mesoporous Ni(OH)2 for nonenzymatic electrochemical sensing of glucose. J. Electrochem. Soc.. 2014;161(10):B201-B206.
- [Google Scholar]
- Raman and infrared spectroscopy of α and β phases of thin nickel hydroxide films electrochemically formed on nickel. J. Phys. Chem. A.. 2012;116(25):6771-6784.
- [Google Scholar]
- Nickel hydroxides and related materials: a review of their structures, synthesis and properties. Proc. R. Soc. A.. 2015;471(2174):20140792.
- [CrossRef] [Google Scholar]
- Investigation of alumina preparation from aluminum chloride aqueous solution by electrical transformation. Hydrometallurgy. 2019;185:30-37.
- [Google Scholar]
- Ultrastable α phase nickel hydroxide as energy storage materials for alkaline secondary batteries. Appl. Surf. Sci.. 2018;435:635-640.
- [Google Scholar]
- Structural transformation and its effects on the electrochemical performances of a layered double hydroxide. J. Power Sources. 2011;196(3):1569-1577.
- [Google Scholar]
- Suppression of the α→β-nickel hydroxide transformation in concentrated alkali: role of dissolved cations. J. Appl. Electrochem.. 2011;31:1315-1320.
- [Google Scholar]
- Factors governing the electrochemical synthesis of α-nickel (II) hydroxide. J. Appl. Electrochem.. 1999;29:449-454.
- [Google Scholar]
- Intercalation chemistry of layered double hydroxides: recent developments and applications. J. Mater. Chem.. 2002;12(11):3191-3198.
- [Google Scholar]
- Synthesis and electrochemical performance of mixed phase α/β nickel hydroxide. J. Power Sources. 2012;203:177-183.
- [Google Scholar]
- Effect of interlayer anions on the electrochemical performance of Al-substituted α-type nickel hydroxide electrodes. Int. J. Hydrogen Energy. 2010;35(6):2539-2545.
- [Google Scholar]
- One-pot hydrothermal synthesis of porous α-Ni(OH)2/C composites and its application in Ni/Zn alkaline rechargeable battery. J. Electrochem. Soc.. 2018;165(5):A910-A917.
- [Google Scholar]
- Characterization and supercapacitor application of coin-like β-nickel hydroxide nanoplates. Electrochimica Acta. 2011;58:89-94.
- [Google Scholar]
- Synthesis and electrochemical performance of mixed phase α/β nickel hydroxide. J. Power Sources. 2012;203:177-183.
- [Google Scholar]
- Ni(OH)2/NiSe2 hybrid nanosheet arrays for enhanced alkaline hydrogen evolution reaction. Int. J. Hydrogen Energy. 2019;44(10):4832-4838.
- [Google Scholar]
- A model for galvanostatic deposition of nickel hydroxide. J. Electrochem. Soc.. 1996;143:2319-2327.
- [Google Scholar]
- Structure-dependent electrocatalysis of Ni(OH)2 hourglass-like nanostructures towards L-Histidine. Chem. Eur. J.. 2013;19:501-508.
- [Google Scholar]
- Separation of metal ions and resources utilization of magnesium from saline lake brine by membrane electrolysis. Sep. Purif. Technol.. 2020;251:117316
- [Google Scholar]
- Al-stabilized α-nickel hydroxide prepared by electrochemical impregnation. Mater. Chem. Phys.. 2003;78(3):711-718.
- [Google Scholar]
- Synthesis and characterization of fibrous nickel hydroxide obtained from spent nickel catalyst. Trans. Nonferr. Metal. Soc.. 2013;23(10):2977-2983.
- [Google Scholar]
- Synthesis of nickel hydroxide: effect of precipitation conditions on phase selectively and structure disorder. J. Power Sources. 2006;156:655-661.
- [Google Scholar]
- The effect of ‘crystallinity’ and structural disorder on the electrochemical performance of substituted nickel hydroxide electrodes. J. Solid Electrochem.. 2009;13(5):763-771.
- [Google Scholar]
- A comparative study of structural and electrochemical properties of high-density aluminum substituted α-nickel hydroxide containing different interlayer anions. J. Power Sources. 2015;282:158-168.
- [Google Scholar]
- Effect of electrolytic conditions on the deposition of nickel hydroxide. Thin Solid Films. 1998;334(1-2):117-119.
- [Google Scholar]
- Cleaner alumina production from coal fly ash: membrane electrolysis designed from sulfuric acid leachate. J. Clean. Prod.. 2020;243:118470
- [Google Scholar]
- Effects of addition of different carbon materials on the electrochemical performance of nickel hydroxide electrode. J. Power Sources. 2010;195(22):7511-7516.
- [Google Scholar]
- The effect of temperature and ethanol on the deposition of nickel hydroxide films. J. Electrochem. Soc.. 1995;142(12):4051-4056.
- [Google Scholar]
- The effect of current and nickel nitrate concentration on the deposition of nickel hydroxide films. J. Electrochem. Soc.. 1995;142(4):1084-1089.
- [Google Scholar]
- Electrochemical precipitation of nickel hydroxide. J. Power Sources. 2002;112(2):562-569.
- [Google Scholar]
- Hybrid nickel-metal hydride/hydrogen battery. Int. J. Hydrogen Energ.. 2019;44(8):4263-4270.
- [Google Scholar]
- Stabilized α-Ni(OH)2 as electrode material for alkaline secondary cells. J. Electrochem. Soc.. 1994;141:2956-2959.
- [Google Scholar]
- Three-dimensional Ni(OH)2 nanoflakes/graphene/nickel foam electrode with high rate capability for supercapacitor applications. Int. J. Hydrogen Energ.. 2014;39(15):7876-7884.
- [Google Scholar]
- Physical and electrochemical characteristics of nickel hydroxide as a positive material for rechargeable alkaline batteries. J. Appl. Electrochem.. 1995;25(3):219-226.
- [Google Scholar]
- The nanoscale effects on the morphology, microstructure and electrochemical performances of the cathodic deposited α-Ni(OH)2. Electrochimica Acta. 2018;261:58-65.
- [Google Scholar]
- α-Ni(OH)2∙0.75H2O nanofilms on Ni foam from simple NiCl2 solution: fast electrodeposition, formation mechanism and application as an efficient bifunctional electrocatalyst for overall water splitting in alkaline solution. Electrochimica Acta. 2019;301:87-96.
- [Google Scholar]
- Enhanced cycling performance of Al-substituted α-nickel hydroxide by coating with β-nickel hydroxide. J. Power Sources. 2013;224:236-240.
- [Google Scholar]
- Mechanism investigation of α-Ni(OH)2 electrodeposition from a NiCl2 solution. Int. J. Hydrogen Energy. 2021;46(1):41-49.
- [Google Scholar]
- α-Ni(OH)2 electrodeposition from NiCl2 solution. Trans. Nonferrous Met. Soc. China. 2020;30(10):2802-2811.
- [Google Scholar]
- Hierarchical flower-like nickel (II) oxide microspheres with high adsorption capacity of Congo red in water. J Colloid Interf. Sci.. 2017;504:688-696.
- [Google Scholar]


