

Translate this page into:
Inhibition of stemness and EMT by taxifolin ruthenium-p-cymene complex via downregulating the SOX2 and OCT4 expression on lung cancer
⁎Corresponding author at: Department of Pharmacy, NSHM knowledge campus –Kolkata, 124 B.L. Saha Road, Kolkata 700053, India. souvik.roy@nshm.com (Souvik Roy)
-
Received: ,
Accepted: ,
This article was originally published by Elsevier and was migrated to Scientific Scholar after the change of Publisher.
Peer review under responsibility of King Saud University.
Abstract
Lung carcinoma is perhaps the most often reported cancer incidence throughout the world. The flavonoid metal complexes have exhibited a potential chemotherapeutic effect. This study investigated the chemotherapeutic effect of taxifolin ruthenium-p-cymene complex against lung carcinoma through MTT assay, transwell migration assay, sphere formation assay, western blot, histopathology, immunohistochemistry, and TUNEL assay. The in silico study determined the target proteins of the complex. The synthesized organometallic complex was characterized via various spectroscopical techniques. The complex exhibited strong binding affinity for PI3K, EGFR, and β-catenin. The complex promoted apoptosis and inhibited the colony formation of the cancer cells. Moreover, the cancer cell migration and cancer stemness were reduced with decreased SOX2 and OCT4 expression. The complex induced cell cycle arrest at sub G0/G1 phase, S phase and G2/M phase and promoted caspase-3 mediated apoptosis. The in vivo study demonstrated successful restoration of lung tissue due to the treatment with the complex in benzo-α-pyrene induced lung cancer model. Additionally, the expression of p53 and caspase-3 was increased with significant downregulation of Akt, mTOR and β-catenin. In conclusion, the complex inhibited cancer cell viability, stemness, and EMT in both in vitro and in vivo model systems through the alteration of PI3K/Akt/mTOR/EGFR pathway and expression of stem cell markers including SOX2 and OCT4 that eventually abrogated the EMT mediated metastasis of cancer cells.
Keywords
Taxifolin
Ruthenium-p-cymene
Stemness
Epithelial-to-mesenchymal transition
Lung cancer

1 Introduction
Lung cancer (LC) is indeed the world's deadliest and most expensive cancer, associated with 2,206,771 new cases and 1,796,144 fatalities. These reports suggesting that the lung cancer has the highest prevalence and mortality levels in the world (Sung et al., 2021). In India, it is also a big healthcare issue. It is estimated that, the incidence of lung cancer will rise to 111,428 cases in 2025 in India (Nath et al., 2022).
Cancer stem cells (CSCs) can be identified as a type of stem cells which are associated with the development of tumor, drug resistance, cancer relapse and epithelial-to-mesenchymal transition (EMT) mediated cancer cell metastasis. The cancer stemness is regulated by several signaling pathways such as JAK/STAT, Notch, PI3K (Phosphoinositide 3 kinase)/Akt/mTOR, SHH, and Wnt/β-catenin signaling cascade (Masciale et al., 2019). The PI3K/Akt pathway is a cell survival pathway, which is directly correlated with the stem cell progression and its survival. It was also reported that upregulation of PI3K/Akt/mTOR pathway inhibits the process of apoptotic events (Yao and Cooper, 1995). In addition, the faulty Wnt/β-catenin signaling pathway triggers cancer stem cell renewal, proliferation, and differentiation which play a key role in tumorigenesis and therapy response (Zhang and Wang, 2020). Wnt/β-catenin signaling pathway also plays important roles from cancer initiation to metastasis and recurrence, by triggering the EMT (Clevers, 2006). EMT has been also shown to turn cancer cells into stem cells (Mani et al, 2008). Moreover, aberrant accumulation of β-catenin caused mutational inactivation of p53 (Sadot et al., 2001) which disrupts the apoptosis of cancer cells. The loss of apoptotic control promotes cancer cell survival and provides enough time for accumulation of mutations which increase the cancer invasiveness and angiogenesis (Hassan et al., 2014). In order to eliminate cancer relapse, metastasis, and associated disorders, targeted therapy against cancer stem cells is therefore needed which facilitates in-depth research into the effects of targeting CSCs.
The natural bioactive compounds play an important role in the treatment of cancer as it possesses a number of biological activities especially the flavonoids (Heim et al., 2002). Flavonoids exhibit a strong antioxidant activity and neutralize the effects of free radicals due to the presence of hydroxyl groups, and they chelate metal ions (Kumar and Pandey, 2013). Quercetin, an important flavonoid, possesses a wide range of documented anticancer potential (Iacopetta et al., 2017). There are various derivatives of quercetin which are also associated with effective anticancer activity, among which taxifolin (3,5,7,3′,4′-pentahydroxyflavanone or dihydroquercetin), an operative flavonoid, abundantly found in olive oil, grapes, in citrus fruits and onions (Min et al., 2019) has been used for our study as a natural bioactive compound. Taxifolin is associated with number of biological and pharmacological activities including antioxidant, anti-inflammatory, hepatoprotective, antiangiogenic properties (Butler, 2006), anti-diabetic, cardioprotective, neuroprotective, anti-alzheimer’s disease (Min et al., 2019). The anticancer activity of taxifolin has also been exhibited in several caner model systems (Butler, 2006). Taxifolin has been actively or passively suggested to suppress stemness and EMT in many tumors. It also facilitates the differentiation of human umbilical cord-derived mesenchymal stem cells to osteoblasts (Córdoba et al., 2015). Furthermore, taxifolin decreases invasive cells, through the inhibition of the EMT (Wang et al., 2020). In the current age, the natural compounds have been functionalized with the metals developing organometallic complex with significant chemotherapeutic potency towards chemotherapy in order to improve the efficacy of the treatment.
Metal complexes have played an essential part in therapy due to their wide range of physico-chemical characteristics which include variable oxidation states, hydrophobicity and lipophilicity, aqueous solubility and positively charged nature (Raj et al., 2018). In this regard, the ruthenium complexes exhibited impressive outcomes as new potential chemotherapeutic agent because of their higher rate of ligand exchange, variable oxidation states, and excellent aqueous solubility and stability in a biological environment (Allardyce and Dyson, 2001). Subsequently, for the better cellular accumulation and better cellular uptake a n6-p-cymene moiety has been attached to the ruthenium (Bugarcic et al., 2009). The hydrophobic nature of the ruthenium-attached arene ligand promotes the passive diffusion of the complex through the membrane of the cell and increases the deposition within cells (Dyson, 2017). Once they have planar aromatic ligands, ruthenium(II) complexes may undergo intercalation and the complex is incorporated in between neighboring DNA base pairs (Huang et al., 2014).
In this research, we have synthesized a ruthenium based organometallic complex by using taxifolin and ruthenium-p-cymene and evaluated the anticancer potential of the complex against lung cancer by inhibiting the stemness and EMT. The chemotherapeutic study was performed on benzo[α]pyrene induced lung cancer model of mice. Along with that, the potential impacts of taxifolin ruthenium-p-cymene complex in two NSCLC cell lines; A549 and NCI-H460 were also assessed in vitro, focusing precisely on its potential to inhibit the cancer stemness and EMT.
2 Materials and methods
2.1 Chemicals
Taxifolin, Dichloro (p-cymene) ruthenium(II) dimer were procured from Sigma-Aldrich Chemical Co. anti-rabbit SOX2 (Sex determining region Y-box 2), OCT4 (octamer-binding transcription factor 4), E-cadherin, N-cadherin, PI3K, EGFR (Epidermal growth factor receptor), p53, caspase-3, Akt, mTOR, β-catenin antibodies were procured from GeneTex, Inc (Irvine, CA, USA). DPPH, penicillin, TPTZ, ABTS, foetal bovine serum (FBS), sodium pyruvate, MTT (3-(4, 5 dimethylthiozol-2-yl)-2, 5- diphenyltetrazolium bromide), Annexin V and propidium iodide (PI) (procured from Sigma-Aldrich Chemical Co). All the other reagents were obtained from commercial retail suppliers that were of high purity analytical grade.
2.2 Pharmacophore analysis
2.2.1 Protein structure prediction
The overall research is based on the understanding of proteins that are involved in lung cancer. The protein sequences such as PI3K (P42336), β-catenin (CAA61107), EGFR (P00533) were retrieved from UniProt knowledge database. These protein sequences were used to predict 3D protein structure based on the structural similarity to construct homology models by predicting similar templates using BLASTp.
2.2.2 Ligand preparation and drug likeliness analysis
The compound taxifolin ruthenium-p-cymene complex was designed using ChemSketch 2020.1.1. The chemical structures were saved in. mol format and further used for drug-likeliness to understand the druglike properties of the compounds. Pharmacokinetic analysis of the selected compound was predicted using AdmetSAR tool that show high throughput virtual screening based on the traditional medical chemistry properties.
2.2.3 Molecular docking and virtual screening
Based on pharmacophore and pharmacokinetic properties, the selected chemical is further used for molecular docking against target lung cancer proteins. Using AutoDock4.2 and AutoDockVina software to predict the protein–ligand interactions based on binding energy and hydrogen bond formation.
2.3 Synthesis scheme of taxifolin ruthenium-p-cymene complex
The taxifolin ruthenium-p-cymene complex was synthesized by incorporating both taxifolin and ruthenium-p-cymene moiety in a 2:1 ratio at a specific reaction condition. Approximately 60.8 mg (0.2 mmol) of taxifolin was weighed and dissolved in 5 mL of methanol and the pH was maintained at 8 by adding 1 M sodium methoxide solution in methanol. 61.24 mg (0.1 mmol) of ruthenium-p-cymene was dissolved in 15 mL of dichloromethane and the solution was added drop wise to the taxifolin solution with continuous stirring for 24 h in dark condition. Greenish black precipitate of the complex was observed after complete evaporation of the solvent. The precipitate was then collected and washed with ethanol:water (1:1) solution, dried in vacuum dryer and stored at room temperature. The percentage yield of the complex was found to be 94.33%. The complex was soluble in methanol and DMSO. The probable structure of the complex has been depicted in Fig. 1A.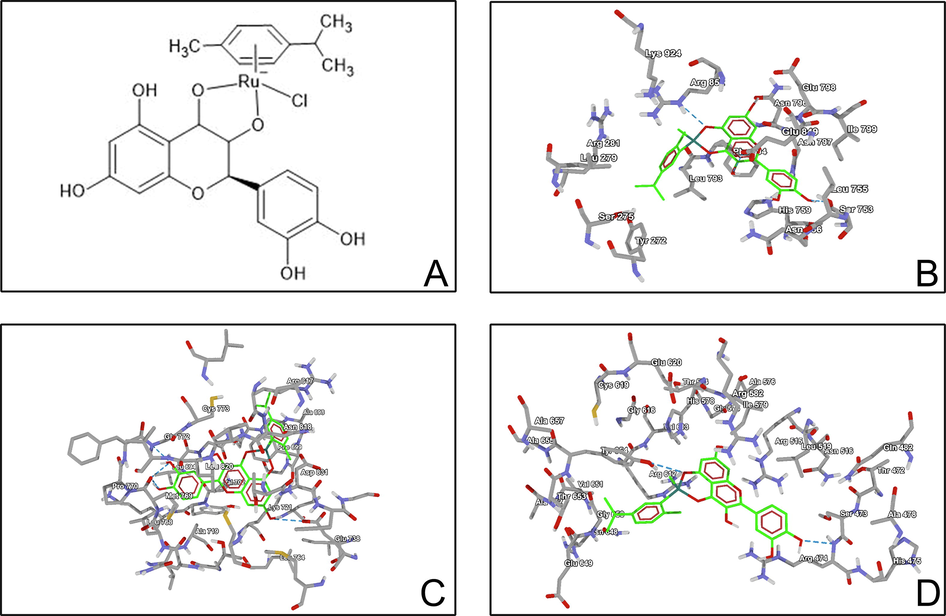
(A) Structure of taxifolin ruthenium-p-cymene complex. Molecular docking study of taxifolin ruthenium-p-cymene complex with (B) PI3K (C) EGFR (D) β-catenin.
2.4 Characterization
2.4.1 UV–Visible spectroscopy
The UV–visible spectrum of pure taxifolin and taxifolin ruthenium-p-cymene complex was recorded using UV-1900i Shimadzu double beam spectrophotometer.
2.4.2 Job’s method
The stoichiometric ratio of taxifolin to ruthenium-p-cymene in the complex was analyzed by continuous variation technique also known as Job’s method. Taxifolin of 0.1 mM (1, 2…9 mL) was taken into nine 10 mL volumetric flasks and an aliquot (9, 8…1 mL) of 0.1 mM [Ru(p-cymene) Cl2] was added respectively at which a constant mole fraction of solution was attained. All the measurements were made at λmax which was found to be at 241 nm.
2.4.3 Fourier-transform infrared spectroscopy (FTIR)
FTIR spectrophotometer (IR Affinity-1S, Shimadzu) was used to record the IR spectrum of taxifolin and taxifolin ruthenium-p-cymene complex over the range of 500–4000 cm−1 wavenumber to distinguish the metal oxide bond as a validation of complexation.
2.4.4 Mass spectroscopy
The molecular weight and the fragmentation pattern of the complex were evaluated by mass spectroscopy using electrospray ionization mass spectroscopy (ESI-MS) (Xevo G2 Xs Q-Tof ESI Mass).
2.4.5 NMR spectroscopy
The 1H NMR spectrum of the complex was recorded using Bruker-Avance-600 MHz spectrometer in methanol-D4. Tetramethylsilane (TMS) was used as an internal reference.
2.4.6 Scanning electron microscopy
The morphological features of the complex were evaluated using scanning electron microscopy (JEOL MAKE, (UK) Model-JSM-IT800 Schottky Field Emission Scanning Electron Microscope) at an accelerating voltage of 10 kV. The surface characteristics and morphological appearance of the complex was also examined at different magnifications (50X, 4000X, 6000X and 10000X).
2.4.7 X-ray diffractometry
For taxifolin ruthenium-p-cymene complex, no single crystal was formed. To detect the degree of crystallinity of this metal complex, X-ray powder diffraction was carried out. The X-Ray diffraction pattern of the complex was assessed by ULTIMA IV XRD System (Rigaku) operating at 45 kV and 40 mA using CuKα radiation (1.540562 Å) with the Bragg-Brentano geometry with step size 0.02 (2θ), step time 3 sec from 5 to 95. The average size of the crystallites has also been estimated using the Scherer’s equation;
Where, D represents average crystallite size, K is Scherrer constant, λ represents X-ray wavelength, β is line broadening FWHM (full width half maxima) in radians, θ is Bragg’s angle in degree. FWHM has been calculated based on Single Line profile Analysis using X'pert Organizer (PANalytical) software.
2.5 In vitro antioxidant assay
2.5.1 DPPH assay
The DPPH assay was performed as per the method of Rahman and co researchers (Rahman et al., 2015). The absorbance of test solutions was measured at 517 nm for both taxifolin and taxifolin ruthenium-p-cymene complex, in which 0.1 mM DPPH solution was considered as control. The % of radical scavenging activity (% RSA) was calculated as
Where A0 is the absorbance of control, A1 is the absorbance of test solution.
2.5.2 ABTS assay
The ABTS assay was performed as per the protocol mentioned by Pennycooke and coworkers (Pennycooke et al., 2005). In this method taxifolin and the complex was dissolved in ABTS solution separately for 15 min at room temperature and the absorbance was then taken at 734 nm. The % radical scavenging activity (% RSA) was then measured by the equation mentioned below
Where A0 = Absorbance of free radical cation, Af = Absorbance observed 15 min after incorporation of the complex.
2.5.3 FRAP assay
The antioxidant activity of the complex was also analysed using FRAP method according to the protocol described by Benzie and Strain (Benzie and Strain, 1996) which was developed by Griffin and Bhagooli (Griffin and Bhagooli, 2004). The antioxidant potential was measured by the ability of the complex to reduce Fe3+ ion. In this assay, the FRAP reagent was prepared by mixing TPTZ solution with FeCl3 in freshly prepared acetate buffer. The bluish colour of the Fe3+ ion in TPTZ (2,4,6-Tripyridyl-S-triazine) solution changes its colour to dark as it reacts with the antioxidant substance and reduced to Fe2+ ion. The experiment was conduct by using different concentration of the taxifolin ruthenium-p-cymene complex as well as by busing free taxifolin. The absorbance of the solution was measure at 593 nm.
2.6 Assessment of DNA binding efficacy
The DNA binding assay of the complex has been demonstrated in Supplementary file 1.
2.7 In vitro study
2.7.1 Cell culture
The lung cancer cell lines A549 and NCI-H460 were procured from National Centre for Cell Science (NCCS), University of Pune. The cancer cells were seeded in DMEM high glucose media, supplemented with 10 % FBS (Foetal Bovine Serum) along with the 1% antibiotic–antimycotic solution and incubated in 5% CO2, 18–20% O2, 95% relative humidity at 37 °C in the CO2 incubator and sub-cultured for every 2 days.
2.7.2 MTT assay
The cell viability assay of the complex was conducted using MTT (3-(4, 5 dimethylthiozol-2-yl)-2, 5- diphenyltetrazolium bromide) reagent. The cells were treated with different concentrations of the complex (43.6, 87.3, 174.5, 349, 698.1 µM) and cell viability was observed at 48 h. The cell viability was investigated through mitochondrial succinate dehydrogenase which metabolizes MTT to produce formazan crystals. % Cell viability was measured as:
The IC50 (Half-maximal inhibitory concentration) value was determined by using linear regression equation i.e., y = mx + C, where, y = 50, m and C values were derived from the viability graph.
2.7.3 Assessment of olegonucleosomal fragmentation
The effect of the complex on the cancer cells was observed by staining the cells with fluorescent nuclear dye 4′,6-diamidino-2-phenylindole dihydrochloride (DAPI). The cells were observed under ZEISS LSM 880 Fluorescence live cell imaging system (Confocal Microscopy) with filter cube with Excitation 358 nm and Emission 461 nm. Images were analysed by ZEN Blue Software and recorded.
2.7.4 Colony formation assay
The effect of the complex on the cancer cell proliferation and colony formation was evaluated by clonogenic assay after 48 h of incubation. The colonies of the cancer cells were stained with 0.5% crystal violet solution and visually quantified to distinguish the colonies which comprises > 50 cells/colony. The clonogenicity was then evaluated by using the formula below:
The experiment was conducted in triplicate manner.
2.7.5 Transwell migration assay
The cell invasion activity of the A549 and NCI-H460 cell lines were assessed by transwell migration assay. The cells were seeded (5 × 10⁴ cells/well) in the upper chamber of the transwell and supplemented with 0.1% FBS containing DMEM medium. The lower chamber was filled with DMEM, supplemented with 10% FBS. The cells of both chambers were treated with different concentrations of the complex. After 48 h of incubation the cells in the lower chamber was fixed by 4% paraformaldehyde and stained with 0.25% crystal violet. The wells were then scanned at four random fields and the numbers of invaded cells were counted using bright field microscope at 40X magnification.
2.7.6 Sphere formation assay
A549 and NCI-H460 cells were seeded in the ultra-low attachment multiwall plate at the concentration of 1 × 10⁴ cells/ml in 3dGRO spheroid medium. The cells were treated with various concentrations (IC25, IC50, and IC75) of complex and incubated for 10 days at 37 °C in 5% CO2. Then the pictures of the spheres were taken and the sphere numbers were counted in four random fields under the microscope.
2.7.7 Flow cytometry
The apoptosis assay and cell cycle distribution analysis were performed on the A549 and NCI-H460 cells after the treatment with the complex through flow cytometric analysis. The cells were suspended and the nuclear DNA was tagged with Annexin-V conjugated-FITC and propidium iodide (PI). Acquisition was done by using BD FACSCalibur and data were analysed by BD Cell Quest Pro Software (Version: 6.0).
2.7.8 Detection of caspase-3 expression
The expression of caspase-3 in A549 and NCI-H460 cells were investigated by flow cytometry. The cells were seeded in 6 well plate and treated with different concentrations (IC25, IC50, and IC75) of the complex for 48 h. The cells were then treated with anti-rabbit caspase-3 polyclonal antibody at 37 °C in dark environment. The percentage of cells labeled with caspase-3 antibody was investigated by flow cytometric analysis.
2.7.9 Western blot
The expression of PI3K, EGFR, SOX2, OCT4, N-cadherin, E-cadherin on the A549 and NCI-H460 cells was detected by using the western blot analysis. The cells were treated with different concentrations (IC25, IC50, and IC75) of the complex and incubated for 48 h. The total cell lysate from each group was obtained that was further resolved in SDS-PAGE (8–12%) electrophoresis and transferred to PVDF membrane. The membrane was then blocked with 5% non-fat dried milk in PBST and incubated with anti-rabbit PI3K, EGFR, SOX2, OCT4, N-cadherin and E-cadherin antibodies (1:500 dilution) overnight in humidified chamber. After incubation the membrane was treated with HRP conjugated goat anti-rabbit secondary antibodies and the expression was detected by chemiluminescent (ECL Western Blotting) kit with β-actin as loading control.
2.8 In vivo study
2.8.1 Animal
For the toxicity study Swiss albino mice (15–20 g), 6–8 weeks old of both sexes (females should be nulliparous and nonpregnant) and for chemotherapeutic study 6 weeks old male Balb/c mice (20–30 g) were purchased from registered animal breeder (Regd.no. −1458/PO/E/S/11/CPCSEA Dated- 12.05.2011). The animals were placed in polypropylene cages in 12 h light/dark cycle at 22 °C (±3°C) with relative humidity of about 50–58%. Animals were given free access to food and demineralized water. The experimental protocol was approved by the Institutional Animal Ethics Committee and by the Animal Regulatory Body of the Government (1458/PO/E/S/11/CPCSEA dated 12.05.2011) and experiments have been conducted in accordance to ARRIVE guidelines. The animals were acclimatized to the laboratory condition for one week prior to the initiation of the experiment.
2.8.2 Toxicity study
The toxicity study has been demonstrated in Supplementary file 1.
2.8.3 Experimental protocol
After the acclimatization period, the animals were randomly distributed into seven groups (I, II, III, IV, V, VI, VII) and each group consist of six animals. When the mice were 7–8 weeks old, all the animals (except group I) were given a single i.p. injection of 100 mg/kg Benzo(α) pyrene in 0.2 mL of corn oil to induce the lung cancer. Treatment with taxifolin ruthenium-p-cymene complex was started after 2 weeks of benzo(α)pyrene (B(α)P) induction and continued for 20 weeks. The experimental design is followed as:
Group I- Normal untreated vehicle control animals, Group II- B(α)P treated animals assigned as carcinogen control, Group III- B(α)P treated animals receives 50 mg/kg complex, Group IV- B(α)P treated animals receives 100 mg/kg complex, Group V- B(α)P treated animals receives 200 mg/kg complex, Group VI- B(α)P treated animals receives 50 mg/kg taxifolin, Group VII- B(α)P treated animals receives 50 mg/kg ruthenium-p-cymene.
The tumor volume was assessed via caliper two times per week and tumor sizes were calculated by using the following equation (Dethlefsen et al., 1968):
The tumor volume and body weight were assessed two times per week over the course of the treatment. At the end of the experiment the animals were sacrificed using pentobarbital sodium. The lungs were excised, fixed in formalin, transferred to 70% alcohol, and examined for further experimentations.
2.8.4 Histopathology of lungs
An initial incision was made at the ventral midline which extends from the chin to the pubis. The sub cutis of the ventral and lateral thorax and abdomen was completely exposed. Subsequently, the rib cage was removed and the entire thoracic cavity was exposed. Then all dorsal attachments were cut and the tongue, esophagus, trachea, heart, and lungs were removed from the thoracic cavity. Heart and the other organs were separated from trachea and lungs and the whole tissue was fixed into 10% neutral buffered formalin (NBF) solution for 24 h. The excised tissues were dehydrated and embedded in paraffin wax. The tissues of 5 µm thickness were kept on slides and rehydrated by graded alcohol. The slides were stained using haematoxylin and eosin (H&E), which were observed under the light microscope for histological evaluation.
2.8.5 Antioxidant assay of lung
The in vivo antioxidant assay has been depicted in Supplementary file 1.
2.8.6 Immunohistochemistry
The excised lung tissues, mounted on poly-L-lysine coated glass slides were deparaffinized and treated with 3% H2O2. The blocking solution was added to the slides and then incubated with appropriately diluted (1:500) primary antibodies (anti-rabbit p53, Akt, mTOR, caspase-3, β-catenin) overnight at 4 °C in a humidified chamber. After incubation, the HRP conjugated goat anti-rabbit secondary antibodies were added to the slides for 2 h. The nuclear staining was done by DAB and hematoxylin was utilized for background staining. The slides were then observed under light microscope and the immune-positive cells were quantified by ImageJ software (version 1.8.0).
2.8.7 Cell proliferation assay
The excised lung tissues, mounted on poly-L-lysine coated glass slides were deparaffinized and treated with 3% H2O2. The blocking solution was added to the slides and then incubated with appropriately diluted (1:500) anti-rabbit Ki-67 antibody overnight at 4 °C. The slides were then treated with HRP conjugated goat anti-rabbit secondary antibody for 2 h. The nuclear staining was done by DAB and hematoxylin was used for background staining. The Ki-67 expression was examined under light microscope and the immune-positive cells were quantified by ImageJ software (version 1.8.0).
2.8.8 Apoptosis assay by TUNEL method
The occurrence of apoptotic events in the lung was assessed by TUNEL (Terminal deoxynucleotidyl transferase dUTP Nick-End Labeling) assay. The proteinase-K solution was added to the tissue sections and further treated with H2O2 to abrogate the peroxidase activity. poly-L-lysine coated slides of colon tissues were used for TUNEL assay. The slides were treated with proteinase-K followed by H2O2 to block activity of endogenous peroxidase. The tissue sections were supplemented with terminal deoxynucleotidyl transferase (TdT) accompanied by TdT and dUTP containing TdT reaction at 37 °C for an hour. Later on, saline citrate was added to abort. The slides were further incubated antidigoxigenin peroxidase (1:1000) at 37 °C for half an hour and finally stained with DAB and hematoxylin. The slides were then observed under microscope followed by quantification of the TUNEL-positive cells.
The labeling index (LI) designated the percentage of Ki-67-positive cells. The apoptotic index (AI) represented the percentage of TUNEL-positive cells to the total number of cells.
2.9 Statistical analysis
Data were expressed as the mean ± SEM. All the statistical evaluation was done by ANOVA followed by Tukey’s post hoc multiple comparison test using Graph Pad Prism (Version 5). The differences were found to be statistically significant when p < 0.05.
3 Results
3.1 Pharmacophore analysis
3.1.1 Bioactive properties
The bioactive properties of the complex was predicted based on the probable activity against different target receptors (GPCR ligand, Ion channel modulator, Kinase inhibitor, Nuclear receptor ligand, Protease inhibitor and Enzyme inhibitor) (Table 1) and the results showed the increasing positive values which represents the best active potential against target receptors. The complex showed highest positive value for nuclear receptor ligand (0.29) suggesting great binding affinity to the DNA.
Properties
complex
GPCR Ligand
0.14
Ion channel modulator
0.04
Kinase inhibitor
0.02
Nuclear receptor ligand
0.29
Protease inhibitor
0.05
Enzyme inhibitor
0.15
3.1.2 Pharmacokinetic profile
The pharmacokinetic profile of the complex has been documented in the Tables 2, 3. According to the ADMET profile, the complex is a P-glycoprotein substrate and showed a great absorption from GI tract and through blood–brain-barrier. The toxicity profile of the complex reported that the complex is not carcinogenic but having high fish toxicity and honey bee toxicity probability. It is also non AMES toxic and having grade III acute oral toxicity i.e. slightly toxic and slightly irritating.
Model
Result
Probability
Absorption
Blood-brain barrier
BBB (+)
0.6006
Human intestinal absorption
HIA (+)
0.8420
Caco-2 permeability
Caco-2 (-)
0.5353
P-glycoprotein substrate
Substrate
0.5643
Distribution
Sub-cellular localization
Mitochondria
0.6004
Metabolism
CYP450 3A4 substrate
Substrate
0.5841
CYP450 2D6 substrate
Non– substrate
0.8066
CYP450 2C9 substrate
Non– substrate
0.7982
Toxicity
AMES toxicity
Non AMES toxic
0.7740
Carcinogens
Non-carcinogens
0.7749
Fish toxicity
High FHMT
0.9946
Honey bee toxicity
High HBT
0.6639
Biodegradation
Not ready biodegradable
0.9911
Acute oral toxicity
III
0.4393
Model
Value
Unit
Absorption
Aqueous solubility
−4.8495
LogS
Plasma protein binding
1.096
100%
Toxicity
Rat acute toxicity
2.7894
LD50, mol/kg
Fish toxicity
0.4825
pLC50, mg/L
3.1.3 Molecular docking
Docking interaction of proteins with ligand molecules exhibited that lung cancer proteins such as PI3K, β-catenin and EGFR were strongly interacted with Taxifolin ruthenium-p-cymene complex (Table 4). The PI3K and EGFR protein structure were forming 4 hydrogen bonds with the interaction energy of −7.2 and −6.9 kcal/mol respectively within active site of amino acids such as Ser753, Glu849, Arg852 and Glu738, Met769, Gly772 respectively. β-catenin was forming 3 hydrogen bonds with the energy of −7.2 kcal/mol within active site of amino acids Arg474, Arg515 and Tyr654 (Fig. 1B, C, D).
Proteins
H-Bonds
Bond Energy
Amino Acids
PI3K
4
−7.2
Ser753, Glu849, Arg852,
β-catenin
3
−7.2
Arg474, Arg515, Tyr654,
EGFR
4
−6.9
Glu738, Met769, Gly772
3.2 Instrumental analysis
3.2.1 UV–Visible spectroscopy
The absorption spectra of taxifolin represent two characteristics absorption band at 287 nm and 224 nm for band I and band II respectively. The absorption spectra of the taxifolin ruthenium-p-cymene complex showed significant shifts in their absorption band position (Fig. 2A). The band I shift from 287 nm to 295 nm and band II shifts from 224 nm to 227 nm. The occurrence of the maximum shift occurs for band I position (Fig. 2B).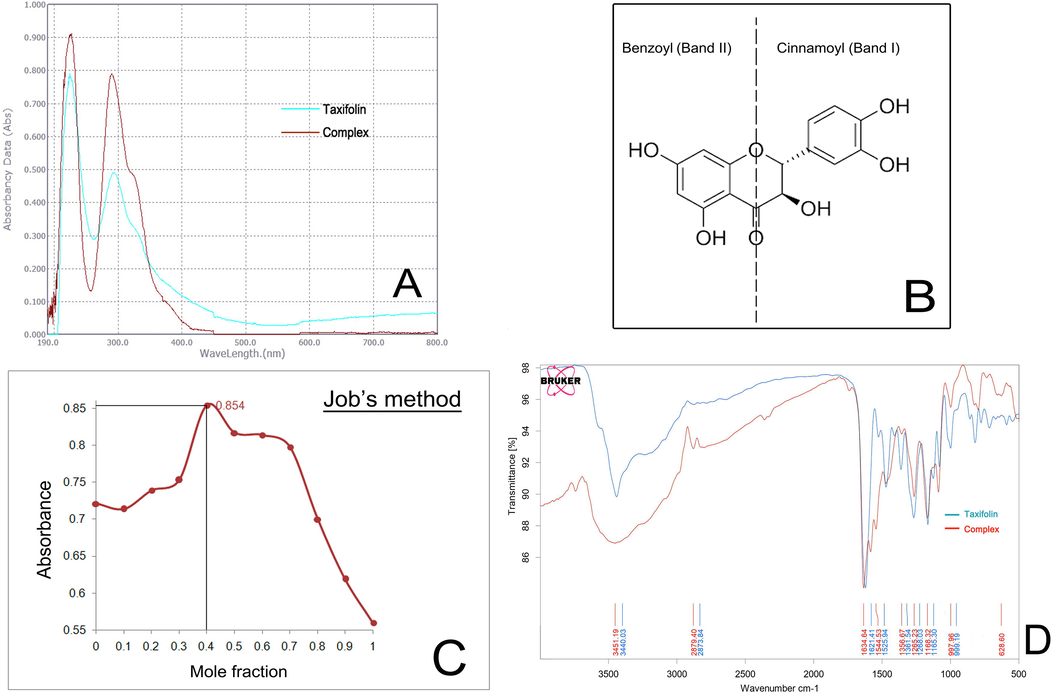
(A) UV–visible spectra of taxifolin and taxifolin ruthenium-p-cymene complex (B) taxifolin and its different bands (I and II) related to UV–vis spectroscopy (C) Plot of absorbance vs. mole fraction of taxifolin at 241 nm (D) FTIR spectra of taxifolin and taxifolin ruthenium-p-cymene complex.
3.2.2 Job’s method
The interaction between taxifolin and ruthenium-p-cymene dimer molecule has been evaluated by spectrophotometric analysis through Job’s method. The solution containing taxifolin and ruthenium-p-cymene dimer at a ratio of 1:1.5 or approximately 1:2 at a pH of 6.8 shows the maximum absorbance (0.854) (Fig. 2C).
3.2.3 FTIR study
The FTIR spectra of taxifolin and taxifolin ruthenium-p-cymene complex have been depicted in (Fig. 2D) and evaluated Table 5. A distinguishable peak at the region of 628.6 cm−1 has been appeared in the IR spectra of the complex that is absent in the IR spectrum of taxifolin. This peak corresponds to the (Ru-O) bond due to the complex formation. The appearance of V (O—H) band at 3440.03 cm−1 for taxifolin is shifted to 3451.19 cm−1 for the complex. The V (C⚌O) stretching band is shifted from 1621.41 cm−1 to 1634.64 cm−1.
Compound
V (O—H)
V (C⚌O)
V (C⚌C)
V (C—OH)
V (C—O—C)
V (M—O)
Taxifolin
3440.03
1621.41
1470.88
1268.03
1165.3
–
Complex
3451.19
1634.64
1471.69
1265.23
1168.32
628.6
3.2.4 Mass spectroscopy
The mass spectrum of taxifolin ruthenium-p-cymene complex is depicted in (Fig. 3A). The highest molecular abundance was observed for the molecular ion peak with m/z value 573.0148. The other peaks that appeared in the mass spectrum were due to the fragmentation. The mechanism of the fragmentation has shown in the (Fig. 3B).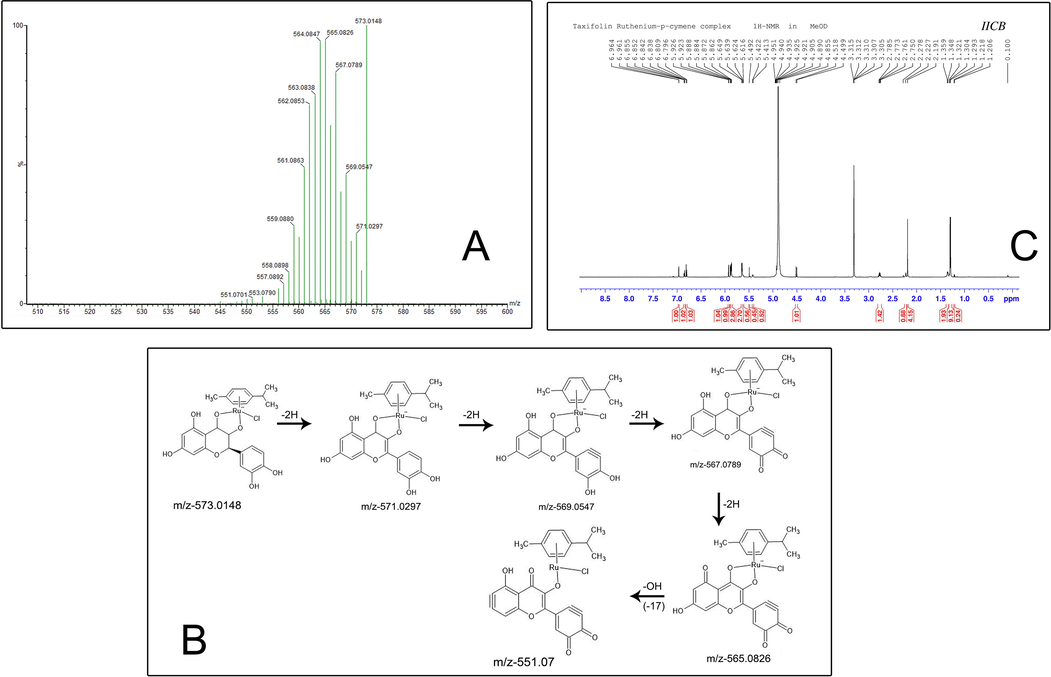
(A) Mass spectroscopy of taxifolin ruthenium-p-cymene complex (B) The fragmentation mechanism of the complex (C) 1H NMR spectra of taxifolin ruthenium-p-cymene complex.
3.2.5 NMR spectroscopy
6.96 (d, 1H, J = 1.8 Hz); 6.85 (dd, 1H, J = 7.8, 1.8 Hz); 6.8 (d, 1H, J = 7.8 Hz); 5.92 (d, 1H, J = 1.8 Hz); 5.89 (d, 1H, J = 2.4 Hz); 5.87 (d, 2H, J = 6 Hz); 5.64 (d, 2H, J = 6 Hz); 5.62 (d, 2H, J = 4.8 Hz); 5.49 (s, 1H); 5.42 (d, 1H, J = 5.4 Hz); 4.92 (d, 1H); 4.51 (d, 1H, J = 11.4 Hz); 2.77 (m, 1H); 2.19 (s, 3H); 1.21 (d, 6H). (Fig. 3C) depicted the 1H NMR spectrum of the taxifolin ruthenium-p-cymene complex.
3.2.6 Scanning electron microscopy
The surface morphology of the complex is evaluated by scanning electron microscopy with various magnifications (50X, 4000X, 6000X and 10000X) which has been demonstrated in the (Fig. 4 A-D). The orthorhombic crystal structure of the complex can be clearly visualized from the SEM images with sharp edges and symmetrical structures.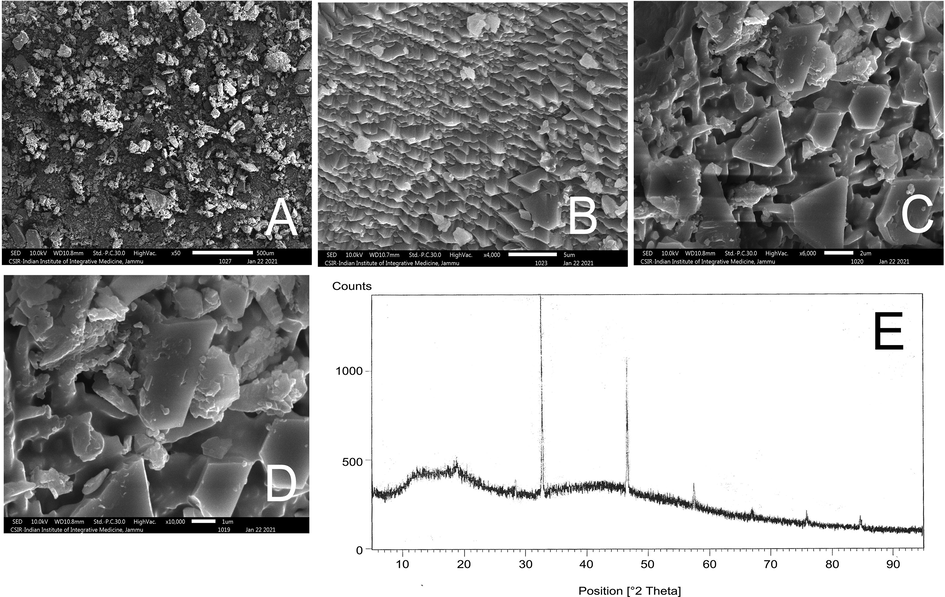
Scanning electron microscopy (SEM) of the complex at (A) 50X (B) 4000X (C) 6000X (D) 10000X. (E) X-ray diffractogram of taxifolin ruthenium-p-cymene complex.
3.2.7 X-ray diffractometry
X-ray Diffractogram of taxifolin ruthenium-p-cymene complex has been depicted in Fig. 4E. The X-ray Diffractogram of the complex exhibited three major high intensity peaks at three diffraction angles which include 31.74°, 45.51° and 56.54° with its relative intensity 100%, 74.35%, and 19.81% respectively. The maximum intensity was found at 31.74° and minimum intensity was recorded at 71.53°. The interplanar spacing (d) as well as their relative intensities in relation to acquired peaks at different diffraction angles has been depicted in Table 6. The crystallite sizes for the major three peaks have been recorded in Table 6. The average crystallite size of taxifolin ruthenium-p-cymene complex was found to be 49.81 nm.
Position (2θ)
d-spacing (Å)
Relative intensity (%)
β (FWHM)
D (crystallite size) (nm)
D average (nm)
11.6903
7.57007
7.57
49.81142613
18.0346
4.91880
11.20
27.3791
3.25756
14.09
31.7384
2.81938
100.00
0.1436
56.8531084
45.5110
1.99312
74.35
0.1464
58.16800806
56.5396
1.62774
19.81
0.2591
34.41316194
66.2920
1.40997
6.62
71.5309
1.31904
1.61
75.3766
1.26101
8.16
84.0554
1.15153
8.44
3.3 Evaluation of antioxidant status
3.3.1 DPPH activity
The absorption spectra of different DPPH solution containing different concentration of free taxifolin and the complex has been depicted in (Fig. 5A). The % radical scavenging activity (% RSA) of free taxifolin increases very slightly with increasing concentration and the maximum % RSA was detected to be 99.23%. But for the complex it showed a drastic increase in the % RSA with increasing concentration which reaches up to 98.85%. The complex shows less DPPH radical scavenging activity than the free taxifolin at same concentration.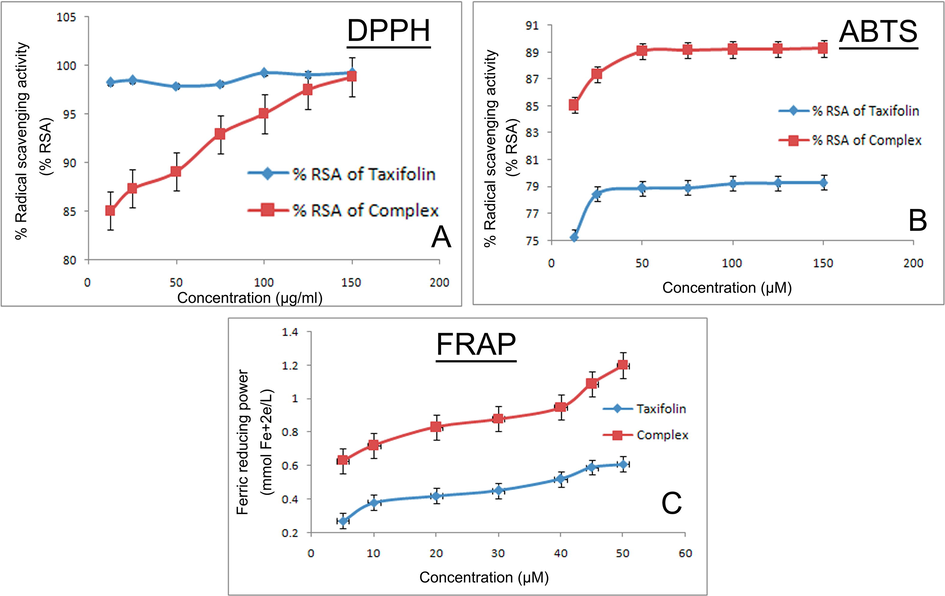
Measurement of antioxidant potential of the complex by (A) DPPH method (B) ABTS method (C) FRAP method.
3.3.2 ABTS activity
The ABTS assay of taxifolin and the complex has been depicted in the (Fig. 5B). It was found that the absorbance of ABTS solution decreases with increase in the concentration of the complex. Along with that the complex showed more radical scavenging activity than that of free taxifolin.
3.3.3 FRAP activity
The absorbance of free taxifolin and the complex of different concentrations have been estimated at 593 nm wavelength in presence of Fe3+-TPTZ. The complex exhibited enhanced antioxidant capacity than free taxifolin which has been depicted in the (Fig. 5C).
3.4 In vitro study
3.4.1 Induction of cytotoxicity through taxifolin ruthenium-p-cymene complex treatment
Taxifolin ruthenium-p-cymene complex inhibits the cell viability of A549 and NCI-H460 lung cancer cell lines in a dose dependent manner (Fig. 6A, B). The cell viability of A549 was found to be 91.28%, 72.35%, 49.82%, 32.98%, 13.52% and for NCI-H460 the cell viability was 76.25%, 51.64%, 34.75%, 20.88%, 12.10% at the concentrations of 43.6, 87.3, 174.5, 349, 698.1 µM respectively. From the above experiment the IC50 value of the complex was calculated as 187.19 µM and 108.62 µM for A549 and NCI-H460 cell lines respectively. For chemotherapeutic study, the working concentrations of the complex were determined as IC25, IC50 and IC75. The IC25, IC50 and IC75 values for A549 was 93.6 µM, 187.19 µM, 280.78 µM and for NCI-H460 cell lines the values were 54.31 µM, 108.62 µM, 162.93 µM respectively.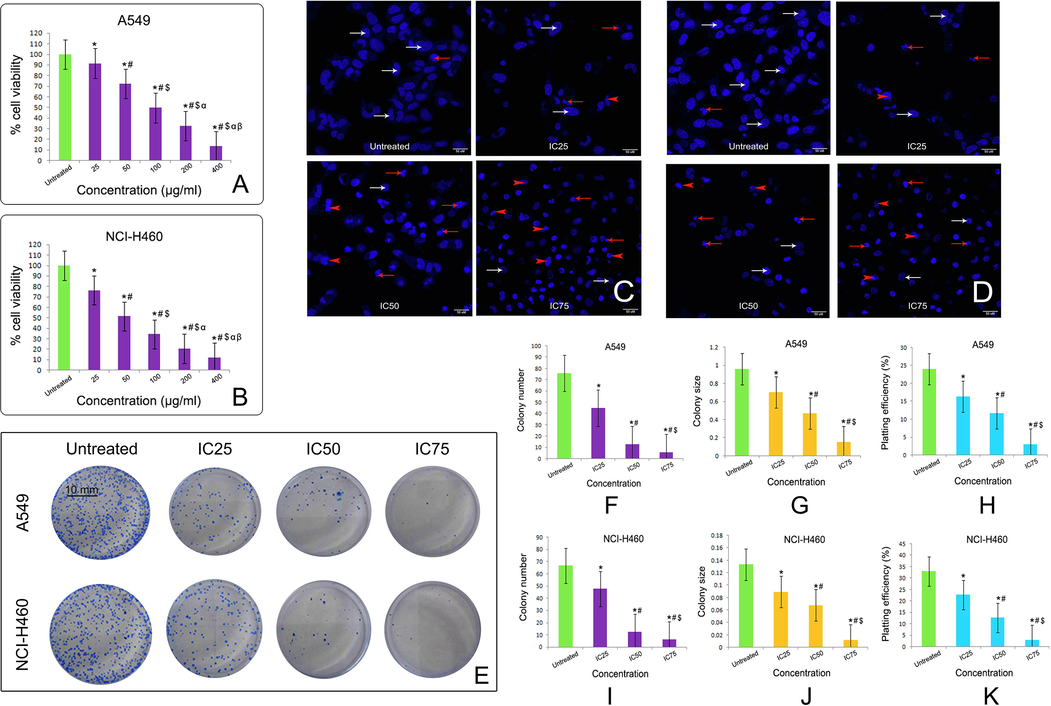
Effect of taxifolin ruthenium-p-cymene complex on the cell viability of (A) A549 cells and (B) NCI-H460 cells at 48 h of incubation. * represented p < 0.05 as compared to untreated cells. Similarly, # represented p < 0.05 as compared to 25 µg/ml concentration, $ represented p < 0.05 as compared to 50 µg/ml concentration, α represented p < 0.05 as compared to 100 µg/ml concentration and β represented p < 0.05 as compared to 200 µg/ml concentration. DAPI staining of (C) A549 cells and (D) NCI-H460 cells after 48 h of taxifolin ruthenium-p-cymene complex treatment denoting viable cells (white arrows), nuclear fragmentations (red arrows) and membrane blebbing (red arrowheads). (E) Clonogenic assay of A549 and NCI-H460 cells after 48 h of treatment with taxifolin ruthenium-p-cymene complex. Quantification of (F) colony number, (G) colony size, and (H) plating efficiency for A549 cells. Quantification of (I) colony number, (J) colony size, and (K) plating efficiency for NCI-H460 cells. * represented p < 0.05 as compared to untreated cells. Similarly, # represented p < 0.05 as compared to IC25, $ represented p < 0.05 as compared to IC50. Quantification of colony number and size was performed using Image J public domain software. Data represented as means ± SEM from different experiments in triplicate. The results were compared using ANOVA, followed by a Tukey’s multiple comparison post-hoc analysis.
3.4.2 Taxifolin ruthenium-p-cymene complex caused nuclear fragmentation
Taxifolin ruthenium-p-cymene complex induced nuclear fragmentation and membrane blebbing in A549 and NCI-H460 cell line (Fig. 6C, D). The maximum nuclear condensation was observed at the concentration of 280.78 µM and 162.93 µM in A549 and NCI-H460 cell line respectively.
3.4.3 Taxifolin ruthenium-p-cymene complex inhibited cellular proliferation
The treatment with the complex significantly inhibited the colony formation in both A549 and NCI-H460 cell lines (Fig. 6E). The cells treated with the complex exhibited the inhibition of colony number (Fig. 6F, I), colony size (Fig. 6G, J) and plating efficiency (PE) (Fig. 6H, K) as compared to the untreated cells in both the cell lines respectively. In comparison to the untreated cells the complex treated cells displayed lowest PE at the concentrations of 280.78 µM and 162.93 µM in A549 and NCI-H460 cell lines respectively.
3.4.4 Taxifolin ruthenium-p-cymene complex inhibited EMT
Taxifolin ruthenium-p-cymene complex treatment inhibited the invasive cells in both A549 and NCI-H460 cell lines (Fig. 7A, B) in a dose dependent manner. The western blot analysis (Fig. 7C) further confirmed the inhibition of EMT through the downregulation and upregulation of N-cadherin and E-cadherin expression respectively in both the cell lines.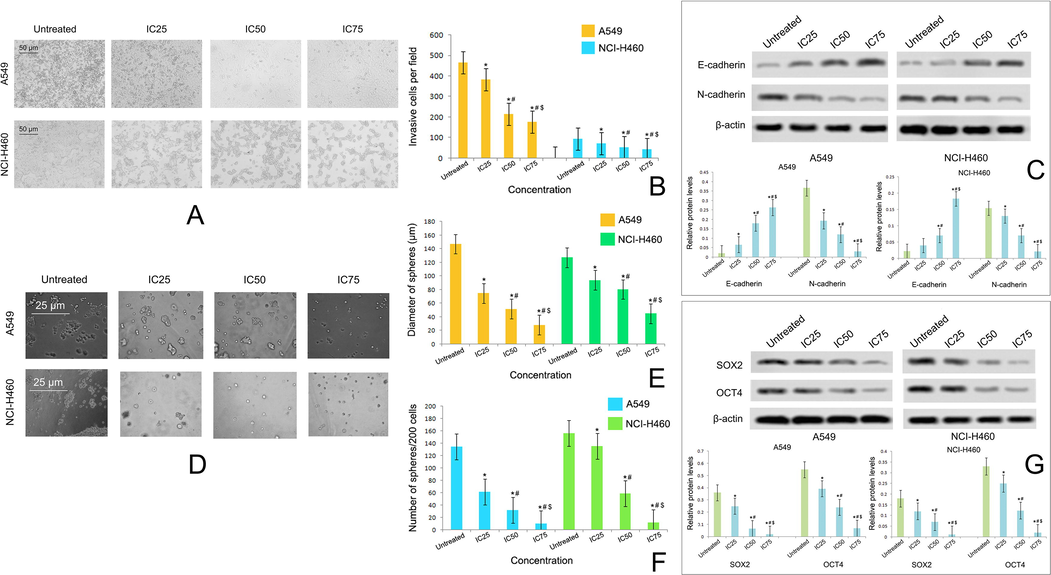
(A) Effect of taxifolin ruthenium-p-cymene complex on the invasion of A549 and NCI-H460 cells at 48 h of incubation (B) Estimation of invasive cells per field (C) Western blot analysis of E-cadherin and N-cadherin on A549 and NCI-H460 cells (D) Effect of taxifolin ruthenium-p-cymene complex on the sphere formation of A549 and NCI-H460 cells at 10 days of incubation (E) Estimation of sphere diameter and (F) Number of spheres per 200 cells (G) Western blot analysis of SOX2 and OCT4 on A549 and NCI-H460 cells. * represented p < 0.05 as compared to untreated cells. Similarly, # represented p < 0.05 as compared to IC25, $ represented p < 0.05 as compared to IC50. Data represented as means ± SEM from different experiments in triplicate. The results were compared using ANOVA, followed by a Tukey’s multiple comparison post-hoc analysis.
3.4.5 Taxifolin ruthenium-p-cymene complex inhibited stemness
Taxifolin ruthenium-p-cymene complex treated cells exhibited dose dependent inhibition of sphere formation (Fig. 7D) in respect to both the diameters of spheres (Fig. 7E) and number of spheres per 200 cells (Fig. 7F) in both the cell lines. In addition, the expressions of stem cell markers such as SOX2 and OCT4 were also investigated in both the cell lines through western blotting (Fig. 7G). The western blot analysis depicted marked downregulation in the expression of SOX2 and OCT4 followed by the complex treatment in both the cell lines.
3.4.6 Taxifolin ruthenium-p-cymene complex induce apoptosis and cell cycle arrest
The induction of apoptosis in A549 and NCI-H460 cell line due to the treatment with the complex for 48 h has been demonstrated in Fig. 8A and Fig. 9A respectively. The total percentage of apoptotic cells in A549 cells was found to be 90.87%, 92.42%, 97.07% and for NCI-H460 cells it was 33.28%, 42.87%, 82.62% at the concentration of IC25, IC50 and IC75 of the complex respectively (Fig. 8B, 9B). The percentage of early apoptosis and late apoptosis was increased dose dependently in both the cell lines followed by the treatment with complex for 48 h (Fig. 8C, D and Fig. 9C, D). A significant decrease in the percentage of live cells was noted in the complex treated cells (Fig. 8E, 9E). The percentage of dead cells was also evaluated in the complex treated cells. The IC50 of the complex exhibited maximum percentage of dead cells in both the cell lines (Fig. 8F, Fig. 9F).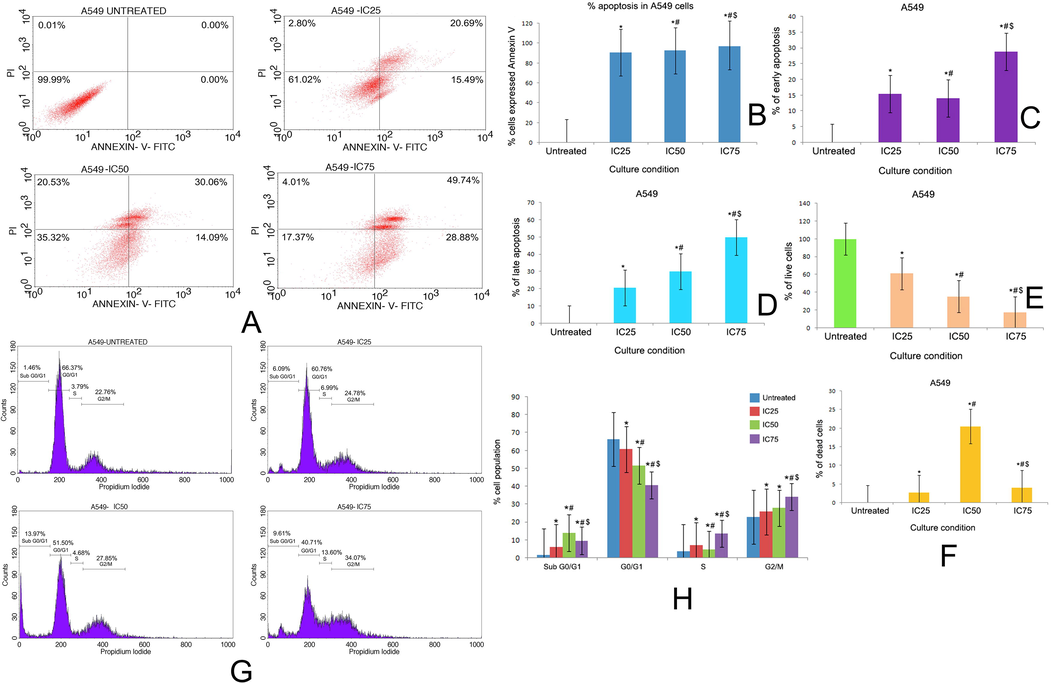
(A) Quadrangular plots representing the Annexin V/PI expression in A549 cells upon culturing in the presence and absence of taxifolin ruthenium-p-cymene complex with IC25, IC50 and IC75 concentrations. Percentage of (B) apoptosis, (C) early apoptosis, (D) late apoptosis, (E) live cells, and (F) dead cells in A549 cells at different culture conditions. (G) Distribution of cell cycle phases in A549 cells upon culturing in the presence and absence of taxifolin ruthenium-p-cymene complex with IC25, IC50 and IC75 concentrations (H) Quantitative analysis of cell cycle phase distribution in A549 cells. * represented p < 0.05 as compared to untreated cells. Similarly, # represented p < 0.05 as compared to IC25, $ represented p < 0.05 as compared to IC50. Data represented as means ± SEM from different experiments in triplicate. The results were compared using ANOVA, followed by a Tukey’s multiple comparison post-hoc analysis.
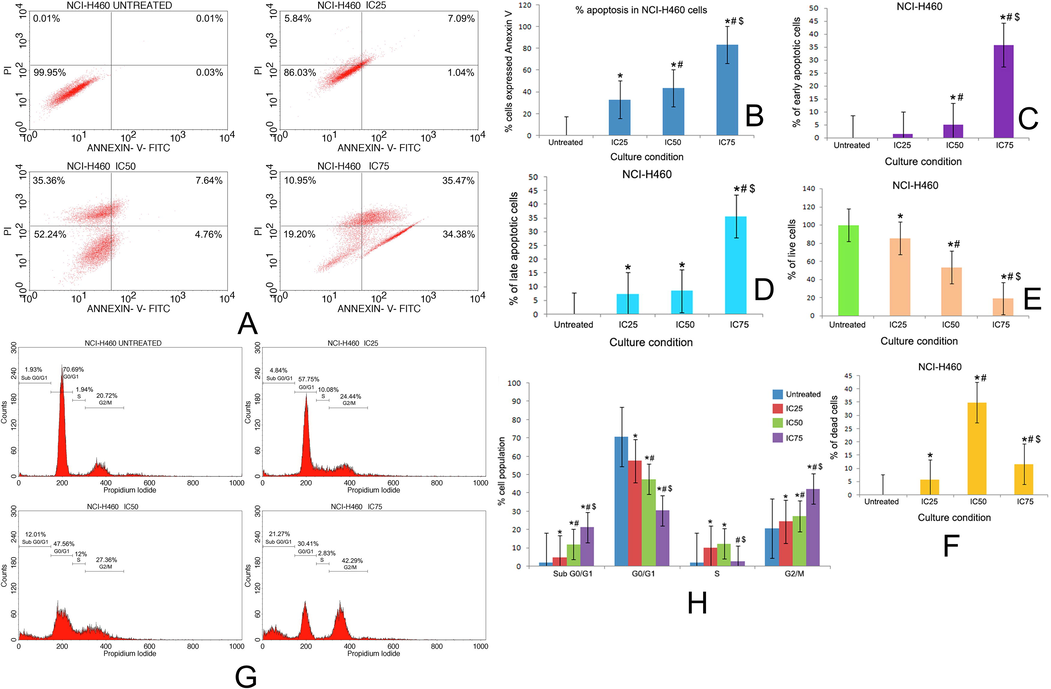
(A) Quadrangular plots representing the Annexin V/PI expression in NCI-H460 cells upon culturing in the presence and absence of taxifolin ruthenium-p-cymene complex with IC25, IC50 and IC75 concentrations. Percentage of (B) apoptosis, (C) early apoptosis, (D) late apoptosis, (E) live cells, and (F) dead cells in NCI-H460 cells at different culture conditions. (G) Distribution of cell cycle phases in NCI-H460 cells upon culturing in the presence and absence of taxifolin ruthenium-p-cymene complex with IC25, IC50 and IC75 concentrations (H) Quantitative analysis of cell cycle phase distribution in NCI-H460 cells. * represented p < 0.05 as compared to untreated cells. Similarly, # represented p < 0.05 as compared to IC25, $ represented p < 0.05 as compared to IC50. Data represented as means ± SEM from different experiments in triplicate. The results were compared using ANOVA, followed by a Tukey’s multiple comparison post-hoc analysis.
The distribution of cell cycle phases on untreated cells and complex treated cells in both the cell lines have been depicted in Fig. 8G, H and Fig. 9G, H. In A549 cell line, the cell cycle analysis subjected to sub G0/G1 phase (apoptotic phase) demonstrated that 1.46%, 6.09%, 13.97% and 9.61% of cell got arrested in untreated, IC25, IC50 and IC75 group respectively. Similarly, in G0/G1 phase (growth Phase), 66.37%, 60.76%, 51.5% and 40.71% of cells, in S phase (synthetic phase), 3.79%, 6.99%, 4.68% and 13.6% of cells, in G2/M phase, 22.76%, 24.78%, 27.85% and 34.07% of cells got arrested in untreated, IC25, IC50 and IC75 group respectively (Fig. 8G, H). In NCI-H460 cell line, the cell cycle analysis subjected to sub G0/G1 phase (apoptotic phase) demonstrated that 1.93%, 4.84%, 12.01% and 21.27% of cells got arrested in untreated, IC25, IC50 and IC75 group respectively. Similarly, in G0/G1 phase (growth Phase), 70.69%, 57.55%, 47.56% and 30.41% of cells, in S phase (synthetic phase), 1.94%, 10.08%, 12% and 2.83% of cells, in G2/M phase, 20.72%, 24.44%, 27.36% and 42.29% of cells got arrested in untreated, IC25, IC50 and IC75 group respectively (Fig. 9G, H).
3.4.7 Taxifolin ruthenium–p-cymene complex increased caspase-3 expression
The expression of caspase-3 in A549 and NCI-H460 cell line followed by the treatment with various concentration of taxifolin ruthenium-p-cymene complex for 48 h has been demonstrated in Fig. 10A, B respectively. The untreated group exhibited highest number of caspase-3 labeled cells in M1 quadrant. Whereas, the number of caspase-3 labeled cells in M2 quadrant was significantly increased followed by the drug treatment in both the cell lines.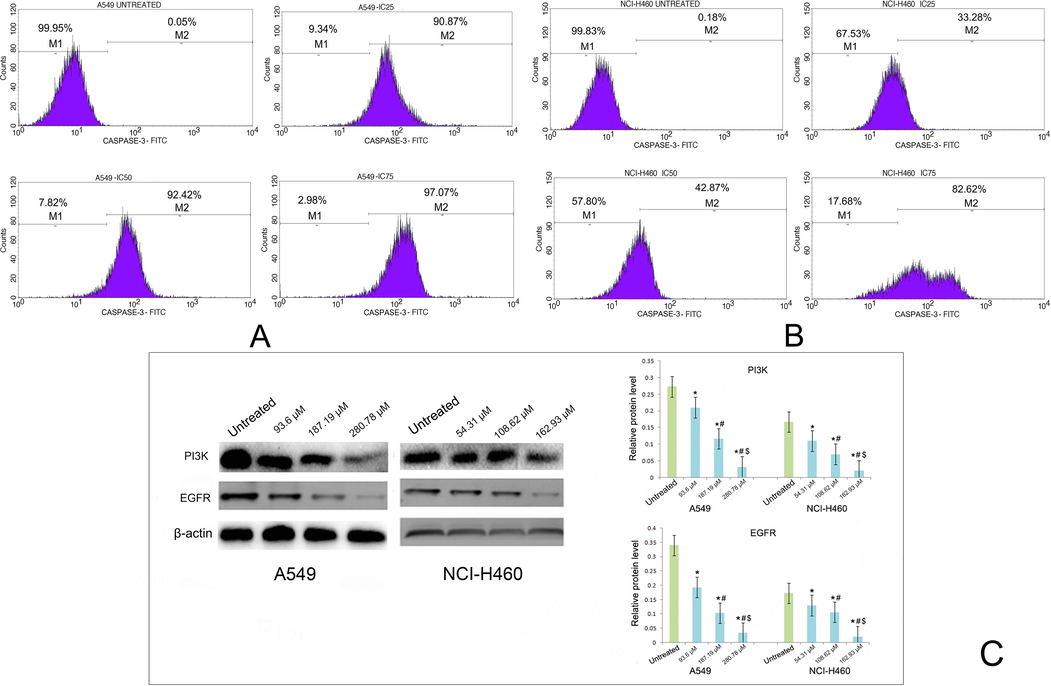
Effect of taxifolin ruthenium-p-cymene complex on the expression of caspase-3 in (A) A549 cells and (B) NCI-H460 cells. (C) Western blot analysis of PI3K and EGFR on A549 and NCI-H460 cells. * represented p < 0.05 as compared to untreated cells. Similarly, # represented p < 0.05 as compared to IC25, $ represented p < 0.05 as compared to IC50. Data represented as means ± SEM from different experiments in triplicate. The results were compared using ANOVA, followed by a Tukey’s multiple comparison post-hoc analysis.
3.4.8 Effect of taxifolin ruthenium-p-cymene complex on the expression of PI3K, EGFR
The western blot analysis demonstrated that the treatment with the complex significantly inhibited the expression of PI3K and EGFR in the both A549 and NCI-H460 cell line as compared to the untreated cells (Fig. 10C).
3.5 In vivo carcinogenic study
3.5.1 Taxifolin ruthenium-p-cymene rehabilitates carcinogenicity and reduces tumor burden
The histopathological alterations of lung at the end of chemotherapeutic study have been depicted in Fig. 11. The normal control group (Fig. 11A) exhibited the normal morphological architecture of lungs which includes bronchiole (b), pulmonary alveoli (pa), alveolar sac (as), blood vessels (bv), pulmonary capillary (pc), columnar epithelium (ce), smooth muscle (sm). The carcinogen control group (Fig. 11B) showed thickened alveolar walls (t), congested alveolar cavity (cac), nodular lymphocytic collection (nlc), lymphocyte infiltration (li) in alveolar space, severe fibrosis (f) and formation of granuloma (g). On the other hand, taxifolin ruthenium-p-cymene treated group (Fig. 11C-E) restored the normal cellular architecture of the lung tissue. Though slight lymphocyte infiltration (li) and minor thickening of alveolar walls (t) were observed in 100 mg/kg group (Fig. 11D). The 200 mg/kg group (Fig. 11E) did not show any alterations in the B(α)P induced lung and successfully restored the morphological features of healthy lung. Whereas, 50 mg/kg taxifolin treated group (Fig. 11F) showed lymphocyte infiltration (li) in alveolar space, thickened alveolar walls (t) and congested alveolar cavity (cac). 50 mg/kg ruthenium-p-cymene treated group (Fig. 11G) demonstrated thickened alveolar walls (t), congested alveolar cavity (cac), nodular lymphocytic collection (nlc) and lymphocyte infiltration (li) in alveolar space. In addition, 200 mg/kg taxifolin ruthenium-p-cymene treatment significantly (p < 0.05) reduces the tumor volume and tumor weight as compared to the carcinogen control group (Fig. 11H, I).![Histopathological appearance of lung at 10X [inset 40X]. (A) Normal control group showed bronchiole (b), pulmonary alveoli (pa), alveolar sac (as), blood vessels (bv), pulmonary capillary (pc), columnar epithelium (ce), smooth muscle (sm). (B) Carcinogen control group depicted thickened alveolar walls (t), congested alveolar cavity (cac), nodular lymphocytic collection (nlc), lymphocyte infiltration (li) in alveolar space, severe fibrosis (f) and formation of granuloma (g). (C) 50 mg/kg taxifolin ruthenium-p-cymene complex treated group showed thickened alveolar walls (t), nodular lymphocytic collection (nlc) and lymphocyte infiltration (li) in alveolar space. (D) 100 mg/kg taxifolin ruthenium-p-cymene complex treated group showed thickened alveolar walls (t) and lymphocyte infiltration (li) in alveolar space. (E) 200 mg/kg taxifolin ruthenium-p-cymene complex treated group restored normal morphological architecture of carcinogen induced lung tissue. (F) 50 mg/kg taxifolin treated group depicted thickened alveolar walls (t), congested alveolar cavity (cac) and lymphocyte infiltration (li) in alveolar space. (G) 50 mg/kg ruthenium-p-cymene treated group depicted thickened alveolar walls (t), congested alveolar cavity (cac), nodular lymphocytic collection (nlc) and lymphocyte infiltration (li) in alveolar space. Effect of taxifolin ruthenium-p-cymene complex on the (H) tumor volume (mm3) and (I) tumor weight (g).](/content/184/2023/16/8/img/10.1016_j.arabjc.2023.104995-fig11.png)
Histopathological appearance of lung at 10X [inset 40X]. (A) Normal control group showed bronchiole (b), pulmonary alveoli (pa), alveolar sac (as), blood vessels (bv), pulmonary capillary (pc), columnar epithelium (ce), smooth muscle (sm). (B) Carcinogen control group depicted thickened alveolar walls (t), congested alveolar cavity (cac), nodular lymphocytic collection (nlc), lymphocyte infiltration (li) in alveolar space, severe fibrosis (f) and formation of granuloma (g). (C) 50 mg/kg taxifolin ruthenium-p-cymene complex treated group showed thickened alveolar walls (t), nodular lymphocytic collection (nlc) and lymphocyte infiltration (li) in alveolar space. (D) 100 mg/kg taxifolin ruthenium-p-cymene complex treated group showed thickened alveolar walls (t) and lymphocyte infiltration (li) in alveolar space. (E) 200 mg/kg taxifolin ruthenium-p-cymene complex treated group restored normal morphological architecture of carcinogen induced lung tissue. (F) 50 mg/kg taxifolin treated group depicted thickened alveolar walls (t), congested alveolar cavity (cac) and lymphocyte infiltration (li) in alveolar space. (G) 50 mg/kg ruthenium-p-cymene treated group depicted thickened alveolar walls (t), congested alveolar cavity (cac), nodular lymphocytic collection (nlc) and lymphocyte infiltration (li) in alveolar space. Effect of taxifolin ruthenium-p-cymene complex on the (H) tumor volume (mm3) and (I) tumor weight (g).
3.5.2 Effect of taxifolin ruthenium-p-cymene complex on the expression of p53, caspase-3, Akt, mTOR and β-catenin
Fig. 12 and Table 7 depicted the expression profiling of p53, caspase-3, Akt, mTOR and β-catenin on the cancerous lung tissue of mice. A significantly low expression of p53 and caspase-3 was noted in the carcinogen control group (Fig. 12(i)B, (ii)B) in comparison to the normal control (Fig. 12(i)A, (ii)A) (p < 0.05). Whereas, a dose dependent increase in the expression of p53 and caspase-3 was exhibited in the complex treated group (Fig. 12(i) C-E, (ii) C-E). The 200 mg/kg group (Fig. 12(i)E, (ii)E) showed significant expression of p53 and caspase-3 on the alveolar wall and bronchiolar epithelial region. A moderate expression of p53 and caspase-3 was noted in 50 mg/kg taxifolin (Fig. 12(i)F, (ii)F) and 50 mg/kg ruthenium-p-cymene treated group (Fig. 12(i)G, (ii)G). Carcinogen control group exhibited significant upregulation of Akt (Fig. 12(iii)B), mTOR (Fig. 12(iv)B) and β-catenin (Fig. 12(v)B) expression on the alveolar wall, bronchiolar epithelial region with bronchiolar and vascular cytoplasmic localization in comparison to normal control (Fig. 12(iii)A-(v)A) (p < 0.05). The complex (50, 100, 200 mg/kg) treatment significantly (p < 0.05) downregulates the Akt (Fig. 12(iii)C-E), mTOR (Fig. 12(iv)C-E) and β-catenin (Fig. 12(v)C-E) expression. A significant expression of Akt, mTOR and β-catenin was also observed for 50 mg/kg taxifolin (Fig. 12(iii)F-(v)F) and 50 mg/kg ruthenium-p-cymene treated group (Fig. 12(iii)G-(v)G).![The immunohistochemical analysis of [i] p53 [ii] caspase-3, [iii] Akt, [iv] mTOR, and [v] β-catenin expression in the lung tissues at 10X magnification of (A) normal control, (B) carcinogen control, (C) 50 mg/kg complex, (D) 100 mg/kg complex, (E) 200 mg/kg complex, (F) 50 mg/kg taxifolin, and (G) 50 mg/kg ruthenium-p-cymene treated group, represented by black arrows.](/content/184/2023/16/8/img/10.1016_j.arabjc.2023.104995-fig12.png)
The immunohistochemical analysis of [i] p53 [ii] caspase-3, [iii] Akt, [iv] mTOR, and [v] β-catenin expression in the lung tissues at 10X magnification of (A) normal control, (B) carcinogen control, (C) 50 mg/kg complex, (D) 100 mg/kg complex, (E) 200 mg/kg complex, (F) 50 mg/kg taxifolin, and (G) 50 mg/kg ruthenium-p-cymene treated group, represented by black arrows.
Groups
p53§
Caspase-3§
Akt§
mTOR§
β-catenin§
Normal control
8.25 ± 0.1
5 ± 0.5
8.83 ± 0.1
7.35 ± 0.2
4.68 ± 0.1
Carcinogen control
3.82 ± 0.6*
2.17 ± 0.1*
22.22 ± 0.1*
25.97 ± 0.1*
22.98 ± 0.1*
50 mg/kg complex
4.07 ± 0.1*
9.85 ± 0.1*#
14.98 ± 0.1*#
14 ± 0.1*#
18.85 ± 0.1*#
100 mg/kg complex
6.1 ± 0.1*#$
9.95 ± 0.1*#
12.87 ± 0.1*#$
12.2 ± 0.1*#$
12 ± 0.1*#$
200 mg/kg complex
7.87 ± 0.1#$α
13.75 ± 0.1*#$α
8.23 ± 0.2*#$α
8.03 ± 0.1*#$α
8.87 ± 0.1*#$α
50 mg/kg taxifolin
3.92 ± 0.1*αβ
4.17 ± 0.1*#$αβ
17 ± 0.1*#$αβ
20.1 ± 0.1*#$αβ
20.01 ± 0.1*#$αβ
50 mg/kg ruthenium-p-cymene
3.18 ± 0.1*αβ
2.98 ± 0.1*#$αβγ
19.13 ± 0.1*#$αβγ
23.15 ± 0.1*#$αβγ
21.05 ± 0.1*#$αβγ
3.5.3 Taxifolin ruthenium-p-cymene complex downregulates Ki-67 level
The cells with Ki-67 labeling showcased a discrete nuclear localization and brown stain which were used for the cellular quantification. The %Ki-67 labeled cells was measured by the labeling index (LI) (Table 8). The carcinogen control group (Fig. 13(i)B) showed highest expression of Ki-67 as compared to the normal control group (p < 0.05) (Fig. 13(i)A). The expression of Ki-67 was significantly downregulated in complex treated group (Fig. 13(i)C-E). Moreover, a significantly high cellular proliferation was also noted in the 50 mg/kg taxifolin (Fig. 13(i)F) and 50 mg/kg ruthenium-p-cymene (Fig. 13(i)G) treated group (p < 0.05). LI = Labelling index, Ki-67-LI = percentage of Ki-67 labelled cells/total number of cells counted, AI = Apoptotic index. R = Ki-67-LI/AI. AI was calculated as the percentage of TUNEL positive cells/total number of cells counted. Values represent mean ± S.E. (n = 6).
Groups
Ki-67-LI§
AI (%)§
R = Ki-67-LI/AI
Normal control
15.5 ± 0.1
0.11 ± 0.01
148 ± 11.23
Carcinogen control
36.88 ± 0.1*
0.03 ± 0.01*
1689 ± 445.59*
50 mg/kg complex
23.88 ± 0.1*#
0.06 ± 0.005*
439 ± 41.75#
100 mg/kg complex
15 ± 0.4#$
0.09 ± 0.01#$
170 ± 10.95#
200 mg/kg complex
6.96 ± 0.1*#$α
0.12 ± 0.004#$α
56 ± 1.36#
50 mg/kg taxifolin
29.06 ± 0.1*#$αβ
0.04 ± 0.01*αβ
1142 ± 375.34*αβ
50 mg/kg ruthenium-p-cymene
33 ± 0.1*#$αβγ
0.03 ± 0.01*αβ
1481 ± 405.58*αβ
![The immunohistochemical analysis of [i] Ki-67 expression and [ii] TUNEL-positive apoptotic cells in the lung tissue at 40X magnification of (A) normal control, (B) carcinogen control, (C) 50 mg/kg complex, (D) 100 mg/kg complex, (E) 200 mg/kg complex, (F) 50 mg/kg taxifolin, and (G) 50 mg/kg ruthenium-p-cymene treated group, represented by black arrows. Approximately 700 cells were counted per field, 10 fields were examined per slide.](/content/184/2023/16/8/img/10.1016_j.arabjc.2023.104995-fig13.png)
The immunohistochemical analysis of [i] Ki-67 expression and [ii] TUNEL-positive apoptotic cells in the lung tissue at 40X magnification of (A) normal control, (B) carcinogen control, (C) 50 mg/kg complex, (D) 100 mg/kg complex, (E) 200 mg/kg complex, (F) 50 mg/kg taxifolin, and (G) 50 mg/kg ruthenium-p-cymene treated group, represented by black arrows. Approximately 700 cells were counted per field, 10 fields were examined per slide.
3.5.4 Taxifolin ruthenium-p-cymene complex induces apoptosis
The apoptosis assay was conducted to evaluate the incidences of apoptosis in the lung cancer. The apoptotic cells were identified by their brown staining due to chromogen treatment (Fig. 13(ii)). The normal control group (Fig. 13(ii)A) denoted a moderate expression of TUNEL-positive cells. Whereas, significantly (p < 0.05) low number of apoptotic cells were noted in the carcinogen control (Fig. 13(ii)B) in comparison to normal control. A significantly (p < 0.05) high number of apoptotic cells were noted in the complex treated group (Fig. 13(ii)C-E) as compared to carcinogen control. The 50 mg/kg taxifolin (Fig. 13(ii)F) and 50 mg/kg ruthenium-p-cymene (Fig. 13(ii)G) treated group showed very few apoptotic cells. An average of 4–5 apoptotic cells in the field of 700 cells were identified in carcinogen control. On the other hand, 11–12 TUNEL-positive cells were quantified in 200 mg/kg complex treated group (Table 8).
The R value is expressed as the ratio of cell proliferation to apoptosis. In the carcinogen control group, the increased R value designated the enhanced proliferative activity of the cancer cells but treatment the complex significantly decreased R value due to induction of apoptosis and inhibition of cell proliferation.
4 Discussion
In the recent years, lung cancer has been identified as the most prevalent cancer which in turn mandates the discovery of novel therapeutic strategies to combat cancer related mortality. In this instance, the heterogenic nature of lung cancer stem cells abrogates the inhibitory effect of the traditional chemotherapeutic agents (Lin, 2019). Thus, in the upcoming years the strategic designing of multi-targeted anticancer compounds is the crucial aspect of cancer therapy to overcome the cancer stem cell mediated survival approach of cancer cells.
The present research work was focused on synthesizing novel flavonoid based organometallic complex and the evaluation of its chemotherapeutic activity in lung cancer. A number of proteins are involved in the initiation and propagation of lung cancer. The molecular docking study was carried out to identify the specific target proteins for the novel organometallic complex through which the complex supposed to alter the lung cancer incidences in lung cancer cell line as well as in lung cancer bearing animal model system. According to the molecular docking study the complex exhibits a potent binding affinity for the target proteins such as PI3K, EGFR, and β-catenin that promote the effective binding of the complex to the target proteins. Additionally, it would also endorse respective downstream signaling cascade by acting as an agonist or antagonist to inhibit the lung cancer.
In connection with this, the ruthenium-p-cymene based organometallic complex was synthesized and characterized by various spectroscopical techniques to confirm the formation of taxifolin ruthenium-p-cymene complex. The UV–visible spectroscopical analysis showed the maximum shifting at the band I position of taxifolin due to the formation of the metal complex through n - π* transition. This confirms the metal complex formation through the cinnamoyl moiety of taxifolin. The interaction between taxifolin and ruthenium-p-cymene dimer molecule was investigated by Job’s method and it was found that 1 mol of taxifolin reacts with 2 mol of ruthenium-p-cymene (dimer of ruthenium-p-cymene) and gives maximum yield for the desired complex. The IR spectroscopy of the complex showed the appearance of the peak for ruthenium-oxide bond at 628.6 cm−1 which was absent in the FTIR spectrum of taxifolin which suggested the formation of (Ru-O) bond through O-carbonyl group at 4 position and 3-OH group of taxifolin. The mass spectroscopy analysis illustrated the molecular ion peak of the complex at m/z 573.01 which was confirmed from the theoretical monoisotopic mass value of the complex that is 573.98. The 1H NMR spectroscopy depicted the absence of 3-OH group proton peak which further confirms that complexation has occurred through the 3-OH hydroxyl group of taxifolin. The appearance of sharp peaks in the X-ray Diffractogram strongly suggested the crystalline nature of the complex. Moreover, it also demonstrated the polycrystalline phase of taxifolin ruthenium-p-cymene complex. The scanning electron microscopic pictures at 50X, 4000X, 6000X and 10000X confirms the orthorhombic crystal structure of the complex with sharp edges and symmetrical structures.
Antioxidant property of various flavonoids is considerably linked to their molecular structure. In our present study the taxifolin ruthenium-p-cymene complex showed slightly less antioxidant potential than the free taxifolin in DPPH but displayed more antioxidant potential for FRAP and ABTS radical scavenging activity. This increased antioxidant activity of the complex can be attributed to the presence of hydroxyl groups and their hydrogen atom donating capability which is facilitated through the chelation of ruthenium metal to the taxifolin moiety. Moreover, the complexation enhances the proton donating ability of the complex which leads to the end of the chain reaction and increases the electron transfer from taxifolin which corresponds to the redox potential of the complex.
The chemotherapeutic activity of taxifolin ruthenium-p-cymene complex was investigated in A549 and NCI-H460 lung cancer cell line from the perspective of stemness and EMT regulation. The cell viability assay demonstrated that, the complex inhibited the viability of A549 and NCI-H460 cells dose dependently. The IC50 value calculated from cell viability assay was found to be 187.19 µM and 108.62 µM for A549 and NCI-H460 cell lines respectively. Subsequently, the chemotherapeutic doses (IC25, IC50 and IC75) of the complex were determined. The induction of cellular death was visualized by the DAPI analysis which demonstrated maximum nuclear condensation at IC75 of the complex in A549 and NCI-H460 cell line respectively. Additionally, the colony formation ability of the cancer cells was significantly inhibited due to the treatment with taxifolin ruthenium-p-cymene complex.
Stemness plays the pivotal role in the initiation, metastasis, and therapy resistance of NSCLC through the regulation of several intracellular pathways which include Wnt/β-catenin, PI3K/Akt/mTOR pathway (Lin, 2019). In this research, the treatment with taxifolin ruthenium-p-cymene complex dose dependently downregulated the incidence of stemness in both cell lines. The complex treated cells significantly inhibited the sphere formation and downregulated the expression of stem cell markers such as SOX2 and OCT4 in both the cell line. In addition, the results further portray the complex mediated inhibition of PI3K/Akt signaling that might be responsible for the inhibition of stemness in the cancer cells.
It has been observed that, the EMT is the most primary event which takes place before the onset of cancer metastasis (Yeung and Yang, 2017). Recent studies reported that, the cancer stem cells are responsible for the cancer metastasis through the modulation of Wnt/β-catenin, PI3K/Akt/mTOR pathway (Lin, 2019). Therefore, the inhibition of stemness due to taxifolin ruthenium-p-cymene therapy could reduce the metastasis via preventing EMT in lung cancer cell lines. Moreover, the EMT has also been found to be regulated by various growth factors such as EGFR. In this study, the inhibition of EMT in the cancer cell was investigated through the transwell migration assay. The result demonstrated that, taxifolin ruthenium-p-cymene treatment dose dependently inhibited the invasive cells in both A549 and NCI-H460 cell lines. Furthermore, the downregulation of N-cadherin and upregulation of E-cadherin expression was noted which suggested the inhibition of EMT in both the cell lines. The expression of EGFR was also found to be downregulated which signified reduction of EMT mediated metastasis through the inhibition of EMT regulating signaling cascade and stemness of the cancer cells.
In addition, the flow cytometric analysis demonstrated the induction of apoptosis in A549 and NCI-H460 cell line upon the treatment with the novel complex. A large number of cells at apoptotic stage were identified in the complex treated group, where the treatment with IC75 showed maximum apoptosis in A549 (97.07%) and NCI-H460 (82.62%) cells. Moreover, a significant percentage of early apoptosis, late apoptosis and dead cells were noted in the complex treated group in both the cell line. Whereas, a dose dependent decrease in the percentage of live cells was observed in the complex treated cells.
The loss of cell cycle regulation followed by uncontrolled cellular growth is one of the important aspects of cancer cells (Jin and El-Deiry, 2005). Thus, the cell cycle regulation via induction of cell cycle arrest is a major chemotherapeutic strategy which allows the accumulation of DNA damage and promotes apoptosis in cancer cells. The activation of apoptotic events in the cancer cells was also determined via the investigation of caspase-3 expression. The flow cytometric analysis demonstrated an increased level of caspase-3 labelled cells in the complex treated group which signified the caspase-3 mediated apoptosis induction in the cancer cells. The effect of the complex on cell cycle phase distribution was also investigated in A549 and NCI-H460 cells through flow cytometry. The result from the cell cycle analysis designated that, the treatment with the complex caused cellular arrest in sub G0/G1 phase (apoptotic phase), S phase (synthetic phase) and G2/M phase of cell cycle and ultimately stimulated the apoptotic events in lung cancer cells.
The in vivo chemotherapeutic study was carried out on B(α)P induced lung cancer model of Balb/c mice. The histopathology of lung showed severe pulmonary fibrosis and granuloma formation in the carcinogen control group. In addition, congestion in alveolar cavity and severe lymphocytic infiltration in the alveolar space was identified in the carcinogen control. However, taxifolin ruthenium-p-cymene complex treatment significantly decreased the pulmonary fibrosis and restored normal cellular architecture of lung tissue. Along with that, the tumor burden was also significantly lowered in the complex treated group. These findings suggested the anticancer efficacy of the complex against B(α)P induced lung carcinoma.
The expression profile of p53, caspase-3, Akt, mTOR, and β-catenin was determined in the lung tissue by immunohistochemical analysis. Several studies have demonstrated that, the mutation in the tumor suppressor protein p53 is directly related to the growth of malignant lesions through the inhibition of tumor suppressive pathway (Rivlin et al., 2011). An increased expression of p53 is responsible for the caspase-3 mediated intrinsic apoptosis in the cancer cells (Zhuo et al., 2015). The suppression of apoptosis can directly facilitate the neoplastic transformation by promoting tumour growth, metastasis, survival, and therapeutic resistance. Recent studies reported that, the PI3K/Akt/mTOR pathway is widely activated in NSCLC (Papadimitrakopoulou, 2012) due to the alteration of various upstream regulators such as EGFR which results in constitutive activation of the intracellular signaling cascade. In this instance, the phosphorylated Akt has been found to be mostly altered in several lung cancer incidences (Tsurutani et al., 2006). Furthermore, the upregulation of PI3K/Akt/mTOR pathway is also associated with the development of drug resistance against EGFR targeted therapy (Gadgeel and Wozniak, 2013). The development of EGFR mutated lung carcinoma is also responsible for the aberrant activation of β-catenin (Nakayama et al., 2014). Recent studies further demonstrated that, the activation of Wnt/β-catenin pathway caused severe metastasis of lung cancer (Nguyen et al., 2009). Thus, pharmacological inhibition of β-catenin is directly associated with the suppression of lung cancer initiation, metastasis, and drug resistance (Nakayama et al., 2014). The immunohistochemical analysis of lung tissue exhibited decreased expression of p53 and caspase-3 in the carcinogen control group with an increased expression of Akt, mTOR, and β-catenin. The treatment with taxifolin ruthenium-p-cymene complex showed significant upregulation of p53 and caspase-3 expression with downregulation of Akt, mTOR, and β-catenin expression in lung which suggest the inhibition of lung cancer through the induction of p53/caspase-3 mediated apoptosis and suppression of Akt/mTOR/β-catenin pathway regulated cell survival strategies.
The Ki-67 has been identified as a potent prognostic marker for the lung cancer which involved in the regulation of cellular proliferation (Martin et al., 2004). In this regard, an increased Ki-67 expression and low apoptotic index were considered as progressive cancer (Baisch, 2002). The cell proliferation assay exhibited an upregulation of Ki-67 expression with increased labelling index in the carcinogen control group. Whereas, the TUNEL assay demonstrated a significantly low number of TUNEL positive apoptotic cells with low apoptotic index in the carcinogen control group. On the other hand, the complex treated group significantly downregulated the expression of Ki-67 and reduced the labelling index with increased level of apoptotic cells in the lung tissue. Thus, the treatments with the complex reduced the cancer cell propagation and promoted apoptosis in the cancer cells. Consistent with this in vivo report, the in vitro study also depicted the induction of cellular death through p53/caspase-3 mediated apoptosis and inhibition of cell proliferation via downregulating the PI3K/EGFR pathway in the A549 and NCI-H460 cancer cells.
5 Conclusion
Taking together, it was concluded that, the taxifolin ruthenium-p-cymene complex displayed significant anticancer efficacy against both A549 and NCI-H460 cell line and B(α)P induced lung cancer model of mice through the induction of p53/caspase-3 mediated intrinsic apoptotic events and cell cycle arrest in sub G0/G1 phase, S phase and G2/M phase. Additionally, the taxifolin ruthenium-p-cymene complex inhibited cancer cell viability, stemness, and EMT in both in vitro and in vivo model systems through the alteration of upstream regulatory pathways such as PI3K/Akt/mTOR/EGFR pathway and expression of stem cell markers including SOX2 and OCT4 that eventually abrogated the EMT mediated metastasis of cancer cells. After careful consideration of in vivo and in vitro experimentation the possible multi-targeted molecular mechanistic pathway of the complex against lung cancer stemness has been illustrated in Fig. 14. These outcomes strongly indicated the prospective effect of taxifolin ruthenium-p-cymene complex against lung cancer and firmly supported the potential use of this novel chemotherapeutic agent in clinical settings.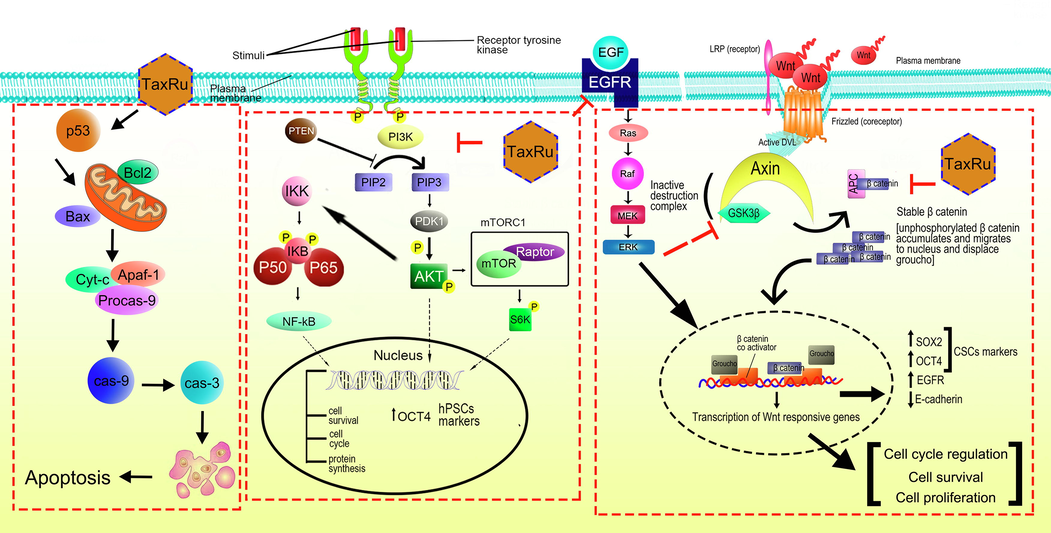
The possible mechanism of action of taxifolin ruthenium-p-cymene complex against lung carcinoma.
Acknowledgements
The authors are grateful to the Department of Pharmacy, NSHM Knowledge Campus- Kolkata for their continuous support and encouragement throughout the study.
Authorship contribution statement
All authors contributed to the study conception and design. Material preparation, data collection, and draft of the manuscript were written by Abhijit Das, Ishita Seal and Sidhanta Sil. The data analysis and supervision were done by Balaram Ghosh and Sandipan Dasgupta. Final review and editing were done by Souvik Roy. All authors read and approved the final manuscript.
Funding
This research did not receive any specific grant from funding agencies in the public, commercial, or not-for-profit sectors.
Declaration of Competing Interest
The authors declare that they have no known competing financial interests or personal relationships that could have appeared to influence the work reported in this paper.
References
- Ruthenium in medicine: current clinical uses and future prospects. Platinum Metals Rev.. 2001;45:62-69.
- [Google Scholar]
- Elevated Ki-67 expression is correlated with TNFalpha- and IFNgamma-induced apoptosis in tumour cells. Cell Prolif.. 2002;35:333-342.
- [CrossRef] [Google Scholar]
- The ferric reducing ability of plasma (FRAP) as a measure of “antioxidant power”: the FRAP assay. Anal. Biochem.. 1996;239:70-76.
- [CrossRef] [Google Scholar]
- Ruthenium(II) arene anticancer complexes with redox-active diamine ligands. Inorg. Chem.. 2009;48:9444-9453.
- [CrossRef] [Google Scholar]
- The role of natural product chemistry in drug discovery. J. Nat. Prod.. 2006;69:172.
- [CrossRef] [Google Scholar]
- Wnt/beta-catenin signaling in development and disease. Cell. 2006;127:469-480.
- [CrossRef] [Google Scholar]
- Flavonoid-modified surfaces: multifunctional bioactive biomaterials with osteopromotive, anti-inflammatory, and anti-fibrotic potential. Adv. Healthc. Mater.. 2015;4:540-549.
- [CrossRef] [Google Scholar]
- Analysis of tumor growth curves. J. Natl. Cancer Inst.. 1968;40:389-405.
- [CrossRef] [Google Scholar]
- Systematic design of a targeted organometallic antitumour drug in pre-clinical development. Chimia. 2017;61:698-1670.
- [Google Scholar]
- Preclinical rationale for PI3K/Akt/mTOR pathway inhibitors as therapy for epidermal growth factor receptor inhibitor-resistant non-small-cell lung cancer. Clin. Lung Cancer. 2013;14:322-332.
- [CrossRef] [Google Scholar]
- Measuring antioxidant potential in corals using the FRAP assay. J. Exp. Mar. Biol. Ecol.. 2004;302:201-211.
- [CrossRef] [Google Scholar]
- Apoptosis and molecular targeting therapy in cancer. Biomed. Res. Int.. 2014;2014:150845
- [CrossRef] [Google Scholar]
- Flavonoid antioxidants: chemistry, metabolism and structure-activity relationships. J. Nutr. Biochem.. 2002;13:572-584.
- [CrossRef] [Google Scholar]
- Targeting nucleus DNA with a cyclometalated dipyridophenazine ruthenium(II) complex. J. Med. Chem.. 2014;57:8971-8983.
- [CrossRef] [Google Scholar]
- New insights for the use of quercetin analogs in cancer treatment. Future Med. Chem.. 2017;9:2011-2028.
- [CrossRef] [Google Scholar]
- Overview of cell death signaling pathways. Cancer Biol. Ther.. 2005;4:139-163.
- [CrossRef] [Google Scholar]
- Phenolic content, reducing power and membrane protective activities of Solanum xanthocarpum root extracts. VEGETOS: Int. J. Plant Res.. 2013;26:301-307.
- [CrossRef] [Google Scholar]
- Challenges of the phase I drug development in non-small cell lung cancer. Chin. Clin. Oncol.. 2019;8:25.
- [CrossRef] [Google Scholar]
- The epithelial-mesenchymal transition generates cells with properties of stem cells. Cell. 2008;133:704-715.
- [CrossRef] [Google Scholar]
- Ki-67 expression and patients survival in lung cancer: systematic review of the literature with meta-analysis. Br. J. Cancer. 2004;91:2018-2025.
- [CrossRef] [Google Scholar]
- Correlating tumor-infiltrating lymphocytes and lung cancer stem cells: a cross-sectional study. Ann. Transl. Med.. 2019;7:619.
- [CrossRef] [Google Scholar]
- The natural compound gracillin exerts potent antitumor activity by targeting mitochondrial complex II. Cell Death Dis.. 2019;10:810.
- [CrossRef] [Google Scholar]
- β-catenin contributes to lung tumor development induced by EGFR mutations. Cancer Res.. 2014;74:5891-5902.
- [CrossRef] [Google Scholar]
- A clinicoepidemiological profile of lung cancers in India - Results from the National Cancer Registry Programme. Indian J. Med. Res.. 2022;155:264-272.
- [CrossRef] [Google Scholar]
- WNT/TCF signaling through LEF1 and HOXB9 mediates lung adenocarcinoma metastasis. Cell. 2009;138:51-62.
- [CrossRef] [Google Scholar]
- Development of PI3K/AKT/mTOR pathway inhibitors and their application in personalized therapy for non-small-cell lung cancer. J. Thorac. Oncol.. 2012;7:1315-1326.
- [CrossRef] [Google Scholar]
- Relationship of Cold Acclimation. Total Phenolic Content and Antioxidant Capacity with Chilling Tolerance in Petunia (Petunia x Hybrid) Environ. Exp. Bot.. 2005;53:225-232.
- [CrossRef] [Google Scholar]
- In vitro antioxidant and free radical scavenging activity of different parts of Tabebuia pallida growing in Bangladesh. BMC Res. Notes. 2015;8:621.
- [CrossRef] [Google Scholar]
- Synthesis and structure of arene ruthenium(II) benzhydrazone complexes: Antiproliferative activity, apoptosis induction and cell cycle analysis. J. Organomet. Chem.. 2018;862:95-100.
- [CrossRef] [Google Scholar]
- Mutations in the p53 tumor suppressor gene: important milestones at the various steps of tumorigenesis. Genes Cancer. 2011;2:466-474.
- [CrossRef] [Google Scholar]
- Down-regulation of beta-catenin by activated p53. Mol. Cell Biol.. 2001;21:6768-6781.
- [CrossRef] [Google Scholar]
- Global Cancer Statistics 2020: GLOBOCAN Estimates of Incidence and Mortality Worldwide for 36 Cancers in 185 Countries. C.A Cancer J. Clin.. 2021;71:209-249.
- [CrossRef] [Google Scholar]
- Evaluation of two phosphorylation sites improves the prognostic significance of Akt activation in non-small-cell lung cancer tumors. J. Clin. Oncol.. 2006;24:306-314.
- [CrossRef] [Google Scholar]
- The anti-tumor effect of taxifolin on lung cancer via suppressing stemness and epithelial-mesenchymal transition in vitro and oncogenesis in nude mice. Ann. Transl. Med.. 2020;8:590.
- [CrossRef] [Google Scholar]
- Requirement for phosphatidylinositol-3 kinase in the prevention of apoptosis by nerve growth factor. Science. 1995;267:2003-2006.
- [CrossRef] [Google Scholar]
- Epithelial-mesenchymal transition in tumor metastasis. Mol. Oncol.. 2017;11:28-39.
- [CrossRef] [Google Scholar]
- Targeting the Wnt/β-catenin signaling pathway in cancer. J. Hematol. Oncol.. 2020;13:165.
- [CrossRef] [Google Scholar]
- Ailanthone Inhibits Huh7 Cancer Cell Growth via Cell Cycle Arrest and Apoptosis In Vitro and In Vivo. Sci. Rep.. 2015;5:16185.
- [CrossRef] [Google Scholar]
Appendix A
Supplementary material
Supplementary data to this article can be found online at https://doi.org/10.1016/j.arabjc.2023.104995.
Appendix A
Supplementary material
The following are the Supplementary data to this article:Supplementary Data 1
Supplementary Data 1


