

Translate this page into:
Integrating fecal metabolomics and gut microbiome to reveal the mechanism of Schisandra chinensis-Acorus tatarinowii Schott treatment in Alzheimer’s disease rats
⁎Corresponding authors. cmubbwei@126.com (Binbin Wei), ronghuafan1@126.com (Ronghua Fan)
-
Received: ,
Accepted: ,
This article was originally published by Elsevier and was migrated to Scientific Scholar after the change of Publisher.
Abstract
Background
Schisandra chinensis (Turcz.) Baill (Schisandraceae) and Acorus tatarinowii Schott (Araceae Juss) (Sc-At) are two traditional Chinese medicinal herbs that are widely used in the treatment of neurological disorders such as insomnia. In our previous study, we found that Sc-At could improve the therapeutic efficacy of Alzheimer’s disease by affecting aromatase activity and estrogen levels, among other pathways.
Material and methods
In this study, first, the ameliorative effect of Sc-At on cognitive dysfunction in Alzheimer’s disease model rats was verified by Y-maze test together with Elisa assay. Second, fecal untargeted metabolomics analysis was performed using a UPLC-Q-TOF/MS-based metabolomics approach. 16S rDNA sequencing was utilized to screen the differential flora between groups, and linear discriminantan alysis effect size (LEfSe) was used to find the target flora. Finally, Spearman correlation analysis was combined to find the relationship between differential flora and differential metabolites in feces.
Results
(1) The results of Y-maze test and Elisa assay indicated that Sc-At could improve the cognitive dysfunction of AD model rats. (2) Metabolomics results showed that fecal metabolite levels were significantly different from those of rats in the blank group, and 18 potential biomarkers in feces were screened, mainly affecting linoleic acid metabolism, steroid hormone biosynthesis, sphingomyelin metabolism, riboflavin metabolism, etc. The 16S rDNA results showed that the abundance and diversity of intestinal flora in AD rats were destroyed, and the Sc-At treatment was able to reverse these changes. (3) Spearman’s correlation analysis showed a significant correlation between differential metabolites in feces and intestinal flora, further suggesting that Sc-At treats Alzheimer’s disease through the gut-brain axis.
Conclusions
In this study, we explored the mechanism of Sc-At in the treatment of Alzheimer’s disease by integrating fecal untargeted metabolomics and 16S rDNA gene sequencing, and the results showed that Sc-At exerts therapeutic effects on Alzheimer’s disease by improving the intestinal flora and related metabolic pathways.
Keywords
Metabolomics
Gut microbiota
Alzheimer’s disease
16SrDNA sequencing
Schisandra chinensis (Turcz.) Baill and Acorus tatarinowii Schott
UPLC-QTOF/MS

- Aβ
-
amyloid β-protein
- AD
-
Alzheimer’s disease
- Sc-At
-
Schisandra Chinensis and Acorus tatarinowii Schott
- PCA
-
principal components analysis
- PLS-DA
-
Partial least squares Discriminant Analysis
- OPLS-DA
-
orthogonal partial least squares discriminant analysis
- VIP
-
Variable Importance for the Projection
- MW
-
molecular weight
- OB
-
oral bioavailability
- DL
-
drug likeness
- GM
-
gut flora
Abbreviations
1 Introduction
Alzheimer's disease (AD) is a cognitive disorder that occurs in the elderly population, and clinically, patients tend to exhibit cognitive impairment, decreased learning ability, impaired memory, and prominent psychiatric and behavioral symptoms, which seriously affects their daily life (Gu et al., 2021). AD has a complex etiology and is difficult to treat effectively with a single drug. Chinese medicines have been used to treat AD patients with multiple etiologies because of their complex compositions, which can exert pharmacological effects on multiple targets through multiple pathways. Studies have shown that the Chinese medicine Sc has anti-inflammatory, antioxidant, and apoptosis-inhibiting effects, and has a significant protective effect against neurodegenerative diseases (Yan et al., 2021). At is classified as a top grade in the Shennong Ben Cao Jing (Classic of the Materia Medica of the Divine Husbandman), and is described as “long-serving, unforgettable, and unruly, and prolonging longevity” (Xu et al., 2020). These two herbs are commonly used in animal modeling studies and in the treatment of neurodegenerative diseases (Zhong et al., 2020).
The gut microbiota (GM) is continuously proving to be related to the nervous system, and there are significant differences in the abundance, diversity, and metabolite content of GM composition in AD patients compared with the normal population, whereas the drugs by rebuilding the intestinal flora can reduce neuroinflammation in the brain, and have a significant efficacy in improving cognition in AD patients (Feng et al., 2022; Hua et al., 2021). GM affects the brain in a variety of ways, such as synthesizing and releasing neurotransmitters and neuromodulators, releasing neurotoxic substances such as pro-inflammatory cytokines and other innate immune activators in the host body (Quigley, 2017). These phenomena suggest that the microbial-gut-brain axis is an important pathological pathway that influences the development of AD.
Metabolomics technology is a technique, following proteomics and genomics, to quantitatively analyze all metabolites in an organism, to search for metabolites associated with physiological and pathological changes, and to study their relative relationships. Metabolomics tools enable the visualization of metabolite changes in patients with AD, offering an avenue for investigating metabolic pathways in AD (Trushina and Mielke, 2014). 16S rDNA-seq is a method to analyze the genetic composition and function of microbial communities, the diversity and abundance of microbial communities in specific environments by extracting the DNA of microbial colonies, amplifying it, and then analyzing the relationship between microorganisms and environments, and between microorganisms and their hosts by high-throughput sequencing (Janda and Abbott, 2007). In the field of medicine, it is used to analyze the association between intestinal microorganisms and diseases, and the changes of intestinal flora during the development of a certain disease.
In our previous studies using network pharmacology, untargeted metabolomics of plasma and brain tissue, we observed that administration of Sc-At had a positive effect on AD rats. Sc-At may help treat AD by affecting aromatase activity and estrogen levels, among other pathways (Chen et al., 2022; Hao et al., 2023). In this study, we first used UPLC-QTOF/MS-based metabolomics to analyze the characteristic metabolites in rat feces, and then used 16S rDNA sequencing to observe changes in the abundance of intestinal flora. Finally, we analyzed the relationship between intestinal microorganisms, characteristic metabolites and AD by establishing the microbial gut-brain axis, and obtained the metabolites and metabolic pathways related to characteristic flora, which helped to further reveal the mechanism of action of Sc-At for the treatment of AD.
2 Materials and methods
2.1 Experimental materials and preparation
Sc and At were purchased online from Tianyitang Pharmaceuticals (Liaoning, China) and identified by UPLC. Relevant samples were kept in the authors' laboratory. Mass spectrometry grade methanol and acetonitrile were purchased from Merck (Darmstadt, Germany). Leucine enkephalins were purchased from Sigma-Aldrich (St. Louis, MO, USA). Mass spectrometry grade formic acid was purchased from Thermo Fisher Scientific (China). Analytically pure aluminum chloride was purchased from Guangfu Fine Chemical Research Institute (Tianjin, China). D-Galactose was purchased from Hefei Biotechnology Company (Hefei, China). Aβ-amyloid 25–35 was purchased from Beijing Biosynthesis Company (Beijing, China). All other reagents and chemicals used in the experiments were of analytical grade.
Samples of Sc-At were prepared by ultrasonic alcohol extraction (Alseekh et al., 2021). The samples of Sc and At were crushed and sieved through a 40-mesh sieve, weighed 1.5 g of mixed powder (1:1, 1:2, 2:1, w:w), soaked in ten times the volume of ethanol (75 %, 90 %, 95 %) for 1 h, and extracted by ultrasonic extraction for 1 h. Filtering was carried out, and the filtrate was continued to be added with ten times the volume of ethanol, and the extraction was repeated for two times. The filtrates were combined, concentrated by rotary evaporation and freeze-dried.
50 g of mixed powder (1:1, w:w) was weighed and 90 % ethanol was selected as extractant and prepared by the same method. Compounding of lyophilized powder for AD rat administration.
2.2 Experimental methods
2.2.1 Sample solution reparation
Take 0.5 g of Sc-At lyophilized powder, dissolve it with methanol solution, dilute it to appropriate multiples, centrifuge the diluted solution at 4 °C, 12000 rpm for 10 min, take the supernatant, filter it through 0.22 μm filter membrane, and store it at −20 °C for spare.
2.2.2 Animals and modeling
Forty 8-week-old SD male rats (200–300 g) were purchased from Changsheng Biotechnology Co Ltd (Liaoning, China). The study was carried out in compliance with the China Medical University Guidelines for Animal Experiments [Experimental Ethics No. (CMU2022050)], which was authorised by the university's Animal Ethics Committee.
The experimental rats were housed in an environment of room temperature 25 ± 2 °C and humidity 55 ± 5 %. A 12-hour light–dark cycle was set up in the room, and all animals were free to eat and drink. Following a week of acclimation to the rearing environment, the rats were split into three groups at random: group B was the blank group, group M was the model group, and group Sc-At was the drug administration group. Each group consisted of eight rats. The remaining rats were used as a control group for backup. The amount of drug administered to rats in each group was calculated by the method of human and rat drug dose conversion. D-galactose 120 mg/kg/d and AlCl3 40 mg/kg/d were given to group M and group Sc-At, and an equal amount of saline was given to group B. The rats in group M and group Sc-At were given the same dose as that in group B. The drug was administered continuously for seven weeks.
At the beginning of the third week, 2.5 g/kg/d of Sc-At was given to the Sc-At group, D-galactose and AlCl3 were continued in the group M, and an equal amount of saline was given to the B group. In the eighth week, bilateral ventricular injections were performed in both the M and Sc-At groups, and Aβ 25–35 10 μg was given on each side. group B was similarly treated with saline. After ventricle injection continue to give medicine, drug intervention to 9 weeks continuously. Feces were collected from each group of rats during the experiment. After the Y-maze assessed the learning memory ability of each group, rats in each group were anesthetized and executed, and brain samples were collected. All samples were stored at −80 °C for testing.
2.3 Y-maze experiment
In order to assess the ability of rats to explore novel environments, a Y-maze experiment was performed after the 9th week of drug administration, consisting of 3 equal arms (50 cm × 18 cm × 35 cm) with a 120° angle between the arms, a movable partition in the center, and a black interior.
The rats were given six minutes to freely explore the Y maze after being dropped off at the end of any arm at random. A camera system was used to record behavioural changes. Two metrics were recorded in sequence: the maximum number of alternations (which was equal to the total number of times the rats entered each arm minus 2) and the total number of arm entries (which was the number of times the animals entered the maze's arms, with the criterion that the rats entered the arm once when all four feet entered the arm). Spontaneous alternation ratio = total number of alternations / maximum number of alternations × 100 %. After each experiment, the box was washed with 75 % ethanol to ensure that the behavior of the current experimental rats was not affected.
2.4 Enzyme-Linked immunosorbent assay analysis of tumor necrosis factor-α, Interleukin-18, Interleukin-1β and Aβ
At the end of the spontaneous alternation experiments, the pathological features of AD were examined in each group of rats, including Aβ deposition in rat brain tissue and neuroinflammatory factor (IL-1β, IL-18, and TNF-α) detection. The experiments were performed according to the commercialized Aβ and neuroinflammatory factor assay kit (Chenglinshengwu, beijing). The levels of Aβ, IL-1β, IL-18 and TNF-α in rat brain tissue samples were calculated by establishing standard curves.
2.5 16S rDNA sequencing and data processing
Microbial DNA Extraction: To guarantee the effectiveness and calibre of DNA extraction, kits for DNA extraction are appropriate for a variety of sample types. (Faecal DNA Kit OMEGA) Building target fragment libraries and sequencing: PCR primers are made to specifically target the variable region of the 16S rDNA gene, which is the conserved portion. Following 35 PCR cycles, barcoding and sequencing adapters are added to the amplification process to detect the PCR amplification products using 1.5 % agarose gel electrophoresis. The AxyPrep PCR Cleanup Kit was utilised to retrieve the desired fragments.
PCR products were further purified using the Quant-iT PicoGreen dsDNA Assay Kit. PCR products were quantified using the Promega QuantiFluor Quantification System. The Promega QuantiFluor Quantification System was used to quantify the libraries. Pooled libraries were loaded with a paired-end sequencing procedure (2 × 250 bp) on the Illumina platform.
DATA PROCESSING: Paired-end reads were sorted into samples based on their unique barcodes and then trimmed by removing barcodes and primer sequences. Subsequently, paired-end reads (16S rRNA) were merged using FLASH (v1.2.8). Raw reads underwent quality filtering based on specific criteria using fqtrim (v0.94) to obtain high-quality clean data. Chimeric sequences were removed using Vsearch software (v2.3.4). Feature tables and sequences were generated after de-noising with DADA2. Alpha diversity and beta diversity were calculated using QIIME2 to standardize the sequence counts across samples, followed by random extraction to calculate the relative abundance of bacterial taxa (X Bacterial counts/total counts). Images were plotted with R (v3.5.2). Sequence alignment was performed using SILV A and BLAST from the NT16S comparison database for species annotation.
2.6 Untargeted metabolomics analysis
2.6.1 Sample processing
At the end of the experiment, feces from the group B,group M, and group Sc-At were collected and stored at −80 °C until the next analysis.
Before analysis, fecal samples were removed and thawed at 4 °C, 50 mg of each sample was weighed accurately, 1 mL of pre-cooled methanol was added, homogenized for 30 s at 60 Hz, the steel ball was removed and rotated for 1 min, and the proteins were precipitated by resting the sample for 20 min at −20 °C. The samples were then centrifuged at 12,000 rpm for 10 min at 4 °C, the supernatant was taken, and the process was repeated twice. The consistency of the system during collection was ensured by mixing 100 μL of all fecal samples to prepare a quality control (QC) sample. All samples were filtered through a microporous filter membrane prior to testing.
2.6.2 UPLC Q-TOF/MS based untargeted metabolomics analysis
For plant sample analysis, the gradient mobile phase consisted of water (solvent A), acetonitrile (solvent B) containing 0.1 % formic acid; each sample eluted at a flow rate of 0.4 mL/min for 16 min. The elution gradient was designed as follows: 0–1 min, 10 % B; 1–11 min, 10 %-90 % B; 11–13 min, 90 % B; and 13–16 min, 10 % B. The injection volume was 3 μL, and the temperature of the sample chamber was 4 °C.
Water (solvent A) and acetonitrile with 0.1 % formic acid (solvent B) solution made up the gradient mobile phase for faecal metabolomics. The samples were eluted for 23 min at a flow rate of 0.4 mL/min. The following was the design of the elution gradient: 0–2 min, 95 % B; 2–21 min, 95 %–5% B; and 21–23 min, 95 % B. The sample chamber was 4 °C in temperature, and the injection volume was 3 μL.The samples were separated using a reversed-phase column (ACQUITY HSS T3, 2.1 100 mm, 1.8 mm, Waters), and the mass data were detected in both positive and negative ion modes, with the instrumental parameters and mass spectrometry conditions referenced from our previous studies (Chen et al., 2022). Quality control (QC) samples were prepared by taking an aliquot of each sample of all fecal samples before nitrogen blow-drying and mixing them and dividing them equally into 8 QCs, and then the same samples were prepared together. QC samples were added to every 6 test samples to check the stability and performance of the instrument.
2.6.3 Untargeted metabolomics data processing
ProgenesisQi2.3 was used to import the raw data obtained by UPLC-QTOF/MS and perform peak extraction, peak matching, and peak alignment. To normalise the data, total ion intensities were used. Then, using SIMCA14.1, the data were examined using partial least squares discriminant analysis (PLS-DA) and orthogonal partial least squares discriminant analysis (OPLS-DA). Peaks with RSD ≤ 30 % in quality control (QC) were selected for subsequent screening and identification. Differential features were screened based on pre-VIP > 1 and t-test (P < 0.05), Compounds were identified using a self-constructed database for plant samples and metabolites were identified using the HMDB database (https://www.hmdb.ca)for animal samples. The identified differential metabolites were analyzed for pathway enrichment using MetaboAnalyst 5.0 (https://www.metaboanalyst.ca/).
2.7 Statistical analysis
All experimental data were expressed as mean ± SD and analyzed for significant differences using GraphPad Prism 8.0. The confidence interval for determining the significance of differences was 95 % (p < 0.05). One-way analysis of variance (ANOVA) was performed by SPSS 26 (SPSS Inc., Chicago, Illinois, USA), and Duncan’s post hoc test were performed for multiple comparisons. Gut microbes and endogenous differential metabolites were analyzed by Spearman correlation analysis using the OmicStudio tool (https://www.omicstudio.cn/tool).
3 Results
3.1 Extraction condition optimization
On the basis of previous studies, we selected 14 important active compounds in the Sc-At drug pairing as reference indexes and conducted orthogonal experiments with different concentrations of methanol solution extraction and different drug ratios. The results of the experiments are shown in Table S1. It was found that the methanol concentration of 90 % and the drug ratio of 1:1 (w: w) were the optimal ratios that were more cost-effective and greener in the process of extracting herbs with methanol solution in different ratios.
3.2 Sc-At alleviated cognitive impairment of AD rats
A Y-maze experiment was used to verify the therapeutic effect of Sc-At on short-term learning memory ability in AD rats. The results showed (Fig. 1B) that the spontaneous alternation ratio of rats in the Model group was significantly decreased compared with that of the Blank group (P < 0.01), suggesting that the modeling was successful and the short-term learning and memory ability of AD rats was damaged. Compared with the Model group, the spontaneous alternation ratio of rats in the Sc-At group showed a significant increase (P < 0.01), which indicated that the short-term learning memory ability of AD rats was restored after SC-At treatment.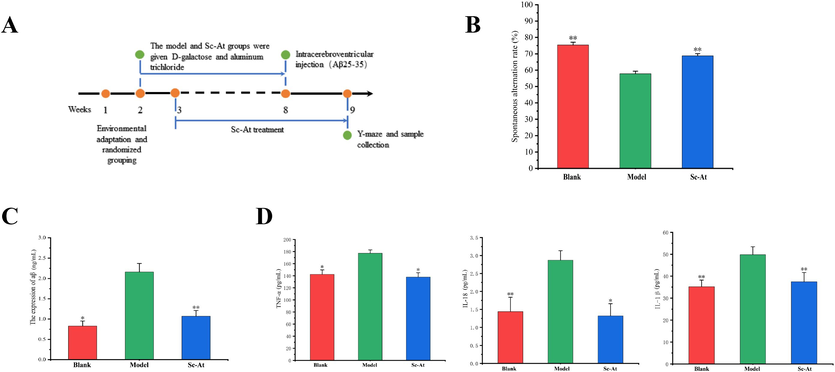
Sc-At attenuates cognitive impairment and pathological changes in AD rats (A, Schematic diagram of experimental design for Sc-At treatment of AD rats; B, Effect of Sc-At on the spontaneous alternation ratio of AD rats in the Y-maze experiment; C, Aβ expression levels in rats of Blank, AD and Sc-At groups; D, TNF-α, IL-1β and IL-18 expression levels in the brain of rats in Blank, AD and Sc-At groups). Compared with the model group, *, P < 0.05 and **, P < 0.01.
3.3 Sc-At alleviated pathological changes of AD rats
At the end of the Y-maze test, the pathological characteristics of the rats in each group were examined using a commercial ELISA kit, including Aβ amyloid deposition and neuroinflammatory factor expression levels in the rat brain. Fig. 1C shows that Aβ expression in the brains of rats in the Model group was significantly elevated compared with the Blank group, whereas Aβ deposition improved after Sc-At treatment.
There is accumulating evidence that the pathophysiology of Alzheimer's disease includes strong interactions with immunological processes in the brain, characterised by the release of inflammatory mediators (Heneka et al., 2015). Therefore, we used ELISA to assess rat brain tissue inflammatory factor content. TNF-α, IL-18 and IL-1β levels were significantly elevated in the brains of rats in the Model group compared to group Blank. This change was reversed by administration of Sc-At (Fig. 1D).
3.4 Gut microbial changes after Sc-At treatment
16S rDNA sequencing was employed to track the makeup of the faecal microbiota in the control group, model group, and Sc-At group in order to comprehend the composition of the intestinal microbiota in AD rats and the alterations that occurred following administration. After removing the background noise, the characteristic amount of intestinal microflora in different groups was obtained, as shown in Fig. 2A (model group 4750; control group 6339; Sc-At group 5662). Alpha diversity refers to the diversity of a specific environment or ecosystem, and it is mostly used to describe species richness, consistency, and sequencing depth. Goods_coverage is the microbiological coverage; the greater its value, the less likely it is that a novel species was not measured in the sample; the index truly shows whether the sequencing results mirror the sample's true situation (Fig. 2B). According to the Chao1 index, Shannon index, and the observed Goods-coverage curve (Fig. 2C), the bacterial abundance and α-diversity of the group was significantly lower than that of the control or Sc-At group. To see how these groups differed from one another, PCoA analysis was done (Fig. 2D). The final results demonstrated that the Sc-At group, the model group, and the blank group differed significantly from one another.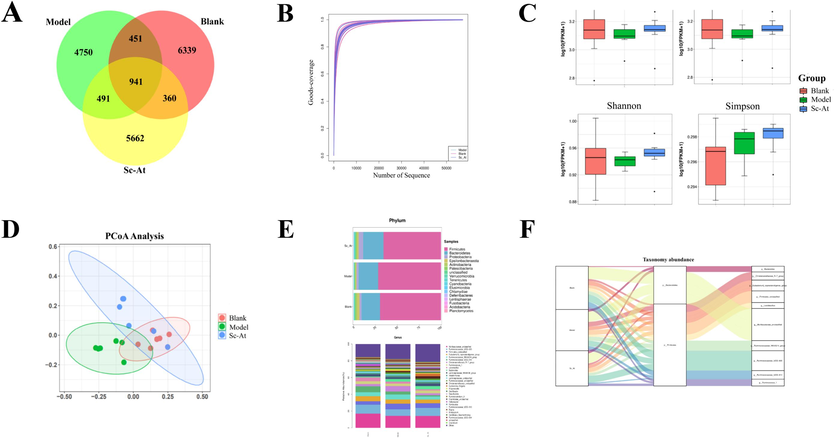
Changes in relative abundance and diversity of gut flora in blank, model, and Sc-At groups (A, Venn diagrams of GM characteristics in each group; B, Goods_coverage plots of test samples; C, Chao1, Observed species, Shannon, and Simpson indices in each group; D, PCoA plots of samples in each group; E, relative abundance of TOP30 gut flora at the phylum and genus levels; F, Sankey plots of gut flora in each group).
Gut microbes were analyzed at the phylum and genus level based on the results of species annotation. Comparing the model group to the blank group, we observed a decrease in the relative abundance of the phylum Epsilonbacteraeota and an increase in the relative abundance of the phylum Firmicutes; this change was reversed following Sc-At treatment (Fig. 2E).
In the modelled group, there was a significant increase in the relative abundance of Christensenellaceae_R-7_group and Firmicutes_unclassified, etc., and a significant decrease in the relative abundance of Ruminococcaceae_UCG-005 and Ruminococcaceae_unclassified, etc., according to a clustering heat map analysis of the 30 communities with the highest abundance at the genus level. Among them, Christensenellaceae_R-7_group was the main reason for the increase in the relative abundance of the clade of solid bacteria (Fig. 2F). The aforementioned findings showed that the intestinal flora of AD rats was deficient in both variety and abundance, but that both parameters considerably improved following Sc-At treatment.
3.5 Target bacteria and their association with AD
Linear discriminant analysis (LEfSe) seeks out statistically significant biomarkers and is often used to find high-dimensional indicators of the gut microbiota across groups. LEfSe analysis showed strains with significant differences in abundance between groups (Fig. 3A). As can be seen in Fig. 3B, a total of 32 differential strains were identified (LDA > 3, P < 0.05). Among them, the Blank group accounted for 4, which were Rikenellaceae_RC9_gut_group, Eubacterium_ruminantium_group, Dubosiella and Desulfovibrionaceae_unclassified at the genus level. the Model group accounted for 8 of the RikenellaceaeStreptococcaceae and Christensenellaceae at the family level, and Streptococcus, Clostridium_sensu_stricto_1, Dorea, Lachnospiraceae_at the genus level. ND3007_group, Tyzzerella, and Ruminococcaceae_unclassified. sc-At group accounted for 20, namely Verrucomicrobia at the phylum level; Bacteroomicrobiaes, Eubacteriaceae at the family level, Enterobacteriaceae and Akkermansiaceae; at the genus level Bacteroides, Prevotellaceae_Ga6A1_group, Christensenellaceae_unclassified, Eubacterium, Coprococcus_2, Epulopiscium, Lachnospiraceae_UCG_010, Negativibacillus, Erysipelatoclostridium, Prevotellaceae_NK3B31_group, Escherichia_Shigella and Akkermansia. species level Bacteroomicrobiaes, Eubacteriaceae, Enterobacteriaceae and Akkermansiaceae.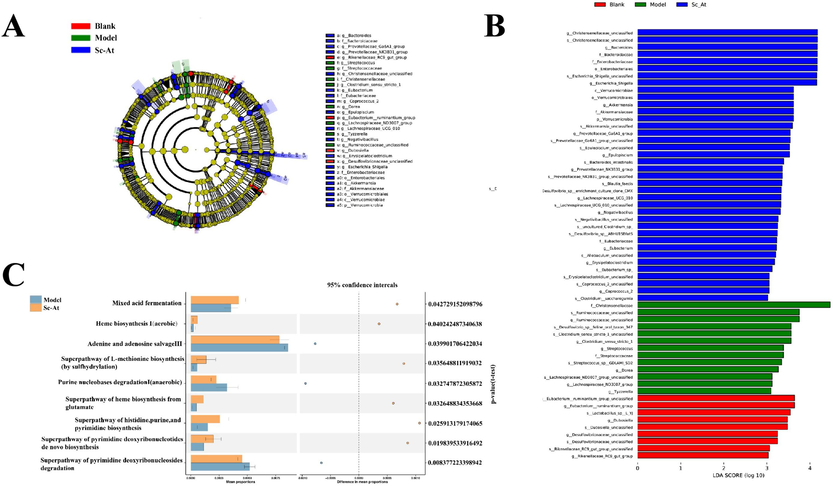
(A,B) LEfSe analysis comparing the differential flora in Blank, Model and Sc-At groups(Different colored nodes in the figure indicate microbial communities at all levels of classification, yellow nodes indicate colonies with no significant differences under comparison; red nodes indicate colonies with significant differences and significantly enriched in the Blank group; green nodes indicate colonies with significant differences and significantly enriched in the Model group; blue nodes indicate colonies with significant differences and significantly enriched in the Sc-At group. (C)Differential analysis of metabolic pathways at KEGG level between Model and Sc-At groups.
3.6 Prediction of gene function in gut microbial
Specific functional genes were obtained by PICRUSt2 analysis, screened against the KO database, mapped these functional genes to specific KEGG metabolic pathways (KEGG pathway), and the abundance of each pathway in each sample was counted for visualization. Among the model group with significant differences from the Sc-At group (Fig. 3C) There were three functional pathways with significant differences in the model group (P < 0.05), including adenine and adenosine remediation pathway III, purine nucleotide degradation pathway I (anaerobic), and super pathway of pyrimidine deoxyribonucleoside degradation; and in the Sc-At group, there were six functional pathways with significant differences (P < 0.05), including heme biosynthesis I (aerobic), mixed acid fermentation, glutamate synthesis superpathway of heme, superpathway of histidine, purine, and pyrimidine biosynthesis, superpathway of L-methionine biosynthesis (via sulfhydrylation), and superpathway of pyrimidine deoxyribonucleotide de novo synthesis.
3.7 Effects of Sc-At on metabolism in AD rats
Metabolites serve as a link between the gut flora and the brain-gut axis, providing insight into the workings of the gut flora. Metabolites were analyzed in fecal samples using UPLC-QTOF/MS. The base peak chromatogram (BPI plot) of the fecal samples is shown in attach Fig. S1A, Fig. S1B. As illustrated in Fig. 4A, B, the PCA plot revealed that the QC group grouped together, demonstrating the instrument's excellent stability; the samples within the group clustered together, but there was a distinct split between the groups. The PCA plot revealed a strong trend of separation between the model and control groups, indicating that the AD model was successfully produced and that AD rats exhibit severe metabolic abnormalities. Furthermore, the Sc-At group was notably distinguishable from the Model group but similar to the control group, showing that it had therapeutic benefits on AD rats.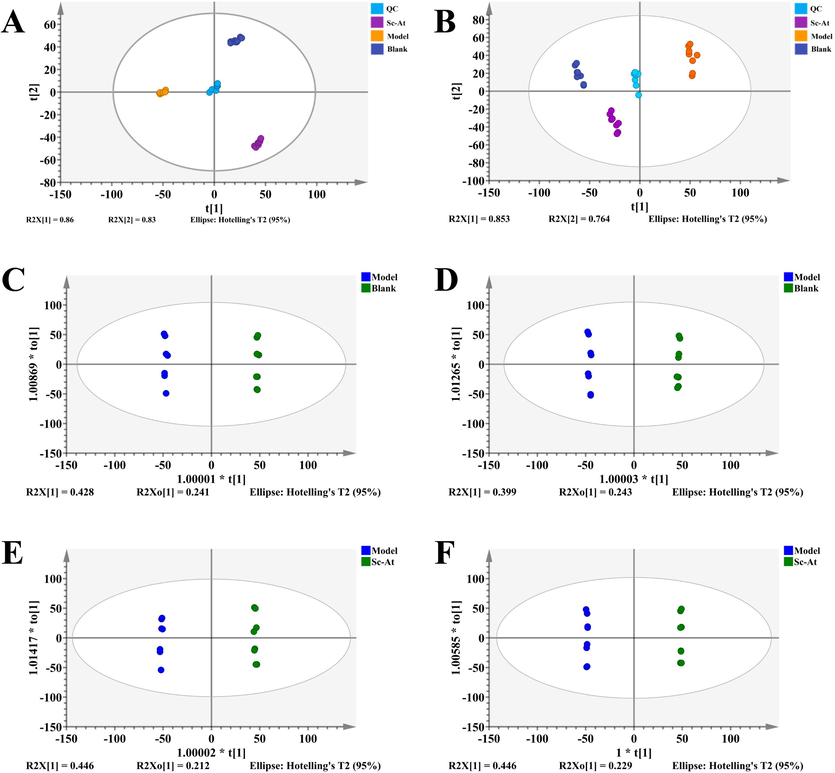
PCA and OPLS-DA plots (A, PCA plots of groups in feces in positive mode; B, PCA plots of groups in feces in negative mode; C, OPLS-DA plots of blank and model groups in positive mode; D, OPLS-DA plots of blank and model groups in negative mode; E, OPLS-DA plots of Sc-At and model groups in positive mode; F, OPLS-DA plots of Sc-At and model groups in negative mode).
The supervised OPLS-DA model was selected to determine the variations in metabolism between the two groups. As shown in Figures Fig. 4C, D, E, and F, there were significant separations between the blank group and the model group and between the Sc-At group and the model group, indicating that there were significant metabolic differences in the fecal samples of each group. In addition, R2 and Q2 in the OPLSDA model tended to be close to 1, indicating good predictive and modeling simulation ability. Differential metabolites were identified in compounds with P < 0.05 and VIP > 1.0 in OPLS-DA analysis. The HMDB database matched these divergent molecules, leading to the identification of 18 endogenous metabolites as putative biomarkers. Table 1 and Fig. 5B illustrate the trends of these metabolites. Through pathway enrichment analysis, we found multiple metabolic pathways abnormal in feces, such as linoleic acid metabolism, steroid hormone biosynthesis, sphingomyelin metabolism, riboflavin metabolism (Fig. 5A). Fig. 6A illustrates the relationships between different metabolic processes.
Number
Compound
HMDB ID
Adducts
Formula
Anova (p)
Description
m/z
Pathways
1
11.43_318.3018m/z
HMDB0004610
[M + H]+
C18H39NO3
0.000936974
Phytosphingosine
317.51
Sphingolipid metabolism
2
12.33_302.3050m/z
HMDB0000269
[M + H]+
C18H39NO2
0.022853792
Sphinganine
301.51
Sphingolipid metabolism
3
13.02_520.3399m/z
HMDB0010386
[M + H]+
C26H50NO7P
0.017443512
LysoPC(18:2(9Z,12Z))
519.66
Glycerophospholipid metabolism
4
13.33_347.2211m/z
HMDB0000015
[M + H]+
C21H30O4
0.000332139
Cortexolone
346.47
Steroid hormone biosynthesis
5
15.85_281.2475m/z
HMDB0000673
[M + H]+
C18H32O2
0.009608405
Linoleic acid
280.45
Linoleic acid metabolism
6
15.97_510.3907m/z
HMDB0011149
[M + H]+
C26H56NO6P
0.018129649
LysoPC(O-18:0)
509.71
Ether lipid metabolism
7
16.00_290.2255n
HMDB0000031
[M + H]+, [M + NH4]+
C19H30O2
0.01786503
Androsterone
290.45
Steroid hormone biosynthesis
8
16.01_508.3756m/z
HMDB0013122
[M + H]+
C26H54NO6P
0.027776373
LysoPC(P-18:0)
507.69
Glycerophospholipid metabolism
9
16.36_300.2887m/z
HMDB0000207
[M + NH4]+
C18H34O2
0.019500578
Oleic acid
282.47
Biosynthesis of unsaturated fatty acids
10
16.89_435.3478m/z
HMDB0003533
[M + H]+
C27H46O4
0.000920063
3a,7a,12a-Trihydroxy-5b-cholestan-26-al
434.66
Primary bile acid biosynthesis
11
17.03_419.3517m/z
HMDB0006764
[M + H]+
C27H46O3
0.011583025
17a,20a-Dihydroxycholesterol
418.66
Steroid hormone biosynthesis
12
19.71_786.6001m/z
HMDB0008039
[M + H]+
C44H84NO8P
0.016781636
PC(18:0/18:2(9Z,12Z))
786.13
Linoleic acid metabolism
13
19.74_742.5726m/z
HMDB0008029
[M + H]+
C42H80NO7P
0.033542844
PC(16:1(9Z)/P-18:1(11Z))
742.07
Glycerophospholipid metabolism
14
4.51_377.1466m/z
HMDB0000244
[M + H]+
C17H20N4O6
0.019130398
Riboflavin
376.40
Riboflavin metabolism
15
6.20_570.3664m/z
HMDB0002513
[M + NH4]+
C30H48O9
0.006644963
Lithocholate 3-O-glucuronide
552.71
Pentose and glucuronate interconversions
16
6.83_591.3199m/z
HMDB0004158
[M + H]+
C33H42N4O6
0.002751019
D-Urobilinogen
590.72
Pyrimidine metabolism
17
7.44_565.3958m/z
HMDB0010392
[M + NH4]+
C28H54NO7P
0.000888457
LysoPC(20:2(11Z,14Z))
547.71
Glycerophospholipid metabolism
18
8.94_347.2230m/z
HMDB0004030
[M + H]+
C21H30O4
0.019542948
21-Deoxycortisol
346.47
Steroid hormone biosynthesis
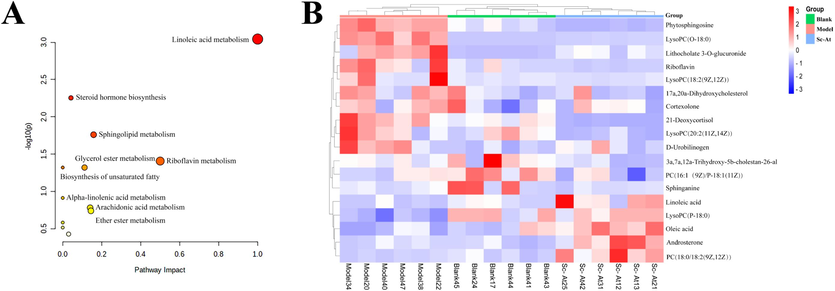
Differential metabolites in feces by untargeted metabolomics (A, KEGG pathway for differential metabolites; B, Heat map of three groups of differential metabolites in feces).
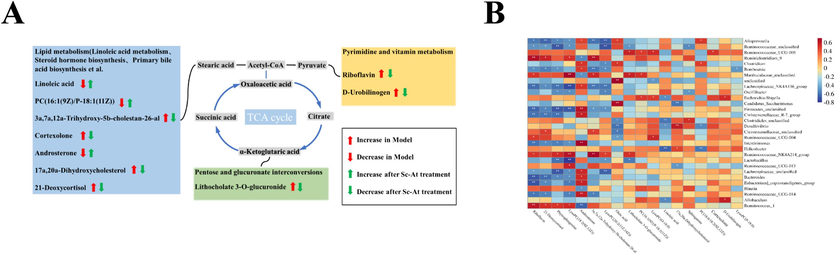
A, the relationship between various metabolic pathways; B, Spearman correlation analysis of intestinal flora and differential metabolism.
3.8 Correlation analysis of intestinal flora with differential metabolites in host feces
To further investigate the relationship between metabolites and intestinal flora in Sc-At treated rats, Spearman correlation analysis was done between differential metabolites obtained from pooled identification of fecal samples and the top 30 intestinal flora in terms of abundance (Fig. 6B). In Linoleic acid metabolism, Linoleic acid was significantly negatively correlated with the characteristic bacteria Helicobacter, Clostridiales_unclassified in the Model group. In Sphingolipid metabolism, Phytosphingosine was_unclassified with Lachnospiraceae_NK4A136_group, Firmicutes, Lachnospiraceae_unclassified,Ruminococcaceae_unclassified, Christensenellaceae_R-7_group. Lactobacillus group were significantly negatively correlated. These enterobacteria are characteristic bacteria of the Blank and Sc-At groups. In Riboflavin metabolism, Riboflavin was significantly and positively correlated with Ruminiclostridium_9, Ruminococcus_1, the characteristic bacteria of Blank and Sc-At groups, and significantly negative correlation with the Model group of characterized bacteria Lachnospiraceae_NK4A136_group, Firmicutes_unclassified, Christensenellaccac_R-7_group, Intestinimonas, Bacteroides and Eubacterium_coprostanoligenes_group were significantly negatively correlated. The results of the correlation analysis showed a significant correlation between differential metabolites in feces and intestinal flora usefulness.
4 Discussion
AD is a neurodegenerative condition that develops slowly. There is increasing experimental evidence that changes in gut microbiota can disrupt an organism's natural physiological balance and cause disorders like AD. Our previous studies have demonstrated that Sc-At drug pairs have favorable therapeutic effects on AD rats. Sc-At can ameliorate cognitive deficits in AD rats by inhibiting Aβ deposition and neuroinflammation (Chen et al., 2022). Sc-At may exert its anti-AD mechanism of action by increasing rat brain aromatase activity, which in turn increases the level of 17β-estradiol in rat brain tissue (Hao et al., 2023). In this experiment, we investigated the protective effect of Sc-At on AD rats from the perspective of microbe-gut-brain axis by fecal untargeted metabolomics analysis combined with 16S rDNA gene sequencing.
Through the microbe-brain axis, the gut microbiota can interact with the central nervous system (CNS). Neural stimulation, metabolic manipulations, and microbial secretions all play a role in mediating this communication. By modifying the manufacture of neurotransmitters and the metabolites that are linked to them, microbial metabolites can impact the microbe-gut-brain axis via neuroendocrine pathways. According to recent research, metabolites generated by bacteria or those produced by the host or environment and metabolised by bacteria mediate gut microbial-host interactions (Krautkramer et al., 2021). Among these are short-chain fatty acids like acetate, propionate, and butyrate. Additional instances encompass polyamines, metabolites of linoleic acid, tryptophan, trimethylamine-N-oxide, vitamins, and sec-bile acids (Osadchiy et al., 2019). These metabolites regulate the cell cycle, neuronal signalling, cholesterol and bile acid metabolism, immunological responses, and antioxidant responses.
In our study, we found that the abundance and diversity of intestinal flora in AD rats were severely disrupted and accompanied by elevated inflammatory factors in the brain, which could be reversed by treatment with Sc-At. In addition, we identified 20 bacteria responsive to Sc-At by LEfSe analysis, which may be potential targets for Sc-At treatment of AD. Among them, Christensenellaceae, a beneficial bacterium of the genus Thick-walled Bacteria widely found in the biological gastrointestinal tract that maintains homeostasis in the host (Waters and Ley, 2019), has been shown to be significantly and negatively associated with metabolic disorders, such as IBD, fat deposition, and metabolic syndrome (Nøhr et al., 2013), and it has also been recognized as one of the hallmark flora of a healthy gut. In this experiment, the level of Christensenellaceae decreased in rats in the Model group compared to the Blank group, while the abundance of this colony increased after Sc-At treatment, suggesting that Sc-At restores the level of Christensenellaceae in the intestine, while the intestinal microenvironmental homeostasis is restored.Eubacterium has been shown to play a role in energy homeostasis, colonic motility, immunomodulation, and suppression of intestinal inflammation (Mukherjee et al., 2020). Lachnospiraceae and their metabolites can play a neuroprotective role in cognitive deficits induced by sleep deprivation (Wang et al., 2023). Changes in the bacterial genera of Negativibacillus and Faecalibaculum can improve the aged mice's memory (Sadovnikova et al., 2021). In addition, Trichosporonaceae, Browniaceae, and Collinsiaceae are also strongly associated with neurological disorders (Dan et al., 2020), and the abundance of these groups of bacteria was disrupted in the Model group, and treatment with Sc-At was able to reverse this disruption and restore the normal intestinal microenvironment.
In studies investigating gut-brain interactions, there is rising evidence that microbial metabolites essential for controlling the physiological state of the brain are significant messengers of the gut bacteria. The metabolomics data revealed severe metabolic abnormalities in AD model rats, particularly in lipid, steroid hormone, amino acid, bile acid, and energy metabolism. In this part of the study, we did Spearman correlation analysis of differential metabolites in feces with the characteristic intestinal flora and showed a significant correlation.
Evidence from animal model studies and clinical trials suggests that linoleic acid (LA) has a number of beneficial effects in humans, including reducing inflammation and related side effects, controlling increases in body fat and enhancing immune responses, and reducing the chances of cancer and atherosclerosis (Amick et al., 2022; Basak and Duttaroy, 2020). Jesus Alarcon-Gil et al. found that LA has neuroprotective and anti-inflammatory effects in vitro and in vivo (Alarcon-Gil et al., 2022). Luigi Iuliano et al. found that patients with mild Alzheimer's disease had decreased linoleic acid levels and increased mead acid levels compared to healthy controls (Iuliano et al., 2013). In our study, significant changes in linoleic acid metabolism were observed. The metabolic level of LA in the feces of AD rats was significantly lower than that of the control and Sc-At groups. After Sc-At treatment, fecal linoleic acid concentrations returned to levels similar to those of the control group, suggesting that Sc-At has a preventive effect on AD by restoring linoleic acid imbalance. Helicobacter-derived outer membrane vesicles (OMV) can cross the biological barrier to reach the brain, thereby inducing glial cell activation and neuronal dysfunction, which ultimately leads to cellular exacerbated amyloid-β pathology, and cognitive decline (Xie et al., 2023). Zhang, M et al. found that riboflavin (also known as vitamin B2) ameliorated cognitive deficits through anti-oxidative stress and anti-inflammatory properties (Zhang et al., 2023). Lian, X et al. found that in anesthetized/surgery produced a decrease in the relative abundance of Clostridiales_unclassified in aged mice with reduced central nervous system (CNS) cognitive function (Lian et al., 2021). In our study, correlation analysis of fecal differential metabolites with characteristic flora showed significant negative correlation of LA and riboflavin with characteristic flora of the Model group, and riboflavin also showed significant positive correlation with Clostridium tumefaciens_9 and Clostridium rumefaciens_1, the characteristic flora of the Blank and Sc-At groups.
Several studies have shown that metabolic abnormalities, particularly linoleic acid metabolism and riboflavin metabolism, correlate significantly with the characteristic intestinal flora of AD rats. These results suggest that Sc-At may ameliorate cognitive deficits in AD rats by affecting the abundance of characteristic flora and associated metabolic pathways.
5 Conclusions
Although earlier studies have demonstrated the therapeutic effects of Sc-At in AD rats, studies addressing fecal metabolomics and gut flora remain unclear. The results of fecal metabolomics showed that Sc-At was able to reverse a variety of metabolic pathways affected in AD rats, resulting in a therapeutic effect on AD rats; the results of 16S rDNA gene sequencing showed that the diversity of the gut flora of AD rats was disrupted, and that Sc-At was able to reverse this change, restoring the normal micro-ecology of the gut flora, resulting in a therapeutic effect. Finally, spearman correlation analysis revealed that changes in intestinal flora were closely associated to difference metabolites in faeces, and that Sc-At could produce therapeutic effects in AD rats by restoring both the ecology of the intestinal flora and the related metabolic pathways (e.g., linoleic acid metabolism and riboflavin metabolism) together. However, existing studies were unable to determine the interaction between gut flora and fecal differential metabolites, which will be the direction of our work in subsequent studies (See Fig. 7).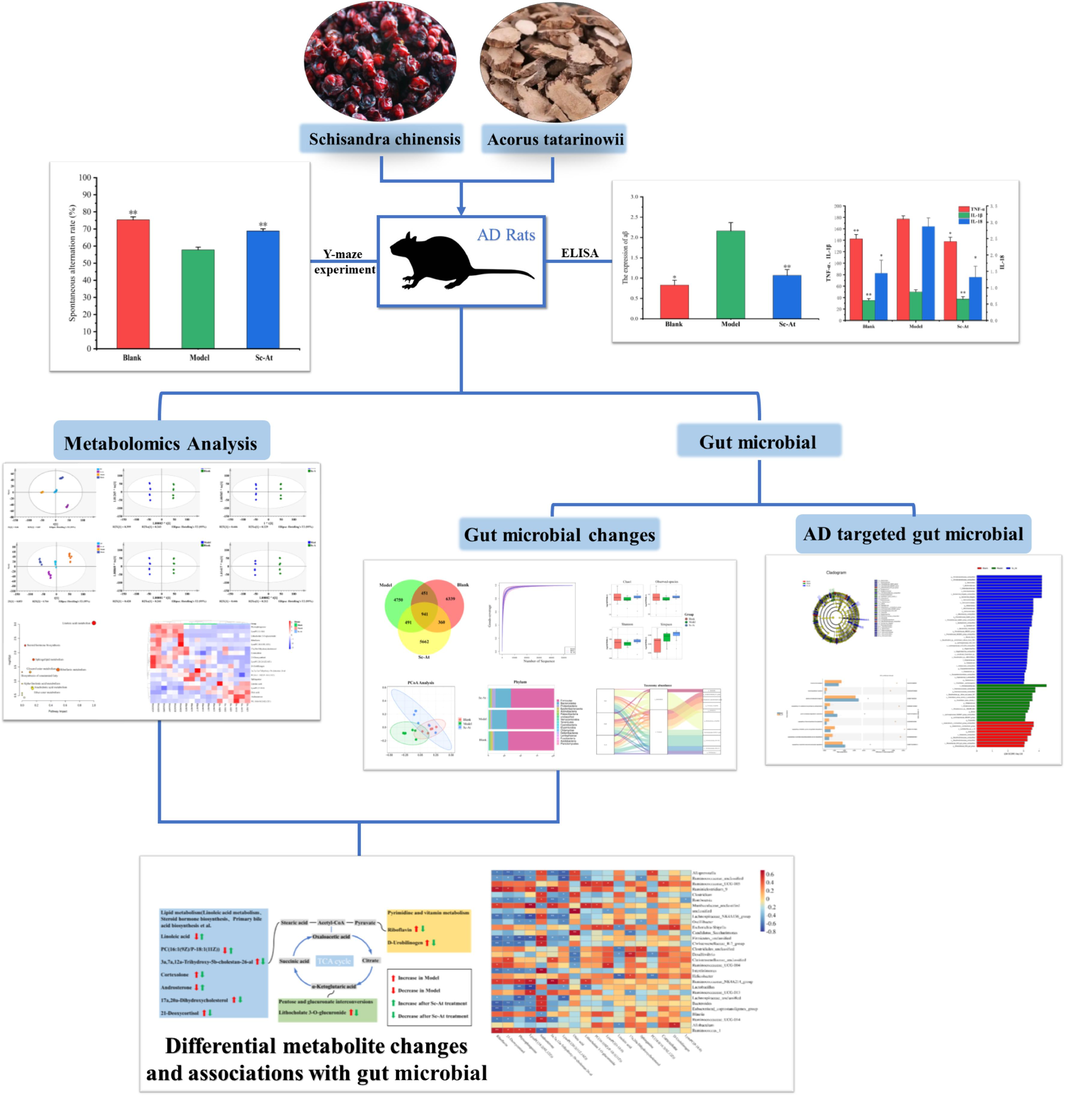
Sc-At alleviates cognitive impairment in AD rats by regulating the gut microbiota and metabolites.
Data availability
Data will be made available on request.
CRediT authorship contribution statement
Xiao Shan: Writing – original draft, Visualization, Software, Resources, Investigation, Formal analysis, Data curation, Conceptualization. Yu Liu: Visualization, Validation, Methodology. Ziwei Wang: Visualization, Validation, Software. Yumeng Yan: Visualization, Methodology, Formal analysis. Ronghua Fan: Methodology, Supervision, Writing – review & editing. Binbin Wei: Writing – review & editing, Validation, Supervision, Funding acquisition.
Acknowledgments
This study was supported by the National Natural Science Foundation of China (NO.81703519), Liaoning Province Natural Science Foundation (2023-MS-179).
Declaration of competing interest
The authors declare that they have no known competing financial interests or personal relationships that could have appeared to influence the work reported in this paper.
References
- Neuroprotective and anti-inflammatory effects of linoleic acid in models of Parkinson's disease: the implication of lipid droplets and lipophagy. Cells. 2022;11(15)
- [Google Scholar]
- Mass spectrometry-based metabolomics: a guide for annotation, quantification and best reporting practices. Nat. Methods. 2021;18(7):747-756.
- [Google Scholar]
- Plasma glycocholic acid and linoleic acid identified as potential mediators of mitochondrial bioenergetics in Alzheimer's dementia. Front. Aging Neurosci.. 2022;14:954090
- [Google Scholar]
- Conjugated linoleic acid and its beneficial effects in obesity, cardiovascular disease, and cancer. Nutrients. 2020;12(7)
- [Google Scholar]
- Explore the therapeutic composition and mechanism of Schisandra chinensis-Acorus tatarinowii Schott on Alzheimer's disease by using an integrated approach on chemical profile, network pharmacology, and UPLC-QTOF/MS-based metabolomics analysis. Oxid. Med. Cell. Longev.. 2022;2022:6362617.
- [Google Scholar]
- Altered gut microbial profile is associated with abnormal metabolism activity of Autism Spectrum Disorder. Gut Microbes. 2020;11(5):1246-1267.
- [Google Scholar]
- Integration of gut microbiota and metabolomics for chinese medicine research: opportunities and challenges. Chin. J. Integr. Med.. 2022;28(11):1032-1039.
- [Google Scholar]
- Huanglian Jiedu decoction remodels the periphery microenvironment to inhibit Alzheimer’s disease progression based on the “brain-gut” axis through multiple integrated omics. Alzheimers Res. Ther.. 2021;13(1):44.
- [Google Scholar]
- Integration of metabolomics and network pharmacology to validate the mechanism of Schisandra chinensis(Turcz.)Baill - Acorus tatarinowii Schott ameliorating the Alzheimer's disease by regulating the aromatase activity to affect local estrogen in brain of AD model rats. Arab. J. Chem.. 2023;16(2):104457
- [Google Scholar]
- Ziziphus jujuba Mill. var. spinosa (Bunge) Hu ex H. F. Chou seed ameliorates Insomnia in rats by regulating metabolomics and intestinal flora composition. Front. Pharmacol.. 2021;12:653767
- [Google Scholar]
- Plasma fatty acid lipidomics in amnestic mild cognitive impairment and Alzheimer's disease. J. Alzheimer's Dis. : JAD. 2013;36(3):545-553.
- [Google Scholar]
- 16S rRNA gene sequencing for bacterial identification in the diagnostic laboratory: pluses, perils, and pitfalls. J. Clin. Microbiol.. 2007;45(9):2761-2764.
- [Google Scholar]
- Gut microbial metabolites as multi-kingdom intermediates. Nat. Rev. Microbiol.. 2021;19(2):77-94.
- [Google Scholar]
- Effect of anesthesia/surgery on gut microbiota and fecal metabolites and their relationship with cognitive dysfunction. Front. Syst. Neurosci.. 2021;15:655695
- [Google Scholar]
- Gut microbes from the phylogenetically diverse genus Eubacterium and their various contributions to gut health. Gut Microbes. 2020;12(1):1802866.
- [Google Scholar]
- GPR41/FFAR3 and GPR43/FFAR2 as cosensors for short-chain fatty acids in enteroendocrine cells vs FFAR3 in enteric neurons and FFAR2 in enteric leukocytes. Endocrinology. 2013;154(10):3552-3564.
- [Google Scholar]
- The gut-brain axis and the microbiome: mechanisms and clinical implications. Clin. Gastroenterol. Hepatol.: The Off. Clin. Pract. J. Am. Gastroenterol. Assoc.. 2019;17(2):322-332.
- [Google Scholar]
- Microbiota-brain-gut axis and neurodegenerative diseases. Curr. Neurol. Neurosci. Rep.. 2017;17(12):94.
- [Google Scholar]
- Nrf2/ARE activators improve memory in aged mice via maintaining of mitochondrial quality control of brain and the modulation of gut microbiome. Pharmaceuticals (basel, Switzerland). 2021;14(7)
- [Google Scholar]
- Recent advances in the application of metabolomics to Alzheimer's disease. BBA. 2014;1842(8):1232-1239.
- [Google Scholar]
- Gut microbiota-derived metabolites mediate the neuroprotective effect of melatonin in cognitive impairment induced by sleep deprivation. Microbiome. 2023;11(1):17.
- [Google Scholar]
- The human gut bacteria Christensenellaceae are widespread, heritable, and associated with health. BMC Biol.. 2019;17(1):83.
- [Google Scholar]
- Helicobacter pylori-derived outer membrane vesicles contribute to Alzheimer's disease pathogenesis via C3–C3aR signalling. J. Extracellular Vesicles. 2023;12(2):e12306.
- [Google Scholar]
- Bajitianwan attenuates D-galactose-induced memory impairment and bone loss through suppression of oxidative stress in aging rat model. J. Ethnopharmacol.. 2020;261:112992
- [Google Scholar]
- Schisandra chinensis protects against dopaminergic neuronal oxidative stress, neuroinflammation and apoptosis via the BDNF/Nrf2/NF-κB pathway in 6-OHDA-induced Parkinson's disease mice. Food Funct.. 2021;12(9):4079-4091.
- [Google Scholar]
- Biomimetic Remodeling of Microglial Riboflavin Metabolism Ameliorates Cognitive Impairment by Modulating Neuroinflammation. Adv. Sci. (Weinheim Baden-Wurttemberg, Germany). 2023;10:e2300180
- [Google Scholar]
- A novel polysaccharide from Acorus tatarinowii protects against LPS-induced neuroinflammation and neurotoxicity by inhibiting TLR4-mediated MyD88/NF-κB and PI3K/Akt signaling pathways. Int. J. Biol. Macromol.. 2020;163:464-475.
- [Google Scholar]
Appendix A
Supplementary material
Supplementary data to this article can be found online at https://doi.org/10.1016/j.arabjc.2024.105957.
Appendix A
Supplementary material
The following are the Supplementary data to this article:Supplementary Data 1
Supplementary Data 1


