

Translate this page into:
Interaction between insulin receptor and a peptide derived from a trypsin inhibitor purified from tamarind seed: An in silico screening of insulin-like peptides
⁎Corresponding author at: Nutrition Postgraduate Program, Center for Health Sciences, Federal University of Rio Grande do Norte, Natal, 59.014-545, RN, Brazil and Biochemistry and Molecular Biology Postgraduate Program, Biosciences Center, Federal University of Rio Grande do Norte, Natal, 59.078-970, RN, Brazil. aharaujomorais@gmail.com (Ana Heloneida de A. Morais) ana.morais@ufrn.br (Ana Heloneida de A. Morais)
-
Received: ,
Accepted: ,
This article was originally published by Elsevier and was migrated to Scientific Scholar after the change of Publisher.
Abstract
The aim of this study was to prospect in silico peptides derived from a multifunctional protein and assess their interaction with the insulin receptor (IR). The trypsin inhibitor isolated from tamarind seeds (TTI) was obtained through trypsin-sepharose 4B-CNBr affinity chromatography and subsequently characterized. The TTI underwent in vitro hydrolysis to assess its susceptibility to enzymatic degradation and determine suitable enzymes for cleavage in silico. The theoretical model was established to assess the purified tamarind seed trypsin inhibitor (TTIp 56/287) being cleaved in silico and selected for simulation by molecular dynamics. Among the peptides generated, Peptidetripquimo59 presented the most negative docking score (-175.53) with the IR, indicating strong affinity and stability in complex formation. Significant interaction with the IR was observed for key residues, including arginine 16 (-209.07 kJ mol-1), threonine 1 (-148.54 kJ mol-1), and valine 2 (-94.53 kJ mol-1). Additionally, it was discovered that both insulin and Peptidetripquimo59 exhibit binding to the identical location on the insulin receptor (IR). The results of the semi-empirical approach revealed that Peptidetripquimo59 exhibited greater potential for interaction with the IR compared to other complexes such as the insulin-IR complex, suggesting its candidacy as a starting point for the development of therapeutic agents targeting both type 1 and type 2 Diabetes mellitus.
Keywords
Computer Simulation
Peptides
Diabetes Mellitus
Hypoglycemic Agents
Therapeutics

1 Introduction
Diabetes mellitus (DM) is a metabolic disease characterized by hyperglycemia that has increased considerably in recent years, with a growing projection of up to 643 million new cases in 2030, considering the different types of DM and undiagnosed cases in individuals aged 20 to 79 years (American Diabetes Association (ADA)., 2014; International Diabetes Federation (IDF)., 2021). Among the classifications of DM, the most common are type 1 diabetes (DM1), caused by an absolute deficiency in insulin production, and type 2 diabetes (DM2), caused by dysregulation in insulin secretion and insulin resistance (American Diabetes Association (ADA), 2022).
Insulin maintains glycemic homeostasis through its receptor-mediated action. Insulin receptor (IR) is expressed on the cell surface, and bearing its hormone-binding pocket is in the extracellular domain of α subunits. Binding with insulin generates a conformational change in the IR, triggering a cascade of reactions that results in the mobilization of the glucose transporter (GLUT) to the cell surface, where it plays an essential role in transporting glucose into cells (Boucher et al., 2014).
Maintaining this signaling is one of the great challenges for DM control. The search for therapeutic agents that help in this signaling can be promising in the treatment of this disease. Within this approach, the hypoglycemic effects attributed to several bioactive compounds, such as isoflavones, polyphenols, proteins and peptides, are usually studied (Munhoz and Frode, 2018; Egbuna et al., 2021; Costa et al., 2020). Cleavage of bioactive food proteins by the action of proteolytic enzymes produces peptides which have anti-diabetic effects and represent promising therapeutic options for glycemic control (Elam et al., 2021; Möller et al., 2008).
When food proteins are ingested, they undergo digestion so that they are later absorbed, fulfilling various roles in the body (Otvos and Wade, 2014). When derived from bioactive proteins, peptides are likely to be considered bioactive because they are the byproducts of hydrolysis by enzymes that operate on particular sites (Chakrabarti et al., 2018). Several in vitro methodologies simulate biological digestion, providing relevant information about the hydrolysis pattern of the evaluated molecule (Duijsens et al., 2022).
However, in vitro physiological processes must be simulated considering the food route in the gastrointestinal tract (GIT), from the oral phase to obtaining the final metabolite, as a simpler, more cost-effective, and reproducible alternative when compared to in vivo studies (Duijsens et al., 2022). Depending on the protocol, enzymatic interactions, variations in pH, temperature, agitation, time, and fluids, among other variables, are used to develop the most accurate digestion model possible (Minekus et al., 2014).
The protocol choice is crucial and should be based on the most appropriate parameters that mimic in vivo digestion, since errors during the steps can overestimate or underestimate the digestion pattern (Duijsens et al., 2022). In this study, adapted hydrolysis was performed based on the INFOGEST protocol, which is a standardization consensus for in vitro simulated digestion that has been used worldwide for purposes such as the digestion of food matrices (Brodkorb et al., 2019).
Consequently, the search for bioactive peptides is a challenging endeavor. Aside from selecting the enzymes that will be involved in the hydrolysis of the original molecule, additional steps include: confirming an adequate protein source; analyzing the bioactive potential of the fragments obtained by enzymatic hydrolysis; isolating these fragments; and validating the effects of these fragments to demonstrate their bioactivity (Tu et al., 2018). The methods involved in these steps are costly and time-consuming, which justifies the use of bioinformatics tools to aggregate the search for these peptides and more forcefully direct their bioactivity potential (Tu et al., 2018).
In this context, food proteins are excellent sources of bioactive peptides. A trypsin inhibitor isolated from tamarind seeds (TTI), either by itself, after being purified (TTIp), or encapsulated form (WPI), has been used to treat metabolic diseases, such as in the improvement of glycemia of rats with metabolic syndrome and diet-induced DM2 (Carvalho et al., 2016; Carvalho et al., 2019; Costa et al., 2022; Matias et al., 2019; Aguiar et al., 2021). TTIp protein sequencing is well established; the protein has a structure consisting of 184 amino acid residues and a model theoretical conformation standardized at number 56 and conformation number 287 (TTIp 56/287) (de Medeiros et al., 2021; de Medeiros et al., 2018).
In silico studies have been used to discover therapeutic agents, like bioactive peptides derived from food proteins, making it possible to evaluate, through computer simulations, the behavior of the interaction between agents and therapeutic targets, optimizing study time and financial resources compared to traditional methodologies (Tu et al., 2018; Akalın, 2006). Therefore, information thus generated can direct future studies in vitro, in vivo and clinical trials that are essential in the development of drugs or nutraceuticals for the treatment of various diseases, such as DM (Maia et al., 2020).
In a study evaluating TTI as an antidiabetic agent in rats with diet-induced DM2, the plasma glucose level and the HOMA-IR index were both lower, no matter how much insulin was in the blood (Costa et al., 2022). Thus, obtaining TTI-derived peptides is an excellent opportunity to investigate and deepen studies with this molecule with potential use for treating DM.
Therefore, the objective of this study is to prospect in silico peptides derived from TTIp 56/287 and to evaluate, through molecular dynamics, the interaction of the peptide with the IR as a therapeutic target in the control of glycemia by evaluating the Root Mean Square Deviation (RMSD) graph, the Interaction Potential Energy (IPE), and the interaction energy using the semi-empirical approach. In this study, the peptide obtained from the theoretical cleavage of TTIp 56/287 using the enzymes trypsin and chymotrypsin, which showed the greatest potential for interaction with the IR (PDB ID 4OGA), was selected for computational simulation by molecular dynamics with this target, showing affinity and stability with the receptor.
2 Material and methods
2.1 Obtaining trypsin inhibitor from tamarind seeds (TTI)
The tamarind fruit (Tamarindus indica L.) was obtained commercially in Natal, RN, Brazil. Peel and pulp were removed, leaving only the seeds. The TTI was obtained according to the methodology proposed by Carvalho (Carvalho et al., 2016). The seeds were peeled off until the cotyledons were obtained and then crushed in a refrigerated grinder at 6 °C to form flour in fine granules (0.420 mm) using a 40-mesh sieve (Fig. 1).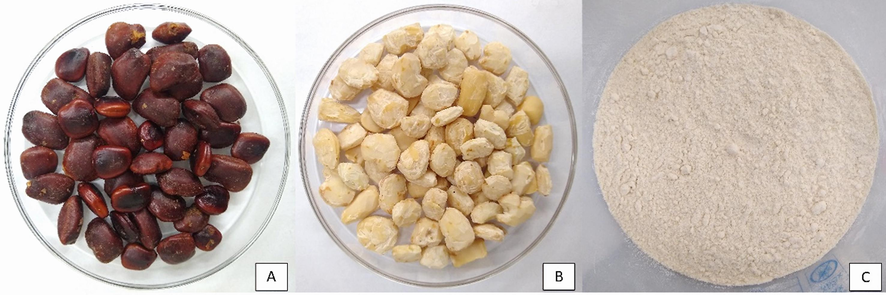
Steps for obtaining flour from tamarind seeds (Tamarindus indica L.): (A) seeds; (B) peeled seeds; (C) flour in fine granules.
Seventy grams of finely granulated flour from tamarind seeds were mixed with 700 mL of 50 mM Tris-HCl buffer at pH 7.5 (1:10 ratio) and stirred magnetically for 3 h at 22 °C. Subsequently, the homogenate was subjected to centrifugation (refrigerated centrifuge, Thermo Scientific, Sorvall Legend XTR) at 10,000 rpm, at 4 °C, for 30 min and then filtered to collect the supernatant called crude extract (CE), followed by discarding the precipitate.
The proteins from the CE were fractionated using precipitation with previously crushed ammonium sulfate in two saturation ranges, named F1: 0–30 % ammonium sulfate and F2: 30–60 % ammonium sulfate. 52 mL of CE were obtained and precipitation was carried out by adding 9.152 g of ammonium sulfate, while stirring magnetically at room temperature (22 °C). The CE with ammonium sulfate was stored in a refrigerator at 4 °C for 12 h. After this time, centrifugation was performed under the same conditions mentioned above, with subsequent filtration to collect the precipitate and saturation of the supernatant in the next saturation range. Thus, F1 corresponds to the first precipitate (according to the first-mentioned range). Its supernatant (52 mL) was precipitated again (according to the second-mentioned range) with 10.296 g of ammonium sulfate. The F1 with ammonium sulfate was refrigerated, centrifuged, and filtered to collect a new precipitate (F2 with the supernatant being discarded).
The precipitates F1 and F2 were each suspended in 1 mL of 50 mM Tris-HCl buffer, pH 7.5. They were then dialyzed using a 12 kDa pore size membrane in 4 L of distilled water for 72 h and in 4 L of 50 mM Tris-HCl buffer, pH 7.5, for 48 h, both at 4 °C. After this process, F1 and F2 were kept at –20 °C. Antitryptic activity was performed according to the methodology proposed by Kakade, Simons, and Liener (Kakade et al., 1969), and F2, which is the band with the highest inhibitory activity, was subjected to affinity chromatography with trypsin-sepharose (10 cm x 1.5 cm) in 50 mM Tris-HCl buffer, pH 7.5, for inhibitor isolation.
The F2 fraction was separated by eluting with a 100 mL solution of 50 mM Tris-HCl, pH 7.5. This process collected 5 mL aliquots of unretained proteins. Subsequently, a 50 mL elution of 5 mM HCl was used to collect 5 mL aliquots of retained proteins for analysis of the protein profile at 280 nm using a UV–visible spectrophotometer (DR 5,000, Hach). Aliquots that showed a protein peak of ≥ 800 nm and ≥ 80 nm (for non-retained and retained proteins, respectively) were collected and stored at –20 °C, with aliquots of retained proteins subsequently dialyzed against in 4 L of distilled water for 48 h and against in 4 L of 50 mM Tris-HCl buffer, pH 7.5, for 24 h at 4 °C, followed by lyophilization and storage at –20 °C, obtaining the TTI.
To ensure that the obtained molecule corresponds to the same molecule as the methodology proposed by Carvalho (Carvalho et al., 2016), characterization was carried out through antitryptic activity (Kakade et al., 1969); protein quantification (Bradford, 1976), and discontinuous and denaturing polyacrylamide gel (SDS-PAGE) (Laemmli, 1970).
2.2 Antitryptic activity
The antitryptic activity assay was performed using the methodology proposed by Kakade, Simons, and Liener (Kakade et al., 1969) to determine whether the TTI's primary function is to inhibit the enzyme trypsin.
This assay was performed in triplicate (for tubes containing the tests) and in duplicate (for tubes not containing the tests, called blanks). Aliquots of 10 µL of bovine trypsin solution (at a 0.3 mg/mL concentration), 120 µL of 2.5 mM HCL, 560 µL of 50 mM Tris-HCl buffer, pH 7.5, and 100 µL of EB, F1, F2, and TTI were incubated in a water bath (Tecnal – Te056), at 37 °C for 10 min. A control regarding enzyme activity was also performed, differing in the amount of buffer, which was 660 µL, since it did not receive any of the tests.
After this time, 500 µL of 1.25 mM BAPNA (Nα-Benzoyl-DL-arginine p-nitroanilide hydrochloride) was added, remaining in a water bath (Tecnal – Te056) at 37 °C for 15 min. Then, 120 µL of 30 % acetic acid was added to terminate the reaction. For blanks, the substrate was only added at the end of the procedure. The enzymatic activity profile was measured by spectrophotometry (UV–visible spectrophotometer DR 5,000, Hach) at 410 nm. The results were expressed in percentages.
2.3 Protein quantification
Protein quantification was performed according to the Bradford methodology (Bradford, 1976). A 96-well microplate was used, in which a standard curve was performed containing 10 µL of a solution containing bovine serum albumin (BSA) at different concentrations (0.05–0.50 mg/mL) in triplicate. A volume of 10 µL of EB, F1, F2, and TTI were added, and a serial dilution was made with 50 mM Tris-HCl buffer, pH 7.5 in the proportions of 1:2, 1:4, 1:8, and 1:16 for each one of the tests. For the blank, 0.9 % 150 mM saline solution was utilized, and for the tests, 50 mM Tris-HCl buffer, pH 7.5 was utilized.
Then, 200 µL of Bradford reagent (Coomassie brilliant blue G-250) was added, sealed with aluminum foil, and protected from light for 30 min. Then, the absorbance at 595 nm reading with a spectrophotometer (Absorbance microplate reader, Epoch, Biotek). Results were expressed in mg/mL.
2.4 Denaturing sodium dodecyl sulfate–polyacrylamide gel electrophoresis (SDS-PAGE)
This methodology was performed according to Laemmli (Laemmli, 1970) to determine the degree of purity and estimate the molecular mass of the proteins contained in CE, F1, F2, and TTI, for which a 12 % SDS-PAGE was performed. To measure the molecular weight of the proteins, 5 µL of Amersham ECL Rainbow Marker – High range (Sigma-Aldrich) was used as a parameter, which contains different molecular masses (225 kDa, 76 kDa, 52 kDa, 38 kDa, 31 kDa, 24 kDa, 17 kDa, and 12 kDa) and aliquots containing 10 µL of CE, F1 and F2, and 5 µL and 10 µL of proteins for TTI. The plates used in the gel measure 10 x 14 cm in size, with a thickness of 0.1 mm. The gel was run at 20 mA for 90 min. The SDS-PAGE was stained with a Coomassie blue dye solution that remained for 12 h, followed by washing the gel with a fixative solution and, thereafter, with distilled water.
2.5 In vitro hydrolysis of trypsin inhibitor isolated from tamarind seeds (TTI)
Proteolytic hydrolysis was based on the methodology proposed by INFOGEST (Brodkorb et al., 2019), with adaptation. The hydrolysis did not use fluids or bile salts, maintaining the other parameters of pH, time, temperature, and agitation, thus simulating the digestion process based on a well-established methodology.
This test consisted of three stages of digestion, simulating the GIT: oral, gastric, and intestinal. Sterilized distilled water was used as a control (without TTI addition), being submitted to the same conditions as the TTI (Fig. 2). During the gastric and intestinal phases, aliquots were taken at 20, 60, and 120 min for later analysis of the monitoring of the TTI hydrolysis pattern through the 15 % SDS-PAGE gel (Laemmli, 1970). Aliquots of the oral phase were not taken because there is no protein hydrolysis in this phase. At the end of the procedure, the samples were frozen at −80 °C to inactivate the action of the enzymes.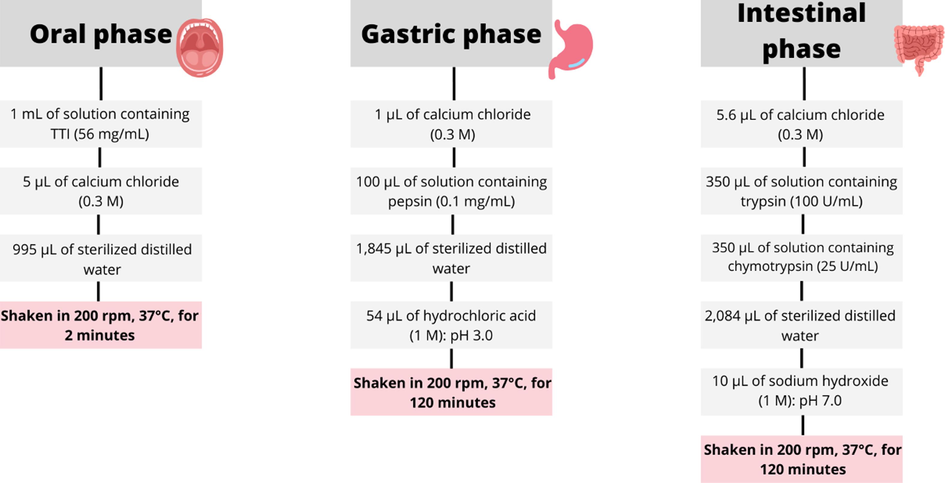
Flowchart of the in vitro hydrolysis steps of trypsin inhibitor from tamarind seeds.
2.6 Oral phase
The oral phase was carried out with 1 mL of TTI solution diluted in sterilized distilled water at a concentration of 56 mg/mL. Then, 5 µL of calcium chloride (0.3 M) and 995 µL of sterilized distilled water were added, resulting in a 2 mL final volume and a 28 mg/mL final concentration. The samples were shaken for 2 min at 200 rpm, at 37° C (magnetic stirring table with heating, Marconi).
2.7 Gastric phase
For the gastric phase, 1 µL of calcium chloride (0.3 M), 100 µL of a solution containing pepsin (0.1 mg/mL), and 1,845 µL of sterilized distilled water were added. For the pH 3.0 adjustment, 54 µL of 1 M hydrochloric acid were added. The final volume was 4 mL, and the final TTI concentration was 14 mg/mL. It remained under agitation at 200 rpm, at 37 °C (magnetic stirring table with heating, Marconi) for 120 min.
2.8 Intestinal phase
For the intestinal phase, 5.6 µL of 0.3 M calcium chloride, 350 µL of trypsin solution (100 U/mL), 350 µL of chymotrypsin solution (25 U/mL), and 2,084 µL of sterilized distilled water were added. Adding 10 µL of 1 M sodium hydroxide adjusts the pH to 7.0. The final volume was 5.6 mL, and the final TTI concentration was 7 mg/mL. Stirring was continued at 200 rpm, at 37 °C (magnetic stirring table with heating, Marconi) for 120 min.
2.9 Monitoring TTI in vitro hydrolysis
To characterize the hydrolysis pattern and enzymatic susceptibility of TTI, a 15 % SDS-PAGE gel was performed. A volume of 5 µL of Amersham ECL Rainbow Marker – High range (Sigma-Aldrich) was used as a parameter, which contains different molecular weights (225 kDa, 76 kDa, 52 kDa, 38 kDa, 31 kDa, 24 kDa, 17 kDa, and 12 kDa) and 10 µL of aliquots of the gastric and intestinal phases, according to collections at times of 20, 60, and 120 min. The plates used in the gel measure 10 x 14 cm in size, with a thickness of 0.1 mm. The gel was run at 25 mA for 100 min. The gel was stained with a Coomassie blue dye solution that remained for 12 h, followed by washing the gel with a fixative solution and distilled water.
2.10 In silico study
2.10.1 In silico cleavage of TTIp 56/287
For the present study, the theoretical model and the amino acid sequence of TTIp 56/287 were used according to Medeiros (de Medeiros et al., 2021). TTIp 56/287 was subjected to in silico cleavage using the ExPASy server and the PeptideCutter analysis tool to obtain the resulting peptides (Gasteiger et al., 2005). Based on the results of in vitro hydrolysis, cleavage was done by using a simultaneous combination of chymotrypsin and trypsin.
2.10.2 Selection of peptides for multiple alignments
Homology multiple alignments were performed using the Clustal Omega server (Thompson et al., 1994) to better visualize the precise positions of the amino acids present in the structure of the peptides derived from the primary structure of TTIp 56/287. The initial criterion for the selection of peptides generated by enzymatic cleavage was the presence of a sequence of eight or more amino acid residues in this step. For peptides with fewer than ten aminoacid sequences, glycine molecules (Gly) were added because the responsible server requires a minimum of ten amino acids to obtain the three-dimensional structure.
2.10.3 Modeling and validation of the structures obtained
As a second selection criterion for peptides generated from enzymatic cleavage, a new selection of peptides was carried out based on the presence in the same positions of the amino acid residues that showed the greatest potential for interaction between TTIp 56/287 and the insulin receptor (IR) (PDB ID 4OGA), according to Costa (Costa et al., 2022). They are the following amino acid residues: aspartate at position 7 (Asp7), glutamine at position 47 (Gln47), aspartate at position 145 (Asp145), arginine at position 59 (Arg59), and serine at position 34 (Ser34). These are the same positions in TTIp 56/287 (de Medeiros et al., 2021).
Modeling was then carried out to obtain the three-dimensional structure of the peptides using the server trRosetta (Yang et al., 2020). The MolProbity server was used to validate these structures. This server, evaluates the theoretical structure obtained by analyzing parameters such as the Ramachandran graph, residues with bad connections and angles, and the MolProbity score (Chen et al., 2010).
2.10.4 In silico characterization of peptides
Peptide calculator (PepCalc) was used to analyze the hydrophobicity characteristics (Innovagen, xxxx).
2.11 Molecular docking
Molecular docking was only performed to obtain the receptor-peptide complex using the Hdock server online (Yan et al., 2020). For this stage, the three-dimensional structures of the peptides selected according to the previous criteria were used. The crystalline structure of a molecular target involved in glycemic control, selected according to Costa (Costa et al., 2022), is the IR in complex with insulin PDB ID code 4OGA (Menting et al., 2014), 3.50 Å resolution, that was determined experimentally through x-ray crystallography, obtained from the RCSB Protein Data Bank (Berman et al., 2002). Water molecules, ions, and insulin were eliminated from the structure of the IR in an effort to eliminate components that could interfere with the interaction between the peptides and the IR. The structure with the highest number of amino acids in the peptides, such as those found in the TTIp, developed with the integral protein and also demonstrated interaction with the IR, according to a previous study by Costa (Costa et al., 2022). Furthermore, based on the analysis of these structures, which evaluates the obtained theoretical structure, the Ramachandran graph, residues with poor connections and angles, and the MolProbity score (Arfken et al., 2012), were chosen for molecular dynamics simulation. The results were analyzed by Discovery Studio software (Version 4.5) (Biovia, xxxx).
2.12 Molecular dynamics
The molecular dynamics simulations were performed by the GROningen MAChine for Chemical Simulations (GROMACS) version 2021.2 (Spoel et al., 2005) software, implemented with the Assisted Model Building and Energy Refinement 03 (AMBER03) force field (Duan et al., 2003). Then, the triclinic box simulations were built with the 8 × 8 × 8 nm dimensions for the Insulin-IR, Peptidetrypchymo59-IR, and Insulin-Peptidetrypchymo59-IR systems. Posteriorly, the 10,732 water molecules described by the Transferable Intramolecular Potential with 3 Points (TIP3P) and 16 sodium ions were added to solvation and neutralized the systems (Jorgensen et al., 1983), respectively. Posteriorly, the geometry of the system was performed using the steepest descent (Arfken et al., 2012) and gradient conjugate (Hestenes and Stiefel, 1952) algorithms, both with an energy tolerance of 10 kJ mol−1 nm−1 and the 105 steps. Subsequently, the equilibrium dynamics were simulated at 200 ps and divided into two steps. In the first step, the ensemble of particle number, system volume, and temperature (NVT) was performed through the Nosé-Hoover (Hoover, 1985) thermostat at temperature of 310 K, followed by the ensemble of number of particles, constant pressure, and temperature (NPT) using the Parrinello-Rahman barostat at 1.0 bar of pressure (Nosé and Klein, 1983). Finally, the production step was performed in 200 ns using the NVT ensemble and simulated in three replicates for each system. The motion equation with a time interval of 2.0 fs was integrated using the Leap-Frog algorithm (Gunsteren and Berendsen, 1988). The Ewald Particle Mesh Sum (PME) was used to model the long-range interactions, with a cutoff of 1.2 nm (Darden et al., 1993). Using the same threshold, van der Waals interactions were calculated. The LINCS algorithm was used to constrain the bonds involving hydrogen atoms (Hess et al., 1997).
The RMSD analysis was performed based on C- as a reference throughout the whole trajectory, utilizing the initial structure of the protein as a starting point.
In order to determine the total energy of interaction between the complexes, the IPE (kJ/mol) was used, calculated using the Equation (1) (Amorim-Carmo et al., 2019):
2.12.1 Interaction energy calculation by the semi-empirical approach.
The Insulin-IR, Peptidetrypchymo59-IR, Insulin-Peptidetrypchymo59-IR complexes without ions and water molecules in the last frame (200,000 ps) from molecular dynamics simulations were utilized as starting points for the interaction energy calculations. Then, the Parametric Method (PM7) was employed to optimize these complexes in the gas phase through MOPAC 2016 software (Stewart, 1997). Posteriorly, the peptide or insulin was moved around 100 Å away from the insulin receptor and the single point energy calculation was performed with the same method. The interaction energy was obtained by the difference between the final heat of the formation of the complex and the final heat of the formation of the complex separate of peptide or insulin, represented by Equation (2).
3 Results
Prospection of peptides derived from trypsin inhibitor from tamarind seeds with potential for interaction with the insulin receptor (IR).
3.1 Obtaining trypsin inhibitor from tamarind seeds (TTI)
The antitryptic activity assay showed that 0.7 mg of TTI could inhibit 100 % (381.65 UI/mg) of the enzymatic activity of trypsin. The denaturing sodium dodecyl sulfate–polyacrylamide gel electrophoresis (SDS-PAGE) at 12 % showed the isolation of TTI, which had a molecular mass of around 20 kDa (Fig. 3).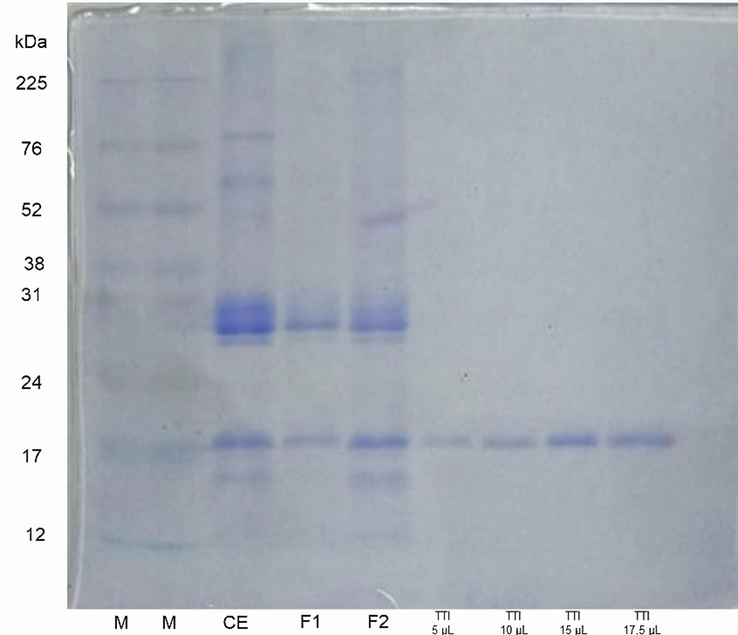
Denaturing sodium dodecyl sulfate–polyacrylamide gel electrophoresis (SDS-PAGE) at 12% stained with Coomassie blue. M: marker (size in kDa); CE: crude extract; F1: fraction 1 (precipitate 1 with ammonium sulfate in the range of 0–30%); F2: fraction 2 (precipitate 2 with ammonium sulfate in the range of 30–60%); TTI: trypsin inhibitor from tamarind seeds.
3.2 In vitro hydrolysis of TTI
The TTI remained intact throughout the gastric phase when the pattern of hydrolysis and enzymatic susceptibility of the TTI was monitored using SDS-PAGE at 15 %, indicating its resistance to the action of the enzyme pepsin. However, during the intestinal phase, the TTI protein band is not evident at any of the times analyzed, which shows that it is susceptible to the chymotrypsin and trypsin enzymes in the gut (Fig. 4).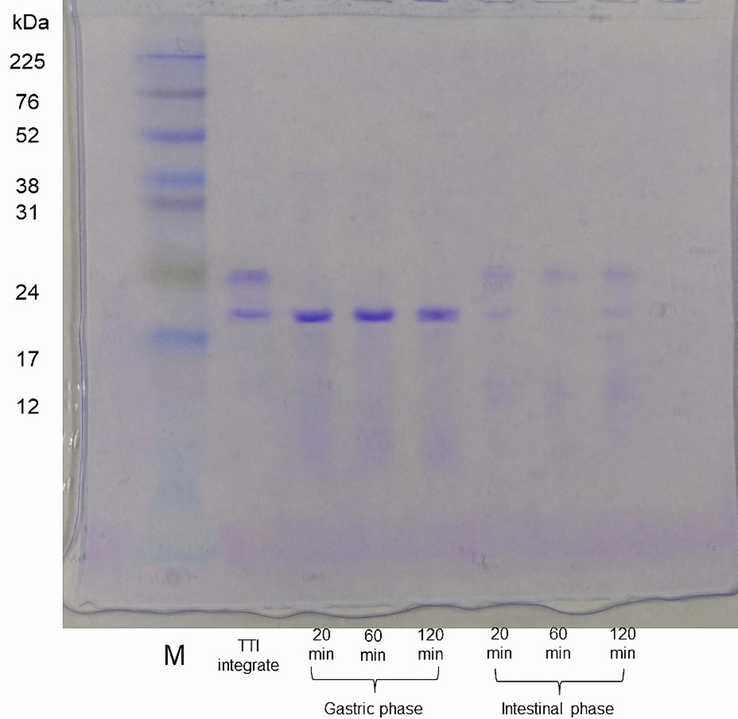
SDS-PAGE at 15% stained with Coomassie blue. M: marker (size in kDa); TTI intact (no enzymatic hydrolysis); TTI hydrolyzed with pepsin, evaluated at 20, 60, and 120 min (gastric phase); TTI hydrolyzed with chymotrypsin and trypsin, evaluated at 20, 60, and 120 min (intestinal phase).
3.3 In silico cleavage of TTIp 56/287, selection of peptides and multiple alignments
Cleavage of TTIp 56/287 with the simultaneous combination of chymotrypsin and trypsin enzymes generated 52 peptides (Table S1). Six of the 52 peptides were selected (Peptidetrypchymo12, Peptidetrypchymo27, Peptidetrypchymo43, Peptidetrypchymo59, Peptidetrypchymo91, and Peptidetrypchymo181), following the pre-established criteria. These peptides were aligned with the complete sequence of TTIp 56/287 to identify the position of amino acid residues in the respective peptide sequences (Fig. S1).
3.4 Modeling and validation of the obtained structures
Three peptides (Table 1) with a higher potential to interact with the insulin receptor (IR) (PDB ID 4OGA) were chosen after the alignment of peptides cleaved by chymotrypsin and trypsin enzymes combined with TTIp 56/287. Taking into account the Costa study (Costa et al., 2022); these peptides were chosen in the following order of highest interaction potential: Aspartate (D) Position: 7, Glutamine (Q) Position: 47, Aspartate (D) Position: 145, Arginine (R) Position: 59, and Serine (S) Position: 34 are the order of the amino acids. *Position of amino acids when aligned with trypsin inhibitor purified from tamarind seeds [model number 56, conformation number 287 (TTIp 56/287)].
Peptides
Cleavage enzymes
Position of the cleavage site
Resulting peptide sequence
The most interacting amino acids
Position*
Peptidetrypchymo12
Chymotrypsin
12
DTVHDTDGQVPL
Arpartate
Glutamine1, 5 and 7
9
Peptidetrypchymo43
Chymotrypsin
43
SNDDDGNCPL
Serine
Aspartate34
36, 37 and 38
Peptidetrypchymo59
Trypsin
59
TVSQTPIDIPIGLPVR
Serine
Glutamine
Aspartate
Arginine46
47
51
59
Fig. 5 and Table 2 show the three-dimensional structures and theoretical validations of these three peptides that have the potential to interact with the IR (PDB ID 4OGA).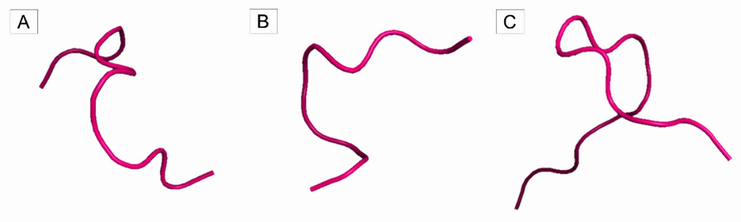
Three-dimensional structure of peptides obtained employing theoretical cleavage of TTIp 56/287 with combined enzymes chymotrypsin and trypsin. (A) Peptidetrypchymo12: peptide 1 cleaved by trypsin and chymotrypsin; (B) Peptidetrypchymo43: peptide 2 cleaved by trypsin and chymotrypsin; (C) Peptidetrypchymo59: peptide 3 cleaved by trypsin and chymotrypsin.
Peptides
Ramachandran favorite
Waste with bad connections
Residues with bad angles
Punctuation MolProbity
Peptidetrypchymo12
100.00 %
0.00 %
0.00 %
0.50
Peptidetrypchymo 43
100.00 %
0.00 %
0.00 %
0.50
Peptidetrypchymo 59
92.86 %
0.00 %
0.00 %
0.95
3.5 In silico characterization of peptides
The hydrophobic characteristics of the peptides obtained through the in silico cleavage of TTIp 56/287 were evidenced (Fig. 6). It is possible to observe that Peptidetrypchymo59 is the one that presents the most polar (n = 4) and amphipathic (n = 6) amino acids when compared to the other peptides.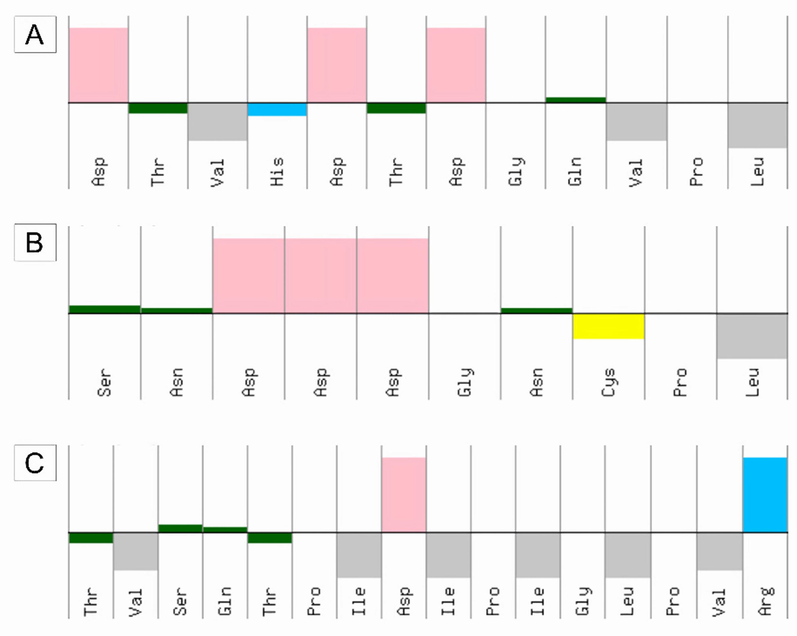
Characteristics of hydrophobicity peptides generated by theoretical cleavage of TTIp 56/287 with chymotrypsin and trypsin enzymes combined. (A) Peptidetrypchymo12; (B) Peptidetrypchymo43; (C) Peptidetrypchymo59. The upper part represents hydrophilicity, and the lower part represents hydrophobicity. The colors represent the characteristics of the amino acid residues present in the peptides. Pink – acids; Blue – basic; Gray – amphipathic; Dark green – polar; yellow – cysteine.
3.6 Molecular docking
Molecular docking predicts how the peptides will bind with the IR (PDB ID 4OGA) and how strongly they will bind to each other (Fig. 7 and Table 3).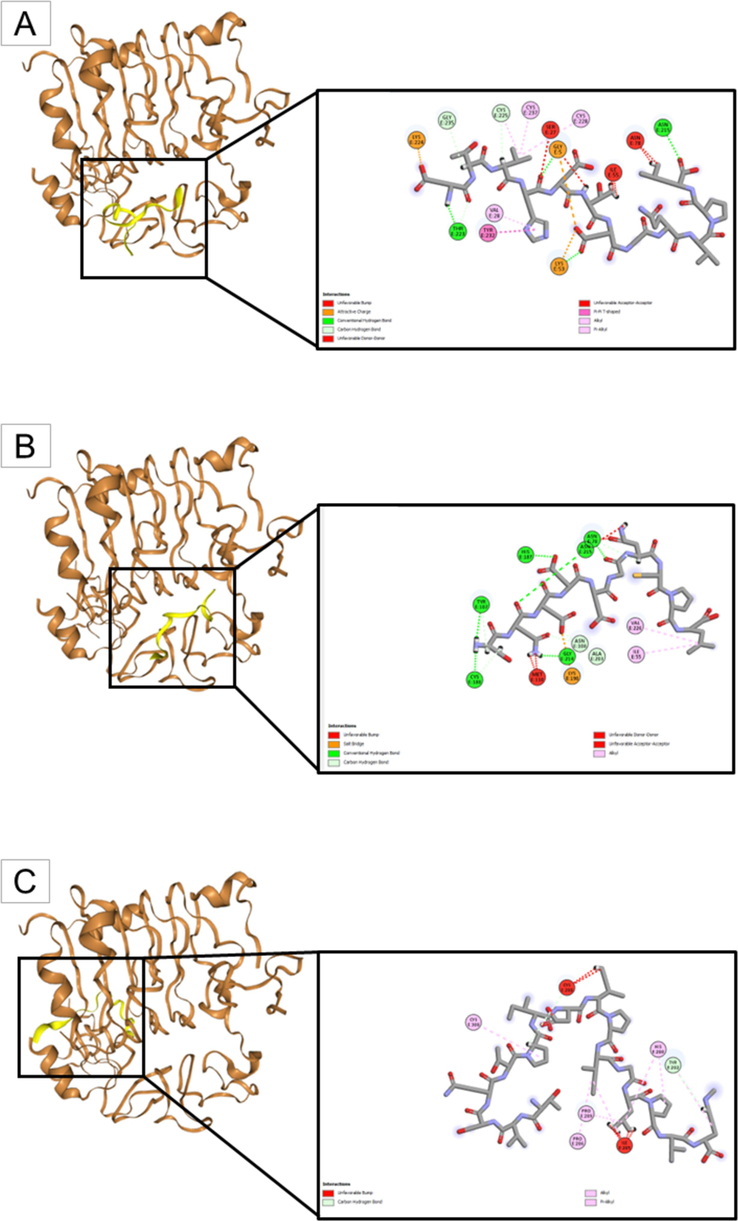
Molecular docking of peptides obtained through theoretical cleavage of TTIp 56/287 with the combined enzymes, chymotrypsin and trypsin, and the insulin receptor (PDB ID 4OGA). (A) The insulin receptor (in brown) interacting with Peptidetrypchymo12 (in yellow); (B) The insulin receptor (in brown) interacting with Peptidetrypchymo43 (in yellow); and (C) The insulin receptor (in brown) interacting with Peptidetrypchymo59 (in yellow).
Peptides
Docking Score
Confidence score
Peptidetrypchymo12
−160.60
0.5528
Peptidetrypchymo 43
−137.77
0.4392
Peptidetrypchymo 59
−175.53
0.6249
Observing the data obtained with molecular docking, it is evident that the interaction between Peptidetrypchymo59 and IR (PDB ID 4OGA) presented the best characteristics for the evaluated parameters. It presented the most negative docking score, showing that it has the highest possibility of binding when compared to the other peptides, as well as the highest confidence score (being in the range of 0.5 to 0.7), which confirms once again the possibility of bonding between molecules. Additionally, it was noted that the amino acid residues histidine (His280), proline (Pro286 and Pro289), cysteine (Cys308), and tyrosine (Tyr292) exhibited the strongest interactions with the peptide through alkyl and pi-alkyl bonds, as well as a carbon-hydrogen bond. Thus, Peptidetrypchymo59 was selected for molecular dynamics simulation with IR (PDB ID 4OGA).
3.7 Molecular dynamics
Next, the structural behavior is demonstrated using molecular dynamics simulation, referring to the beginning and the end of the simulation of the complexes: Insulin-IR; Peptidetrypchymo59-IR; Insulin-Peptidetrypchymo59-IR (Fig. 8). It is possible to observe that the peptide (Peptidetrypchymo59) (Fig. 8C and 8D) presented an interaction with the IR (PDB ID 4OGA) in regions different from those of insulin (Fig. 8A and 8B). This can also be observed in Fig. 8E and 8F, which refer to the Insulin-Peptidetrypchymo 59-IR complex.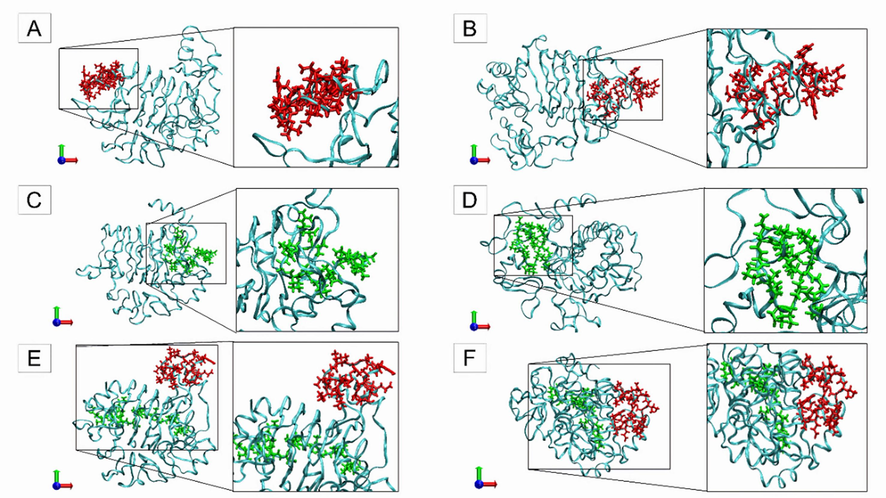
Initial and final structures of each complex were obtained through molecular dynamics simulation of the interaction between insulin, insulin receptor (PDB ID 4OGA), and a theoretical model of the peptide (Peptidetrypchymo59) derived from the trypsin inhibitor purified from TTIp 56/287. (A) Initial period (0 ns) of molecular dynamics simulation of the complex formed by insulin and insulin receptor (PDB ID 4OGA). (B) Final period (200 ns) of molecular dynamics simulation of the complex formed by insulin and insulin receptor (PDB ID 4OGA). (C) Initial period (0 ns) of molecular dynamics simulation of the complex formed by Peptidetrypchymo59 and insulin receptor (PDB ID 4OGA). (D) Final period (200 ns) of molecular dynamics simulation of the complex formed by Peptidetrypchymo59 and insulin receptor (PDB ID 4OGA). (E) Initial period (0 ns) of molecular dynamics simulation of the complex formed by insulin, Peptidetrypchymo59, and insulin receptor (PDB ID 4OGA). (F) Final period (200 ns) of molecular dynamics simulation of the complex formed by insulin, Peptidetrypchymo59, and insulin receptor (PDB ID 4OGA).
The RMSD analysis (Fig. 9) was performed using the c-α of the target as a reference to analyze the stability of the simulated complexes. It was observed that the insulin-IR (Fig. 9A) and insulin-Peptidetrypchymo59-IR (Fig. 9C) complexes reached equilibrium around 125 ns. On the other hand, the complex formed by Peptidetrypchymo59-IR (Fig. 9B) had already reached equilibrium at the start of the simulation, around 25 ns. Furthermore, the average RMSD values were 4.21 Å, 3.30 Å, and 5.56 Å for the insulin-IR, Peptidetrypchymo59-IR, and insulin-Peptidetrypchymo59-IR complexes, respectively. Molecular dynamics simulations of the complexes were performed in triplicates, these are shown by the black, red, and green lines.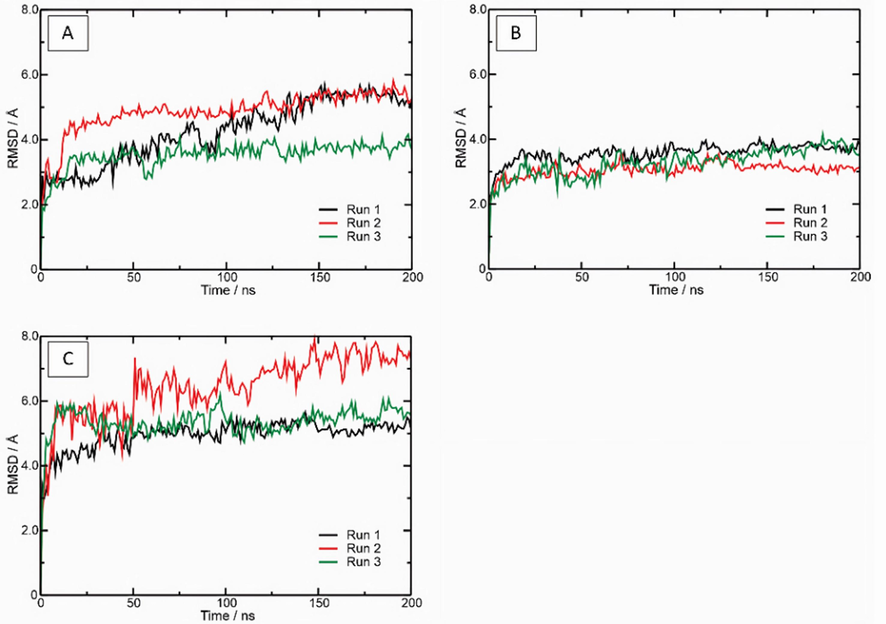
Root Mean Square Deviations (RMSD) determination of molecular dynamics simulations of the interaction between insulin, the insulin receptor (PDB ID 4OGA), and the theoretical model of the peptide (Peptidetrypchymo59) derived from TTIp 56/287. (A) Complex formed by insulin and the insulin receptor (PDB ID 4OGA). (B) Complex formed by Peptidetrypchymo59, and insulin receptor (PDB ID 4OGA). (C) Complex formed by insulin, Peptidetrypchymo59, and insulin receptor (PDB ID 4OGA). The molecular dynamics simulations were realized in three replicates (black, red, and green).
The IPE between insulin-IR (PDB ID 4OGA) was −714.06 kJ mol−1, whereas the IPE between Peptidetrypchymo59-IR (PDB ID 4OGA) was −723.37 kJ mol−1 (Table 4). For the insulin-peptidetrypchymo59-IR complex, the interaction between the insulin and IR registered IPE value of −729.88 kJ mol-1, indicating that the presence of peptidetrypchymo59 did not change interaction force between these components. On the other hand, for the same system, it was observed that the presence of insulin occasioned a reduction in the IPE values (–1165.37 kJ mol−1) between the Peptidetrypchymo59 and IR, indicating an increase in interaction force. The contribution of insulin and peptide IPE to uphold the stability of this complex was examined in the interaction between insulin, peptide, and receptor (Fig. S2).
Systems
Interactions
Insulin-IR / kJ/mol
Peptidetrypchymo59-IR / kJ/mol
Insulin-IR
−714.06 (±110.51)
Peptidetripquimo59-IR
−723.37 (±154.97)
Insulin-IR-Peptidetripquimo59
−729.88 (±122.86)
−1165.30 (±199.86)
The amino acid residues with the lowest IPE were identified. The lowest IPE values for insulin were found for cysteine 20 (Cys20), glutamate 17 (Glu17), and tyrosine 19 (Tyr19) (Table S2). The three amino acids with the lowest IPE values for Peptidetrypchymo59 were arginine 16 (Arg16), threonine 1 (Thr1), and valine 2 (Val2) (Table S2).
Furthermore, considering the interaction with the three complexes formed, amino acid residues with a lower EPI were identified in comparison to those present in the structure of the insulin receptor (Fig. 10 and Table S3). In the insulin-IR complex (Fig. 10A), the residues with the lowest IPE values were cysteine (Cys7), arginine (Arg22), and asparagine (Asn711). The complex formed by Peptidetrypchymo59-IR (Fig. 10B), asparagine (Asn711), tyrosine (Tyr26), and arginine (Arg22) residues were the ones that presented the lowest IPE values. Finally, the complex formed by insulin, Peptidetrypchymo59-IR (Fig. 10C), cysteine (Cys159), and glutamate (Glu180) residues had the lowest IPE values.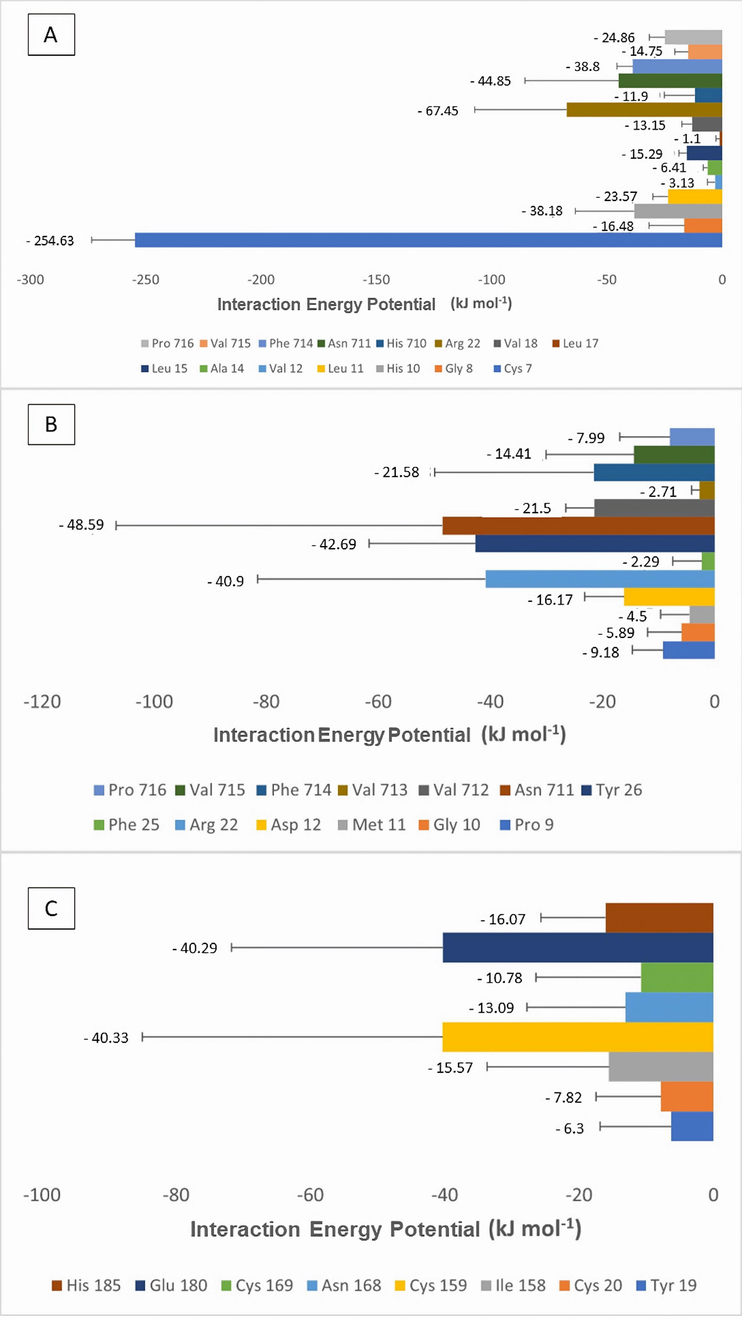
Interaction Potential Energy (IPE) values of the amino acid residues present in the insulin receptor (PDB ID 4OGA) in complex with insulin and the theoretical model of the Peptidetrypchymo59 derived from the TTIp 56/287. (A) Complex formed by insulin and insulin receptor (PDB ID 4OGA). (B) Complex formed by Peptidetrypchymo59 and insulin receptor (PDB ID 4OGA). (C) Complex formed by insulin, Peptidetrypchymo59 and insulin receptor (PDB ID 4OGA).
3.8 Interaction energy calculation by the semi-empirical approach
Table 5 shows that the interaction energy values obtained by the PM7 calculations were determined through the difference between the final formation of complexes and the final formation of separate values for the Insulin-IR, Peptidetrypchymo59-IR, and Insulin-Peptidetrypchymo59-IR systems. The interaction energy values were −404.72, −1231.44, and −992.24 kJ mol−1 for the Insulin-IR, Peptidetrypchymo59-IR, and Insulin-Peptidetrypchymo59-IR systems, respectively. Insulin-IR: Complex formed by insulin and insulin receptor (PDB ID 4OGA); Peptidetrypchymo59-IR: Complex formed by Peptidetrypchymo59 and insulin receptor (PDB ID 4OGA). Insulin-Peptidetrypchymo59-IR: Complex formed by insulin, Peptidetrypchymo59, and insulin receptor (PDB ID 4OGA).
Systems
/ kJ/mol
/ kJ/mol
Interaction energy
/ kJ/mol
Insulin-IR
−137801.33
−137396.61
−404.72
Peptidetrypchymo59-IR
−126433.23
−125201.79
−1231.44
Insulin-Peptidetrypchymo59-IR
−143220.72
−142228.48
−992.24
4 Discussion
TTI has been shown to be a promising molecule that has properties to improve glycemic control (Carvalho et al., 2016; Costa et al., 2022; Matias et al., 2019; Aguiar et al., 2021). In addition, TTI has been explored in many studies due to its low toxicity and bioactive properties, according to the results obtained in an experimental model (Carvalho et al., 2016; Carvalho et al., 2019; de Medeiros et al., 2018; JA do NC Ribeiro, AC Serquiz, PFS Silva, PBBM Barbosa, TBM Sampaio, RF de Araújo Junior, , 2015; RO de A Costa, LLR Matias, TS Passos, JLC de Queiroz, FMC de Carvalho, BLL Maciel, et al. Safety and potential functionality of nanoparticles loaded with a trypsin inhibitor isolated from tamarind seeds. Future Foods 1–2, et al., 2020; Costa et al., 2018; Lima et al., 2021). In the present work, the TTI obtained presented the same characteristics as those described in previous studies, showing an isolated protein band with a molecular mass of 20 kDa and conserved antitryptic activity, thus ensuring the obtainment of the same molecule obtained previously (Carvalho et al., 2016; JA do NC Ribeiro, AC Serquiz, PFS Silva, PBBM Barbosa, TBM Sampaio, RF de Araújo Junior, , 2015).
Therefore, given the possibility of an antihyperglycemic effect (Costa et al., 2022), considering previous studies related to the bioactive properties of TTI and knowing that it is a protein composed of 184 amino acid residues, in this study, TTI-derived peptides have been prospected in silico as a strategy for identifying the ones that can act in glycemic control.
Thus, to prospect in silico TTI-derived peptides with anti-diabetes potential, the first step was to confirm the pattern of enzymatic susceptibility of TTI to human proteolytic digestion, since in the preliminary study TTI was administered intact (Costa et al., 2022), and now it would be necessary to perform the in silico cleavage of this molecule.
The theoretical prospection of peptides allows for structural knowledge, sequence length, physical and chemical characteristics, as well as the generation of conformations that can elucidate the prediction of behavior in computer simulations, optimizing time and resources that are important components for drug development (Tu et al., 2018). These theoretical structures formed from peptides are an effective way to elucidate the characteristics of the geometry, be able to predict the behavior of the generated conformations, and provide synergy between theory and experiment (Chass et al., (2004); Chass et al., 2002). Thus, the in vitro production of peptides can be facilitated, supporting future experimental studies for evaluating the behavior of peptides in a biological context (Tu et al., 2018).
Therefore, when evaluating the monitoring of the in vitro proteolytic digestion of the TTI, it was observed that only in the intestinal phase, in which the simultaneous combination of the proteolytic enzymes trypsin and chymotrypsin was used, the TTI was hydrolyzed, evidencing its enzymatic susceptibility only to these enzymes. This same pattern of TTI susceptibility to trypsin and chymotrypsin (Fig. 4) was demonstrated, based on the INFOGEST methodology, by Oliveira (de Oliveira and AM de S Nascimento, ABS Luz, AJFC Aguiar, MSR Lima, LLR Matias, , 2023). This study, however, used the pancreatin enzyme in the intestinal phase, which is a combination of several enzymes that also contained trypsin and chymotrypsin.
Still, after defining the enzymes for in silico cleavage, the search for peptides obtained by theoretical cleavage was carried out. The selection of the one that had the greatest potential to interact with an IR considering the lower IPE of amino acids according to the previous study by Costa (Costa et al., 2022) was: Aspartate at position 7 (Asp7), Glutamine at position 47 (Gln47), Aspartate at position 145 (Asp145), Arginine at position 59 (Arg59), and Serine at position 34 (Ser34). Thus, the peptide Peptidetrypchymo59, which contains residues of amphipathic amino acids (mostly), acidic, and basic, was selected for the simulation by molecular dynamics because it stands out when compared to the others and because it has the lowest docking score evaluated in the complex with the IR (PDB ID 4OGA).
Molecular docking is a commonly used technique for drug discovery, despite its limitations regarding receptor flexibility (Meng et al., 2011). The selection of Peptidetrypchymo59 for molecular dynamics simulation was an initial strategy for discovering peptides that have the potential to interact with the insulin receptor; however, future analyses are needed to confirm this potential for all other peptides obtained.
In the molecular dynamics simulations, Peptidetrypchymo59 showed better stability when interacting with the IR compared to the complex formed by insulin-IR, as shown in the RMSD analysis, in which a balance of the system was evidenced from the beginning to the end of the simulation (Fig. 9). This complex also showed an affinity with the IR that can be compared to that of insulin because the IPE values of these complexes were very close (Table 4). By including Peptidetrypchymo59 in the complex formed by insulin and IR (Insulin-Peptidetrypchymo59-IR complex), it was noticed that there was also balance in the system that was reached at 125 ns and that the interaction potential seemed to be better since the energy of the system was even lower when compared to the isolated systems, suggesting a synergistic interaction, because when the peptide joins the insulin linked to the IR, it enhances the stability of the system even more (Fig. 9). Furthermore, when separately measuring the energy contribution of Peptidetrypchymo59 and insulin in this complex formed by these three components, the peptide seemed to overcome the IPE of insulin with the receptor, as observed by the lower IPE, reinforcing once again the potentiation of the system in the presence of the peptide through a synergistic interaction (Fig. S2).
When analyzing the IPE of the Peptidetrypchymo59 and IR complex, the amino acid residues Arginine at position 16 (-209.07 kJ mol−1), Threonine at position 1 (-148.54 kJ mol−1) and Valine in position 2 (-94.53 kJ mol−1), present in the peptide, were the residues with the lowest IPE, but it is important to highlight that all amino acid residues of this peptide interacted with the IR. Costa (Costa et al., 2022) carried out a molecular dynamics simulation of TTIp 56/287 (whole molecule) with the IR. It was observed that the residues that presented the lowest IPE were: Serine at position 34 (- 323.28 kJ mol−1), Arginine at position 59 (-275.61 mol−1), Aspartate at position 145 (-106.28 kJ mol−1), Glutamine at position 47 (-91.16 mol−1) and Aspartate at position 7 (-86.17 kJ mol−1), respectively, with Arginine being the similar amino acid residue in these two studies.
Furthermore, the interaction energy simulations realized by the PM7 method showed that the Peptidetrypchymo59 registered the highest interaction potential with the IR considering the Peptidetrypchymo59-IR complex, demonstrating a greater interaction potential when compared to insulin in the Insulin-IR complex (Table 5). But when the peptide was added to the complex made by insulin and the insulin receptor, the interaction energy did not exceed the value of the complex made by all three components. However, the interaction was more stable than the interaction between insulin and the insulin receptor, which strengthens the interaction potential of the peptide. This analysis is based on a semi-empirical method that is more precise than molecular dynamics simulations based on molecular mechanics.
It is possible to notice that insulin and Peptidetrypchymo59 bound in distinct interaction regions of the IR (Fig. 8), which was also demonstrated by Costa (Costa et al., 2022), who used the whole molecule. This could be proven when it was observed that the amino acid residues in the IR that showed greater interaction with the insulin-IR and Peptidetrypchymo59-IR complexes were mostly different.
Thus, according to the results, Peptidetrypchymo59 may act as an insulin mimetic molecule. The interaction between Peptidetrypchymo59 and the binding pocket may favor a synergistic action on insulin, considering that the binding pocket has a specificity of interaction with insulin (extracellular domain of the IR) present in the crystalline structure of the IR PDB 4OGA (Menting et al., 2014). This could explain the glucose decrease in plasma independent of the insulin increase observed in an experimental study with diet-induced T2DM (Costa et al., 2022). In addition, by interacting with the specific region of insulin signal transduction present in the structure of the IR, it can trigger the GLUT-4 signaling pathway, thus contributing to glycemic control (Menting et al., 2014; Gonzalez and McGraw, 2009). However, in the present study, it was not possible to carry out this analysis.
Sakkiah et al. (Sakkiah et al., 2021) performed molecular docking, MD simulations, and quantum mechanical calculations to elucidate agonist and antagonist binding patterns in Estrogen Receptor alpha (ER-alpha). The ligands 17beta-estradiol (E2) and 4-hydroxytamoxifen (OHT). The results revealed that OHT binds ER-alpha more tightly in the agonist conformer, while E2 assumes the agonist conformer. N-(3-ethoxy-phenyl)-4-pyrrolidin-1-yl-3-trifluoromethyl-benzamide (EPPTB), a known selective potent antagonist of the Trace amine-associated receptor 1 (TAAR1). The MM-GBSA binding energies and docking scores showed that EPPTB exhibited stronger bindind affinity to TAAR1, corroborating previous experimental results (Liao et al., 2022). Based on our findings on binding energy (Table 4), we can conclude that the peptide Peptidetrypchymo59 has the potential to effectively inhibit the action of IR.
In the search for hypoglycemic peptides, bitter melon (Momordica charantia) is well known for its antidiabetic properties. It has been studied using an in silico approach to prospect peptides derived from the P-polypeptide, using the IR as one of the therapeutic targets. Five peptides generated showed a strong interaction with IR: Serine at position 1,270, Aspartate at position 1,143, Glutamate at position 1,108, Glutamate at position 1,115, Histidine at position 1,057, Threonine at position 1,345, and Threonine at position 1,145 as the residues with the best interaction. When analyzing the RMSD, which was 50 ns throughout the simulation by molecular dynamics, no large deviations were observed, (Arif et al., 2021) ] indicating that the simulation was stable.
Whereas the TTI protein shows, among many effects, controlling blood glucose feature, prospective, through the in silico approach, of its derived peptides contributes to the advancement of studies that search for anti-diabetes therapeutic agents. Since molecular dynamics simulation with the IR could not be performed on the other peptides produced by in silico cleavage of TTIp 56/287, it was necessary to develop strategies to prioritize, at present, the selection of the peptide with the greatest potential for interaction with the IR. These results may inspire future in vitro studies to investigate the products derived from the theoretical cleavage of TTIp 56/287 using trypsin and chymotrypsin enzymes. The goal would be to synthesize peptides based on the amino acid sequence of Peptidetrypchymo59, assess the potential interaction of the peptide with the IR, and evaluate its impact in experimental models of DM1 or DM2.
5 Conclusion
The obtained results demonstrated the efficacy of the in vitro simulation of hydrolysis, which allowed the monitoring of the enzymatic susceptibility of the TTI as demonstrated by the action of the intestinal enzymes trypsin and chymotrypsin since hydrolysis occurred only in the intestinal phase, thereby facilitating the selection of enzymes for in silico cleavage.
The in silico study indicated a stronger interaction between the Peptidetrypchymo59 obtained through the theoretical cleavage of TTIp 56/287 presented by molecular dynamics and the IR than between the insulin complex and the IR. Furthermore, it has been noted that the peptide and insulin interact with the IR in a different region of the complex formed by the three elements (insulin-Peptidetripchymo59-IR) without affecting the stability of the complex, suggesting that the peptide and insulin work synergistically. The semi-empirical method also revealed that Peptidetrypchymo59 has a high interaction potential with the IR. Consequently, the results of this study suggest that Peptidetrypchymo59 is a potential therapeutic agent for the treatment of DM1 and DM2.
These findings aid in the search for novel antidiabetic agents and point the way toward future preclinical and later clinical studies aiming at DM therapy through the exploration of the novel functionalities of peptides derived from TTIp 56/287.
This research was funded by the Coordenação de Aperfeiçoamento de Pessoal de Nível Superior (Finance Code 001-CAPES) and supported by Conselho Nacional de Desenvolvimento Científico e Tecnológico (CNPq), process 303094/2022–2.
CRediT authorship contribution statement
Ana Francisca T. Gomes: Conceptualization, Formal analysis, Funding acquisition, Supervision, Writing – original draft, Writing – review & editing. Wendjilla F. de Medeiros: Methodology. Lucas L. Bezerra: Software, Validation. Anna Beatriz S. Luz: Methodology. Francisco C. de Sousa Junior: Resources. Sancha H. de L. Vale: Writing – original draft, Writing – review & editing. Elizeu A. dos Santos: Resources. Norberto de K. V. Monteiro: Software, Validation. Ana Heloneida de A. Morais: Conceptualization, Formal analysis, Funding acquisition, Supervision, Writing – original draft, Writing – review & editing.
Declaration of Competing Interest
The authors declare that they have no known competing financial interests or personal relationships that could have appeared to influence the work reported in this paper.
References
- Beneficial effects of Tamarind trypsin inhibitor in chitosan-whey protein Nanoparticles on hepatic injury induced high glycemic index diet: a preclinical study. Int J Mol Sci. 2021;22:9968.
- [CrossRef] [Google Scholar]
- American Diabetes Association (ADA). Diagnosis and Classification of Diabetes Mellitus. Diabetes Care 37 (2014) 81–90. doi: 10.2337/dc14-S081.
- American Diabetes Association (ADA). 2. Classification and Diagnosis of Diabetes: Standards of Medical Care in Diabetes—2022. Diabetes Care 45 (2022) 17–38. doi: 10.2337/dc22-S002.
- Potent and broad-Spectrum antimicrobial activity of analogs from the scorpion peptide stigmurin. Int J Mol Sci. 2019;20:623.
- [CrossRef] [Google Scholar]
- GB Arfken, HJ Weber, FE Harris. Mathematical Methods for Physicists: A Comprehensive Guide. 7 ed. 2012. doi: 10.1016/C2009-0-30629-7.
- R. Arif S. Ahmad G. Mustafa H.S. Mahrosh M Ali,MT Ul Qamar, et al. Molecular docking and simulation studies of antidiabetic agents devised from hypoglycemic polypeptide-P of Momordica charantia Biomed Res Int 2021 1 15 10.1155/2021/5561129.
- The protein data Bank. Acta Crystallogr D Biol Crystallogr. 2002;58:899-907.
- [CrossRef] [Google Scholar]
- D Biovia, H Berman, J Westbrook, Z Feng, G Gilliland, T Bhat, et al. Dassault Systèmes BIOVIA, Discovery Studio Visualizer. Dassault Systèmes. Available from: https://www.3ds.com/products/biovia/discovery-studio/visualization. (accessed on 03/15/2024).
- Insulin receptor signaling in Normal and insulin-resistant states. Cold Spring Harb Perspect Biol. 2014;6:1-23.
- [CrossRef] [Google Scholar]
- Rapid and sensitive method for the quantitation of microgram quantities of protein utilizing the principle of protein-dye binding. Anal Biochem. 1976;72:248-254.
- [CrossRef] [Google Scholar]
- A. Brodkorb L. Egger M. Alminger P. Alvito R. Assunção S. Ballanceet al. INFOGEST static in vitro simulation of gastrointestinal food digestion Nat Protoc 14 2019 991 1014 10.1038/s41596-018-0119-1.
- A trypsin inhibitor from Tamarind reduces food intake and improves inflammatory status in rats with metabolic syndrome Regardless of weight loss. Nutrients. 2016;8:1-14.
- [CrossRef] [Google Scholar]
- Anti-TNF-α agent tamarind kunitz trypsin inhibitor improves lipid profile of wistar rats presenting dyslipidemia and diet-induced obesity regardless of PPAR-γ induction. Nutrients. 2019;11:512.
- [CrossRef] [Google Scholar]
- Food-derived bioactive peptides in human health: challenges and opportunities. Nutrients. 2018;10:1-17.
- [CrossRef] [Google Scholar]
- G.A. Chass C.N.J. Marai D.H. Setiadi I.G. Csizmadia A.G. Harrison A. Hartree-Fock MP2 and DFT computational study of the structures and energies of ″b2 ions derived from deprotonated peptides. a comparison of method and basis set used on relative product stabilities J Mol Struc-THEOCHEM 675 (2004) 149 162 10.1016/j.theochem.2003.12.040.
- Fragmentation reactions of a 2 ions derived from deprotonated dipeptides- a synergy between Experiment and theory. J Phys Chem A. 2002;106:9695-9704.
- [CrossRef] [Google Scholar]
- MolProbity: all-atom structure validation for macromolecular crystallography. Acta Crystallogr D Biol Crystallogr. 2010;66:12-21.
- [CrossRef] [Google Scholar]
- An insulin receptor-binding multifunctional protein from Tamarindus indica L. presents a hypoglycemic effect in a diet-induced type 2 diabetes—Preclinical study. Foods. 2022;11:2207.
- [CrossRef] [Google Scholar]
- Satietogenic protein from Tamarind seeds decreases food intake, leptin plasma and CCK-gene expression in obese Wistar rats. Obes Facts. 2018;11:440-453.
- [CrossRef] [Google Scholar]
- Insulin-like proteins in plant sources: a systematic review. Diabetes Metab Syndr Obes. 2020;13:3421-3431.
- [CrossRef] [Google Scholar]
- Particle mesh ewald: an N⋅log(N) method for ewald sums in large systems. J Chem Phys. 1993;98:10089-10092.
- [CrossRef] [Google Scholar]
- Biochemical characterisation of a kunitz-type inhibitor from Tamarindus indica L. seeds and its efficacy in reducing plasma leptin in an experimental model of obesity. J Enzyme Inhib Med Chem. 2018;33:334-348.
- [CrossRef] [Google Scholar]
- Structural insights and molecular dynamics into the inhibitory mechanism of a kunitz-type trypsin inhibitor from Tamarindus indica L. J Enzyme Inhib Med Chem. 2021;36:480-490.
- [CrossRef] [Google Scholar]
- G.S. de Oliveira AM de S Nascimento, ABS Luz, AJFC Aguiar, MSR Lima, LLR Matias et al. Prospecting in silico antibacterial activity of a peptide from trypsin inhibitor isolated from tamarind seed J Enzyme Inhib Med Chem 38 2023 67 83 10.1080/14756366.2022.2134997.
- A point-charge force field for molecular mechanics simulations of proteins based on condensed-phase quantum mechanical calculations. J Comput Chem. 2003;24:1999-2012.
- [CrossRef] [Google Scholar]
- Strategic choices for in vitro food digestion methodologies enabling food digestion design. Trends Food Sci Technol. 2022;126:61-72.
- [CrossRef] [Google Scholar]
- Bioactive compounds effective against type 2 diabetes mellitus: a systematic review. Curr Top Med Chem. 2021;21:1067-1095.
- [CrossRef] [Google Scholar]
- Recent advances on bioactive food derived anti-diabetic hydrolysates and peptides from natural resources. J Funct Foods. 2021;86:1-12.
- [CrossRef] [Google Scholar]
- E. Gasteiger C. Hoogland A. Gattiker S. Duvaud M.R. Wilkins R.D. Appel et al. Protein identification and analysis tools on the ExPASy server J. Walker. 1, The Proteomics Protocols Handbook 2005 Humana Press Totowa 571 607 10.1385/1-59259-890-0:571.
- Insulin-modulated akt subcellular localization determines akt isoform-specific signaling. Proc Natl Acad Sci. 2009;106:7004-7009.
- [CrossRef] [Google Scholar]
- A leap-frog algorithm for stochastic dynamics. Mol Simul. 1988;1:173-185.
- [CrossRef] [Google Scholar]
- LINCS: a linear constraint solver for molecular simulations. J Comput Chem. 1997;18:1463-1472.
- [CrossRef] [Google Scholar]
- Methods of conjugate gradients for solving linear systems. J Res Natl Bur Stand. 1952;49:1-28.
- [Google Scholar]
- Canonical dynamics: equilibrium phase-space distributions. Phys Rev A (coll Park). 1985;31:1695-1697.
- [CrossRef] [Google Scholar]
- Innovagen - Innovagen peptide property calculator. Available from: https://pepcalc.com/. (accessed on 10/15/2022).
- International Diabetes Federation (IDF). IDF Diabetes Atlas. 10 ed. 2021. IDF. 1-141.
- JA do NC Ribeiro, AC Serquiz, PFS Silva, PBBM Barbosa, TBM Sampaio, RF de Araújo Junior, et al. Trypsin inhibitor from Tamarindus indica L. seeds reduces weight gain and food consumption and increases plasmatic cholecystokinin levels Clinics 70 2015 136 143 10.6061/clinics/2015(02)11.
- Comparison of simple potential functions for simulating liquid water. J Chem Phys. 1983;79:926-935.
- [CrossRef] [Google Scholar]
- An evaluation of natural vs. synthetic substrates for measuring the antitryptic activity of soybean samples. Cereal Chem. 1969;46:518-526.
- [Google Scholar]
- Cleavage of structural proteins during the assembly of the head of bacteriophage T4. Nature. 1970;227:680-685.
- [CrossRef] [Google Scholar]
- Interaction analyses of hTAAR1 and mTAAR1 with antagonist EPPTB. Life Sci. 2022;300:120553
- [CrossRef] [Google Scholar]
- V.C.O. Lima A.B.S. Luz M do SM Amarante, MCJS Lima, FMC Carvalho, JBS Figueredo, et al. Tamarind multifunctional protein: safety and anti-inflammatory potential in intestinal mucosa and adipose tissue in a preclinical model of diet-induced obesity Obes Facts 14 2021 357 369 10.1159/000516548.
- Structure-based virtual screening: from classical to artificial intelligence. Front Chem. 2020;8:1-18.
- [CrossRef] [Google Scholar]
- Tamarind trypsin inhibitor in chitosan-whey protein nanoparticles reduces fasting blood glucose levels without compromising insulinemia: a preclinical study. Nutrients. 2019;11:1-18.
- [CrossRef] [Google Scholar]
- Molecular docking: a powerful approach for structure-based drug discovery. Curr Comput Aided Drug Des. 2011;7:146-157.
- [CrossRef] [Google Scholar]
- JG Menting, Y Yang, SJ Chan, NB Phillips, BJ Smith, J Whittakeret, al. Protective hinge in insulin opens to enable its receptor engagement. Proc Natl Acad Sci 111(2014) 395-404. doi: 10.1073/pnas.1412897111.
- A standardised static in vitro digestion method suitable for food – an international consensus. Food Funct. 2014;5:1113-1124.
- [CrossRef] [Google Scholar]
- Bioactive peptides and proteins from foods: indication for health effects. Eur J Nutr. 2008;47:171-182.
- [CrossRef] [Google Scholar]
- Isolated compounds from natural products with potential antidiabetic activity - a systematic review. Curr Diabetes Ver. 2018;14:36-106.
- [CrossRef] [Google Scholar]
- Constant pressure molecular dynamics for molecular systems. Mol Phys. 1983;50:1055-1076.
- [CrossRef] [Google Scholar]
- Current challenges in peptide-based drug discovery. Front Chem. 2014;2:1-4.
- [CrossRef] [Google Scholar]
- A xylose-stimulated xylanase–xylose binding protein chimera created by random nonhomologous recombination. Biotechnol Biofuels. 2016;9:119.
- [CrossRef] [Google Scholar]
- RO de A Costa, LLR Matias, TS Passos, JLC de Queiroz, FMC de Carvalho, BLL Maciel, et al. Safety and potential functionality of nanoparticles loaded with a trypsin inhibitor isolated from tamarind seeds. Future Foods 1–2 (2020) 100001. doi: 10.1016/j.fufo.2020.100001.
- Elucidation of agonist and antagonist dynamic binding patterns in ER-α by integration of Molecular docking, Molecular dynamics simulations and quantum mechanical calculations. Int J Mol Sci. 2021;22:9371.
- [CrossRef] [Google Scholar]
- The role of local residue environmental changes in thermostable mutants of the GH11 xylanase from Bacillus subtilis. Int J Biol Macromol. 2017;97:574-584.
- [CrossRef] [Google Scholar]
- Calculation of the geometry of a small protein using semiempirical methods. J. Mol. Struct. (Thoechem). 1997;401:195-205.
- [CrossRef] [Google Scholar]
- T BRINKERT. GRaphing Advanced Computation and Exploration of data. Available from: https://hpc.hku.hk/hpc/software/grace/. (accessed on 11/23/2022).
- Clustal W: improving the sensitivity of progressive multiple sequence alignment through sequence weighting, position-specific gap penalties and weight matrix choice. Nucleic Acids Res. 1994;22:4673-4680.
- [CrossRef] [Google Scholar]
- Advancement and prospects of bioinformatics analysis for studying bioactive peptides from food-derived protein: sequence, structure, and functions. TrAC Trends in Analytical Chemistry. 2018;105:7-17.
- [CrossRef] [Google Scholar]
- The HDOCK server for integrated protein–protein docking. Nat Protoc. 2020;15:1829-1852.
- [CrossRef] [Google Scholar]
- Improved protein structure prediction using predicted interresidue orientations. Proc Natl Acad Sci. 2020;117:1496-1503.
- [CrossRef] [Google Scholar]
Appendix A
Supplementary data
Supplementary data to this article can be found online at https://doi.org/10.1016/j.arabjc.2024.105780.
Appendix A
Supplementary data
The following are the Supplementary data to this article:Supplementary data 1
Supplementary data 1


