

Translate this page into:
Introduction of a biowaste/graphene oxide nanocomposite as a coating for a metal alloy based SPME fiber: Application to screening of polycyclic aromatic hydrocarbons
⁎Corresponding author. h.razmi@azaruniv.ac.ir (Habib Razmi)
-
Received: ,
Accepted: ,
This article was originally published by Elsevier and was migrated to Scientific Scholar after the change of Publisher.
Peer review under responsibility of King Saud University.
Abstract
The present study introduces a high efficiency metal alloy-based solid-phase microextraction (SPME) fiber coated with a green biowaste nanocomposite of chicken feet yellow membrane mixed with graphene oxide (CFYM/GO). An Al/Cr commercial heating element (aluchrom, AC) has been selected as the fiber substrate and designed as coiled form (CAC-SPME) to enhance its extraction and pre-concentration capacity. The fabricated fiber, CAC-SPME/CFYM/GO, has been employed for the extraction and pre-concentration of some commonly seen PAHs in different standard/real samples prior to their high performance liquid chromatography- ultraviolet (HPLC-UV) analyzing. The synthesized materials and the fibers surface were characterized by field emission scanning electron microscopy, energy-dispersive X-ray spectroscopy, Fourier-transform infrared spectroscopy analysis and Brunauer-Emmett-Teller surface area analysis. Under the optimized experimental conditions, low detection limits (LOD, 0.039–0.30 µg L–1), wide linear ranges (LR, 0.13–643 µg L–1) and good relative recoveries (RR, 76.20–105.60%) were achieved for all the target analytes. The materials applied to prepare this fiber were low-priced and accessible and also eliminated the need for expensive coating substances. In addition, using of the AC alloy substrate was increased the fiber physicochemical resistance and solved the breakage drawback of the conventional SPME fibers. Moreover, simple fabrication, high rigidity, long service life and high extraction capacity were some of the other advantages of the suggested fiber. Therefore, the proposed method can be utilized successfully for the routine analysis of PAHs in different matrixes.
Keywords
Coiled solid-phase microextraction fiber
Green biomaterial sorbent
High performance liquid chromatography
Polycyclic aromatic hydrocarbons
Resistance metal alloy

1 Introduction
Generally, direct introduction of samples into the analytical devices is not possible. Therefore, sample preparation, as a method wherein a sample is processed to prepare for chemical analysis, is an essential stage in analytical chemistry, especially for trace analysis and complex matrixes (Feng et al., 2020). Liquid-liquid extraction (LLE), solid-phase extraction (SPE), stir bar sorptive extraction (SBSE), liquid-phase microextraction (LPME) and solid phase microextraction (SPME) are the most commonly used sample preparation techniques (Kabir et al., 2017). SPME is an equilibrium-based sampling and sample preparation technique and is remarkable for its miniaturization, lower sample and solvent consumption, easily automated capability and environmental friendliness (Grafit et al., 2018; Tian et al., 2018). The SPME device is usually composed of a fused-silica fiber covered with a thin film of an appropriate polymeric, solid or liquid extraction phases such as carbowax-polyethylene glycol (PEG) and polydimethylsiloxane/divinylbenzene (PDMS/DVB) (Verma and Srivastav, 2020). However, mechanical instability of the fiber substrates, thermal instability, bending of the needle, swelling of the fiber coatings in organic solvents, stripping of the coating materials, poor sensitivity and selectivity, breakability and expensive equipment are some of the main weaknesses of the conventional SPME fibers (Jiang et al., 2009). It seems that the lack of proper chemical bonding between the extracting phase and the fiber surface and relatively low or high thickness of the fibers sorbent are responsible for some of these drawbacks (Attari et al., 2014). So far, various technical solutions have been suggested to overcome these challenges including molecularly imprinted polymer (MIP) and sol–gel coating technologies, utilizing flexible metal wire as the fiber substrates and using new coating materials such as carbon substances, aerogels, ionic liquids, metal–organic frameworks and different pristine biomaterials (Feng et al., 2019; Khosrowshahi and Razmi, 2018; Mei et al., 2019). For example, graphene oxide (GO) is a two-dimensional carbon nanomaterial that possesses many applications in the manufacture of polymer-composites and nanocomposites, electronic and energy storage devices, biosensors, catalysts, coatings and biomedical materials (Jon et al., 2019). GO is also a powerful sorbent for the adsorption and extraction procedures due to its high specific surface area and porous structure. More important, GO can be effortlessly mixed with different polymeric and non‐polymeric compounds and accordingly improves their elasticity, conductivity and adsorption attributes (Yuksek et al., 2018).
In recent years, many studies have been made to replace conventional SPME sorbents with new and green ones (Casado et al., 2020). One of the effective ways to achieve this subject is to use natural materials to produce biosorbents. Up to now, many raw material and biomaterial wastes (biowaste) such as bones and hard tissues of animals, eggshell membrane, vegetable and food wastes, bark and leaves of trees has been successfully applied to produce low-cost, eco-friendly and high capacity adsorbents. On the other hand, such uses of biowastes is considered as a kind of waste recycling that prevents excessive accumulation of them in the environment. These kinds of sorbents are one of the outstanding candidates for the extraction or removal of organic and inorganic pollutants from different matrix (Arshadi et al., 2016; Aziz et al., 2018; Razmi et al., 2016). However, large amounts of natural by-products are still produced annually via industrial and household activities. Many of these compounds such as chicken feet yellow membrane (CFYM), which often discarded as waste, can be a good source for the production of new biosorbents. Chicken feet (CF) are a very gelatinous part of chicken that cooked and eaten as a food in a number of countries. The CF is a rich source of collagen possesses a numerous medicinal and nutritional virtues. Before cooking, the thin skin layer (yellow membrane) of the CF is removed. This layer is not edible and is discarded as a waste. CFYM can be introduced as a new and cheap (and even free) source for commercial collagen production. It can be also applied for the preparation of a novel green biosorbent with nice adsorption properties. Nevertheless, to our knowledge, less attention has been paid to this material until now (Farrokhzadeh and Razmi, 2018a,b).
In addition, several attempts have been made in recent past to improve the mechanical stability of the SPME fibers by employing different flexible metal wires as the fibers supporting substrates (Kang et al., 2015). These metal wires possess completely different physicochemical features from the conventional fused-silica fibers and thus can be employed with great convenience. In this regard, a wide range of flexible metal wires can be candidate for the C-SPME substrate. For example, in one attempt, Razmi and his group have been presented a copper-coiled SPME (C-SPME) fiber, as a new approach in the fiber designing technology (Razmi and Farrokhzadeh, 2017). Chrome aluminum (AC or CrAl or AlCr) metal alloy is a heating element with great resistance to corrosion and oxidation at high temperatures. Good virtues of the AC-alloy make it to have many applications in different filed from household to industrial equipment (Aluchrom, 2020). However, up to now, it has not been used in the sampling, sample preparation, extraction and microextraction researches, except in our recent article (Razmi and Pasandideh, 2020).
Polycyclic aromatic hydrocarbons (PAHs) are an important group of semi-volatile organic pollutants. Because of the negative effects of the PAHs on ecological risks and human health and also theirs mutagenic, carcinogenic and teratogenicity properties there is an increasing interest in their trace analysis and screening (Wang et al., 2020). Crops, vegetables, legume, cereals and grains are the main dietary sources of the PAHs. An effective pre-concentration procedure is often necessary before the analysis of PAHs due to their low concentration (Razmi et al., 2017).
The paper introduced a novel, durable, unbreakable and effectual SPME fiber based on a commercial heating element coated with a new chicken feet yellow membrane biowaste/graphene oxide (CFYM/GO) nanocomposite for the first time. The proposed fiber, CAC-SPME/CFYM/GO, coupled with HPLC-UV was successfully employed for the simultaneous extraction and measurement of some PAHs as the model analytes in different standard and real samples.
2 Experimental
2.1 Chemicals and materials
Pure PAHs include naphthalene (99.0%), phenanthrene (99.5%), anthracene (99.0%), fluoranthene (99.0%) and pyrene (98.0%) were obtained from Merck (Darmstadt, Germany). A stock solution of PAHs at a concentration of 100 mg L–1 was prepared in the methanol and then the working solutions were prepared by appropriate dilution with double distilled water (DDW). All the prepared solutions were stored in refrigerator below 4 °C. DDW was obtained from Shahid Ghazi Pharmaceutical Co. (Tabriz, Iran) and its conductivity was about 0.08 μS cm−1. HPLC grade acetonitrile (≥99.9%) and methanol (≥99.9%) were supplied from Carlo Erba (Valde Reuil, France). Two single CRM samples of Naphthalene (CRM48641) and Anthracene (48647) at the concentration level of 200 mg mL−1 in methanol were purchased from Supelco (Germany). All Other chemicals and reagents with analytical grade were obtained from Merck (Darmstadt, Germany). A wire of AC resistance alloy made in the People's Republic of China (with 0.9 mm in diameter) was purchased from the Thermo Heater Omega local store in Tehran (Iran) and was employed as the SPME fibers substrate. Rice, smoked rice, soybean, barley, wheat and corn seeds as the real samples were obtained from Refah Chain Store (Tabriz, Iran). The CFYM biowastes were provided from a hen slaughterhouse in Tehran (Iran) and after preparation were used as the green coating of SPME fibers.
2.2 Instruments
High performance liquid chromatographic analysis was performed on a JASCO (Japan) HPLC system equipped with a PU-1580 isocratic pump, a Rheodyne 7725i injector with a 20 μL manual six port injection valve (Rheodyne, Cotati, CA, USA) and a UV–1575 spectrophotometric detector (JASCO-1575). HSS-2000 (JASCO) package using a LC-Net II/ADC interface was controlled the chromatographic system and data were processed utilizing BORWIN software (version 1.50). The separations were carried out using an ODS-3 column (250 mm × 4.6 mm ID, 5 μm (MZ-Analysentechnik, Germany) with an ODS-3 pre-column (10 mm × 4 mm ID, 5 μm). A 25 μL microsyringe (zero dead volume, Hamilton, Switzerland) was applied for injection of the samples into the septum of HPLC valve. A Tescan electron microscope model mira3 (Brno-Czech Republic) was employed for field emission scanning electron microscopy (FESEM) and energy-dispersive X-ray (EDS or EDX) studies. Fourier- transform infrared spectroscopy (FTIR) spectra were obtained by employing a vector 22 (Bruker, Ettlingen, Germany) FTIR spectrometer with the KBr disks. A Brunauer-Emmet-Teller (BET) method with a Gemini 2375 micrometrics instrument was utilized for surface area and pores size measurements of the prepared coatings by N2 adsorption–desorption analysis. In addition, a Metrohm pH meter model 744 (Switzerland) for pH adjustments, a IKA RCT basic magnetic stirrer (Germany), a Beckman GS-6 centrifuge (USA), an ultrasonic device (Falc instrument S.r.I, LBS2, Italy) and an oven were also handled. All the analysis steps were performed at ambient temperature. The chromatographic studies were accomplished in isocratic mode and wavelength of detector was fixed at 254 nm.
2.3 Preparation of CAC-SPME fibers
An AC wire was utilized as the SPME fiber substrate. Twenty centimeters of the wire came in the form of a coil with a diameter of about 1 cm. The coiled form SPME fibers create a greater surface area due to their long length and thus can improve the extraction capability and method efficiency. The prepared coil was ultrasonicated in acetone and DDW, respectively, to remove unwanted contaminations and chemicals from the surface. Then, in order to increase roughness and porosity of the fiber surface and also improve the adhesion between the coil and its coating, the fiber was chemically etched by direct immersing in 1 M HF solution for 10 min. During the etching process, small gas bubbles were appeared and the fiber surface moderately changed to gray. Then the etched fiber was removed from the HF solution and washed with DDW for several times. Finally, the prepared CAC-SPME fibers were dried and stored at laboratory temperature for the next experiments.
2.4 Preparation of CFYM powder
CFYM powder was prepared using the CFYM wastes (Farrokhzadeh and Razmi, 2018a,b). For this purpose, the yellow thin skin of chicken feet was removed. 5 g of the obtained yellow membranes was repeatedly washed with hot DDW to clean all the contaminants and fatty waste stuffs from the surface. The cleaned membranes were dried at a temperature of 95 °C for 24 h. Then, the dried membranes were ground and sieved to create yellow fine particles. Finally, the obtained CFYM yellow powder was washed with DDW, dried at 90 °C for 12 h, poured in a sealed container and stored at laboratory temperature.
2.5 Synthesis of GO powder
GO was synthesized via conventional Hummers method (Paulchamy et al., 2015). In brief, 3.00 g graphite powder, 1.5 g NaNO3 and 69 mL concentrated H2SO4 (98%) were poured in a jar and mixed together. The ingredients had been cooled in an ice-bath. After 2 h and under stirring, 9 g KMnO4 was gently added to the solution (the mixture temperature was kept lower than 15 °C). Then, the ice bath was removed and the mixture stirred at 35 °C for 30 min. Next, the suspension was diluted with slowly addition of 138 mL DDW. At this step, the reaction temperature was raised to 98 °C and the brownish color was appeared. The mixture was further diluted by the addition of 450 mL DDW under continuously stirring. The suspension was then treated with 10.5 mL H2O2 and its color turned to the bright yellow. Afterward the mixture has been centrifuged and the obtained precipitate was washed with HCl (3%) and DDW for several times until neutral pH. Finally, the neutral precipitate dried at 40 °C and the achieved GO powder was kept at laboratory temperature for the next studies.
2.6 Preparation of CAC-SPME/CFYM/GO fibers
At the beginning, a homogeneous gel of the CFYM was prepared (Farrokhzadeh and Razmi, 2018a,b) and mixed with appropriate amount of the synthesized GO. The dispersion was easily attained by adding 0.8 g CFYM powder to 10 mL thioglycolic acid solution containing 10% acetic acid at laboratory temperature (ca. 28 °C). Then, the reaction mixture had been heated at 90 °C during stirring. The membrane powder was completely dissolved and a homogeneous gel was obtained. After that, the heater was switched off, 0.2 g GO was dispersed into the mixture and a sufficient concentrated gel as the AC fibers sorbent was achieved. As know, nanocomposite is a multi-phase solid substantial that possesses one or more dimensions of less than 100 nm. Thus, when a nano-sized compound remains dispersed (does not dissolve) in a particular matrix, it forms a nanocomposite material. Therefore, since the prepared CFYM/GO gel is a dispersion-type coating, it can be deliberated as a nanocomposite. At the next step, the chemically etched CAC-SPME fiber was directly immersed into the ultrasonicated gel of CFYM/GO nanocomposite for 1 min. Finally, the fiber was removed from the nanocomposite material and dried at laboratory temperature to fix a suitable thickness of CFYM/GO coating on the AC surface and the final shape of the CAC-SPME/CFYM/GO fiber was formed.
2.7 Microextraction procedure
Initially, a standard solution of PAHs at the concentration of 10 µg L–1 was prepared by dilution of the stock solution by DDW. Then, 25 mL of this solution was placed in a glass vial and the prepared CAC-SPME/CFYM/GO fiber introduced directly into it. A magnetic stirrer at 400 rpm was employed to accelerate the extraction. After 30 min, the fiber was drawn out from the solution and placed in 1 mL acetone as desorption solvent for 10 min. After that, for avoiding dilution effects, improvement the method sensitivity and also desorption solvent compatibility with the mobile phase, the solution containing analytes was evaporated under nitrogen stream to dry. Finally, the dried analytes were dissolved in 100 μL acetonitrile and injected to a HPLC-UV system. An acetonitrile: water mixture (75:25, v/v) at the flow rate of 1 mL min−1 was utilized as the mobile phase for elution of the PAHs in isocratic mode. A schematic diagram of the proposed procedure is shown in Fig. 1.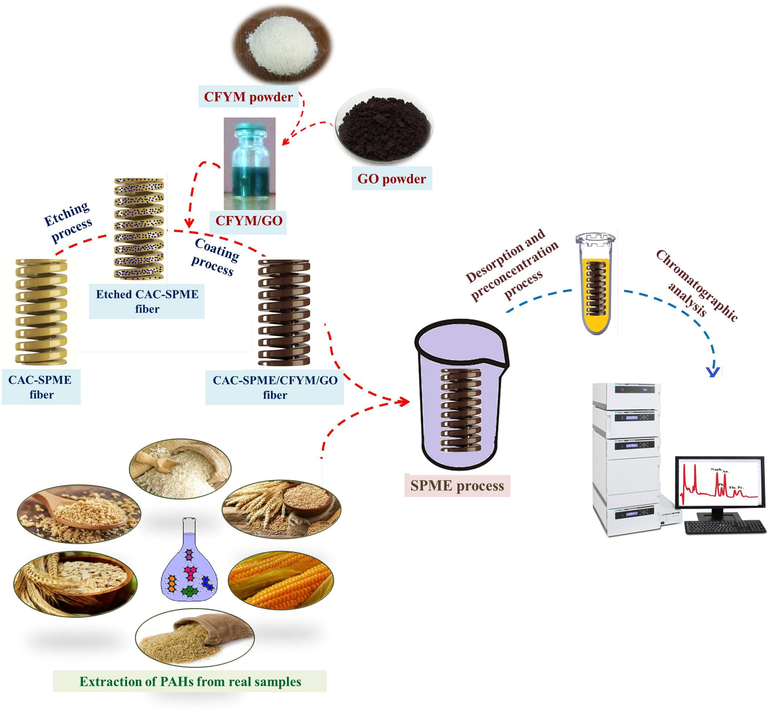
Schematic diagram of the proposed method.
2.8 Real samples preparation
Rice, smoked rice, soybean, barley, wheat and corn seeds were chosen as the real samples to evaluate the suggested method efficiency. Different procedures for the extraction of PAHs from the cereal and grain samples had been reported until now (De Lima et al., 2017; Fazeli et al., 2020; Krumal et al., 2013). According to these reports, the solvent extraction of PAHs from the ground and sieved target samples (1 g) was performed three thirty-minute periods under ultrasonic agitation. A mixture of dichloromethane: n-hexane (1:1, v/v), acetonitrile, methanol: acetonitrile (1:1, v/v), acetone: dichloromethane (1:1, v/v), dichloromethane and acetonitrile: n-hexane (1:1, v/v) solvents were selected for the extraction of PAHs from rice, smoked rice, soybean, barley, wheat and corn seeds, respectively. In each case, the obtained mixture was centrifuged for 10 min and the overflow solutions were mixed together. Then the extracts were dried completely by N2 gas. The dried analytes were dissolved in 1 mL methanol and diluted with DDW to a final volume of 25 mL and were applied for further SPME analysis.
3 Results and discussion
3.1 Characterization of the CAC-SPME/CFYM/GO fiber
The prepared CAC-SPME/CFYM/GO fiber was characterized by FTIR, FESEM, EDX and BET techniques. As mentioned, collagen is the major fundamental protein in the chicken feet structure and made of different amino acid conformations and sequences (Mahajan et al., 2010). The FTIR is a very valuable tool providing useful information about the CFYM functional groups and its protein structures. The FTIR spectrum of the CFYM has been shown in Fig. 2A. The absorption bands at 1648 cm−1, 1539 cm−1 and 1240 cm−1 are attributed to amide I, amide II and amide III, respectively. The band at 1735 cm−1 is probably related to the carbonyl groups and confirms the presence of amide groups in the CFYM structure. In addition, band at 1454 cm−1 is possibly ascribed to the —CH2 bending vibrations of carbohydrates and also the C⚌C stretching vibrations of aromatic groups. The —CH2 symmetric stretching of amides is visible at 2852 and 2922 cm−1. Furthermore, the wide absorption band between 3298 and 3378 cm−1 indicates the presence of N—H and O—H stretching vibrations in the CFYM structure. According to these results, CFYM is composed of different super biomolecules such as carbohydrates, proteins and glycolipids and thus is a rich source of —OH, —NH2 and —COOH functional groups (Farrokhzadeh and Razmi, 2018a,b). In addition, the FTIR study of the synthesized GO is shown in Fig. 2B. The broad and strong band at 3418 cm–1 is related to the O—H stretching vibrations of GO. The bands at 1726 and 1622 cm–1 are ascribed to the C⚌O and C⚌C stretching vibrations, respectively. The stretching vibration bands of C—O appeared at 1382, 1223, 1050 and 883 cm–1. The comparison of these results with Ossonon and Belanger (2017) strongly confirms the successful synthesis of GO. The FTIR spectrum of the CFYM/GO nanocomposite coating material is also shown in Fig. 2C. As can be seen in this figure, the significant bands of the CFYM and GO compounds are clearly visible in their composite spectrum.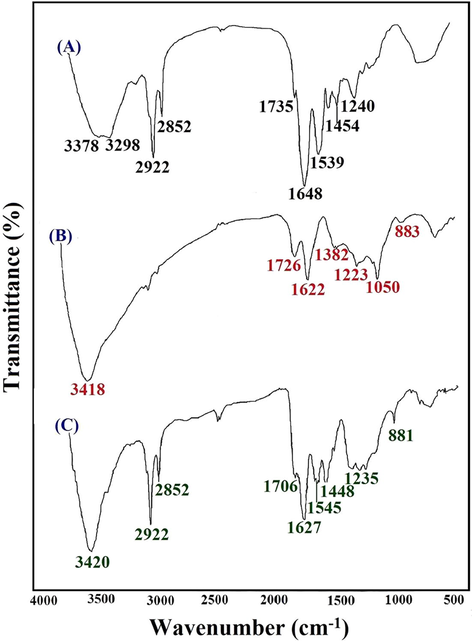
FTIR spectra of the CFYM (A), GO (B) and CFYM/GO (C) materials.
Furthermore, the FESEM spectroscopy at different magnifications was employed for the examination of surface morphology of the prepared fibers in four forms: the CAC-SPME fiber without any pretreatment and coating (Fig. 3A), chemically etched CAC-SPME (Fig. 3B), CAC-SPME/CFYM (Fig. 3C) and CAC-SPME/CFYM/GO (Fig. 3D) fibers. According to the micrograph of Fig. 3A (50,000×) that shows the CAC surface before the etching process, there are numerous holes and pores irregularly on the fiber surface. Such a structure causes the intrinsic adsorption properties of the fiber. However, Fig. 3B (50,000×) illustrates a relatively orderly structure rich in tiny and grain-like bumps. This means that after the etching process, the CAC surface porosities and roughness were increased. Such uniform, regular and porous morphologies increase the fiber surface area, enhance the adsorption attribution and also improve the adhesion between the fiber and its coating. In addition, the micro-image of the CAC-SPME/CFYM fiber (Fig. 3C, 50,000×) demonstrates that the CFYM coating layer is a relatively homogeneous environment consisting of an irregular assemblage of fine spherical bumps. There is no specific structure, porosity and roughness in this media. Finally, with respect to Fig. 3D (5000×), the dramatically changes of the surface morphology is obvious. After the addition of GO, the flat and homogeneous environment of the CFYM gel was changed to a rough and porous media. These conversions prove the positive effect of GO on increasing the sorbent porosity. Therefore, it can be said that the high adsorption capacity of the CAC-SPME/CFYM/GO fiber compared to the CAC-SPME/CFYM is related to this porous structure. In the other word, the pores and porosities has created by GO were expanded the surface area for several times and thereby amplified the adsorption properties. The thicknesses of CFYM and CFYM/GO layers were 32 and 48 µm, respectively.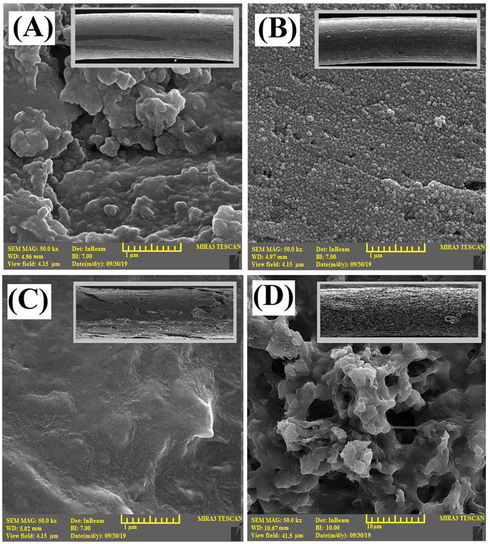
FESEM micrographs of the (A) CAC-SPME (MAG: 50,000×, Det: InBeam, WD: 4.96 mm and BI: 7.00), (B) chemically etched CAC-SPME (MAG: 50,000×, Det: InBeam, WD: 4.97 mm and BI: 7.00), (C) CAC-SPME/CFYM (MAG: 50,000×, Det: InBeam, WD: 5.02 mm and BI: 7.00) and (D) CAC-SPME/CFYM/GO (MAG: 5000×, Det: InBeam, WD: 10.67 mm and BI: 10.00)×) fibers.
EDX spectra were also recorded for the elemental studies and chemical characterization of the CAC-SPME, chemically etched CAC-SPME, CAC-SPME/CFYM and CAC-SPME/CFYM/GO fibers. EDX spectrum of the CAC-SPME (Fig. 4A) corroborates the presence of some impurities such as iron and oxygen beside the main metals (aluminum and chromium) in the structure of AC-alloy. EDX pattern of the etched CAC-SPME fiber (Fig. 4B) demonstrates that the percentage of iron and oxygen elements was increased on the fiber surface. This is probably due to the etching process, which has allowed access to the bottom part of AC-substrate by the removing of surface layer or possible surface contaminants. Sharp carbon peak in Fig. 4C is related to the carbon chains of the carbohydrate and biomolecule compounds in the CFYM structure. In addition, sulfur peak was obviously appeared in this image. Sulfur is a necessary element for the synthesis of collagen (Nehlich and Richards, 2009) and thus it is one of the constituent elements of the CFYM structure. Additionally, increasing in the intensity of carbon peak in Fig. 4D is associated to the totally amounts of carbon in the CFYM and graphene oxide media. Moreover, decreasing in the intensity of the main metals peaks in the both of 4C and 4D images corroborate that the sorbent materials have desirably covered the fibers surface. Moreover, the comparison of FESEM and EDX analysis of the synthesized GO with its conventional spectra (Khalili, 2016) powerfully confirmed the correct synthesis of it.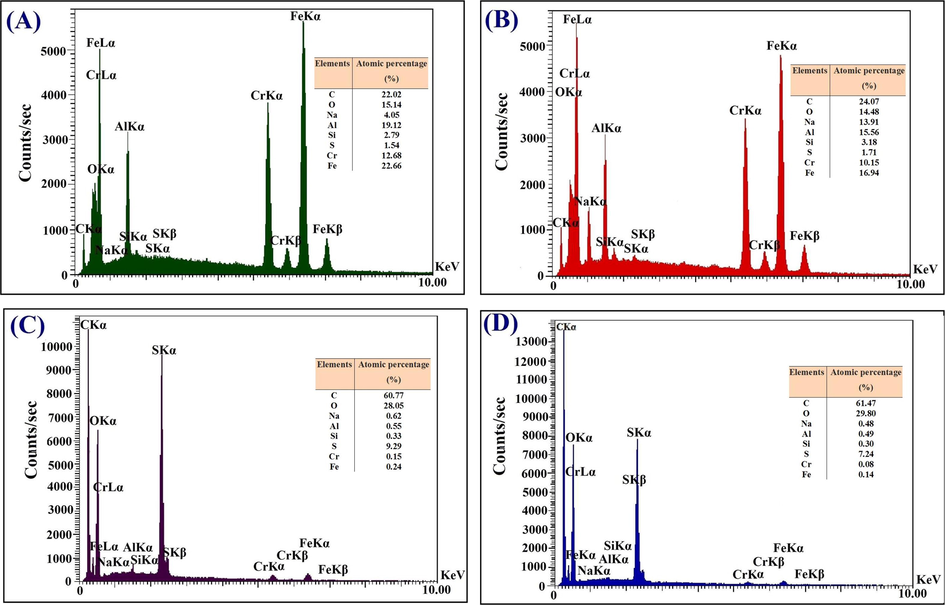
EDX patterns of the CAC-SPME (A), chemically etched CAC-SPME (B), CAC-SPME/CFYM (C) and CAC-SPME/CFYM/GO (D) fibers.
The results of BET analysis of the CFYM and CFYM/GO are shown in Table 1S. The specific surface area, total pore volume and mean pore diameter of the CFYM were 3.485 m2 g−1, 0.0078 cm3 g−1 and 8.692 nm, respectively. However, dispersing the GO to the CFYM matrix was changed these values to 27.441 m2 g−1, 0.2286 cm3 g−1 and 3.638 nm, respectively. The results can obviously show that the surface area and pore volume of the CFYM/GO nanocomposite is increased significantly by the incorporation of GO nanoparticles, but the pore diameter decreased. Increasing the CFYM/GO nanocomposite surface area could be directly associated to the higher pore diameter of the GO compared to the CFYM. Therefore, with an increase in the surface area and decrease in the pore size, the CFYM/GO is expected to have a high extraction capacity compared to CFYM.
Therefore, it can be said that the high extraction efficiency of CFYM, despite its low surface area, is probably due to the hydrophobic interactions between the CFYM functional groups (such as —OH, —NH2, —COOH and C⚌C) and the target analytes. The excellent extraction efficiency of the CFYM/GO is due to its higher surface area, intermolecular hydrophobic interactions between the CFYM functional groups and PAHs, weak π–π interaction between the C⚌C bonds of PAHs and the flat surface of GO, H-π interaction between the —OH or —COOH groups (hydrogen donor) of GO and the PAHs (hydrogen bond acceptor) and the interaction between the oxygen-containing functional groups of GO (n-electron donor) and the analytes (π-electron acceptor) (Wang et al., 2014).
3.2 Optimization of the fiber fabrication parameters
In the optimization step, the optimum conditions for the fabrication of a high quality CAC-SPME-CFYM/GO fiber were first determined. For this purpose, the effects of kind of fiber coating, etching reagent, etching time, CFYM/GO dispersion and CFYM/GO ratio have been optimized.
3.2.1 Kind of fiber coating
To study the effect of various coatings on the extraction efficiency, the results obtained by utilizing the AC–based C-SPME fiber were compared with those obtained by the similar fibers coated with biowaste and/or carbonaceous compounds. For this purpose, initially five fibers were prepared in the similar conditions. One of the fibers was applied without any coating materials (control fiber). The second one was placed in a coating dispersion of GO in DDW. And the remaining fibers were individually placed in the coating dispersions of GO, CFYM and CFYM/GO (1:1) in organic solvent (thioglycolic acid solution containing 10% acetic acid). The concentrations of all the prepared coating dispersions were 25 mg mL–1. Then the covered fibers were taken out from the dispersions and dried at laboratory temperature. Finally, all of these fibers efficiencies were investigated for the extraction and determination of the selected PAHs. As can be seen in Fig. 1SA, the CAC fiber without any coating has shown adsorption properties for the target analytes. However, utilizing a proper covering material amplified its adsorption attributes. The comparison of the fiber efficiency before and after modifying by the GO demonstrated that, adding the GO to the CFYM matrix was increased the fiber extraction capacity more than two times. It is also observed that the use of GO, alone, does not have a particular effect on the adsorption features. Generally, GO shows strong adsorption properties for the PHAs. However, in the present study and considering the conditions of fibers fabrication, the GO not successfully coated on the AC surface and thus the formed coating was easily removed from the surface. Therefore, it did not have a significant effect on increasing the efficiency of the method. The maximum amount of uptake was obtained when the CFYM/GO nanocomposite coating was applied.
3.2.2 Etching reagent
Etching process generally is the technique of cutting a metal surface using an accurate etchant including a strong acid (HCl, H2SO4, HNO3, HF and H3PO4), alkaline (NaOH and NH3) or mordant (FeCl3/water and CuSO4/water) invented by Daniel Hopfer around the end of the 15th century (Brian, 2017). For the first time in the analytical chemistry, Xu et al. (2009) introduced a new etched stainless steel SPME fiber for the pre-concentration and separation of PAHs from different water samples. The etching of the metallic fibers surface usually enhances the adhesion between the fiber and its coating via increasing the roughness, porosity and surface area of fiber and improves the method efficiency (Liu et al., 2014).
In this work, aqueous solutions of different reagents, including ammonia, NaOH, H2SO4 and HF at a concentration of 1 M has been employed to find the proper etching reagent. As mentioned in the previous part, the AC fiber, without any coating and special pretreatment shows a partial ability in the PAHs adsorption. Further, doing a chemically etching step improves the adsorption properties. As indicated in the “Characterization of the CAC-SPME/CFYM/GO fiber” section, FESEM examination and EDX spectroscopy analysis were investigated before and after etching process to better understand the adsorption properties of the CAC-SPME fiber. Based on the FESEM images of the AC-wire before the etching, the presence of irregular pores, porosities and roughness on the fiber surface, are one of the most important reasons for the AC-alloy adsorption virtues. Furthermore, according to the EDX results, it can be noted that the probable presence of various metal oxides such as aluminum oxide, chromium oxide and iron oxide on the CAC-SPME fibers surface are another factor in creating AC-alloy adsorption properties. An anion-π orbital interaction possibly occurred between the analytes (as electron acceptor) and the surface of the fibers (as electron donor) during the adsorption and extraction procedures. Moreover, the adsorption properties of the uncoated fiber were improved after the etching procedure (Fig. 1SB). In addition, the etching process was enhanced the percentage of iron and oxygen in the fiber surface and consequently improved the AC-SPME adsorption properties. the roughness and porosities of the AC surface are also expanded. As a result, the surface area was enhanced and consequently the adsorption ability of fiber amplified anew. Considering these results, the AC-fiber without any pretreatment and coating or only with one etching step can be employed as a SPME fiber with a proper adsorption capacity (Razmi and Pasandideh, 2020). However, utilizing a suitable coating material multiplies its adsorption ability. On the other hand, comparison of the analytical signals of the etched and non-etched fibers (1SA, 1SB) demonstrates the positive effect of the etching procedure on the adsorption efficiency. These results prove that the etching procedure also improves the adhesion of coating to the fiber surface and improves the method performance. In this study, the highest recovery was obtained utilizing HF as the etching reagent.
3.2.3 Etching time
Optimization of the etching time is another important factor in the etching techniques. Long-term exposing of substrate into etching reagent may cause over-etching and dissolve the metal or damage the surface structure. Against, in short-term exposing, the expected roughness and porosities would not probably be formed, due to incomplete etching (Parasuraman, 2020). In the both cases, the technique efficiency diminishes. In this work, the influence of etching time was investigated in the range from 1 to 30 min. As can be seen in Fig. 1SC, peak areas was increased as the time increased from 1 to 10 min and reached to a relatively stable stage after that. The constant value of peak area over time indicates that the AC fiber possesses a high corrosion resistance and does not over etch easily. In this work, 10 min was chosen as the suitable etching time.
3.2.4 Coating material concentration
In dip-coating method applied in this article for coating the fibers, a fiber substrate is directly immersed into the desired solution for a few moments. Then the fiber is removed from the solution and after drying of the organic solvent, a thin layer of coating material fixed on the fiber surface (Sarafraz-Yazdi et al., 2012). Thus, the concentration of covering material determines the adhesion and thickness of the coating and accordingly the SPME method performance. In this work, CFYM/GO dispersions by the ratio of 1:1 were prepared at the concentrations ranged from 25 to 200 mg mL–1 and applied for the coating of the etched CAC-fibers. According to the results (Fig. 1SD), the solution with a total concentration of 100 mg mL–1 was shown the greatest extraction ability. At the higher concentrations, the performance of technique was decreased due to the uncomfortable handling, high thickness of the coating, non-uniformity of the covering material on the fiber surface and stripping of the coating after the dryness. On the other hand, at lower concentration, the extraction and adsorption properties of the resulting fibers were diminished because of the paucity amount and low thicknesses of the sorbent.
After the optimization of total concentration of the CFYM/GO dispersion, the experiments continued by focusing on the CFYM/GO ratio in coating dispersion. For this purpose, the CFYM/GO ratios were gradually changed, while the total concentration of the prepared mixture had constant value of 100 mg mL–1. As the results illustrate (Fig. 1SE), a coating dispersion with maximum adsorption capacity was obtained in the case of CFYM/GO dispersion at the ratio of 80:20% (w/w).
3.3 Optimization conditions for the SPME method
After the fabrication of a SPME fiber with suitable adsorption properties and good structure, the significant conditions for the proposed method including extraction time, desorption solvent, desorption solvent volume, desorption time, pH of sample solution, stirring rate, temperature of sample and salting-out effect were optimized. The optimized parameter in each step was used in subsequent steps. In Fig. 2S, the improvement of the chromatographic responses following the sequential optimization of critical parameters is clearly visible.
3.3.1 Extraction time
The amount of extracted analytes in the SPME technique is closely related to the extraction time and thus the optimization of this parameter is required in the SPME sample preparation procedure. Here, the impact of the extraction time was studied in the range from 15 to 60 min. As can be seen in the Fig. 2SA, the intensity of the chromatographic signals was increased until 30 min and then became relatively constant. Thus, 30 min was selected as the suitable extraction time.
3.3.2 Desorption solvent
Desorption of analytes from the fiber surface is a crucial step in all SPME–LC methods. Therefore an appropriate desorption solvent must be strong enough to desorb analytes from the fiber surface completely or as much as possible. To optimize this parameter, different solvents such as acetonitrile, methanol, ethanol, acetone, THF and n-hexane were examined. Based on the results (Fig. 2SB), the highest recovery was gained using acetone via hydrophobic interactions and thus was elected as the desorption solvent for subsequent experiments.
3.3.3 Desorption solvent volume
An excessive volume of the desorption solvent causes environmental difficulties and is not also economically viable. On the other hand, small volume of desorption solvent might cause incomplete desorption problems. Therefore, the amount of desorption solvent should be optimized in order to determine the minimum required volume with the highest output. To estimate the effect of this parameter on the proposed method efficiency, desorption volumes were changed from 0.5 to 2.5 mL. The results (Fig. 2SC) display that the maximum peak areas were obtained with 2 mL of the acetone.
3.3.4 Desorption time
The influence of desorption time was examined in order to find appropriate and required time for desorption of analytes from the CAC-SPME/CFYM/GO fiber surface. This factor was evaluated in the range of 5–20 min. As is shown in Fig. 2SD, the chromatographic peak areas enhanced as desorption time were increased from 5 to 10 min, then remained constant. So, desorption time of 10 min was chosen for the further studies.
3.3.5 Sample solution pH
The pH of sample solutions is another important factor affecting adsorption, extraction and pre-concentration procedures that can change the ionization of analytes and stability of fiber coatings (Khorrami and Pasandideh, 2016). In this work, although pH changes have no effect on the extraction efficiency of the PAHs as non-polar compounds, but it maybe affect the stability and rigidity of fiber or cause damage or stripping of its sorbent. Therefore, the effect of sample solution pH on the recovery of selected PAHs and the prepared CAC-SPME/CFYM/GO fiber rigidity was studied utilizing 10 μg L−1 of aqueous solutions in a pH ranged from 3 to 11. Diluted HCl and NaOH were applied for adjustment of solutions pH. The results presented (Fig. 2SE) that the recoveries in different pH were relatively constant. Therefore, all the experiments were performed without pH control.
3.3.6 Stirring rate
Stirring of the sample solutions reduces the equilibrium time by increasing the mass transfer of analytes to the SPME fiber surface and thus improves the extraction output. In the present work, the positive influence of the stirring rate on the chromatographic signal was observed as the stirring rate enhanced in the range from 0 to 400 rpm (Fig. 2SF). Thus, 400 rpm was picked out as optimized stirring rate for the following experiments. In addition, stirring time was set as the same as the optimized extraction time (30 min).
3.3.7 Temperature of sample solution
In general, increasing the temperature of sample solution will increase the efficiency of extraction by increasing the mass transfer of analytes to the fiber surfaces. However, high temperatures may lead to sample decomposition or formation of new species and thus reduce the efficiency of method. This parameter was investigated in the temperature range of 5–55 °C. As can be seen in Fig. 2SG, the extraction efficiency was increased sharply from 0 to 25 °C. But no significant changes were observed at higher temperatures. Therefore, all the analysis were performed at the laboratory temperature (28–32 °C).
3.3.8 Salting-out effect
Usually an appropriate salt addition can improve the extraction capacity via reducing the solubility of analytes in the aqueous phase and enhancing its solubility in organic phase through the salting-out effect. However In this work, the addition of salt (NaCl) to the sample solutions caused a sharp decrease in the analyte adsorption capability. After removing the fibers from the salt-containing solutions, the fiber coating was stripped off. This means that the addition of salt was destroyed the proposed fiber sorbent and thus reduced the fiber efficiency. Therefore, all the analysis was performed without adding any salt.
3.4 Carry-over effect
As mentioned, SPME is an equilibrium procedure and thus carry-over (memory) effect is not an important concern in it. However, when the concentration of analytes is very low, on-fiber carry-over can be a major problem (Song et al., 2019). For this purpose, a second desorption step (without PAHs addition) was consecutively accomplished to evaluate the memory effect. No carry-over was observed by examination of the obtained results (Fig. 3S). This proves that in the first desorption step, the analytes was desorbed completely and effectively. Therefore, no pre-conditioning was required prior to the next analysis and the fibers were only washed with DDW to remove the solvents residue.
3.5 Analytical figures of merit
The analytical figures of merit of the introduced procedure were evaluated under optimized conditions and the results were collected in Table 1. The wide linear ranges for the selected analytes were found from 0.13 to 643 μg L–1 with determination coefficient more than 0.99 in all cases. The Mandel’s fitting test was performed for linearity test of calibration curves. Mandel’s fitting test is offered by IUPAC and utilizes the difference of variance of residual standard deviation of linear (Sy1) and potential second order (Sy2) calibration models. This is compared to the standard deviation of the potential second order calibration model using the F-test (Eq. (1)).
Compounds
Analytical figures
LRa (µg L–1)
Slope ± Un.b
R2c
LODd (µg L–1)
LOQe (µg L–1)
RSDf (%) Intra-day
RSD (%) Inter-day
RSD (%) After one month
RSD (%) Report response
RSD (%) Single fiber
RSD (%) Repr.g
RSD (%) CRMh analysis
Naphthalene
1.00–50.0
2462.7 ± 0.13
0.990
0.300
1.00
4.90
5.80
4.60
5.41
6.65
5.68
4.25
Phenanthrene
0.65–390
17229 ± 0.09
0.996
0.190
0.65
3.70
4.83
3.38
4.09
4.53
4.01
–
Anthracene
0.13–173
39227 ± 0.06
0.998
0.039
0.13
4.65
7.71
2.10
5.24
7.11
6.54
4.11
Fluoranthene
0.21–643
6674.5 ± 0.02
0.998
0.060
0.21
3.05
4.68
1.71
3.19
5.47
4.85
–
Pyrene
0.13–532
6290.7 ± 0.06
0.998
0.039
0.13
2.50
3.35
0.40
2.88
3.95
3.30
–
For all the analytes, the Fexperimental (for confidence level of P = 95%) were extracted from the experimental calibration data and calibration functions. In each case, comparison of Fexperimental with corresponding critical values, Fcritical (from the table) demonstrate that the second order function does not cause a remarkable better result, and thus the linear calibration function was preferably considered.
The limit of detection (LOD) and limit of quantification (LOQ) of the method (based on the four repeated analysis of blank samples) were in the range of 0.039–0.30 μg L–1 and 0.13–1.00 μg L–1, respectively. The fiber to fiber intra-day and inter-day relative standard deviations (RSDs) of four repeated runs of the real samples spiked at 10 μg L–1 were presented at the range from 2.50 to 4.90% and 3.35 to 7.71%, respectively. The single fiber RSDs was also between 3.95 and 7.11 μg L–1. In addition, four new fibers were prepared in the same day under identical conditions and stored in laboratory ambient. In this case, the extraction performance of the fibers was assessed after 1 month. The results showed no decrease in the fibers efficiency and the RSDs value was found in the range from 0.40 to 4.60%. It seems that the volatile components of coating material will be evaporated over the time and probably the structure of the sorbent become more coherent and orderly, resulting in improved fiber performance. This phenomenon may keep the fiber efficiency for a long time. Accordingly, the RSDs values obtained after one month are better than the results of newly prepared fibers. In addition, the RSDs of response factor (RF) were calculated for each analytes. In chromatographic analysis, RF is the ratio between the concentration of a substance and the response of detector (peak area or height) for it. RF is mostly utilized to correct the difference in detector response of impurities with the peak of analytes. Thus, the unit of RF is obtained from the ratio of Response (in response units)/concentration (in mg/mL). The RF Unit in This work is µV-min/mg mL−1. Here, the RSDs of RF for analyzed compounds were in the range between 2.88 and 5.81 μg L–1. The RSDs values of preparation reproducibility were also in the range of 3.95–7.11 μg L–1. Based on the results, the fiber reproducibility and repeatability are remarkably acceptable when a first-hand commercial AC wire is used. The fabrication process of the fibers was very easy and over 95% of the products presented good reproducibility. Although the fibers were prepared manually, sufficient attention was paid on the preparation of them. In other words, by carefully following the preparation tips and steps, the prepared fibers were very similar. It should be mentioned that the physical polishing of adsorbent layer from the fiber surfaces and re-instruction of the adsorbent on the second-hand AC wires made poor reproducibility and repeatability. In these conditions, 30% of instructed fibers were out of order, and the fibers with similar properties should be selected to achieve acceptable repeatability. Moreover, repeatability examination of the single fiber illustrated that, there was no noticeable change in chromatographic responses up to 25 repetitive measurements. However, after that, about 8.6% of its efficiency was reduced. Nevertheless, in this work, to achieve good recoveries and repeatable results, each fiber was not used more than 10 times.
Moreover, to ensure the efficiency of method, two CRM samples of naphthalene and anthracene was analysed by the proposed technique for five repetitive runs. The RSDs were 4.25 and 4.11 μg L–1 for the naphthalene and anthracene, respectively that confirmed the high effectiveness of the developed procedure.
3.6 Real samples analysis
The prepared real samples were firstly investigated for the presence or absence of target analytes. After that, the samples were spiked with the standard solution of PAHs in two different levels (5.00 and 10.00 µg L–1). Then the samples were analysed with the offered process based on three repetitive measurements. Good recoveries (Table 2) in all cases were achieved in the range of 76.20–105.60% and proved the method ability for the simultaneous extraction and determination of PAHs in different samples. – ND. aRelative Recovery.
Compounds
Naphthalene
Phenanthrene
Anthracene
Fluoranthene
Pyrene
Samples
Added (µgL–1)
0.00
5.00
10.00
0.00
5.00
10.00
0.00
5.00
10.00
0.00
5.00
10.00
0.00
5.00
10.00
Rice
Found (µgL–1)
–
4.51
9.50
–
4.25
9.35
–
5.08
10.32
–
4.42
9.15
–
4.68
10.02
RR (%) ± RSD
–
90.20 ± 7
95.00 ± 3
–
85.00 ± 8
93.50 ± 5
–
101.60 ± 4
103.20 ± 2
–
88.40 ± 7
91.50 ± 4
–
90.36 ± 5
100.20 ± 2
Smoked rice
Found (µgL–1)
8.35
13.40
17.60
6.08
11.02
16.02
4.90
9.44
13.09
–
4.55
9.63
6.34
11.11
16.10
RR (%) ± RSD
–
100.10 ± 4
92.50 ± 7
–
98.80 ± 8
99.40 ± 2
–
90.80 ± 3
81.90 ± 5
–
91.00 ± 6
96.30 ± 8
–
95.40 ± 4
97.60 ± 2
Barley
Found (µgL–1)
–
5.22
9.90
2.70
6.76
11.66
–
5.06
9.98
–
3.91
8.88
–
4.12
10.30
RR (%) ± RSD
–
104.40 ± 2
99.00 ± 5
–
81.36 ± 3
89.60 ± 8
–
101.20 ± 2
99.80 ± 5
–
78.20 ± 6
88.80 ± 7
–
82.40 ± 5
103.00 ± 2
Wheat
Found (µgL–1)
–
4.74
10.56
4.14
8.84
14.29
–
5.08
10.25
–
4.55
10.00
–
4.12
9.88
RR (%) ± RSD
–
94.80 ± 7
105.60 ± 2
–
94.00 ± 6
101.50 ± 4
–
101.60 ± 5
102.50 ± 4
–
91.00 ± 3
100.00 ± 2
–
82.40 ± 4
98.80 ± 3
Soybean
Found (µgL–1)
–
3.81
9.46
2.91
7.82
13.42
3.55
7.58
14.09
–
4.29
8.94
–
4.68
9.00
RR (%) ± RSD
–
76.20 ± 6
94.60 ± 3
–
98.20 ± 5
105.10 ± 4
–
80.60 ± 6
105.40 ± 2
–
85.80 ± 6
89.40 ± 8
–
93.60 ± 8
90.00 ± 6
Corn
Found (µgL–1)
5.08
9.73
15.00
–
4.74
9.75
–
4.61
9.60
3.50
7.95
13.39
–
5.04
10.61
RR (%) ± RSD
–
93.00 ± 7
99.20 ± 2
–
94.80 ± 4
97.50 ± 5
–
92.20 ± 5
96.00 ± 3
–
89.00 ± 8
98.90 ± 4
–
100.80 ± 5
106.10 ± 3
The chromatograms of Fig. 5 were obtained under optimized conditions by utilizing of the CAC-SPME/CFYM/GO fiber and clearly exhibited the method performance. Smoked rice sample was selected for this work (I). The sample was spiked with the standard solution of PAHs at the concentration of 5.0 µg L–1 (II). Both of these samples were analyzed individually by the developed technique. The result was shown that the smoked rice was contaminated with naphthalene, phenanthrene, fluoranthene and pyrene. The sample may have become contaminated during the smoking process. The results were confirmed that the proposed technique not to be affected by the sample matrices and can be successfully employed for the extraction and determination of analytes in different standard and real samples.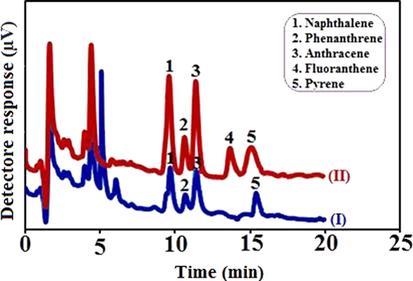
Chromatograms obtained by utilizing CAC-SPME/CFYM/GO fiber for smoked rice sample (I) and the same sample spiked with 5.0 µg L–1 of selected PAHs (II).
3.7 Robustness of the method
To ensure the robustness of the AC-fiber, its stability was investigated at different temperatures and solvents. For thermal stability, a number of AC-fibers were separately stored at different temperatures from −25 to 150 °C for two hours. For examination of the fiber chemical stability, some AC-fibers were individually immersed in water, methanol, acetone, acetonitrile and n-hexane for 5 h at laboratory temperature. Then the fiber coating process and other analysis steps were done for all of these fibers. There was no changes in the method efficiency were observed. These results proves the good mechanical stability and resistance properties of the AC alloy for utilizing as the SPME fiber substrate.
On the other hand, the prepared coating stability in various temperatures and media during extraction process should be evaluated. For evaluation of thermal stability of the CFYM/GO, the coated fibers were stored at different temperatures ranged between 0 and 60 °C for two hours. Additionally, the chemical stability, adhesion and swelling behavior of CFYM/GO coating were examined by dipping the coated fibers in methanol, ethanol, acetone, n-hexane and THF. No observable swelling and stripping of coating were detected in none of the cases. Just in the terms of chemical stability, should emphasized that the addition of NaCl to the solution damages the fiber coating (“3.2.8. Salting-out effect” section). It was confirmed that the offered fiber kept its extraction efficiency at harsh conditions.
Another point that should be considered in the method robustness is the extraction time equilibrium changes with different concentrations. In general, when the concentration of analytes is low, the rate of mass transfer to the fiber surface decreases and more time is required for maximum adsorption. In contrast, in high concentration level, maximum adsorption is achieved in a shorter time via high rate of the mass transfer (Fig. 4SA). In the present study, the effect of different concentrations on the extraction time equilibrium was assessed in the range of 0.1–100 µg L–1. According to Fig. 4SB, concentration changes in the range of 2–80 µg L–1 did not possessed a significant effect on the equilibrium time. However at the higher concentrations, the equilibrium was established in a shorter time.
The results of pH effect and the RSDs value after one month, that are described in the previous sections, also emphasize the developed method stability.
As know, low adhesion and stripping of the fiber coating is one of the main problems of the conventional SPME fibers. Various factors such as high thickness of the coating materials, chemical instability, changes of the sample temperature and/or pH and lack of proper chemical bonding are the most important factors affecting the adhesion of coating to the fiber surface. As it was completely explained, the CFYM/GO nanocomposite possesses good resistance to the temperature and pH changes, and has proper chemical stability in various media. It also does not stripping off over time and during stirring the sample solution, even after several uses. The coating does not move off from the surface due to possible contact with hands or different objects or hit. In addition, as clearly stated “Characterization” section, there are different metal and metal oxides on the fiber surface and the CFYM/GO sorbent possesses several functional groups. The interaction between these groups and forming the probable chemical bonds will cause high adhesion between the coating and the AC-fiber surface. All this proves the high adhesion and strong connection of the coating to the metal surface.
3.8 Comparison with other PAHs determination procedures
The present study has two main innovations: one is utilizing the green and affordable materials, eco-friendliness bio-waste (CFYM) as the SPME coating material. The other one is the coiled form as a new idea in the SPME fiber design, presenting highly improved extraction efficiencies via increasing the length and surface area of designed fiber without increasing the costs. Designing the fiber in the coiled form demonstrates that it is possible to design fibers in new and different shapes than conventional fibers, which results in the improvement of extraction efficiency. In addition, employing an alloy as the fiber substrate is a new concept in the development of fiber substrates with better physicochemical properties than the typical metal fibers. Since the proposed fiber was not studied previously, can be considered as a novelty in the design and fabrication of SPME fibers and pave the way for further researches. In addition, the CFYM layer is composed of different super biomolecules and is a rich source of —OH, —NH2 and —COOH functional groups, which gives high adsorption properties to it.
The functional groups in CFYM medium cause it to compose with other nanostructured materials like graphene oxide. Therefore, GO nanoparticles are easily dispersed into CFYM matrix. On the other hand, low adhesion of coating materials to the fiber surface and stripping of coating are two big drawbacks of the conventional SPME fibers. While CFYM gel, can acts as a glue that properly adheres to the surface and possesses good stability in different conditions. In Table 3, the presented procedure is compared with some similar and non-similar PAHs determination techniques. As can be seen in the Table, the selected real samples in the other researches possess mostly simpler matrices than the offered method. However, the proposed technique gave better results than other techniques in most cases, including linear range, LODs, RSDs value and the extraction. In spite of more sensitive detectors used in the most reported methods) in this Table, the results of the current work performed with UV detector could be quite acceptable. Therefore, the successful employing of the chicken feet yellow membrane biowaste as the PAHs sorbent recommends the creation of a new, high efficient, low-priced and green SPME fiber coating material, and the proposed fiber can be successfully used for routine analysis of PAHs.
Analytical technique
Fiber coating
Samples
LR (µg L–1)
LOD (µg L–1)
RSD%
Extraction time (min)
Ref.
D-µ-SPE-GC-FID
PDMS/DVB
Water
0.005–3.00
0.004–0.20
<13.00
30
Wang et al. (2013)
HS-SPME-GC-FID
Ionic liquids
Potatoes;
Food-wrap0.05–50.00
0.015–0.025
2.40–9.60
40
Hou et al. (2016)
On-line in-tube SPME-HPLC-FLD
PDMS
Tea;
Food samples0.0032–0.0463
0.05–0.20
3.60–7.60
20
Ishizaki et al. (2010)
SPME-HPLC-UV
CFYM
Groundwater;
River water0.005–100.00
0.14–1.83
4.40–8.20
90
Farrokhzadeh and Razmi (2018a,b)
C-SPME-HPLC-UV
Bone wastes
Tab water;
Well water;
Roadside soil0.01–99.00
0.03–0.10
3.10–9.00
70
Razmi and Farrokhzadeh (2017)
SPME-HPLC-FLD
PDMS/DVB
Water
0.40–169.9
0.07–0.99
9.90–13.10
90
Acevedoet al. (2013)
C-SPME-HPLC-UV
CFYM/GO
Rice;
Smoked rice;
Soybean;
Barley;
Wheat;
Corn0.13–643
0.039–0.30
2.50–4.92
30
This work
4 Conclusion
Due to the importance of the SPME procedure in the sampling and sample preparation and also the need to produce new SPME fibers and coating materials with better characteristics than commercial ones, a novel CAC-SPME/CFYM/GO fiber was introduced in this article for the first time. The presented fiber was fabricated easily by using a commercial Al/Cr alloy with a green coating material of chicken feet yellow membrane/graphene oxide nanocomposite (CFYM/GO). Rigidity, cost effective, high adhesion of the sorbent to the fiber surface, environmental friendliness, good extraction capability and high precision are the main features of the proposed fiber. The experimental results were presented that the offered fiber possesses strong application potentials in the high-efficient SPME extraction process. Additionally, the precise analytical results obtained in assay of some real samples could confirm the capability of the reported green method for utilizing in the simultaneous measurement of target analytes in different matrices.
Acknowledgment
The authors gratefully acknowledge the Research Council of Azarbaijan Shahid Madani University for financial support.
Declaration of Competing Interest
The authors declare that they have no known competing financial interests or personal relationships that could have appeared to influence the work reported in this paper.
References
- A new SPME thermal desorption interface for HPLC. J. Anal. Sci. Meth. Instrum.. 2013;3:219-226.
- [Google Scholar]
- Aluchrom (Iron-Chromium-Aluminum) FeCrAl electric resistance heating elements, https://super-metals.com/wp-content/uploads/2015/05/FeCrAl-heating-elements.pdf (accessed: September 2020).
- A green adsorbent for the removal of BTEX from aqueous media. RSC Adv.. 2016;6:14290-14305.
- [Google Scholar]
- Solid-phase microextraction fiber development for sampling and analysis of volatile organohalogen compounds in air. J. Environ. Health Sci. Eng.. 2014;12:1-8.
- [Google Scholar]
- Adsorptive removal of anionic dye from aqueous solutions using powdered and calcined vegetables wastes as low-cost adsorbent. Arab J. Basic Appl. Sci.. 2018;25:1-10.
- [Google Scholar]
- Brian, D.C., 2017. Freedom and resistance in the act of engraving (or, Why Durer gave up on etching), Art in Print. https://artinprint.org/article/freedom-and-resistance-in-the-act-of-engraving-or-why-durer-gave-up-on-etching/.
- New advanced materials and sorbent-based microextraction techniques as strategies in sample preparation to improve the determination of natural toxins in food samples. Molecules. 2020;25:702-734.
- [Google Scholar]
- PAHs in corn grains submitted to drying with firewood. Food Chem.. 2017;215:165-170.
- [Google Scholar]
- Facile preparation of a chicken feet yellow membrane coated fiber for application in solid-phase microextraction. Sep. Sci. Plus. 2018;1:430-438.
- [Google Scholar]
- Use of chicken feet yellow membrane as a biosorbent in miniaturized solid-phase extraction for determination of polycyclic aromatic hydrocarbons in several real samples. Microchem. J.. 2018;142:403-410.
- [Google Scholar]
- Optimization of extraction conditions for polycyclic aromatic hydrocarbons determination in smoked rice using the high performance liquid chromatography-fluorescence detection. J. Food Meas. Charact.. 2020;14:1236-1248.
- [Google Scholar]
- Recent advances of ionic liquids in sample preparation. TRAC Trend. Anal. Chem.. 2020;125:115833.
- [Google Scholar]
- An ionic-liquid-modified melamine-formaldehyde aerogel for in-tube solid-phase microextraction of estrogens followed by high performance liquid chromatography with diode array detection. Microchim. Acta. 2019;186:1-8.
- [Google Scholar]
- Development of a solid-phase microextraction (SPME) fiber protector and its application in flammable liquid residues analysis. Forensic. Sci. Int.. 2018;292:138-147.
- [Google Scholar]
- Bis(trifluoromethanesulfonyl)imide-based ionic liquids grafted on graphene oxide-coated solid-phase microextraction fiber for extraction and enrichment of polycyclic aromatic hydrocarbons in potatoes and phthalate esters in food-wrap. Talanta. 2016;153:392-400.
- [Google Scholar]
- Determination of polycyclic aromatic hydrocarbons in food samples by automated on-line in-tube solid-phase microextraction coupled with high-performance liquid chromatography-fluorescence detection. J. Chromatogr. A. 2010;1217:5555-5563.
- [Google Scholar]
- Graphene oxide: a promising carbocatalyst for the regioselective thiocyanation of aromatic amines, phenols, anisols and enolizable ketones by hydrogen peroxide/KSCN in water. New J. Chem.. 2016;40:2547-2553.
- [Google Scholar]
- Preparation of a novel sol-gel molecularly imprinted polymer with dummy template for online solid-phase extraction of patulin from apple juice samples. Int. J. Anal. Tech.. 2016;2:1-7.
- [Google Scholar]
- Polycyclic aromatic hydrocarbons and hopanes in PM1 aerosols in urban areas. Atmos. Environ.. 2013;67(2013):27-37.
- [Google Scholar]
- Carbon nano tube-coated solid-phase microextraction metal fiber based on sol-gel technique. J. Chromatogr. A. 2009;1216:4641-4647.
- [Google Scholar]
- Recent review on carbon nanomaterials functionalized with ionic liquids in sample pretreatment application. TrAC Trend. Anal. Chem.. 2019;120:115641.
- [Google Scholar]
- Recent Trends in microextraction techniques employed in analytical and bioanalytical sample preparation. Separations. 2017;4:1-15.
- [Google Scholar]
- Disposable ionic liquid-coated etched stainless steel fiber for headspace solid-phase microextraction of organophosphorus flame retardants from water samples. RSC Adv.. 2015;5:1934-41940.
- [Google Scholar]
- Application of sunflower stalk-carbon nitride nanosheets as a green sorbent in the solid-phase extraction of polycyclic aromatic hydrocarbons followed by HPLC. J. Sep. Sci.. 2018;4:2020-2028.
- [Google Scholar]
- Preparation of a robust and sensitive gold-coated fiber for solid-phase microextraction of polycyclic aromatic hydrocarbons in environmental waters. Anal. Lett.. 2014;47:1759-1771.
- [Google Scholar]
- Collagen XVIII mutation in Knobloch syndrome with acute lymphoblastic leukemia. Am. J. Med. Genet. A. 2010;152A:2875-2879.
- [Google Scholar]
- Recent development and applications of poly (ionic liquid)s in microextraction techniques. TrAC Trend. Anal. Chem.. 2019;112:123-134.
- [Google Scholar]
- Establishing collagen quality criteria for sulphur isotope analysis of archaeological bone collagen. Archaeol. Anthrop. Sci.. 2009;1:59-75.
- [Google Scholar]
- Synthesis and characterization of sulfophenyl-functionalized reduced graphene oxide sheets. RSC Adv.. 2017;7:27224-27234.
- [Google Scholar]
- Parasuraman, S., 2020. MM5017: Electronic materials, devices, and fabrication. Lecture 26: Etching and deposition. https://nptel.ac.in/content/storage2/courses/113106062/Lec26.pdf (accessed September 2020).
- A Simple approach to stepwise synthesis of graphene oxide nanomaterial. J. Nanomed. Nanotechnol.. 2015;6:1-4.
- [Google Scholar]
- Graphene quantum dots–eggshell nanocomposite to extract polycyclic aromatic hydrocarbons in water. Environ. Chem. Lett.. 2016;14:521-526.
- [Google Scholar]
- Introduction of a coiled solid-phase microextraction fiber based on a coating of animal bone waste for chromatographic analysis. J. Sep. Sci.. 2017;40:1747-1754.
- [Google Scholar]
- Introduction of coiled solid phase microextraction fiber coated by mesoporous silica/cetyltrimethylammonium bromide for ultra-trace environmental analysis. J. Chromatogr. A. 2017;1506:1-8.
- [Google Scholar]
- Introduction of commercial heating elements of resistance metal alloys as the novel solid-phase microextraction fibers for chromatographic monitoring of organic pollutants. J. Iran. Chem. Soc.. 2020;17:1111-1121.
- [Google Scholar]
- Determination of mercury in real water samples using in situ derivatization followed by sol-gel solid-phase microextraction with gas chromatography-flame ionization detection. J. Chromatogr. Sci.. 2012;52:81-87.
- [Google Scholar]
- Comparison of headspace–SPME and SPME-Arrow–GC–MS methods for the determination of volatile compounds in Korean salt–fermented fish sauce. Appl. Biol. Chem.. 2019;62:1-8.
- [Google Scholar]
- Ionic liquid-functionalized silica aerogel as coating for solid-phase microextraction. J. Chromatogr. A. 2018;1583:48-54.
- [Google Scholar]
- Extraction, identification and quantification methods of rice aroma compounds with emphasis on 2-Acetyl-1-Pyrroline (2-AP) and its relationship with rice quality: a comprehensive review. Food Rev. Int.. 2020;18:1-52.
- [Google Scholar]
- Adsorption of polycyclic aromatic hydrocarbons by graphene and graphene oxide nanosheets. Environ. Sci. Technol.. 2014;48:4817-4825.
- [Google Scholar]
- Determination of Triazolefungicides in vegetable samples by magnetic solid-phase extraction with graphene-coated magnetic nanocomposite as adsorbent followed by gas chromatography–mass spectrometry detection. Food Anal. Meth.. 2013;7:318-325.
- [Google Scholar]
- Zn (II)-imidazole derived metal azolate framework as an effective adsorbent for double coated solid-phase microextraction of sixteen polycyclic aromatic hydrocarbons. Talanta. 2020;214:120866.
- [Google Scholar]
- Hydrofluoric acid etched stainless steel wire for solid-phase microextraction. Anal. Chem.. 2009;81:4971-4977.
- [Google Scholar]
- Effect of PVA addition on SO2 adsorption properties of GO fibers. IOP Conf. Ser. Mater. Sci. Eng.. 2018;460:012050.
- [Google Scholar]
Appendix A
Supplementary data
Supplementary data to this article can be found online at https://doi.org/10.1016/j.arabjc.2020.09.021.
Appendix A
Supplementary data
The following are the Supplementary data to this article: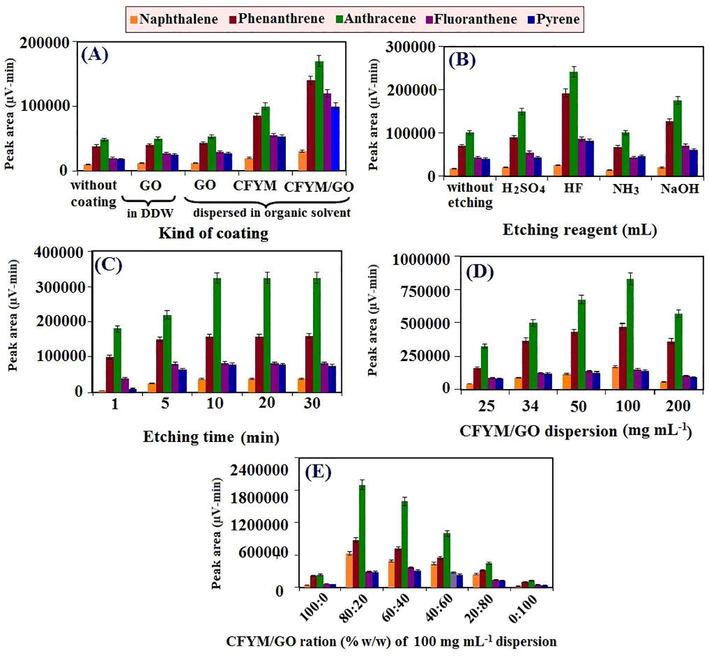
The effect of important parameters on the CAC-SPME-CFYM/GO fiber fabrication: (A) kind of fiber coating (Other conditions: sample volume: 25 mL; analytes concentration: 10 µg L-1; extraction time: 30 min; desorption solvent: acetonitrile (2 mL); desorption time: 5 min; stirring rate: 200 rpm; temperature: laboratory temperature; n=3 and statistical metric used to create the error bars: standard deviation), (B) etching reagent (Other conditions: conditions of (A) and kind of coating: CFYM/GO), (C) etching time (Other conditions: conditions of (B) and etching reagent: HF), (D) CFYM/GO dispersion (Other conditions: conditions of (C) and etching time: 10 min) and (E) CFYM/GO ratio (Other conditions: condition of (D) and CFYM/GO dispersion: 100 mg mL-1).
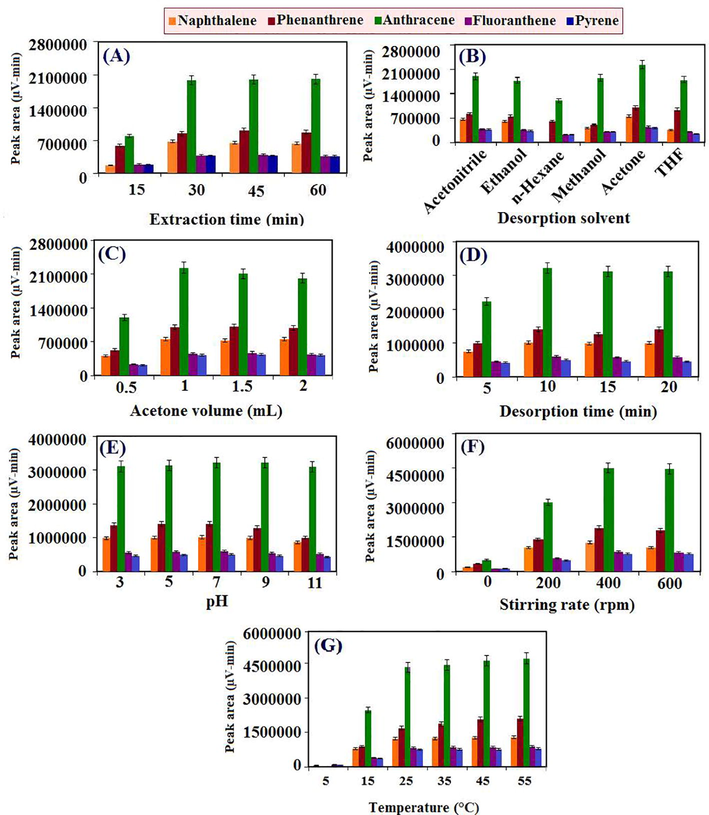
The effect of different experimental conditions on the developed method efficiency achieved by using CAC-SPME/CFYM/GO fiber: (A) extraction time (Other conditions: sample volume: 25 mL; analytes concentration: 10 µg L-1; desorption solvent: acetonitrile (2 mL); desorption time: 5 min; stirring rate: 200 rpm; kind of coating: CFYM/GO; etching reagent: HF; etching time: 10 min; CFYM/GO dispersion: 100 mg mL-1; CFYM/GO ratio: 80:20; temperature: laboratory temperature; n=3 and statistical metric used to create the error bars: standard deviation), (B) desorption solvent (Other conditions: conditions of (A) and extraction time: 30 min), (C) acetone volume (Other conditions: conditions of (B) and desorption solvent: acetone), (D) desorption time (Other conditions: conditions of (C) and acetone volume: 1 mL), (E) pH (Other conditions: conditions of (D) and desorption time: 10 min), (F) stirring rate (Other conditions: conditions of (B) and pH: without control) and (G) temperature of sample solution (Other conditions: condition of (E) and stirring rate of 400 rpm).
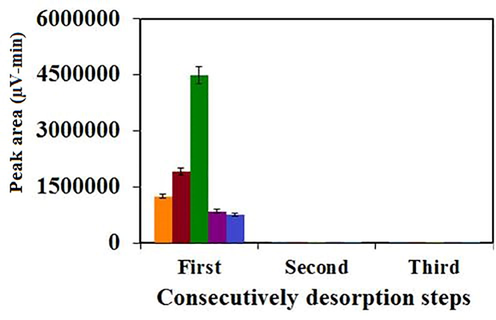
Evaluation of on-fiber carry-over at the optimized conditions (Desorption solvent: acetone, volume of desorption solvent: 1 mL, statistical metric used to create the error bars: standard deviation and n=3).
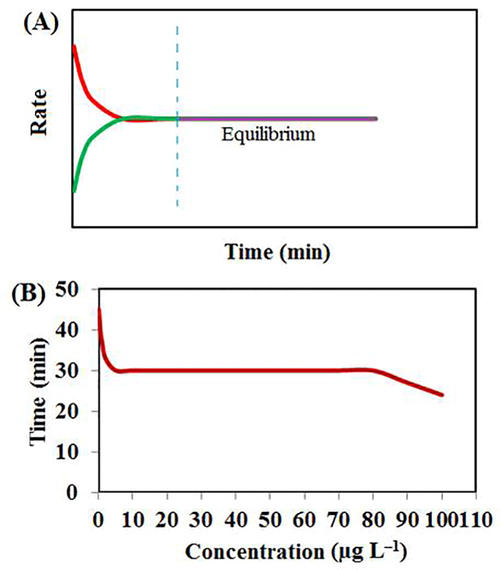
Schematic rate-time graph (A), the effect of changing concentrations on the extraction time equilibrium (B), (Other conditions: sample volume: 25 mL; desorption solvent: acetonitrile (2 mL); desorption time: 5 min; stirring rate: 200 rpm; kind of coating: CFYM/GO; etching reagent: HF; etching time: 10 min; CFYM/GO dispersion: 100 mg mL-1; CFYM/GO ratio: 80:20; desorption solvent: acetone; acetone volume: 1 mL, desorption time: 10 min; pH: without control and stirring rate of 400 rpm).
Supplementary Table 1S
Supplementary Table 1S


