

Translate this page into:
Introduction of CdO nanoparticles into graphene and graphene oxide nanosheets for increasing adsorption capacity of Cr from wastewater collected from petroleum refinery
⁎Corresponding author. iffichemixt266@gmail.com (Irfan Ijaz)
-
Received: ,
Accepted: ,
This article was originally published by Elsevier and was migrated to Scientific Scholar after the change of Publisher.
Peer review under responsibility of King Saud University.
Abstract
Graphene and graphene oxide nanocomposites are promising and fascinating types of nanocomposites because of their fast kinetics, unique affinity for heavy metals, and greater specific area. Initially, in this study, a green, cost-effective and facile method was utilized to prepare G, GO, CdO, G-CdO, and CdO-GO nanocomposites by Azadirachta indica and then analyzed using UV–vis spectroscopy, Fourier-transform spectroscopy, Raman, X-ray diffraction and scanning electron microscope. The synthesized nanocomposites were explored for chromium elimination from wastewater collected from a petroleum refinery. CdO-GO, G-CdO nanocomposites showed remarkable adsorption capability of 699 and 430 mg g−1 which was higher than G (80 mg g−1), GO (65 mg g−1), and CdO (400 mg g−1). Based on the R2 (correlation coefficient) values, the kinetic statistics of Cr (VI) onto the G, GO, CdO, G-CdO, and CdO-GO were effectively obeyed by pseudo-second-order than by all other models. The R2 values for the five nano-bioadsorbents were extraordinarily high (R2 greater than 0.990) which ensured the chemisorption. This study ensured that the adsorptive removal rate of Cr (VI) is still greater than 85 % after repeated five cycles, suggesting that the produced nanomaterials are adsorbents with strong recyclability.
Keywords
Graphene
Graphene oxide
Nano-biosorbent
Azadirachta indica
chromium (VI)

1Introduction
Cadmium oxide (CdO), found naturally in single crystals of red monteponite or the rare mineral brown, is an n-type oxide belonging to the II-VI group. Various research articles have been published over the last decades which described basic chemical and physical principles of the synthesis of nanoparticles. In particular, oxides of various metals like Zinc, Indium, tin, and cadmium and their composites have attracted remarkable attention. It has a direct and indirect band gap of 2.2–2.5 eV and 1.36–1.98 eV, respectively. Intrinsic Cadmium and Oxygen vacancies are responsible for the large disparity in direct and indirect band gaps. Cadmium oxide belongs to an n-type class of semiconductors, that shows a cubic rocksalt-type crystal structure having a 2.1 eV bandgap at room temperature(Jefferson et al., 2008). It is utilized for gas sensors (Ferrer, 1993), the transparent electrode (Su et al., 1984), and photocell (Champness et al., 1981).
Heavy metal pollution of water streams is regarded as a crucial environmental threat all over the globe due to their being highly hazardous (Husein and Treatment, 2013). Heavy metals show five times higher density as compared to water and are hazardous to human health at part per billion levels(Gumpu et al., 2015). Excessive heavy metal intake, whether direct or indirect, through the food chain or contaminated water, has a negative impact on the nervous and reproductive systems, damages vital organs such as the lung, kidney, and liver, and can cause a number of diseases such as Parkinson's and Alzheimer's (Jaishankar et al., 2014). Contamination of aqueous media due to Cr is one of the primary threats to the ecosystem. Effluents from industries in chrome plating, leather waste, pigments, paints, etc., are the main sources of contamination(Kumar and Dwivedi, 2021). Cr occurs mainly in III and VI oxidations states. Chromium (III) is an essential state in trace amounts, while Cr (VI) is highly hazardous. Chromium (VI) toxicities involve carcinogenic, mutagenic, and teratogenic effects. The permissible value for chromium (VI) potable water is 0.05 mg/L and for release into aqueous media is 0.1 mg/L. Chromium (VI) also badly affects the nervous system, kidneys, lungs, and liver of mammals. Generally, Cr is highly toxic and noxious to the environment as well as terrestrial and aquatic life. Excess release of Cr causes skin diseases, ulceration of mucous membranes, and respiratory tract infection, whereas ingestion of Cr causes hemorrhage, diarrhea, and vomiting.
Therefore, the elimination of chromium and several other heavy metals from water bodies (lakes, rivers, and streams) is a necessity. In the past, several conventional approaches were utilized to eliminate heavy metals involving precipitation, ion exchange(Zimmermann et al., 2021), coagulation(Lin et al., 2021), membrane separation(Feng et al., 2020), Filtration(McBeath et al., 2021), and chemical reduction(Sahu et al., 2021). These methods have their drawbacks, such as being difficult to operate, high cost, and energy intensive. Among these methods, adsorption has gained remarkable attention due to its simplicity, cost efficiency, high efficiency, flexibility, and ease of operation.
Several materials have been utilized i.e. metal oxide/gelatin composite(Kim et al., 2021), biopolymer(Wu et al., 2012), resins(Kulkarni et al., 2018), zeolites(Razavi et al., 2021), rice husk(Dada et al., 2013), and carbon(Dong et al., 2018) to eliminate heavy metals. Moreover, these materials have a few disadvantages due to their comparatively less stability and lower sorption efficiency for toxic heavy metals. Nowadays, G has shown tremendous potential applications in different technology fields, particularly as a heavy metal adsorbent due to its larger surface area and tremendous thermal conductivity. Despite its enhanced properties, graphene prefers aggregation due to the presence of effective van der Waal interaction between the layers of graphene nanosheets. This limitation limits the use of graphene in a variety of applications which can be overcome by combining graphene with inorganic nanoparticles, particularly those with a greater surface-to-volume ratio. Graphene-based materials with different inorganic nanoparticles may have a significantly increased surface area. As a result, graphene has piqued the scientific community's interest.
The refining of petroleum and the formation of petroleum wastewater are key challenges due to the increasing global energy consumption, which is predicted to grow by 44 % over the next two decades. The remediation of petrochemical effluent is a hotly debated topic. Petroleum refineries generate huge volumes of wastewater, comprising oil well-generated water churned up during oil drilling, which frequently comprises refractory chemicals and is high in organic pollutants. Petroleum wastewater composition varies based on geographical region, crude quality, and operational conditions(Bakke et al., n.d.). It's usually a complicated mixture of organic and inorganic substances that's very poisonous and could harm the ecosystem if released into the environment.
A prominent way of treating Petroleum wastewater is to utilize adsorbents to remove harmful components by adsorption(de Abreu Domingos and da Fonseca, 2018). For example, activated carbon obtained from a variety of sources is an effective adsorbent for wastewater treatment(Anirudhan et al., 2009)(Chen et al., 2019)(El-Naas et al., 2010)(Kabbashi et al., 2020)(Masoud et al., 2016)(Singh et al., 2020). However, because it is costly, the quest for low-cost replacement materials has been a major research priority. Renewability, local availability, eco-friendly, and high adsorption capacity are all important characteristics to consider when choosing adsorbent materials(Sreenilayam et al., 2021)(Habeeb et al., 2020)(Nwidi and Agunwamba, 2015). Bio-based substances, such as phytoconstituents, are now being investigated as alternative adsorbents that meet several of the listed conditions.
The medicinal benefits of Azadirachta indica (neem) are outstanding. Flavonoids, alkaloids, terpenoids, and polyphenols are among the biologically active phytochemicals found in Azadirachta indica leaves, and these can be utilized to reduce nanoparticles(Dubey et al., 2009).
The basic aim of this study is the synthesis of G and GO nanosheets and their nanocomposites by utilizing Azadirachta indica extract and characterization of prepared nanosheets, nanoparticles, and nanocomposites and also evaluating their effective role in the removal of Cr (VI) from wastewater collected from a petroleum refinery. Kinetics, isotherm, and the thermodynamic result are explained well using different isotherm and kinetic models.
2 Materials and methods
2.1 Chemicals used
All of the equipment employed for the experimentation had quick-fit standard joints and was dried at 110 °C. The chemicals used for this work were sodium sulphate (Merck), Potassium permanganate (Merck), hydrogen peroxide (Merck), hydrochloric acid (Merck), and cadmium nitrate (Merck). Throughout this work, deionized water with no elemental composition was employed. Hp pencils were purchased from the native market and utilized as a source of graphite. All chemicals utilized in this research were pure and utilized without any purification. The wastewater was collected from Pakistan Oil Refinery in Karachi, Pakistan.
2.2 Azadirachta indica collection and extraction
The Azadirachta indica leaves were used for synthesis and obtained from native Pakistani Nursery. A Botanist at the department of botany, Punjab University Lahore (PU) certified the A. Indiaa. The A. indica leaves were washed with tap water and completely dried at room temperature. FineIndiaunded A. indica (10 g) leaves were added to 100 mL boiled water and constantly heated for 90 min at 70 °C. The resultant mixture was cooled at room temperature and then carefully filtered utilizing filter paper. The aqueous extract of A. indica was utilized in the synthesis of CdO NPs because water is considered the greenest solvent Water is considered an interesting solvent because of the physiochemical transformation of water from ambient to near critical temperature due to which subcritical water extraction can be carried out. Another reason for choosing water as a solvent is cost-efficient, easily available, and safe solvent for extraction(Castro-Puyana et al., 2017).
2.3 Preparation of graphene nanosheets
The electrochemical exfoliation method had been used to create graphene(Hassanien et al., 2019). Two pencil rods (graphite) were introduced as electrodes and a 2 M sodium sulfate (Na2SO4) solution was utilized as an electrolyte in the electrochemical cell. The exfoliation procedure was carried out at a voltage of 12. The collected graphene nanosheets, which settle down as black fragments, were cleaned with distilled water and sonicated for up to 20 min to complete exfoliation. The prepared graphene nanosheets were washed and further dried at 55 °C for 3 hr.
2.4 Synthesis of graphene oxide nanosheets
The GO NPs were created using a modified Hummers method with expandable graphite powder as the starting material. The properties and structure of GO are determined by the synthesis procedures used and the degree of oxidation. In short, sodium nitrate (3 g) and graphite powder (3 g) were stirred in 85 % sulphuric acid for 6 hrs. Potassium permanganate (13 g) was progressively into the mixture solution and kept temperature lower than 10 °C. The resultant mixture was diluted with water and again stirred at 40–45 °C for 2 h until a brown past is formed.
Further, the resultant product was kept in the reflux system for 15 min at 55 °C and 35 °C for the next 10 min. The same product was kept at 30 °C for 3 h while being stirred. The reaction was stopped by adding 150 mL of distilled water and 58 % hydrogen peroxide solution (40 mL). The resultant mixture was washed via centrifugation with 15 % hydrochloric aqueous solution followed by double distilled water until the pH of the reaction become 7 (neutral) and the same product was then sonicated. The obtained precipitate is dried at 70 °C for 12 h to produce GO NPs.
2.5 Preparation of CdO nanoparticles
For the A. indica – mediated Cdo nanoparticles, we utilized the aqueous extract of A. indica that was prepared in last the step. For this purpose, 15 mL of 10 % A. indica extract was added to 50 mL of 2 mM cadmium nitrate solution under constant stirring. The resultant solution was then aged at a temperature of 80 0C for 3 hrs and resulted in the precipitates. These precipitates were isolated by utilizing centrifugation (Lasec Sigma) at 800 rpm for 15 min. The final A. indica- mediated CdO nanoparticles were frozen, dried, and store at 4 °C until further use.
2.6 Preparation of G-CdO nanocomposites
About 0.5 g of prepared graphene was dispersed in 200 mL A. indica extract at 37 °C. Then 2 mM solution of Cd (NO3)2 was added to the graphene under continuous stirring for 50 min. The resultant precipitate was centrifuged using Lasec Sigma, further washed, dried at room temperature, and calcined as conducted cadmium oxide nanoparticles formation.
2.7 Preparation of CdO-GO nanocomposites
Initially GO nanosheets were prepared by the following procedure under subheading 2.3. Furthermore, a solution of cadmium nitrate spread in 60 mL of double distilled water was transposed to the above GO media. After stirring for 10 min, 3 M aqueous solution sodium hydroxide was transposed to the above mixture to keep pH in the range of 11, and then the resultant reaction mixture was stirred at 80 0C under optimum conditions and the final product was formed. The CdO-GO composites were centrifuged and cleaned with double distilled water repeatedly and dried the final product was in an oven for 1 day. The final product is stored for characterization. Schematics illustration of the preparation of CdO NPs, CdO-GO, G, and G-CdO composite is exhibited in Fig. 1.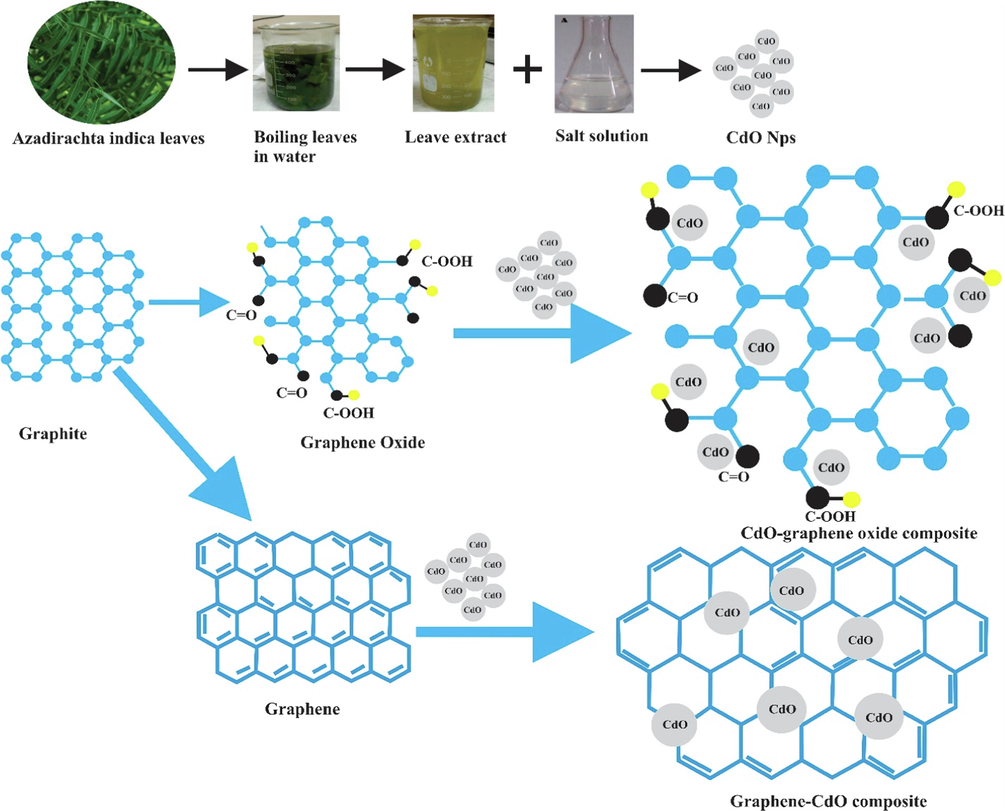
Schematics illustration of the preparation of CdO NPs, CdO-GO, G, and G-CdO composite.
2.8 Sample collection and processing
The wastewater was collected from Pakistan Oil Refinery in Karachi, Pakistan. The wastewater was evaluated to determine the mean concentration of Cr present using the standard method reported by(Agoro et al., 2020)(Hardi et al., 2019). After calculating the average quantity of chromium ion, wastewater was emulated in the laboratory the quantity of chromium ion was altered slightly above and below the calculated mean quantity. After calculating the average quantity of chromium ion, wastewater was emulated in the laboratory the quantity of chromium ion was altered exactly, slightly above, and below the calculated mean quantity. Before and after processing, the wastewater was studied to identify several physicochemical properties such as dissolved oxygen, total dissolved solids, Biochemical oxygen demand, total suspended solids, and pH using the protocol reported by(Osuoha and Nwaichi, 2019).
2.9 Preliminary phytochemical screening of Azadirachta indica leaves
Phytochemical constituents of aqueous extract of Azadirachta indica leaves were determined using the process as reported by Sosa and Soni(Sooad Al-daihan, 2012), and Harborne(Olivia et al., 2021).
2.10 Phytochemicals identification by GC–MS
The phytochemicals present in the Azadirachta indica leaves were identified and determined utilizing gas chromatography-mass spectroscopy conducted at an initial temperature of 30 0C and ignited up to 300 0C.
2.11 Characterizations
Different techniques were utilized to characterize the prepared nanoparticles or nanocomposites (G, GO, CdO, G-CdO, and CdO-GO). UV–vis spectrophotometer (V-780), FT-IR (Bruker ALPHA), Scanning electron microscope: SEM and Raman spectrometer (HR-TEC-785).
2.12 Adsorption experiment
To 25 mL of a solution containing Cr (VI), 0.3 g of each G and GO nanosheets, CdO Nps and their composites were mixed and stirred at 300 rpm. After 3 hrs, the resultant solution was investigated using AAS to evaluate the quantity of chromium ions. The effects of adsorbent (CdO, CdO-G) dose, initial conc of chromium ion, and pH on the adsorption behavior were reported in this article. The sorption Kinetic investigation was carried out by mixing 1–6 g of adsorbents and chromium solution having an initial concentration1-1500 mgL-1 at pH of 1–10 and measuring the residual chromium ion concentration at time (1–8 h) utilizing inductively coupled plasma optical emission spectrometry. The pH was monitored by adding HNO3 or NaOH.
The uptake or elimination/removal percent was measured by using equation (1)
The sorption capacity was measured using equation (2)
Where Ci and Ct are the chromium dosage (mg/L) in a liquid state before or after adsorption, respectively. m (g) is the weight of the nano-sorbent and V is the volume (dm3) in the liquid state.
2.13 Kinetic study
The possible heavy metal or dye sorption mechanism and rates-controlling step could be determined using the kinetics model. The kinetics of the sorption process was examined via pseudo-first-order, pseudo-second-order, Avrami, Bangham, intraparticle diffusion, Elovich, and fractional powder models.
The pseudo-first-order equation (3) indicates that the adsorption rate strongly depends on removal capability(Yuh-Shan, 2004)
qt and qe are chromium concentrations adsorbed by nanoparticles (mg/g) at equilibrium. K1 (mg/g) is rate constant (pseudo-first-order reaction).
The pseudo-second-order equation (4) shows that a sorption phenomenon is governed via a chemical mechanism, involving sharing between the nano-adsorbent and contaminates(Ho and McKay, 1999)
Where K2 is rate constant (pseudo-second-order).
Equations (5) and (6) described the linear and non-linear types of the Avrami model, respectively(Attama et al., 2007)
Avrami constant is denoted by KAV. nAv donated the exponent of time (Avrami model exponent) linked with change in the mechanism of sorption.
Equations (7) and (8) described the linear and nonlinear forms of the Elovich model(Juang et al., 1997)
Where α is an Elovich constant that described chemisorption and β is a constant that represents the amount of surface coverage.
EEquations9 and 10 described the nonlinear and linear form of the Fractional power kinetic model.
and log K are the slope and intercept of the plot of log t and log qt respectively. Therefore, the antilog of intercept provides the definite value of constant K.
The intraparticle diffusion kinetic model reported by Morris and Weber(Weber Jr and Morris, 1963)
Where Kint is the rate constant (for the intraparticle model). The value of C explains the thickness of the boundary. This implies that the larger the intercept (C), the significantly larger the impact of the boundary layer on the solution.
Adsorbate pore diffusion potential was examined via Bangham models and defined as in equation (12)
Where Ci has represented the initial conc of Cr (VI) solution in mg/L. V (mL) is the used volume of the Cr (VI) solution. The adsorbent’s mass is denoted by M (g/L). The amount of Cr (VI) adsorbed at time t is denoted by qt. Kj and α are Bangham constants that can be derived from intercept and slope respectively.
2.14 Isotherm adsorption
After the adsorption tests were completed, four essential models (Freundlich, Langmuir isotherm, Dubinin Redushkevich, and Temkin) were used to describe the isothermal parameters of CdO Nps, GO, CdO-GO, G, and CdO-G nanomaterial adsorbents as in equations (13)–(19).
The mathematical form of Langmuir’s isotherm model is indicated in equation (13)(Langmuir, 1918).
Where, qL (mg/g) is the highest adsorption capacity of nano-adsorbent, and KL (mg/L) is Langmuir’s constant. The main features of Langmuir’s could be explained in the form of a dimensionless parameter RL, defined as equation (14)
Freundlich isotherm is indicated as in equation (15)
Where, the KF factor, (mg/L) is the Freundlich isotherm constant representing the chromium multilayer adsorption capability.
The D-R isotherm is defined as in equation (16)
is D-R factor that corresponds to free energy E (KJ/mol2) while Polynyi potential is ԑ (Jm/mol) as in equation (13).
Temkin isotherm is defined as in the equation form equations (18) and (19)
Where A is the Temkin constant (L/g) associated with the equilibrium binding constant and B is associated with equilibrium sorption heat. R (j/mol K-1) is represented as the ideal gas constant and T showed the absolute temperature.
2.15 Thermodynamic analysis
The valuable information from the thermodynamic experiment was examined to obtain the change in standard entropy (kJ/mol), free energy (KJ/mol), and standard enthalpy (kJ/mol) as in equations (20), 21, and 22.
Kd shows a linear adsorption coefficient.
2.16 Error function
Determination of the error function is important to fit the various models in batch sorption experimental data. In various reports, error functions such as R2 are widely utilized to determine the models. In this work, two error functions such as the chi-square (χ 2) test and root-mean-square (RMSE) along with correlation coefficient (R2), were utilized to estimate the well-fitting model.
Where qeobs (mg g−1) is the quantity observed and qepred (mg g−1) is the amount calculated from the various models.
2.17 Desorption analysis.
For investigation of the reusability efficiency of the adsorbents (TAAAB and TABAB), the adsorption and desorption protocol was designed utilizing the batch mode of analysis. After the adsorption phase, the spent sorbents were desorbed in methyl alcohol for 12 h. The spent sorbents were agitated at 600 rpm, and the investigation of the concentration was done using UV–vis-spectroscopy.
2.18 Statistical analysis
All experiments were conducted three times, and the mean values were calculated. The repeatability and standard deviation of the experiment were determined, and the results are utilized in the result and discussion section to represent graphs with an error bar.
3 Result and discussion
3.1 Preliminary phytochemical screening
The absence or presence of phytochemicals in A. indica is exhibited in Table 1. Our results showed that tannin, terpenoids, flavonoids, and saponins are in the aqueous extract of A.indica. Parameters abbreviations with units: DO = Dissolved oxygen, TSS = Total suspended solid, TDS = Total dissolved solid, COD = Chemical oxygen demand, and BOD = Biochemical oxygen demand, and all parameters are measured in mgL-1.
Phytochemicals
Test performed
A. indica
Tannin
Ferric chloride test
+
Terpenoids
Salkowski's test
+
Flavonoids
Hydrochloric acid test
+
Saponins
Froth test
+
Alkaloid
Dragendorff's test
–
Parameters
Before processing
WHO standard
Treated with G nanosheet
Treated with GO nanosheet
Treated with G-CdO nanocomposites
Treated with CdO-GO nanosheet
Cr
1.45 ± 0.89
0.01
0.015
0.01
0.002
0.002
DO
6.39 ± 48
4–5
3.84 ± 0.12
3.84 ± 0. 05
4.03 ± 0.56
4.13 ± 0.73
TSS
50.72 ± 33
30
25.02 ± 0.23
29.31 ± 0.67
17.01 ± 0.39
11.32 ± 0.37
TDS
606 ± 77
500
417 ± 0.91
433 ± 0.28
390 ± 0.34
296 ± 0.56
COD
58.06 ± 85
40
4.19 ± 0.48
3.97 ± 0.03
2.83 ± 1.03
1.99 ± 0. 41
BOD
1.80 ± 45
1.00
1.2 ± 0.34
0.98 ± 0.22
0.83 ± 0.89
0.74 ± 0.98
3.2 GC–MS profiling of aqueous extract of A. indica
A total of 11 compounds were determined or identified from the GC–MS study of aqueous extract of A.indica leaves showing different phytochemicals activities. GC–MS chromatogram is illustrated in figure.S1, while the chemical compound with their retention time, molecular weight, and molecular formula are summarized in Table.S1. The bioactive compound identified in GC–MS includes Benzeneacetaldehyde, Benzene 1-ethyl-2,4 diethyl, 1-Piperazinecarboxaldehyde, Benzene, 2methoxy1,3,4 trimethyl, Pyrroliodine5,1, 2[3hydroxypropyl], 3Methyl-4phynl-1H-pyrolle, Hexadecamethylcyclooctasiloxane, Cyclononasiloxane, hexadecanoic acid, Phytol, and.
3.3 UV–vis spectroscopy
To analyze the absorption spectra of prepared CdO, G, CdO-G, GO and CdO-GO, nanoparticles, UV–Visible spectra of samples were studied in the range of 200–800 nm and shown in Fig. 2. CdO NPs have a wide absorption peak from 400 to 800 nm, indicating that it absorbs light in the visible range. Furthermore, CdO NPs have a characteristic absorption peak around 231 nm, which could be resulted in an interband electronic transition from deep-level valance bond electrons similar peak reported by (Azam et al., 2020). The UV spectrum of G-CdO nanocomposites exhibited electronic transition around 262 nm and 232 nm. The characteristic peak at around 265 nm is attributed π-π* aromatic transition of the graphene. The spectra of GO revealed characteristic peaks around 211 nm with a shoulder at 308 nm, which were ascribed to the aromatic (C⚌C) bonds π-π* transition and the carbonyl (C⚌O) bonds' n-π* transition similar peak for GO. The peak at 258 nm has been shifted (blue) by 3 nm. This shift is caused by the excitation of π-plasmon of pure graphite. The spectra of the CdO-GO composites in the visual light band from 479 nm to 800 nm are significantly affected by the addition of GO, as shown in the figure. CdO-GO nanocomposites have substantially greater absorbance than pure CdO NPs because of the addition of graphene oxide (GO). Moreover, the band of the CdO-GO nanoparticles exhibits a progressive red shift compared to CdO NPs, suggesting a small bandgap in the CdO-GO(Shen et al., 2010).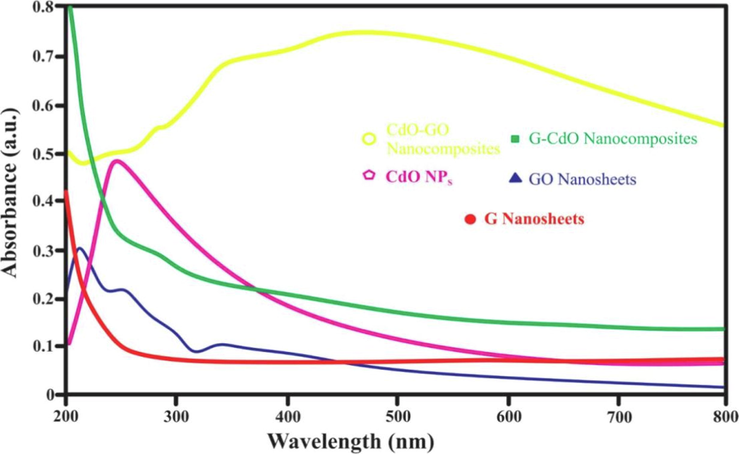
UV–vis spectra of the synthesized G nanosheets, GO nanosheets, CdO NPs, G-CdO, and CdO-GO nanocomposites.
3.4 FTIR analysis
FT-IR spectra of the synthesized G nanosheets, GO nanosheets, CdO NPs, G-CdO, and CdO-GO nanocomposites showed in Fig. 3. The FTIR spectra of CdO NPs represented peaks at 3372, 1830, 1741, 1020, and 603 cm−1 corresponding to hydroxyl (O—H), aromatic (C—H), and alkene (C⚌C), amine (C—N) and Cd-O bonding. The occurrence of peaks at 3352 and 1830, 1741, and 1020 cm−1 ensured the presence of phytomolecules of extract essential for reducing precursor into nanoparticles, while at 603 cm−1 ensured the formation of CdO nanoparticles. The FTIR spectra of G nanosheets represented peaks at 3300, 1945, 1633, 985, and 840 cm-1corresponding to a hydroxyl group (C-OH), aromatic (C—H), vinylidene (C⚌C), strong alkene (C⚌C), and medium alkene (C⚌C) stretching. The peaks at 1641, 990, and 840 ensured that the G nanosheets were successfully prepared. The FTIR spectra of G-CdO nanocomposites represented peaks at 3352, 1973, 1641, 991and 603 cm−1 corresponding to hydroxyl (O—H), aromatic (C—H), vinylidene (C⚌C), alkene (C⚌C) and Cd-O bonding. The occurrence of the peak at 3352 and 1973 cm−1 ensured the presence of phytomolecules of extract, while 1641, 99, and 603 cm−1 ensured the formation of G-CdO nanoparticles. The FTIR study of GO spectra (Figure) represented at peaks 3540, 2000, 1706, 1613, and 1080 cm−1 corresponding to hydroxyl (C-OH), aromatic (C—H), carboxyl (C⚌O), and alkene (C⚌C) and primary alcohol (C—O). The occurrence of those oxygen-containing groups (hydroxyl, carboxyl, and epoxy groups) ensured that the GO was successfully prepared. FTIR spectra of GO-CdO indicated peaks at 3500, 1981, 1717, 1620, 1085, and 603 cm−1 corresponding to hydroxyl (C-OH), aromatic (C—H), carboxyl (C⚌O), and alkene (C⚌C) and primary alcohol (C—O) and Cd-O bonding. The occurrence of peaks at 3500 and 1981 cm−1 ensured the presence of phytomolecules of extract, while 1717, 1620, 1085, and 603 cm−1 ensured the formation of GO-CdO nanoparticles(Shen et al., 2010).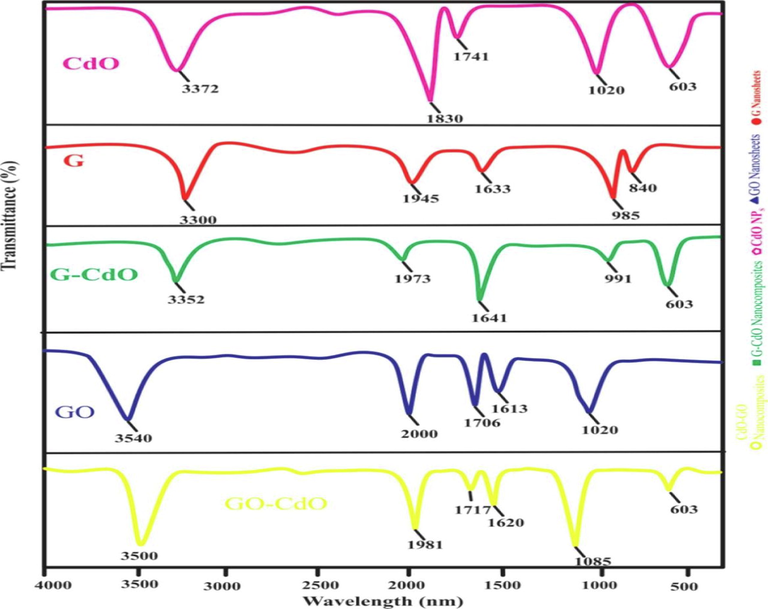
FT-IR spectra of the synthesized G nanosheets, GO nanosheets, CdO NPs, G-CdO, and CdO-Gnanocomposites before adsorption.
3.5 XRD analysis
XRD spectra of the synthesized G nanosheets, GO nanosheets, CdO NPs, G-CdO, and CdO-GO nanocomposites are exhibited in Fig. 4. The crystalline nature of prepared nanocomposites was determined using XRD analysis. The strong diffraction bands ascribed to (1 1 1) around 2θ = 33.05, (2 0 0) around 2θ = 38.5, (2 2 0) around 2θ = 53.4, (3 1 1) at 2θ = 64.3 and (2 2 2) at 2θ = 68.1 of the cubic structure of CdO NPs and similar result reported by(Aldwayyan et al., 2013)(Kaviyarasu et al., 2014). The XRD study of G exhibited an intense diffraction peak at 26.45 associated with the (0 0 2) plant ensuring the exfoliation of graphite into graphene nanosheets. Fig. 4 showed the intense and broad peak of GO at (0 0 1) at 2θ = 10.3. The interlayer distance in GO is 0.82 nm, which is significantly larger than that in pure graphite (0.29 nm). That indicates lamellar and orderly sheets like the GO framework, because of the presence of different oxygen-containing functional groups and intercalate water molecules. Fig. 4 shows that the X-ray-diffraction spectra recorded for CdO NPs resemble spectra of CdO-GO nanocomposites. Furthermore, in the XRD spectra of the as-prepared CdO-GO composites, no obvious peak for GO and G was noticed which may be because of the exfoliation of GO and G nanosheets. and a similar result was reported by(Xu et al., 2008). It may also be due to the existence of fewer layers (2–3) in G and GO nanosheets(Jiang et al., 2012). The X-ray-diffraction spectra of G-CdO nanocomposites is matched to both graphene nanosheets and pristine CdO nanoparticles suggesting the anchoring of cadmium oxide nanoparticle on the graphene.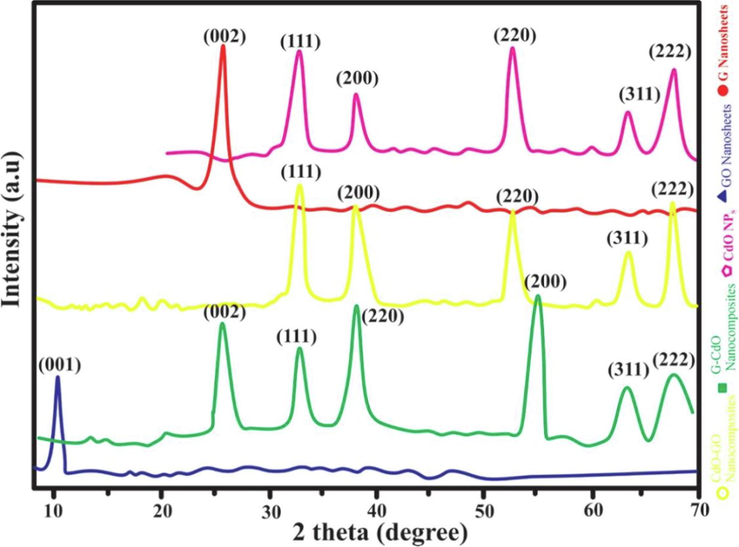
XRD spectra of the synthesized G nanosheets, GO nanosheets, CdO NPs, G-CdO, and CdO-GO nanocomposites.
3.6 Raman analysis
To illustrate the further structure of G-CdO and CdO-GO composites as well as essential electronic interactions among G, GO, and pure CdO NPs. The Raman study was employed, which is thought to be a promising approach for analyzing carbon-based materials. The Raman analysis is greatly based on the electronic phase and is employed as a potential tool to differentiate between ordered and disordered structures of carbon. Raman pattern of as-prepared CdO-GO and G-CdO was studied in the region of 100–1700 cm−1 and presented in Fig. 5. Fig. 5 shows the Raman pattern of G, G-CdO, GO, and CdO-GO nanocomposites. The Raman spectra of GO nanosheets showed two peaks at typical 1596 cm−1 (G band) and 1352 cm−1. A similar band is reported by (D band)(Guo et al., 2013). The d-band associated with phase defects is Raman active only when defects exist, and its strong intensity is frequently utilized to determine the extent of distortion. In this work, the presence of D and G bands at larger wave-number indicates the presence of clear defects because of the damaging of the Sp2 skeleton of C-atoms because of redox phenomena(Jambure and Lokhande, 2013). During the process of oxidation, oxygen enrich groups become attached to the basal plane and edges of GO nanosheets, consequently defects in the framework. Fig. 5 represented that the Raman spectrum of CdO-GO nanocomposites exhibited similar D and G bands showed by graphene oxide. In addition to G and D bands, the Raman pattern of the CdO-GO composites exhibits sharp bands at 270 cm−1, 584 cm−1, and 938 cm−1(Kim et al., 2013). The sharp peak at 270 cm−1 exhibits the existence of transverse optical mode (TO) whereas the longitudinal modes (LO) have been recorded at 584, and 938 cm−1. Furthermore, The IG/ID ratio was enhanced from 1.02 (graphene nanosheets) to 1.07(graphene oxide-cadmium oxide composite) indicating a high defect of graphene oxide and CdO-GO nanocomposites were determined to be 0.76 and 0.84, respectively (Luo et al., 2012).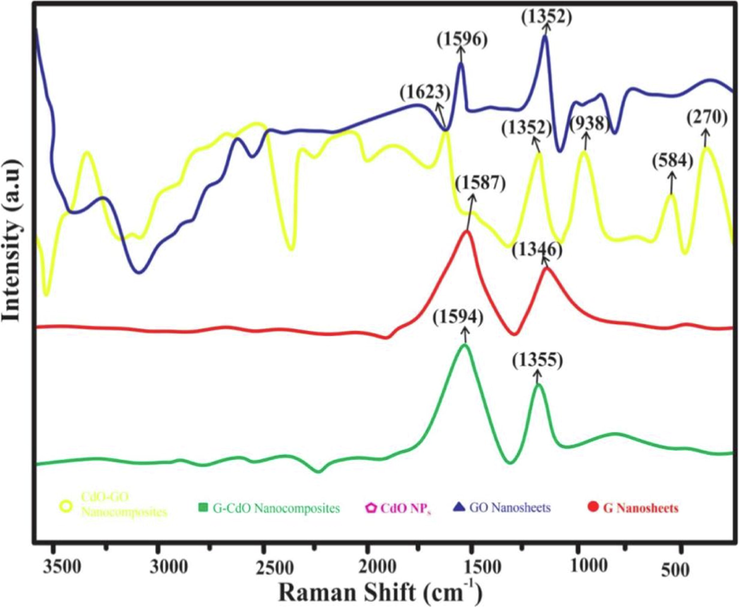
Raman spectra of the synthesized G nanosheets, GO nanosheets, CdO NPs, G-CdO, and CdO-GO nanocomposites.
Similarly, graphene nanosheets exhibited two wide bands at 1346 cm−1 showing d-band and 1587 cm−1 showing G-band. The Raman pattern of G-CdO nano-composite represents a redshift for the D and G band by 9 and 7 cm−1 respectively, ensuring the attachment of CdO nanoparticles on the G.
3.7 SEM analysis
The SEM of the morphology of G nanosheets, GO nanosheets, CdO NPs, G-CdO, and CdO-GO nanocomposites are indicated in Fig. 6(a-e). According to a previous study(Kudin et al., 2008), the transformation of graphite to graphene, induce defect and holes on the carbon grid. These defects or holes may be due to the elimination of oxygen during biological reduction. It's also likely that the G-CdO and CdO-GO nanocomposites will grow around and into the holes and defects in the graphene or graphene nanosheets(Yu et al., 2005). These defects were also observed in Raman’s results. Furthermore, hard particles could sink simply into the supported- materials(Pan et al., 2011). Visual examination reveals that the surfaces of G and GO nanosheets were uniform morphology having few small wrinkles, whereas CdO nanoparticles are anchored on the surface of G and GO nanosheets. This finding further confirms the conversion of G and GO nanosheets into G-CdO and GO-CdO nanocomposites. The morphology of CdO nanoparticles is irregular.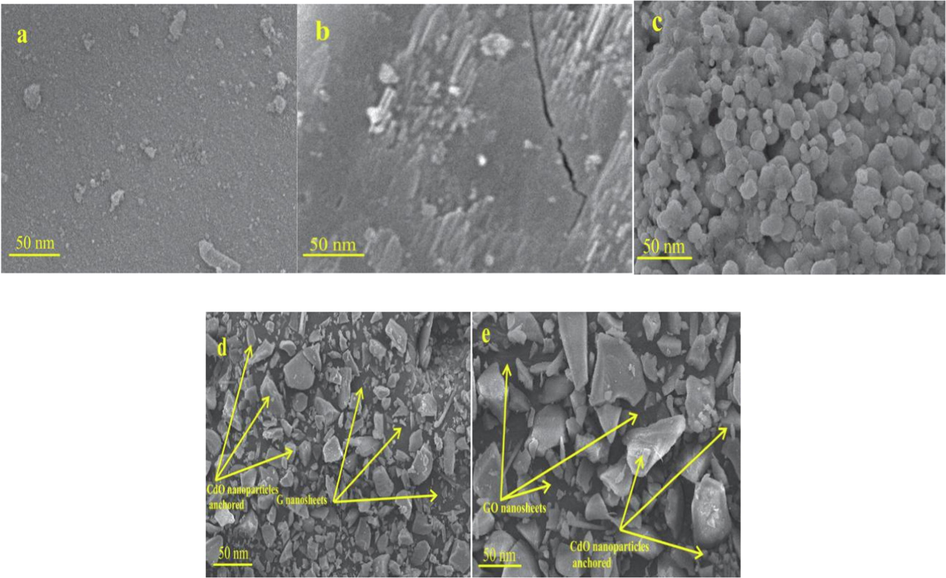
SEM images of the synthesized G nanosheets, GO nanosheets, CdO NPs, G-CdO, and CdO-GO nanocomposites (a-c) respectively.
3.8 EDX spectrum of CdO, G, G-CdO, CdO-GO, and GO
Fi gure 7 (a-d) exhibits the EDX spectrums of CdO, G, G-CdO, CDO-GO, and GO, respectively. Fig. 7 (a) interprets the presence of Cd and O, confirming the successful synthesis of CdO nanoparticles. EDX pattern of graphene (Fig. 7b) exhibits the existence of C and O. The oxygen content was very than GO. The oxygen content in the EDX pattern of graphene could be derived from the electrolyte. Similarly, oxygen content from the electrolyte in the graphene EDX pattern was reported by (Ilias et al., 2021). Fig. 7(c) showed the EDX pattern of G-CdO. EDX pattern of G-CdO consists of carbon, oxygen, and cadmium. In the case of G-CdO, there may be two sources of oxygen. The first source may be CdO NPs, and the second may be the electrolyte that was used. EDX pattern (figure: 7d) of CdO-GO consists of carbon oxygen and cadmium. EDX pattern of GO is composed of C and O, confirming the successful synthesis of GO nanosheet. The oxygen content in the GO EDX pattern is greater than G.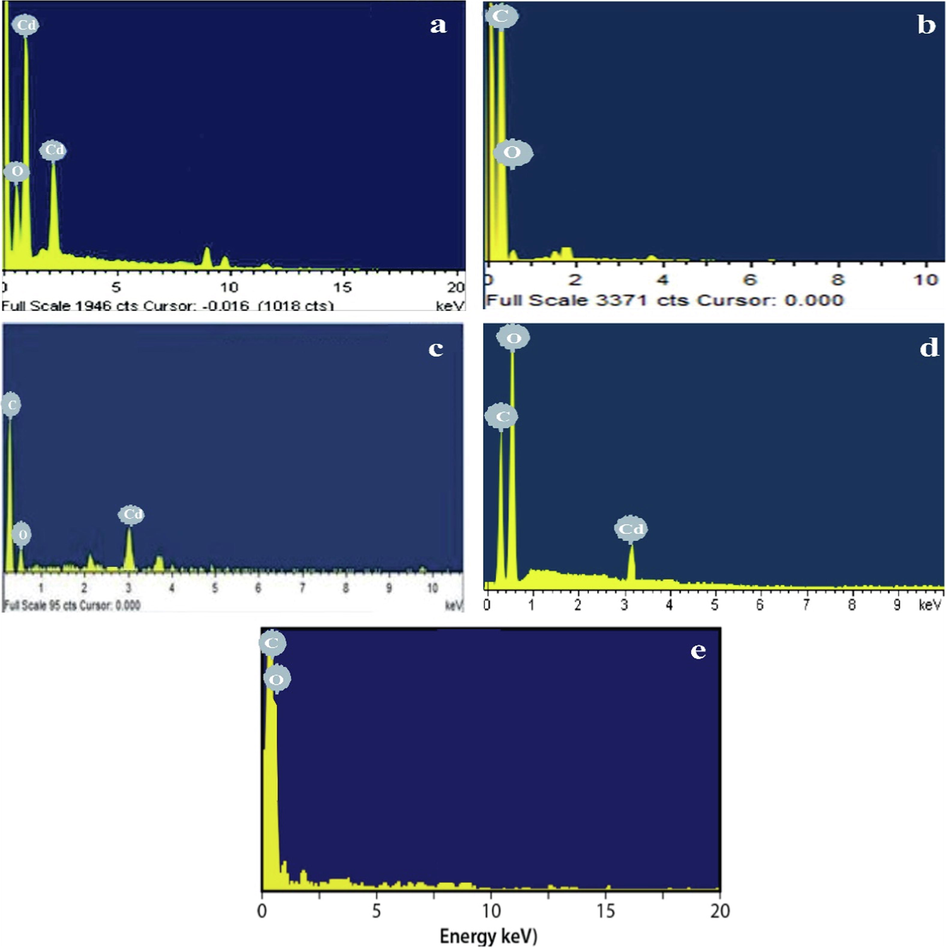
EDX images of the synthesized CdO NPs (a) G nanosheets (b), G-CdO (c) CdO-GO (d), and GO nanosheets (e) before adsorption.
3.9 Physiochemical characteristics of wastewater obtained from petroleum refinery
The average quantity of Cr ions after treatment was observed in the range of WHO standards. Some Other traits of petroleum wastewater samples are exhibited in Table 3. From the results, it can be concluded that before treatment some basic pollution indicators e.g. BOD, TSS, and TDS were above than standards of WHO. Thus, it is necessary to treat wastewater collected from the petroleum industry before discharge.
Adsorbents
Removal efficiency (%)
Reference
Chi@Fe3O4GO
41.8
(Subedi et al., 2019)
Fe3O4/graphene
75
(Wang et al., 2019)
GO-Trp
55
(Mahmoud et al., 2020)
α-Fe2O3/GO
(Bulin et al., 2020)
G-CdO, and CdO-GO
97,and 98 respectively
This work
3.10 Physiochemical characteristics of wastewater obtained from petroleum refinery
The average quantity of Cr ions after treatment was observed in the range of WHO standards. Some Other traits of petroleum wastewater samples are exhibited in Table 2. From the results, it can be concluded that before treatment some basic pollution indicators e.g. BOD, TSS, and TDS were above than standard of WHO. Thus, it is necessary to treat wastewater collected from the petroleum industry before discharge.
3.11 Impact of pH and zeta potential
The zeta potential of G, G-CdO, GO, CdO-GO, and CdO becomes more negative with growth in pH exhibited in Fig. 8 (a-b). Fig. 8 (a-b) indicates that CdO, G, G-CdO, GO, and CdO-GO composites had no charge at 3.0, 5.8, 5.8, 8.2, and 8.2 pH, respectively. Thus, at pH levels above 3.0, 5.8, 5.8, 8.2, and 8.2, the surface of CdO, G-CdO, GO, and CdO-GO respectively became negatively charged.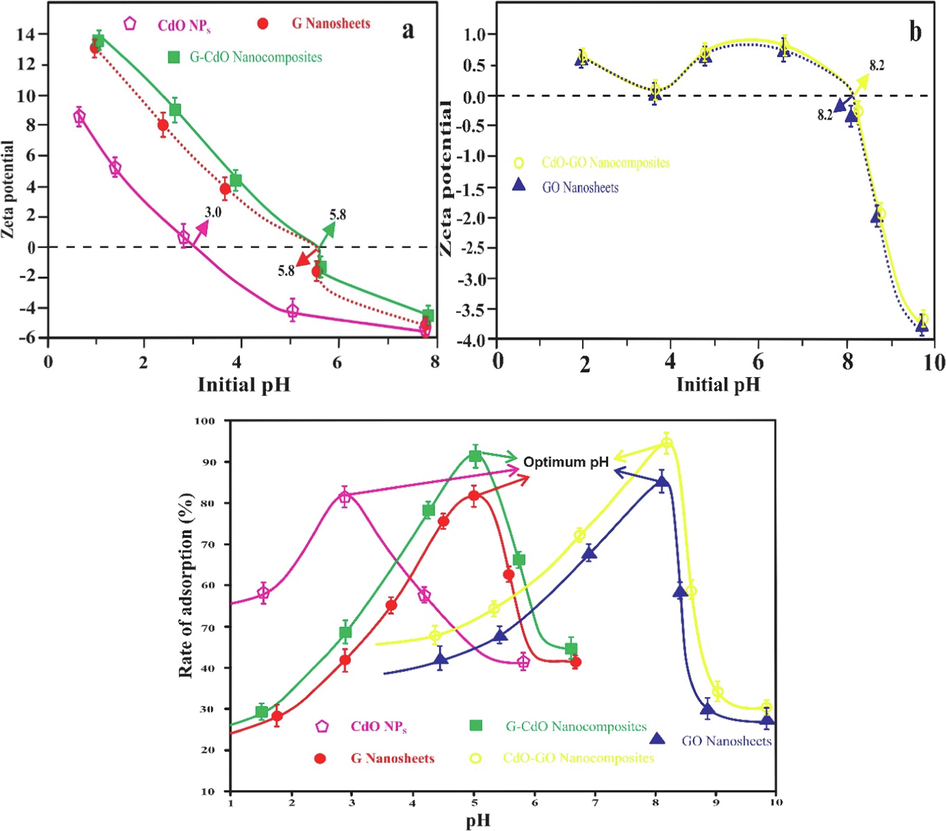
Zeta potential of G, G-CdO, CdO (a), CdO-GO, and CdO (b) Impact of pH on the rate of adsorption (c). Error bars describe the Standard deviation of means of three replicates.
The pH value of the desired solution has been recognized as one of the essential factors responsible for heavy metal ion adsorption to adsorbent (solid particles) which would influence the relative distribution of heavy metal ions and the surface potential features of G nanosheets and GO-mediated nanoparticles, especially deprotonation-protonation reaction at various pH values. The removal of Cr was performed in the pH range of 1.0–10 indicated in Fig. 8 (c). In the case of G and G-CdO, The rate of adsorptive elimination of Cr increases with raising pH from 1.7 to 5.8 because of electrostatic interaction between Cr (VI) and grapheme ring(Husein et al., 2021). The adsorptive removal of Cr (VI) using CdO NPs was not significant at a pH value greater than 6.0(Mallick et al., 2006). In the case of CdO NPs, the rate of adsorptive elimination of Cr increases with the enhancement of pH from 1.0 to 3.0. The maximum adsorption capability was determined to be at pH 3 and above pH 3; it exhibits a lower rate of adsorptive removal of Cr (VI). Below 3 pH, the competition between the Cr (VI) and H+ ion for the adsorption site of CdO NPs. In the case of GO and CdO-GO nanocomposites, the maximum rate of Cr adsorptive elimination was observed around a pH of 8.02. The ionization degree of adsorbate and adsorbent’s surface charge describes the impact of solution pH. The present form of chromium on varying pH will influence the adsorption limit of graphene oxide (GO nanosheets) and CdO-GO nanocomposites. In an aqueous solution, chromium hexahydrate can be excited different anionic forms (Cr2O7 2-, CrO42−, H2Cr2O7, HCr2O7–, and HCrO4−) depending on the pH. Therefore, chromium adsorption capability is monitored by complexation in place of electrostatic interaction. The existence of hydroxyl groups (OH) further assists in the surface complexation among Cr (VI) and CdO-GO. However, an enhancing pH from 8 causes an intense decrease in the adsorptive elimination due to repulsion between negatively charged chromium and deprotonated CdO-GO. Similar results were also reported by(Singh et al., 2022). The highest adsorption capacity was recorded for both GO-CdO, and G-CdO nanocomposites than GO, G, and CdO nanoparticles.
3.12 Effect of nano-bioadsorbents dose
The dose of nano-adsorbents influences the sorption process. Thus, various doses of graphene, CdO, G-CdO, CdO-GO, and GO nano-bioadsorbent were utilized for the Cr (VI) removal. As shown in Fig. 9 increases in Cr removal capability can be observed with increases in the dose of nano-bioadsorbent but it remains unchanged after saturation. This may be linked to an effective active site on the surface of nano-bioadsorbent and directly increased with an increase in sorbent dosage, resulting in rapid uptake of Cr (VI) ion from sorption media(Aoudj et al., 2015), the elimination of Cr (VI) ions attain equilibrium. This point may be regarded as the saturation point the growth in the dosage of nano-bio sorbents after the saturation point shows only an enhancement in the consistency of the Cr adsorbed (Zhang et al., 2019). Adsorptive elimination was higher for G-CdO and CdO-GO composites as compared to G, GO, and CdO nanoparticles.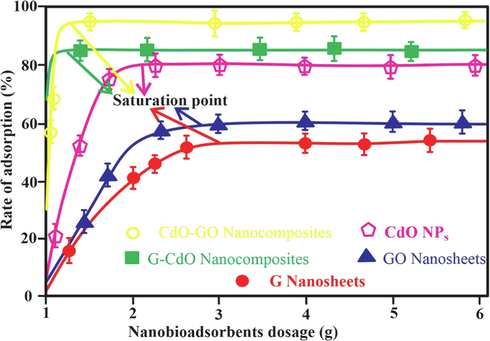
Effect of nano-bioadsorbents on the rate of adsorption (%). Error bars describe the Standard deviation of means of three replicates.
3.13 Effect of chromium ion dosage
The impact of Cr dosage on the removal capability of synthesized nano-bioadsorbent is exhibited in Fig. 10. The maximum adsorption capability toward Cr (VI) ion is an essential characteristic of nanoparticles or nanocomposites as an adsorbent. Fig. 10 exhibited that the chromium uptake capability decreased sharply with an enhancement in Cr (VI) concentration. It was considered that at higher Cr (VI) concentration, the adsorptive removal capability decreased due to the filling of the vacant nano-bioadsorbents sites(Dehghani et al., 2015). During the enhancement in initial Cr (VI) concentration, the exposed surface areas of synthesized nano-bioadsorbents available for elimination are inadequate. Thus, Cr (VI) elimination lowered with enhancing chromium concentration.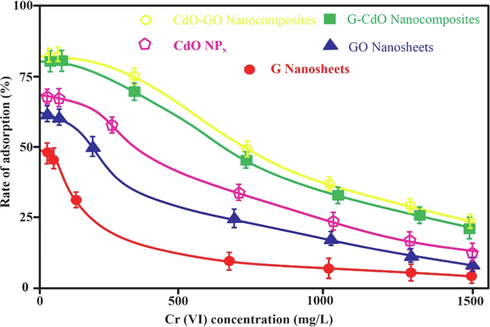
Effect of chromium ion concentration on rate of adsorption (%). Error bars describe the Standard deviation of means of three replicates.
3.14 Effect of contact time
The mass transfer rate of pollutants during the adsorption process is influenced by time. Fig. 11 represents the influence of time. At 0–2.9 h, the elimination of Cr (VI) ion enhanced substantially. After 2.9 h, the rates of adsorptive removal attain equilibrium (remained unchanged). This behavior is explained by the fact that the available sites of adsorption on nano-bioadsorbents are in excess at the initial period. The available adsorption sites on the nano-bioadsorbents surfaces and the essential driving forces metallic ions to the binding sites become lowered with the contact time increasing from 2.9 h, consequently, adsorption phenomena became slow and finally attained saturated adsorption capability. Similar behavior is reported by(Chen et al., 2015). The Cr (VI) elimination % enhance in order CdO-GO > G-CdO > CdO > GO > G and attained 85.5, 81.3, 76.3, 65, and 54.0 % respectively. This demonstrated that the prepared composite exhibited greater selectivity as compared to its individual materials, GO, G, and CdO NPs. The higher intake of nanocomposites is due to their larger adsorption surface area and a larger number of adsorption sites obtained from plant extract. It is essential to note that time-saturated adsorption capability is a very necessary factor for the application of nano-biosorbents in real applications. The shorter time attained saturated adsorption capability recommends the higher efficiency and greater economies of nanoparticles and composite application in wastewater treatment.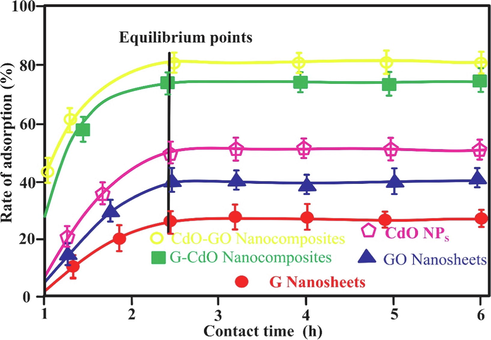
Effect of contact of concentration on rate of adsorption (%). Error bars describe the Standard deviation of means of three replicates.
3.15 Adsorption isotherm
Table.S2 shows the different linear and non-linear factors derived from the different isotherm graphs. Fig. 12 showed a non-linear and linear Freundlich isotherm of G, GO, CdO, G-CdO, and CdO-GO. Composite. Measured RL, the value was lowered than 1 whereas the value of n was higher than unity thus, biosorption phenomena were favorable. The linear Freundlich model efficiently demonstrates the biosorption of Cr (VI) onto nano-absorbents with R2 = 0.9883, 0.9820, 0.9929, 0.9969, and 0.9993 for graphene, GO, CdO, CdO-GO, and G-CdO and respectively due to lower value of RMSE and χ2, and higher value of R2. This indicates that adsorption did not occur on a uniform site, but rather on a multilayer in the Cr-nano-biosorption system. Moreover, monolayer biosorption played a significant role in heavy metal uptake onto the nano-biosorption system with R2 = 0.87140, 8938, 0.9304, 0.9543, and 0.9834 for graphene, GO, CdO, CdO-GO, and G-CdO respectively. The isotherm models also showed that feasibility is predicted RL parameter. Bioadsorption is either unfavorable (R2 greater than 1), linear (R2 = 1), favorable (0 < RL < 1), and irreversible (R2 = 0) depend on RL values. The values of (RL) predicted utilizing the Langmuir isotherm for Cr (VI) elimination were in the range of 0.0095 to 0.29 describing that the elimination phenomena was favorable. Table.S2 indicates that the value of n (constant), for the biosorption of Cr (VI) is greater than unity, suggesting that uptake phenomena were favorable. Thus, the uptake of Cr (IV) ion by G, GO, CdO, G-CdO, and CdO-GO nano-bioadsorbent surface proceeds having few heterogeneous sites. Table.S2 shows that the Temkin parameters A and B were greater in the case of CdO-GO and G-CdO than G, GO, and CdO suggesting that heat of adsorption explains the physical phenomenon. Even though the Dubinin-Redushkevich isotherm is not fit the adsorption phenomenon, the value of EDR ensured the physical phenomenon.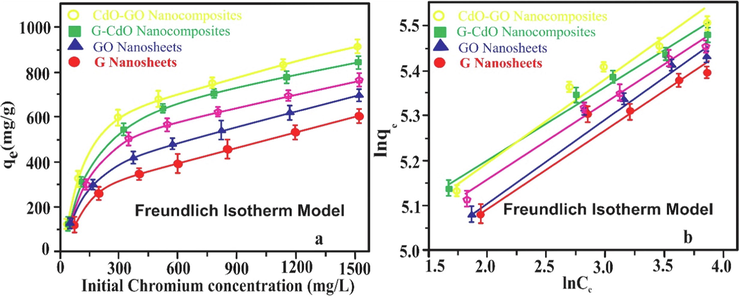
Non-linear and linear Freundlich isotherm model. Error bars describe the Standard deviation of means of three replicates.
3.16 Kinetics analysis
Based on the R2 values, the kinetic statistics of Cr (VI) onto the G, GO, CdO, CdO-GO, and G-CdO, and were effectively obeyed by the linear pseudo-second-order exhibited in Table.S3 and Fig. 13. The higher value of R2 and lower value of RMSE and χ2 suggested the excellent suitability of the linear pseudo-second-order model. The R2 values for the five nano-bioadsorbents were extraordinarily high (R2 greater than 0.990). Generally, the pseudo-second-order model was used to show chemical adsorption, having ionic force regarding electron exchange or sharing between the Cr (VI) ion and nano-biomaterials as ion exchange, and covalent interaction. Consequently, the chemical adsorption phenomena governed the elimination of Cr (VI) by graphen, GO, CdO, G-CdO, and CdO-GO nanocomposites. Low Δqe as well as X2, characterized the Elovich model and pseudo-second-order that both these isotherm models explain the kinetics of Cr (VI) on to the G, GO, CdO, G-CdO, and CdO-GO nanocomposites. βEl is associated with the surface coverage, and the surface area of nano-bioadsorbents was found to be very low (in the nano range), indicating that Cr (VI) uptake onto nano-bioadsorbents may have been more via functional groups. Even though the values of v (constant) attained for the fractional power kinetic model were less than one, indicating that fractional power may demonstrate the adsorptive kinetics of Cr-nano-bioadsorbents systems. The greater values of Δqe as well as X,2 achieved for Avrami and fractional power powder kinetics models validated that both these models do not demonstrate the kinetics of Cr(VI) uptake on the nano-bioadsorbents. The intraparticle diffusion and the Bangham models represent that multiple adsorptive stages occurred. R2 was recorded from the Bangham model in the range of 0.9146–0.9613, indicating that pore diffusion was included in Cr (VI) uptake onto nano-bioadsorbents. Furthermore, the linearity of the Bangham graph indicates that adsorbate pore diffusion is not only the adsorptive rate controlling step. A multilinear profile was achieved for the intraparticle diffusion model graph and this graph did not cross the origin, this shows that boundary layer diffusion is also involved in the adsorptive uptake of Cr (VI) onto nano-bioadsorbents. While R21, k,i1, and C1 are the correlation, slope, and intercept of the first steeper segment whereas R22, ki2, C2, and C1are the correlation, slope, and intercept of the second linear segment. The values of intercept (ki1) are higher than the obtained values of i2suggestingts that the intraparticle diffusion model primarily controlled the adsorptive uptake of Cr (VI) onto nano-bioadsorbents.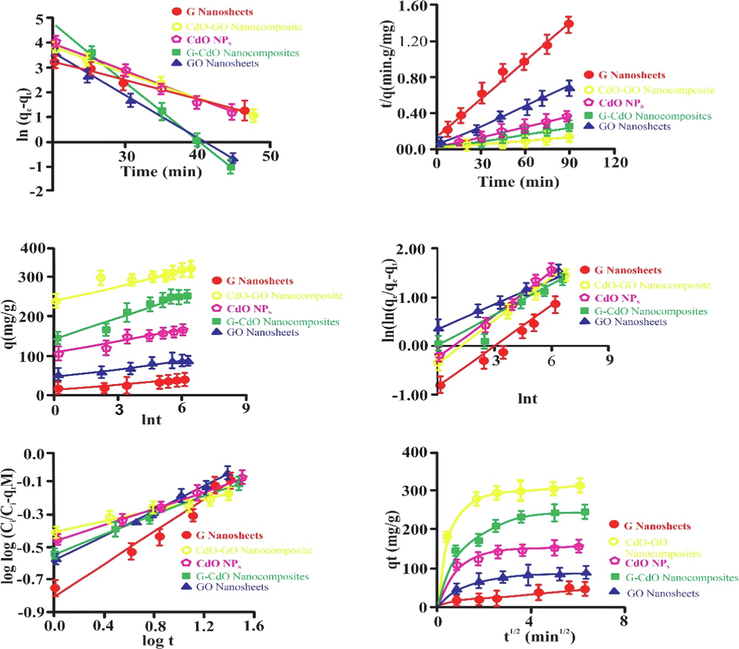
Pseudo-first-order kinetics for sorption of cr (vi) onto sorbents (a), pseudo-second-order kinetics for sorption of cr (vi) onto sorbents (b), elovich kinetics for sorption of cr (vi) onto nanobiosorbents (c), avrami kinetics for sorption of cr (vi) on to nanobiosorbents (d), bangham pseudo-first-order kinetics for sorption of cr (vi) on to nanobiosorbents (e) and intraparticle diffusion plot for sorption of cr (vi) on to nanobiosorbents (f).. Error bars describe the Standard deviation of means of three replicates.
3.17 Thermodynamics study: Effect of temperature
To examine the adsorption process of Cr (VI) in detail, thermodynamic parameters were evaluated. For G nanosheets, GO nanosheets, CdO NPs, G-CdO, and CdO-GO nanocomposites, the measured thermodynamic parameters in Table.S4 and Fig. 14 showed an exothermic process (ΔHo). The negative ΔSo value indicates a decrease in randomness in the Cr (VI) -G system during the elimination process whereas the ΔSo of four nanobiosorbents is positive, suggesting that randomness at the nanobiosorbents-Cr system is enhanced as the process proceeds. Table.S4 also indicated that ΔGo for GO, CdO, G-CdO, and CdO-GO nano-bioadsorbents are negative suggesting spontaneous reaction and feasible process for the adsorbents. Fig. 14 indicated that a greater temperature raises the adsorption rate, and ΔHo values are positive. Ren et al. described an enhancement in graphene/MnO2 capability from 46 − 60 mg/g as the temperature was grow from 298 t to 318 K. The adsorption capacities of nanobiiosrbents were found to be higher at 302 K than it was at 290 K in this work.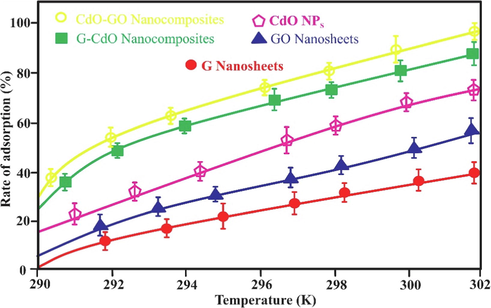
Effect of temperature on the rate of adsorption (%). error bars describe the standard deviation of means of three replicates.
3.18 Effect of adsorption-desorption on the elimination of Cr (VI) using nano-biosorbents
The adsorbent's efficacy in purifying petroleum wastewater can be described by its ability to be reused for an enhanced, wide range of applications. The adsorbents were utilized for Chromium absorption for up to 3 cycles, as shown in Fig. 15, leading to a thorough examination of biosorbents ability to be reused. This study ensured that the adsorptive removal rate of Cr (VI) is still greater than 85 % after repeated five cycles, suggesting that the produced nanomaterials are adsorbents with strong recyclability. It can be determined that G and Go-based CdO nanocomposite has significant reusability and durability even after three regenerations.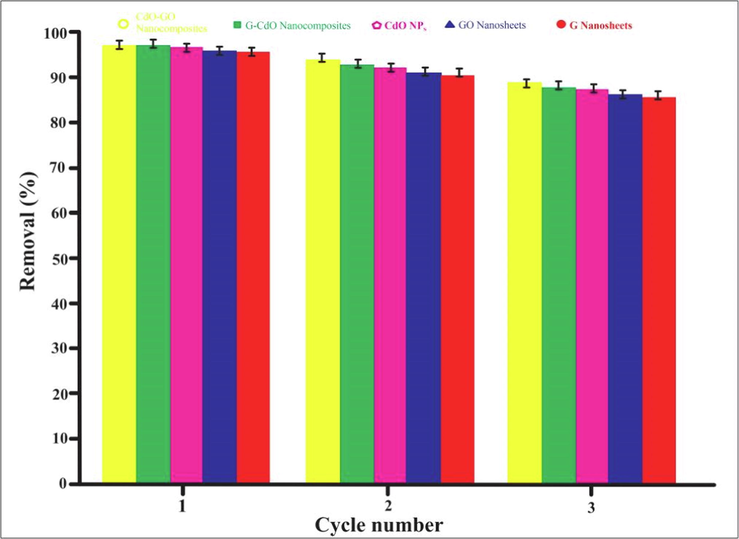
Regeneration capacity for three consecutive cycles.. Error bars describe the Standard deviation of means of three replicates.
3.19 Selectivity of G, GO, CdO, G-CdO, and CdO-GO composite
Li (I), Mg (II), Cu (II), Cr (IV), Zn (II), and Cd (II) were selected to evaluate the selective sorption performance of G, GO, CdO, G-CdO, and CdO-GO composite, since these heavy metal ions also generally present in the wastewater.
The quantity of Li (I), Mg (II), Cu (II), Cr (VI), Zn (II), and Cd (II) before and after sorption are illustrated in figure.S2 (a-f). Figure S2 (a-f) exhibited that G, GO, CdO, G-CdO, and CdO-GO composite showed excellent selective sorption for Cr (VI).
3.20 Adsorption mechanism
The adsorption mechanism was explained using FTIR and EDX spectrums. The FTIR spectra of CdO, G, G-CdO, CdO-GO, and GO after adsorption of chromium are illustrated in Fig. 16. In FTIR spectra of CdO after adsorption of Cr, the C⚌O band moves from 3372 cm−1 to 3359 cm−1. The sharp peak of CdO also moves from 607 cm−1 to 596 cm−1. In the FTIR spectra of graphene after adsorption chromium, the peak moves to lower from 3300 cm−1 to 3287 cm−1. Similarly, the peak shifts from 1633 cm−1 to 1619 cm−1. In the FTIR pattern of G-CdO after adsorption of Cr, the OH peak of G-CdO moves from 3352 cm−1 to 3345 cm−1. The peak at 1641 cm−1 belonging to C⚌C also changed and appeared at 1630 cm−1. The intense peak of CdO also moves from 607 cm−1 to 588 cm−1. In the FTIR spectra of GO after sorption of Cr, the peaks at 3540 cm−1, 1706 cm−1, and 1020 cm−1 belonging to OH, C⚌O, and C—O changed their positions and appeared at 3522 cm−1, 1691 cm−1, and 1009 cm−1, respectively. In the FTIR spectra of CdO-GO after sorption of Cr, the peaks at 3500 cm-1, 1717 cm−1, 1085 cm−1, and 603 belonging to OH, C⚌O, C—O, and CdO changed their positions and appeared at 3472 cm−1, 1708 cm−1, and 1068 cm−1 and 583 cm−1, respectively. These changes in positions of peak after adsorption, suggest the interaction of chromium with CdO, G, G-CdO, CdO-GO, and GO. In the FTIR spectra of all samples after sorption, a new FTIR peak at 506 cm−1 was observed for chromium adsorbed, designated to Cr-O stretching, and similar peak was reported by (Singh et al., 2022)(Fig. 16).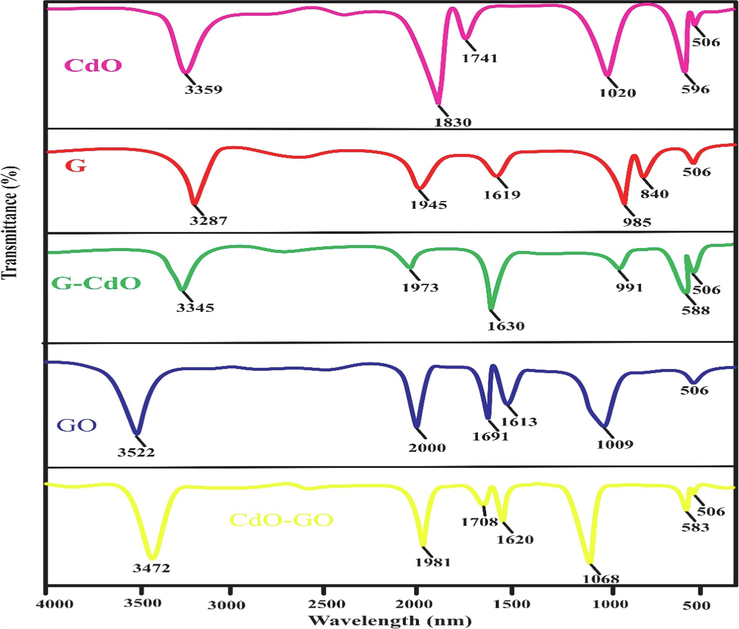
FT-IR spectra of the synthesized G nanosheets, GO nanosheets, CdO NPs, G-CdO, and CdO-GO nanocomposites after adsorption.
Fig. 17 (a-d) exhibits the EDX spectrums of CdO, G, G-CdO, CdO-GO, and GO after adsorption of chromium, respectively. The EDX spectrum CdO, G, G-CdO, CdO-GO, and GO exhibited the presence of characteristic peaks of Cr after adsorption, while no peak for Cr was observed before adsorption of Cr. These results confirm the successful adsorption of Cr on the surface of prepared all prepared samples.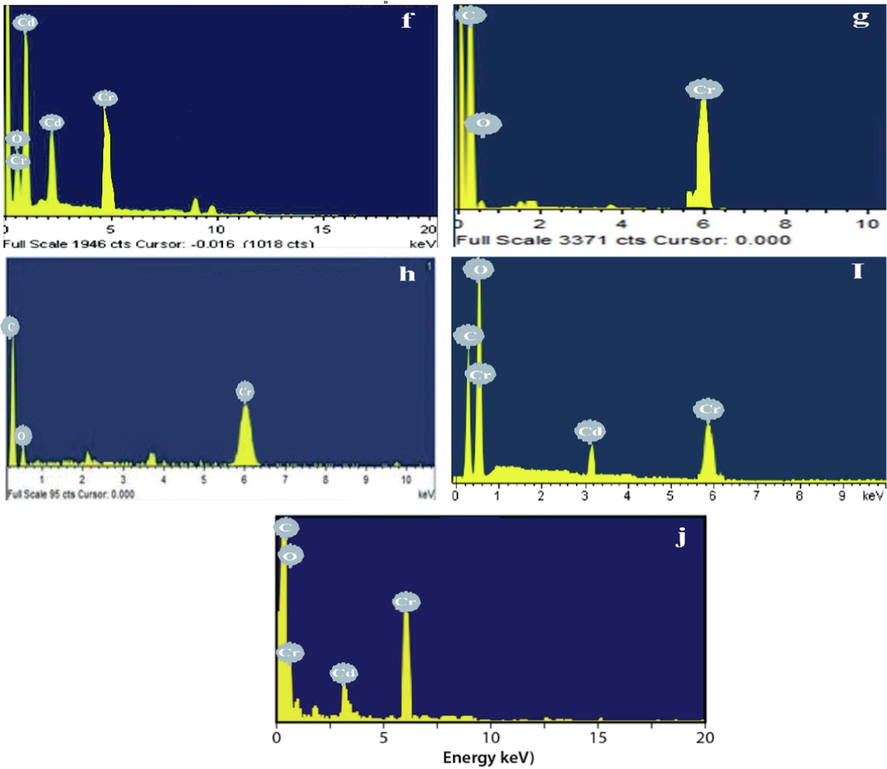
EDX images of the synthesized CdO NPs (a) G nanosheets (b), G-CdO (c) CdO-GO (d), and GO nanosheets (e) after adsorption.
3.21 Comparative study
A comparative study of recent work of Cr (VI) adsorbing prepared composite is summarized in Table 3. Table 3 exhibits that prepared adsorbent exhibited greater adsorbing efficiency than previous literature Cr (VI).
4 Conclusion
G nanosheets, GO nanosheets, CdO NPs, G-CdO, and CdO-GO were synthesized and characterized. G nanosheets, GO nanosheets, CdO, G–CdO, and CdO-GO composites were successfully produced, as evidenced by UV–vis, FT-IR, RAMAN, SEM, and XRD studies. The combination of graphene, graphene oxide, and CdO NPs resulted in a new nanomaterial that has the potential to eliminate chromium from aqueous solutions. The findings of the batch adsorption studies indicated that CdO-GO and G–CdO had the highest adsorption capabilities 6 of 399 and 430 mg g−1, respectively. Langmuir model and pseudo-second-order model described the sorption phenomena. The thermodynamic analyses were carried out through physical, endothermic, and spontaneous adsorption reactions. Furthermore, nanobiosorbents may be regenerated and utilized at least five times without substantial loss of performance, allowing the nanobiosorbents to be used for in situ chromium elimination from aqueous media.
Acknowledgments
All authors acknowledge the School of Chemistry, Minhaj University Lahore for providing a platform for this work.
Declaration of Competing Interest
The authors declare that they have no known competing financial interests or personal relationships that could have appeared to influence the work reported in this paper.
References
- Heavy metals in wastewater and sewage sludge from selected municipal treatment plants in eastern cape province, south africa. Water (Switzerland). 2020;12
- [CrossRef] [Google Scholar]
- Antibacterial activities of extracts of leaf, fruit, seed and bark of Phoenix dactylifera. African J. Biotechnol.. 2012;11:10021-10025.
- [CrossRef] [Google Scholar]
- ldwayyan, A.S., Al-Jekhedab, F.M., Al-Noaimi, M., Hammouti, B., Hadda, T.B., Suleiman, M., Warad, I.J.I.J.E.S., 2013. Synthesis and characterization of CdO nanoparticles starting from organometalic dmphen-CdI2 complex. Int. J. Electrochem. Sci 8, 10506–10514
- Removal of phenols from water and petroleum industry refinery effluents by activated carbon obtained from coconut coir pith. Adsorption. 2009;15:439-451.
- [CrossRef] [Google Scholar]
- Simultaneous removal of chromium (VI) and fluoride by electrocoagulation–electroflotation: application of a hybrid Fe-Al anode. Chem. Eng. J.. 2015;267:153-162.
- [Google Scholar]
- Attama, A.A., Schicke, B.C., Müller-Goymann, C.C.J.J. of drug delivery S., technology, 2007. Novel physically structured lipid matrices of beeswax and a homolipid from Capra hircus (goat fat): a physicochemical characterization for application in drug delivery. J. Drug Deliv. Sci. Technol. 17, 103–112.
- Azam, Z., Ayaz, A., Younas, M., Qureshi, Z., Arshad, B., Zaman, W., Ullah, F., Nasar, M.Q., Bahadur, S., Irfan, M.M.J.M. pathogenesis, 2020. Microbial synthesized cadmium oxide nanoparticles induce oxidative stress and protein leakage in bacterial cells. Microb. Pathog. 144, 104188.
- Bakke, T., Klungsøyr, J., research, S.S.-M. environmental, 2013, undefined, n.d. Environmental impacts of produced water and drilling waste discharges from the Norwegian offshore petroleum industry. Elsevier.
- Removal performance and mechanism of nano α-Fe2O3/graphene oxide on aqueous Cr(Ⅵ) J. Phys. Chem. Solids. 2020;147
- [CrossRef] [Google Scholar]
- Water as green extraction solvent: Principles and reasons for its use. Curr. Opin. Green Sustain. Chem.. 2017;5:31-36.
- [CrossRef] [Google Scholar]
- Chen, J.H., Xing, H.T., Sun, X., Su, Z.B., Huang, Y.H., Weng, W., Hu, S.R., Guo, H.X., Wu, W.B., He, Y.S.J.A.S.S., 2015. Highly effective removal of Cu (II) by triethylenetetramine-magnetic reduced graphene oxide composite. Appl. Surf. Sci. 356, 355–363
- Activated petroleum waste sludge biochar for efficient catalytic ozonation of refinery wastewater. Sci. Total Environ.. 2019;651:2631-2640.
- [CrossRef] [Google Scholar]
- Dada, A.O., Ojediran, J.O., Olalekan, A.P.J.A. in P.C., 2013. Sorption of Pb2+ from aqueous solution unto modified rice husk: isotherms studies. Adv. Phys. Chem. 2013, 1–6.
- Evaluation of adsorbent and ion exchange resins for removal of organic matter from petroleum refinery wastewaters aiming to increase water reuse. J. Environ. Manage.. 2018;214:362-369.
- [CrossRef] [Google Scholar]
- Dehghani, M.H., Taher, M.M., Bajpai, A.K., Heibati, B., Tyagi, I., Asif, M., Agarwal, S., Gupta, V.K.J.C.E.J., 2015. Removal of noxious Cr (VI) ions using single-walled carbon nanotubes and multi-walled carbon nanotubes. J. Colloid Interface Sci. 279, 344–352
- Dong, L., Hou, L., Wang, Z., Gu, P., Chen, G., Jiang, R.J.J. of hazardous materials, 2018. A new function of spent activated carbon in BAC process: Removing heavy metals by ion exchange mechanism. J. Hazard. Mater. 359, 76–84.
- Dubey, R.C., Kumar, H., Pandey, R.R.J.J.A.S., 2009. Fungitoxic effect of neem extracts on growth and sclerotial survival of Macrophomina phaseolina in vitro. J. Am. Sci 5, 17–24
- Reduction of COD in refinery wastewater through adsorption on date-pit activated carbon. J. Hazard. Mater.. 2010;173:750-757.
- [CrossRef] [Google Scholar]
- Polydopamine intimate contacted two-dimensional/two-dimensional ultrathin nylon basement membrane supported RGO/PDA/MXene composite material for oil-water separation and dye removal. Sep. Technol. Purif.. 2020;247:116945
- [Google Scholar]
- Ferrer, I.J.J.E. acta, 1993. Characterization of CdO thin films by EER and photoelectrochemical measurements. Electrochim. Acta 38, 2199–2201.
- Gumpu, M.B., Sethuraman, S., Krishnan, U.M., Rayappan, J.B.B.J.S., Chemical, actuators B., 2015. A review on detection of heavy metal ions in water–an electrochemical approach 213, 515–533.
- Graphene oxide–Fe2O3 hybrid material as highly efficient heterogeneous catalyst for degradation of organic contaminants. Carbon N. Y.. 2013;60:437-444.
- [Google Scholar]
- Characterization of agriculture wastes based activated carbon for removal of hydrogen sulfide from petroleum refinery waste water. Mater. Today Proc.. 2020;20:588-594.
- [CrossRef] [Google Scholar]
- Determination of heavy metals concentration in produced water of oil field exploration in siak regency. J. Phys. Conf. Ser.. 2019;1156
- [CrossRef] [Google Scholar]
- Novel green route to synthesize cadmium oxide@ graphene nanocomposite: optical properties and antimicrobial activity. Mater. Res. Express. 2019;6:85094.
- [Google Scholar]
- Ho, Y.-S., McKay, G.J.P. biochemistry, 1999. Pseudo-second order model for sorption processes. Process Biochem. 34, 451–465.
- Husein, D.Z., Hassanien, R., Khamis, M.J.R.S.C.A., 2021. Cadmium oxide nanoparticles/graphene composite: synthesis, theoretical insights into reactivity and adsorption study. RSC Adv. 11, 27027–27041
- Adsorption and removal of mercury ions from aqueous solution using raw and chemically modified Egyptian mandarin peel. Desalin. Water Treat.. 2013;51:6761-6769.
- [Google Scholar]
- Effect of electrolyte concentration on the synthesis of graphene by electrochemical exfoliation process. IOP Conf. Ser. Mater. Sci. Eng.. 2021;1106:012013
- [CrossRef] [Google Scholar]
- Jaishankar, M., Tseten, T., Anbalagan, N., Mathew, B.B., Beeregowda, K.N.J.I. toxicology, 2014. Toxicity, mechanism and health effects of some heavy metals. nterdiscip Toxicol. 7, 60.
- Photoelectrochemical solar cells with chemically grown CdO rice grains on flexible stainless steel substrates. Mater. Lett.. 2013;106:133-136.
- [Google Scholar]
- Bandgap and effective mass of epitaxial cadmium oxide. Appl. Phys. Lett.. 2008;92:22101.
- [Google Scholar]
- Jiang, L., Yao, M., Liu, B., Li, Q., Liu, R., Lv, H., Lu, S., Gong, C., Zou, B., Cui, T.J.T.J. of P.C.C., 2012. Controlled synthesis of CeO2/graphene nanocomposites with highly enhanced optical and catalytic properties. J. Phys. Chem. C 116, 11741–11745.
- Juang, R.-S., Chen, M.-L.J.I., Research, E.C., 1997. Application of the Elovich equation to the kinetics of metal sorption with solvent-impregnated resins. Ind. Eng. Chem. Res 36, 813–820.
- Kabbashi, N.A., Nour, A.H., Al-Khatib, M., Maleque, M.A., 2020. Removal of Chromium With CNT Coated Activated Carbon for Waste Water Treatment, Encyclopedia of Renewable and Sustainable Materials. Elsevier Ltd. https://doi.org/10.1016/b978-0-12-803581-8.10785-4.
- Kaviyarasu, K., Manikandan, E., Paulraj, P., Mohamed, S.B., Kennedy, J.J.J. of alloys, compounds, 2014. One dimensional well-aligned CdO nanocrystal by solvothermal method. Sensors Actuators B Chem. 593, 67–70.
- Kim, N.H., Kuila, T., Lee, J.H.J.J. of M.C.A., 2013. Simultaneous reduction, functionalization and stitching of graphene oxide with ethylenediamine for composites application. J. Mater. Chem. 1, 1349–1358.
- Kim, H.J., Lee, J.M., Choi, J.H., Kim, D.H., Han, G.S., Jung, H.S.J.J. of hazardous materials, 2021. Synthesis and adsorption properties of gelatin-conjugated hematite (α-Fe2O3) nanoparticles for lead removal from wastewater. J. Hazard. Mater. 416, 125696.
- Kudin, K.N., Ozbas, B., Schniepp, H.C., Prud’Homme, R.K., Aksay, I.A., Car, R.J.N. letters, 2008. Raman spectra of graphite oxide and functionalized graphene sheets. Nano Lett 8, 36–41.
- Kulkarni, V. V, Golder, A.K., Ghosh, P.K.J.J. of hazardous materials, 2018. Synthesis and characterization of carboxylic cation exchange bio-resin for heavy metal remediation. J. Hazard. Mater. 341, 207–217.
- A review on accessible techniques for removal of hexavalent Chromium and divalent Nickel from industrial wastewater: Recent research and future outlook. J. Clean. Prod.. 2021;295:126229
- [CrossRef] [Google Scholar]
- Langmuir, I.J.J. of the A.C. society, 1918. The adsorption of gases on plane surfaces of glass, mica and platinum. J. Am. Chem. Soc. 40, 1361–1403.
- Lin, J.-Y., Mahasti, N.N.N., Huang, Y.-H.J.J. of H.M., 2021. Recent advances in adsorption and coagulation for boron removal from wastewater: A comprehensive review. J. Hazard. Mater. 407, 124401.
- Luo, Q.-P., Yu, X.-Y., Lei, B.-X., Chen, H.-Y., Kuang, D.-B., Su, C.-Y.J.T.J. of P.C.C., 2012. Reduced graphene oxide-hierarchical ZnO hollow sphere composites with enhanced photocurrent and photocatalytic activity. J. Phys. Chem. C 116, 8111–8117.
- Microwave-assisted adsorption of Cr(VI), Cd(II) and Pb(II) in presence of magnetic graphene oxide-covalently functionalized-tryptophan nanocomposite. J. Alloys Compd.. 2020;823:153855
- [CrossRef] [Google Scholar]
- Mallick, S., Dash, S.S., Parida, K.M.J.J. of colloid, Science, I., 2006. Adsorption of hexavalent chromium on manganese nodule leached residue obtained from NH3–SO2 leaching. Sensors Actuators B Chem. 297, 419–425.
- Masoud, M.S., El-Saraf, W.M., Abdel - Halim, A.M., Ali, A.E., Mohamed, E.A., Hasan, H.M.I., 2016. Rice husk and activated carbon for waste water treatment of El-Mex Bay, Alexandria Coast, Egypt. Arab. J. Chem. 9, S1590–S1596. https://doi.org/10.1016/j.arabjc.2012.04.028.
- McBeath, S.T., Hajimalayeri, A., Jasim, S.Y., Mohseni, M.J.J. of W.P.E., 2021. Coupled electrocoagulation and oxidative media filtration for the removal of manganese and arsenic from a raw ground water supply. J. Water Process Eng. 40, 101983.
- Selection of biosorbents for biosorption of three heavy metals in a flow-batch reactor using removal efficiency as parameter. Niger. J. Technol.. 2015;34:406.
- [CrossRef] [Google Scholar]
- Phytochemical profiling and GC-MS analysis of aqueous methanol fraction of Hibiscus asper leaves. Futur. J. Pharm. Sci.. 2021;7
- [CrossRef] [Google Scholar]
- Physicochemical characterization of a liquid effluent from a refinery. J. Appl. Sci. Environ. Manag.. 2019;23:1779-1782.
- [CrossRef] [Google Scholar]
- Pan, S., Liu, X., Wang, X.J.M. characterization, 2011. Preparation of Ag2S–Graphene nanocomposite from a single source precursor and its surface-enhanced Raman scattering and photoluminescent activity. Mater. Charact. 62, 1094–1101.
- Razavi, Z., Mirghaffari, N., Alemrajabi, A.A., Davar, F., Soleimani, M.J.J. of C.P., 2021. Adsorption and photocatalytic removal of SO2 using natural and synthetic zeolites-supported TiO2 in a solar parabolic trough collector. J. Clean. Prod. 310, 127376.
- Sahu, S., Bishoyi, N., Patel, R.K.J.J. of I., Chemistry, E., 2021. Cerium phosphate polypyrrole flower like nanocomposite: A recyclable adsorbent for removal of Cr (VI) by adsorption combined with in-situ chemical reduction. J. Ind. Eng. Chem. 99, 55–67.
- Shen, X., Wu, J., Bai, S., Zhou, H.J.J. of A., Compounds, 2010. One-pot solvothermal syntheses and magnetic properties of graphene-based magnetic nanocomposites. J. Alloys Compd. 506, 136–140.
- Sustainable removal of Cr (VI) using graphene oxide-zinc oxide nanohybrid: adsorption kinetics, isotherms and thermodynamics. Environ. Res.. 2022;203:111891
- [Google Scholar]
- Biochars for the removal of naphthenic acids from water: a prospective approach towards remediation of petroleum refinery wastewater. J. Clean. Prod.. 2020;266:121986
- [CrossRef] [Google Scholar]
- Mxene materials based printed flexible devices for healthcare, biomedical and energy storage applications. Mater. Today. 2021;43:99-131.
- [Google Scholar]
- Diffused planar InP bipolar transistor with a cadmium oxide film emitter. Electron. Lett.. 1984;20:716-717.
- [Google Scholar]
- A comparative study of magnetic chitosan (Chi@Fe3O4) and graphene oxide modified magnetic chitosan (Chi@Fe3O4GO) nanocomposites for efficient removal of Cr(VI) from water. Int. J. Biol. Macromol.. 2019;137:948-959.
- [CrossRef] [Google Scholar]
- Facile synthesis of recycling Fe3O4/graphene adsorbents with potassium humate for Cr(VI) removal. Colloids Surf. A Physicochem. Eng. Asp.. 2019;560:384-392.
- [CrossRef] [Google Scholar]
- Weber Jr, W.J., Morris, J.C.J.J. of the sanitary engineering division, 1963. Kinetics of adsorption on carbon from solution. J. Sanit. Eng. Div. 89, 31–59.
- Wu, N., Wei, H., Zhang, L.J.E. science, technology, 2012. Efficient removal of heavy metal ions with biopolymer template synthesized mesoporous titania beads of hundreds of micrometers size. Environ. Sci. Technol. 46, 419–425.
- Sonication assisted deposition of Cu2O nanoparticles on multiwall carbon nanotubes with polyol process. Carbon N. Y.. 2005;3:670-673.
- [Google Scholar]
- Citation review of Lagergren kinetic rate equation on adsorption reactions. Scientometrics. 2004;59:171-177.
- [Google Scholar]
- Zhang, S., Zhang, H., Liu, F., Yang, F., Zhou, S., Zheng, K., Chu, C., Liu, L., Ju, M.J.R.S.C. advances, 2019. Effective removal of Cr (vi) from aqueous solution by biochar supported manganese sulfide. RSC Adv. 9, 31333–31342.
- Biological ion exchange capable of sulphate-based secondary ion exchange during long-term DOC removal. Water Res.. 2021;196:117036
- [Google Scholar]
Appendix A
Supplementary material
Supplementary data to this article can be found online at https://doi.org/10.1016/j.arabjc.2022.104445.
Appendix A
Supplementary material
The following are the Supplementary data to this article:Supplementary data 1
Supplementary data 1


