

Translate this page into:
Investigations on crystal structure of a novel 3-((4,6-dimethylpyrimidin-2-yl)amino)isobenzofuran-1(3H)-one, and related theoretical studies
⁎Corresponding authors. aysegulgolcu@itu.edu.tr (Ayşegül Gölcü), mustafaodabasoglu@gmail.com (Mustafa Odabaşoğlu)
-
Received: ,
Accepted: ,
This article was originally published by Elsevier and was migrated to Scientific Scholar after the change of Publisher.
Peer review under responsibility of King Saud University.
Abstract
In this report, 3-((4,6-dimethylpyrimidin-2-yl)amino)isobenzofuran-1(3H)-one have been synthesized via reaction between phthalaldehydic acid and 2-amino-4,6-dimethylpyrimidine in 90% yields and characterized by Infrared (IR), Nuclear Magnetic Resonance (NMR), Ultraviolet–visible (UV–Vis), X-ray single crystal diffraction techniques. The single-crystal X-ray analysis shows that the title compound crystallizes in the triclinic space group P-1 with unit-cell parameters a = 7.9351(4) Å, b = 11.1687(6) Å, c = 16.1281(9) Å, α = 73.713(5)°, β = 80.362(5)°, γ = 72.882(4)° and Z = 4. A theoretical study with hybrid functional B3LYP 6-311G (d, p) basis set have been used in calculations. The structural and electronic properties have been detailed. The title compound was screened for its antioxidant activity by (1,1-diphenyl-2-picryl hydrazyl) free radical scavenging (DPPH), Ferric ion reducing antioxidant power (FRAP), total phenolic contents (TP) assays and its ferrous ions chelating property. Electronic absorption titration, thermal denaturation measurement and viscosity techniques were used to determine the interaction between double stranded DNA (dsDNA) and compound 1. In three techniques, the mode of binding of compound 1 to dsDNA is minor groove. The UV–Vis measurement results allowed the calculation of the binding constant showing the binding strength of compound 1 to dsDNA was calculated as 8.13 × 10⁴ ± 0.07 L mol−1. Moreover, the molecular docking calculations have been performed to investigate the compound–DNA interactions, computationally. In molecular docking calculations, it was observed that for the title compound, the lowest energy docking pose takes place in the minor groove of DNA and in addition to minor groove binding, interactions between the compound and the consecutive base pairs of DNA which may cause a partial intercalation were also observed. Results showed that title compound – DNA complex is stabilized by several hydrogen bonds, and Pi-alkyl interactions also take part in the stabilization of the complex. Binding affinities of the lowest energy docking pose of the title compound was found to be −8.3 kcal/mol.
Keywords
Phthalide
Crystal structure
DFT calculations
DNA binding
Molecular docking

1 Introduction
Heterocyclic compounds, are widely available in nature and play an important role in organic chemistry (Quin and Tyrell, 2010; Arora et al., 2012). The vast majority of heterocyclic compounds are pharmacologically active (Lamberth and Dinges, 2012) and some of them are in clinical use such as: penicillin and cephalosporin used as antibiotics, vinblastine used as anticancer chemotherapy drug, morphine as most potent analgesic for chronic pain, etc. Among them, oxygen and nitrogen containing heterocycles constitute one of the largest and most varied group of heterocycles. The literature survey gives strong pieces of evidence regarding their potential in biomedical applications, and there is a general need for the synthesis of new heterocyclic compounds (Dua et al., 2011). To adress this issue, in continuation of our previous work (Yılmaz et al., 2020), in this report we synthesized a novel 3-substituted phthalide derivative, 3-((4,6-dimethylpyrimidin-2-yl)amino)isobenzofuran-1(3H)-one (1, Fig. 1) as an oxygen and nitrogen containing heterocycle.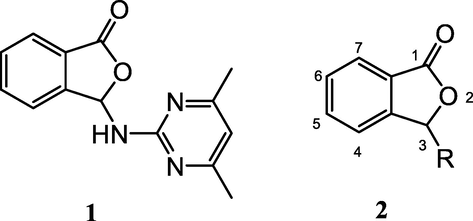
3-((4,6-dimethylpyrimidin-2-yl)amino)isobenzofuran-1(3H)-one (1) and general structure of isobenzofuran-1(3H)-ones (2).
Isobenzofuran-1(3H)-ones (also known as phthalides) (2) (Fig. 1) (Karmakar et al., 2014) and their derivatives carry a benzene ring fused to a γ-lactone moiety. They are one of the important heterocyclic compounds occuring widely in several genera of the family Apiceae (Beck and Chou, 2007; León et al., 2017) and in some microorganisms such as bacteria, fungi and limeworts (Gubiani et al., 2017; Harper at al., 2003; Strobel et al., 2002). Many of the phthalides, especially 3-substituted phthalides (Everaere et al., 2001; Zhang et al., 2010; Teixeira et al., 2013; Oliveira et al., 2015; Palillero-Cisneros et al., 2018; Prlainović et al., 2018) are a subset of phthalides which represent a wide range of important biological and medicinal properties such as: antifungal and antioxidant activities displayed by isopestacin (3) (Pahari et al., 2004; Strobel et al., 2002), selective activity against leukemia cancer cell lines by a vermistatin-type molecular inhibitor - penisimplicissin (4) (Stierle et al., 2012), antiplatelet activity from a brominated 3-substituted phthalide derivative (5) (Ma et al., 2012), 3-n-butylphthalide (NBP) (6) as a promising therapeutic agent for ischemic stroke (Liu et al., 2007), anti-inflammatory activity observed with ligustilide (7) (Du et al., 2007), antibacterial activity from herbaric acid (8) (Gelat et al., 2017) (Fig. 2).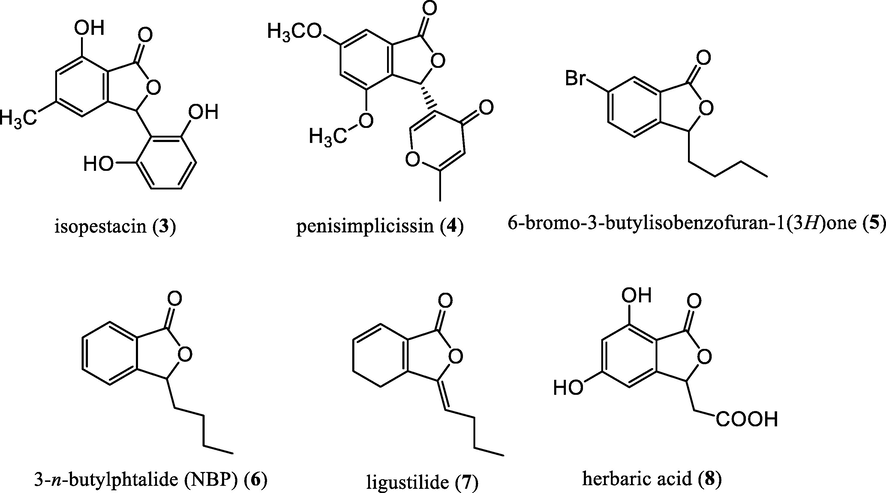
3-substituted phthalides having antifungal and antioxidant (3), antiproliferative (4), antiplatelet (5, 6), antinociceptive and anti-inflammatory (7), antibacterial (8) activities.
Additionally, all of the biochemical events necessary for the maintenance of biological life are found in the genomes of all known organisms. It is known that for the proteins of the organism in which the genomes of mixed organisms reside, the nucleic acids (genes) are arranged in separate linear sequences. The regular replication of these genetic materials directs the growth, collection and function of cellular machinery. Research has made, the central role of DNA in biological systems, a fundamental target for the diagnosis and treatment of diseases. The sequencing of the human genome demonstrates the potential benefit of DNA binding studies in molecular life sciences, as well as in the discovery of large international initiatives that produce multiple genes. Understanding the variations in genome structure and the functional significance of this condition, as well as the interaction between various nucleic acids and different molecules, is of paramount importance to human medicine. Designed small molecules that are specifically recognizable to predetermined nucleic acid (like DNA) sequences are powerful means of interpreting the human genome and are likely to ultimately become therapeutic agents. For this reason, in parallel with our continuous studies (Beyazit et al., 2019; Şenel et al., 2020; Yılmaz et al., 2020), this work, which is a part of an important master's thesis, brought together many different disciplines and examined the interaction of novel phthalide derivative with dsDNA successfully experimentally and theoretically.
2 Experimental
2.1 Materials and chemicals
All chemicals and solvents were reagent grade and were used as purchased without any further purification. Double strain DNA (dsDNA), tris-HCl, NaCI and ethidium bromide (EtBr) were purchased from Sigma-Aldrich. All solvents were purchased from Merck. The melting point was determined by using Stuart SMP30 melting point apparatus. The Fourier Transform Infrared (FT-IR) spectra were recorded on an Agilent Cary 630 FT-IR spectrometer using solid state of compound 1. UV–Vis absorption spectra were recorded on an OPTIZEN POP BIO UV/VIS Spectrophotometer using a 1 cm path length of the cell. The proton nuclear magnetic resonance (1H NMR) measurements were recorded at an Agilent VNMRS (500 MHz) instrument. Chemical data for protons are reported in parts per million (ppm, scale) downfield from tetramethylsilane and are referenced to the residual proton in the NMR solvent (DMSO‑d6: δ 2.50, or other solvents as mentioned). The chemical shifts δ are reported in parts per million (ppm), coupling constant J (expressed in Hertz). The carbon nuclear magnetic resonance (13C NMR) spectra were recorded at Agilent VNMRS 126 MHz. X-Ray diffraction (XRD) data was collected at 296 K with a STOE IPDS II diffractometer using MoKα radiation. The absorption spectra were recorded in the range of 200–400 nm on a T80 + UV/VIS spectrophotometer using cells of 1 cm light path and samples that contain dsDNA and compound 1 were mixed in vortex before the spectra were taken. The viscosity values of the samples were measured by using a rheometer (Haake Rheostress 1, Germany) equipped with a parallel-plate sensor (d = 35 mm, gap = 1 mm).
2.2 Synthesis of compound 1
The compound 1 was synthesized by the reaction between phthalaldehydic acid and 2-amino-4,6-dimethylpyrimidine with 90% yield (m.p. 450.5–451 K) (Odabasoglu and Büyükgüngör, 2006). The crystals suitable for X-ray analysis were obtained by slow evaporation of the acetonitrile solution (95%) of compound 1 at room temperature. 1H NMR (DMSO‑d6, 500 MHz) δ 8.30 (d, J = 10.29 Hz, 1H, ArH), 7.84–7.77 (m, 2H, ArH), 7.66–7.64 (m, 2H, NH, ⚌C—CH(O)—N), 7.45 (d, J = 10.29 Hz, 1H, ArH), 6.68 (s, 1H, ArH); 2.28 (s, 6H, CH3). 13C NMR (DMSO‑d6, 126 MHz) δ 169.56, 161.17, 146.66, 134.71, 130.55, 127.76, 124.91, 124.14, 112.43, 85.01, 23.91 (Figs. S1 and S2).
2.3 Single crystal X-ray diffraction
XRD data was collected at 296 K with a STOE IPDS II diffractometer using MoKα radiation. The crystal structure was solved by direct methods using SHELXS-97. All methyl H atoms were refined using the ridding model approximation with C—H = 0.96 Å [Uiso(H) = 1.2Ueq(parent atom)]. Other hydrogen atoms were refined anisotropically by full matrix least-squares methods (Sheldrick, 1997, 2015). All H atoms were located geometrically and refined using a riding model. WinGX (Farrugia, 1999), ORTEP-3 for Windows (Farrugia, 1997) and MERCURY (Macrae et al., 2006) softwares were used for molecular drawings and other materials.
2.4 Computational details
Gaussian 09W for computational part (Frisch et al., 2010) and GaussView program for molecular visualization of calculated structures (Dennington et al., 2009) have been used. The geometry optimization was realized by crystallographically obtained geometrical data (For the geometry optimizations of two tautomers for gas phase were done at DFT level by using the hybrid functional B3LYP (Becke’s three-parameter hybrid functional with LYP correlation functional) (Stephens et al., 1994) with 6-311G (d,p) basis set (Krishnan et al., 1980)). The vibrational frequencies were performed at B3LYP level and electronic excitations of the title compound by TD-DFT method, respectively (Runge and Gross, 1984; Bauernschmitt and Ahlrichs, 1996; Casida et al., 1998; Stratmann et al., 1998).
2.5 Determination of antioxidant activities
2.5.1 DPPH (1,1-diphenyl-2-picryl hydrazyl) free radical scavenging assay
1980 µL of DPPH solution (in methanol) was added to 20 µL of sample solution in DMSO with a final concentration of 20 mg/L. Samples were incubated in dark at room temperature and the absorbance was measured against the blank sample at a wavelength of 515 nm. The purple color of the solutions turn into yellow in the presence of an antioxidant molecule. The results were calculated by using radical scavenging activity (RSA) for DPPH free radical as RSA (%) = [(Acontrol − Asample)/Acontrol] × 100 where Asample is the absorbance of the sample and Acontrol is the absorbance of the blank solution. Same concentration of ascorbic acid was also used as standard substance and RSA (%) was calculated for concentration of 1 mM (Blois et al., 1958).
2.5.2 FRAP (Ferric ion reducing antioxidant power) assay
According to Benzie and Strain (1996), FRAP reagent was prepared by adding 10 mM of 2,4,6-tripyridyl-s-tri-azine (TPTZ) solution (in 40 mM HCl), 20 mM FeCl3·6H2O and 0.3 M acetate buffer (pH 3.6) to each other in 1:1:10 ratio respectively. 0.2 mL of sample and 1.8 mL of the FRAP reagent (warmed to the room temperature) were mixed and incubated in dark for 10 min at 37 °C. After cooling, the absorbance of the coloured product (ferrous tripyridyltriazine complex) was measured at a wavelength of 593 nm. Results were expressed as mM Fe(II)/g analyte and the calibration curve of FeSO4·7H2O (in distilled water) was constructed in the range of 2.5–34.0 μM with the following equation: y = 0.031x−0.0556 and the regression coefficient (r2) was 0.995.
2.5.3 Determination of TP (total phenolic) contents
0.3 mL of sample stock solution (in DMSO) was mixed with 1.5 mL of Folin-Ciocalteu's reagent (prepared via diluting 1:10 (v/v) with distilled water) and 1.2 mL of 7.5 (w/v)% aqueous sodium carbonate solution. The same procedure was performed with using 0.3 mL of DMSO as blank solution. After incubation for 15 min at room temperature, the absorbances of mixtures were measured at a wavelength of 760 nm. The results were represented as mg gallic acid equivalents (GAE) per mg of sample. The calibration equation for gallic acid (in distilled water) was y = 0.0706x + 0.0045 (r2 = 0.997). The assay was performed also by using ascorbic acid as standard substance with the same concentration of sample solution (Singleton and Rossi, 1965).
2.5.4 Ferrous ions chelating (FIC) assay
The ferrous (Fe2+) ion chelating activity of compound 1 was determined according to the method applied in some previous reports (Dinis et al., 1994, Ibrahim et al., 2013; Sellal et al., 2019). The stock solution of compound 1 was prepared in DMSO. 0.1 mL of compound 1 solution was mixed with the 0.05 mL 2 mM FeSO4 and 0.2 mL of 5 mM ferrozine solution as initiator, and 0.45 mL of methanol was added. After incubation of the solutions at room temperature for 10 min, the resulting solution absorbance values were measured spectrophotometrically at a wavelength of 562 nm. Lower absorbance values of samples indicates higher ability of the molecules chelating with Fe2+ ions. The results were calculated as: Inhibition (%) = [(Acontrol − Asample)/Acontrol × 100] where Acontrol is the absorbance value of the blank sample (DMSO) and Asample is the absorbance of compound 1 solution.
2.6 DNA binding studies
2.6.1 Electronic absorption spectra
For DNA binding studies, 217 µM dsDNA stock solution was prepared by dilution of dsDNA to buffer solution (containing 0.2 M tris-HCI and 150 mM NaCl at pH 7.4) followed by robust stirring for two days at room temperature (kept at 4 °C for no longer than seven days). The dsDNA solution thus prepared yielded a UV absorbance ratio of 1.85 at 260 and 280 nm (A260/A280), indicating that dsDNA was sufficiently purified from protein contamination. In this way, the molar concentration of dsDNA was determined using the molar absorption coefficient (ε = 6600 M−1 cm−1). In all experimental studies 1 × 10⁻³ M stock compound 1 solution was prepared by using DMSO and each batch was freshly prepared. The absorbance measurement experiments were carried out by keeping compound 1 concentration constant (80 µM) while varying the dsDNA concentration from 20 to 120 µM (ri = [DNA]/[compound 1] = 0.25, 0.5, 0.75, 1.00, 1.25 and 1.50).
2.6.2 Thermal denaturation assay
The denaturation profile of dsDNA solution (120 µM) has been obtained by incrementally increasing the temperature from 10 °C to 100 °C while measuring the absorbance values at 260 nm wavelength. Then into this dsDNA solution, separately compound 1 solution (30 µM) and EtBr solution (10 µM) were added to obtain the new denaturation profile of dsDNA under the same increasing temperature conditions. Tris-HCl/NaCl buffer solution was used in the denaturation studies.
2.6.3 Viscosity measurements
The viscosity measurements were conducted twice for each sample at room temperature. The viscosity data were modelled from the viscosity curves (viscosity versus shear rate) by using Herschel-Bulkley model for samples 1–3 and power-law model for samples 4–12. Herschel-Bulkley model: where η is apparent viscosity (Pa s), τo is yield stress (Pa), K is consistency index (Pa.sn), γ ̇ is shear rate (s−1) and n is flow behavior index (-). For Herschel-Bulkley fluids K > 0, 0 < n < ∞ and τo > 0. The power-law model: . For shear-thinning power-law fluids, there is no τo (τo = 0), K > 0 and 0 < n < 1. The data is reported as (η/ηo)1/3 versus r (r = [compound 1]/[DNA] = 0.25–3.0), where ηo is the viscosity of dsDNA solution alone (Lerman, 1961).
2.7 Molecular docking studies
Molecular docking calculations have been performed using AutoDock Tools and AutoDock Vina software packages (Morris et al., 2009; Trott and Olson, 2010). Discovery Studio Visualizer (Biovia, 2016) has been used for the representation of the docking results and of the interactions between compound 1 and DNA. Crystal structure of DNA has been obtained from RCSB Protein Data Bank (https://www.rcsb.org/) (PDB ID: 1BNA). Prior to docking calculations, water molecules were removed, hydrogens and Gasteiger charges were added. 3D molecular structures of compound 1 has been obtained directly from the crystallographic data.
3 Results and discussion
3.1 Crystal structure and optimised molecular geometry
The compound 1 crystallizes in the triclinic space group P-1 with unit-cell parameters a = 7.9351(4) Å, b = 11.1687(6) Å, c = 16.1281(9) Å, α = 73.713(5)°, β = 80.362(5)°, γ = 72.882(4)° and Z = 4. The chemical parameters of compound 1, the details of data collection and the treatment process are given in Table 1 and the comparison of the experimental and the calculated selected bond lengths, bond angles, and the torsion angles in Table 2.
Empirical formula
C14H13N3O2
Formula weight
255.27 g/mol
Radiation, λ
0.71073 Å
Crystal system
Triclinic
Space group
P-1
Z
4
a
7.9351(4) Å
b
11.1687(6) Å
c
16.1281(9) Å
α
73.713(5)°
β
80.362(5)°
γ
72.882(4)°
V
1305.59(13) Å3
Dx
1.299 Mg m−3
Crystal size
Prism, colorless
0.64 × 0.55 × 0.46 mm
Tmin, Tmax
0.9543, 0.9682
Measured reflections
18,886
Independent reflections
6022
θmin, θmax
1.97°, 28.03°
Scan range
h = −9 → 10
k = −14 → 14
l = −20 → 20
R[F2 > 2σ(F2)]
0.0464
wR(F2)
0.1434
S
1.042
w
1/[σ2(Fo 2) + (0.0854P)2]
where P = (Fo2 + 2Fc2)/3
Δρmin, Δρmax
−0.240 e Å−3, 0.278 e Å−3
Rint value
0.0695
X-Ray
DFT/B3LYP with 6–311G (d,p)
Gas phase
in Ethanol
in DMSO
Bond lengths (Å)
C1— O1
1.210(2)
1.200
1.207
1.209
C1—O2
1.352(2)
1.368
1.361
1.352
C1—C2
1.446(3)
1.483
1.479
1.446
C2—C7
1.380(2)
1.386
1.388
1.380
C7—C8
1.488(2)
1.510
1.508
1.488
C8—N1
1.398(2)
1.419
1.414
1.398
C8—O2
1.480(2)
1.473
1.487
1.480
C8—H8
1.03(2)
1.090
1.089
1.029
C9—N1
1.377(2)
1.377
1.378
1.377
N1—H1
0.81(2)
1.025
1.024
0.814
Bond angles (°)
O1—C1—O2
122.12(19)
123.132
122.427
122.134
O1—C1—C2
129.09(18)
129.259
129.507
129.093
N1—C8—O2
112.88(15)
112.092
112.142
112.892
O2—C8—C7
102.71(13)
103.328
103.012
102.705
N1—C8—H8
106.2(11)
108.034
108.931
106.197
N2—C9—N1
115.46(14)
115.344
115.468
115.467
C9—N1—C8
121.96(15)
122.304
122.410
121.962
C9—N1—H1
118.5(13)
115.532
116.239
118.423
C1—O2—C8
110.27(14)
111.445
111.193
110.278
Torsion angles (°)
O1—C1—O2—C8
173.40(18)
178.989
178.046
173.368
C1—O2—C8—N1
133.00(16)
127.267
127.448
132.992
O1—C1—C2—C3
1.8(3)
−0.169
0.522
−178.481
O2—C1—C2—C3
−178.15(18)
−179.049
−179.049
−178.148
C6—C7—C8—O2
174.55(18)
−3.221
177.684
174.562
N2—C9—N1—C8
173.44(16)
−175.199
−177.865
173.466
N3—C9—N1—C8
−5.6(3)
6.270
3.022
5.608
O2—C8—N1—C9
87.3(2)
91.673
84.605
87.249
C7—C8—N1—C9
−155.51(16)
−151.091
−158.353
−155.520
N1—C8—O2—C1
133.00(16)
127.267
127.448
132.992
There are two symmetry-independent molecules in the asymmetric unit (Fig. 3). As shown in the Fig. 3, the molecule structure of compound 1 consists of a phthalide group and a 4,6-dimethyl-2-pyrimidine amino group linked together by nitrogen atom. The phthalide group (C1—C8/O2) and (C15-C22/O4) is planar, the largest deviation from the mean plane being −0.081 Å (for C8) and −0.089 Å (for C22), respectively. The dihedral angle between the planar phthalide group and pyrimidine ring is 59.24° (for 1) and 70.0° (for 2) (Fig. 3).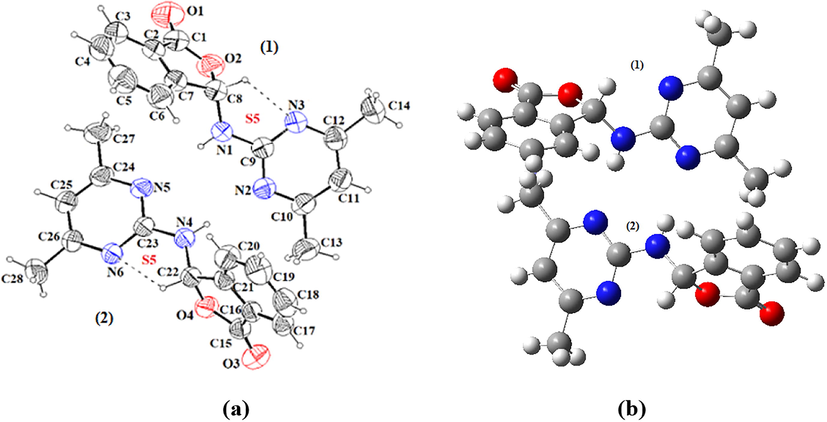
An ORTEP-3 view of compound 1 with the atomic numbering scheme (a), GaussView view of the optimized molecular structure of compound 1 (b).
The crystal packing of compound 1 is stabilized by intermolecular N—H···N and C—H···N hydrogen bonds, which generate R22(8) and S5 ring motifs (Etter, 1990). Intermolecular hydrogen bonds form a three-dimensional network which is enhanced by weak C—H⋯π interactions (Table 3, Figs. 4 and 5) There are also intermolecular C—H···O hydrogen bond interactions. Symmetry codes: (i) x, y − 1, z; (ii) x, 1 + y, z; Cg1: C15/C16/C21/C22/O4; Cg2: C1/C2/C7/C8/O2; Cg3: C2/C3/C4/C5/C6/C7.
D—H⋯A
D—H (Å)
H⋯A (Å)
D—A (Å)
D—H⋯A (°)
N1—H1⋯N5i
0.81
2.30
3.1115(2)
179
N4—H4A⋯N2i
0.86
2.22
3.0747(2)
179
C5—H5⋯O3ii
0.95
2.48
3.3958(2)
161
C8—H8⋯N3
1.03
2.31
2.7299(2)
103
C22—H22⋯N6
0.98
2.31
2.7183(2)
104
C25—H25⋯O3iii
0.98
2.50
3.4164(2)
157
C27—H27C⋯O1iv
0.96
2.53
3.3286(2)
141
Symmetry codes: (i) x, y, z; (ii) −1 + x, 1 + y, z; (iii) x, 1 + y, z; (iv) 1-x, 1-y, 1-z; (v) -x, -y, 1-z; (vi) 1-x, 1-y, -z
X—H
Cg
H⋯Cg (Å)
X—H⋯Cg (°)
X⋯Cg (Å)
C13—H13B
Cg1i
2.83
141
3.6212(2)
C27—H27B
Cg2ii
3.01
132
3.7164(2)
C27—H27B
Cg3ii
2.84
174
3.800(2)
![A partial packing diagram for compound 1, with N—H⋯N, C—H⋯N hydrogen bonds and C—H⋯π interactions shown as dashed lines [Symmetry codes: (i) x, y-1, z; (ii) x, 1 + y, z; Cg1: C15/C16/C21/C22/O4; Cg2: C1/C2/C7/C8/O2; Cg3: C2/C3/C4/C5/C6/C7].](/content/184/2020/13/6/img/10.1016_j.arabjc.2020.03.013-fig4.png)
A partial packing diagram for compound 1, with N—H⋯N, C—H⋯N hydrogen bonds and C—H⋯π interactions shown as dashed lines [Symmetry codes: (i) x, y-1, z; (ii) x, 1 + y, z; Cg1: C15/C16/C21/C22/O4; Cg2: C1/C2/C7/C8/O2; Cg3: C2/C3/C4/C5/C6/C7].
![Demonstration of the bonding of asymmetric units with hydrogen bonds of O3···H5 and O3···H25 for compound 1 [Symmetry codes: (i) x, y, z; (ii) −1 + x, 1 + y, z].](/content/184/2020/13/6/img/10.1016_j.arabjc.2020.03.013-fig5.png)
Demonstration of the bonding of asymmetric units with hydrogen bonds of O3···H5 and O3···H25 for compound 1 [Symmetry codes: (i) x, y, z; (ii) −1 + x, 1 + y, z].
Whether the substituted groups are effective on the aromaticity of the aromatic rings or not, it can be examined by harmonic oscillator model of aromaticity (HOMA) index, given by the following equation (Kruszewski and Krygowski, 1972; Krygowski, 1993): where n is the number of bonds in the ring, α is a constant equal to 257.7 and Ropt is equal to 1.388 Å for C—C bonds. For purely aromatic compounds, HOMA index is equal to 1 while it is equal to 0 for non-aromatic compounds. The HOMA indexes in the range of 0.900–0.990 and 0.500–0.900 correspond to the aromatic and the non-aromatic rings, respectively (Filarowski et al., 2002, 2008). In this study, the calculated HOMA indexes for C2—C7 and C16—C21 rings are 0.941 and 0.944, respectively, indicating that the C2-C7 and C16-C21 rings are aromatic.
Average quadratic error values (R2) have been calculated in order to show the accordance between the results found, by using experimental results and B3LYP/6-311G (d,p) method. R2 values of compound 1 have been found as R2(for bond length) = 0.95 (for 1) and 0.98 (for 2); R2(for bond angles) = 0.95 (for 1) and 0.98 (for 2); R2(for torsion angles) = 0.998 (for 1 and 2) (Fig. 6). Results show that (B3LYP/6-311G + (d, p)) method is compatible with experimental values. One of the ways to compare the experimental and theoretically obtained geometric structures as one is to overlap one another. Fig. 6 shows that the X-ray geometry and the optimized geometries in the gas phase overlap each other. While sections of phthalide and pyrimidine in (1) molecule of title compound are totally overlapped, only phthalide sections in (2) molecule are overlapped. The section of pyrimidine shows angular deviation. This deviation is supported with R2 (0.98) value found for the bond angles of (2) molecule, and this distinction is evaluated as a result of interaction between molecules.
Superimposition of gas phase optimized and experimental geometry (red) of compound 1.
3.2 Frontier molecular orbitals and electronic properties
According to the molecular orbital theory, highest occupied molecular orbital (HOMO) and lowest unoccupied molecular orbitals (LUMO) can also be called as pioneer orbitals, since they have an important role in chemical reactions. The difference between HOMO and LUMO energy values can be defined as the chemical stability of the molecule. The energy difference (ΔE) calculations between HOMO and LUMO energy values were made in the gas phase (Fig. 7). While spectroscopic analysis and biological activities of compound 1 were performed in ethanol and DMSO, respectively, therefore same solvents were also used in HOMO and LUMO energies calculations of compound 1. The lowest ΔE value between HOMO and LUMO energies is the calculated value in ethanol (ΔE(gas phase) = 6.8209 eV; ΔE(ethanol) = 4.8875 eV; ΔE(DMSO) = 5.0187 eV). This energy range shows that the molecule is stable.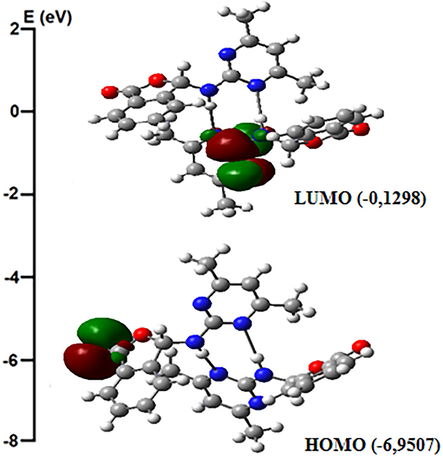
The molecular orbital surfaces of compound 1 in the gas phase.
3.3 Global reactivity descriptors
The highest filled molecular orbital energy (EHOMO) and the lowest empty molecular orbital energy (ELUMO) are the basic orbitals involved in chemical reactions (Fukui, 1982). Depending on HOMO and LUMO energy values of a molecule, the electronic reactivity parameters can be determined. The conceptual aspect of the density functional method has been amply used to understand the chemical reactivity, to define a set of chemical concepts such as the electron affinity (A = −ELUMO), ionization potential (I = −EHOMO), chemical hardness (η = ΔE/2), chemical softness σ = 1/2η), electronegativity (χ = (I + A)/2), electrophilicity index (ω = μ2/2η), chemical potential (µ = −χ) and nucleophilicity index (N = 1/ω) which are linked to their electronic structure and chemical reactivity (Parr and Pearson, 1983; Pearson, 1986, 1989; Parr and Yang, 1989; Parr et al., 1999; Geerlings et al., 2003; Ghiasi and Parseh, 2014; Aboelnaga et al., 2016; Landeros-Martinez et al., 2017). The electronic reactivity parameters of compound 1 were calculated with B3LYP/6311G (d,p) method and are listed in Table 4.
E(HOMO) (eV)
E(LUMO) (eV)
DE (eV)
I (eV)
A (eV)
−6.9507
−0.1298
6.8209
6.9507
0.1298
χ (eV)
η (eV)
σ (eV−1)
ω (eV)
µ (eV)
N (eV)
3.5403
3.4105
0.1466
1.8375
−3.5403
0.5442
The chemical hardness and softness of a molecule, calculated from the HOMO–LUMO energy gap, is a good indicator of its chemical stability. The molecules having large energy gap are known as hard and molecules having a small energy gap are known as soft molecules. A small HOMO-LUMO gap automatically means small excitation energies to the manifold of excited states. Therefore, soft molecules, with a small gap, will be more polarizable than hard molecules (Parr and Pearson, 1983; Pearson, 1986, 1989; Parr and Yang, 1989; Parr et al., 1999; Geerlings et al., 2003; Ghiasi and Parseh, 2014; Aboelnaga et al., 2016; Landeros-Martinez et al., 2017). The relatively large HOMO-LUMO energy gap indicates that compound 1 is a chemically hard molecule. Whether a given molecule is a Lewis acid or a base, it is determined by its χ value. Large χ values characterize acids and small χ values are found for bases. According to Table 4, the title compound can be defined as a Lewis acid (Parr and Pearson, 1983; Pearson, 1986, 1989; Parr and Yang, 1989; Parr et al., 1999; Geerlings et al., 2003; Ghiasi and Parseh, 2014; Aboelnaga et al., 2016; Landeros-Martinez et al., 2017).
Domingo et al. (2002) classified electrophiles based on the electrophilicity index as strong (ω > 1.50 eV), moderate (1.50 > ω > 0.80 eV) and marginal (ω < 0.80 eV). In addition, nucleophiles are classified as strong (N > 3.00 eV), moderate (3.00 > N > 2.00 eV) and marginal (N < 2.00 eV) (Domingo et al., 2002; Domingo and Perez, 2013; Jaramillo et al., 2008). According to the classification, compound 1 is a strong electrophile and marginal nucleophile.
3.4 Investigation of molecular surfaces atomic charges distribution
The molecular electrostatic potential (MEP) map shows the molecular shape, size, and electrostatic potential value (Scrocco and Tomasi, 1979). The value of electrostatic potantial on MEP is determined with the system of color coding. On MEP map, while the most negative area is shown with red, the most positive area is pointed with blue color (Saraç, 2018). In this study, molecular electrostatic potential was calculated and its distributions were discussed. The 3D molecular electrostatic potential surface maps of compound 1 which is optimized by the B3LYP/6-311G (d,p) method are shown in Fig. 8. The electrostatic potential of the molecule varies in the range from −5.888e−2 to +5. 888e−2.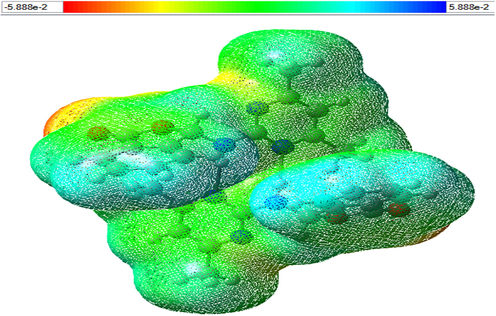
Molecular electrostatic potential (MEP) of compound 1.
Mulliken charge dispersion method is widely used to provide a broad information about the polarity of the molecule, electronic structure, dipol momentum of atomic structures, load balancing on atoms, donor and acceptor pairs providing load transfer on molecule, various features of molecular structures (Koparir et al., 2016). This method is also based on the technique of obtaining molecular orbitals with the lineer combination of atomic orbitals (Reed et al., 1985, 1988). Mulliken density analysis to calculate the atomic charges of compound 1 were calculated in Fig. 9 by calculating the B3LYP/6-311G (d,p) method. According to these results, negative charges were collected on O and N atoms with the highest electronegativity of the studied molecule. Positive charges were collected for H, whose electronegativity was lower. However, the highest positive charges were localized to the C1 and C15 (+0.405 a.u.) with C9 and C23 (+0.264 a.u.) carbons, respectively. This result indicates that the centers that are most affected by nucleophiles in compound 1 are those carbon atoms. Figs. 8 and 9 clearly describe intermolecular interactions given in Table 3.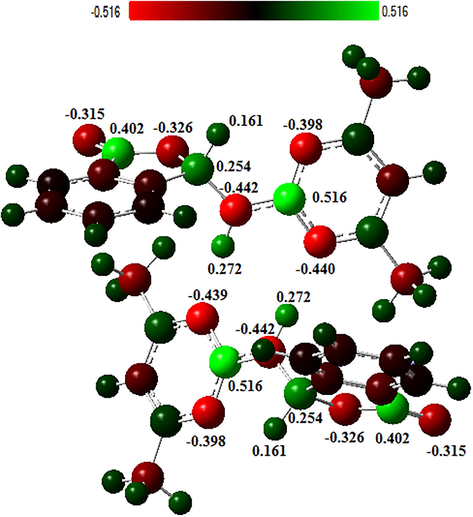
Charge distribution on atoms calculated by Mulliken charge distribution method.
3.5 IR spectra analysis
Experimental FT-IR and theoretical IR spectra of compound 1 are shown in Fig. 10a and b, respectively. Experimental and theoretical IR spectra are computed using scale factors for comparative purposes. The assignments of the observed vibration bands have been performed and compared with the calculated frequencies. The experimental and calculated vibrational frequencies, and their assignments, are given in Table 5. It is known that DFT/B3LYP/6-311G (d,p) method calculates vibration frequencies slightly higher than their experimental values. Therefore, obtained theorotical results were rescaled by 0.9614 to approximate to experimental values (Foresman and Frisch, 1996). as: Asymmetric; s: Symmetric; υ: Stretching; δ: In plane bending; γ: Out plane bending.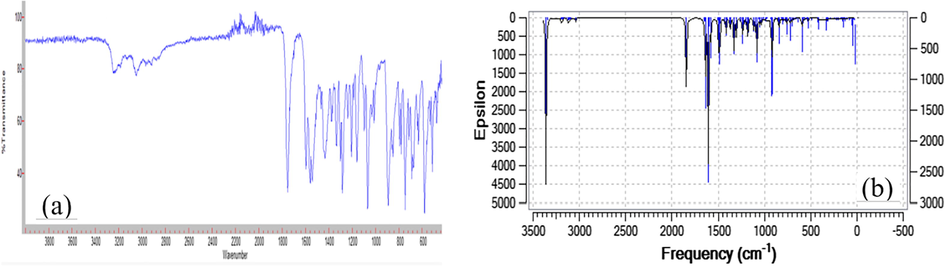
FT-IR spectrum of compound 1 (a), Comparison of calculated and experimental FT-IR spectra of compound 1 (b).
Vibrational Assignments
Observed frequency (cm−1) FT-IR
Calculated (B3LYP/6-311G (d,p))
>N—H, υ
3240
3354
>N—H, υ
3240
3334
⚌C—H, υ(A=C2—C7, B=C16—C21 ring)
–
3190
⚌C—H, υ(A=C9/N2—C12, B=C23/N5—C26 ring)
3188
3189
⚌C—H, υ(A=C2—C7, B=C16—C21 ring)
–
3183
⚌C—H, υ(A=C2—C7, B=C16—C21 ring)
–
3175
⚌C—H, υ(A=C2—C7, B=C16—C21 ring)
–
3163
C—H, υas(CH3)
3050
3132
C—H, υas(CH3)
–
3116
C—H, υ(A=C8—H8, B=C22—H22)
–
3103
C—H, υas(CH3)
–
3092
C—H, υas(CH3)
–
3089
C—H, υs(CH3)
–
3040
C—H, υs(CH3)
–
3034
C⚌O, υ
1753
1840
C⚌C, υ(aromatic)
1596
1651
C⚌N, C⚌C, υ(aromatic)
1542
1604
C—H, δ(aromatic); γ(CH3)
–
1495
C—H, δ(A=C8—H8, B=C22—H22)
–
1376
⚌C—H, δ(aromatic)
1283
1300
C—N, υ
1205
1257
⚌C—H, δ(aromatic)
1160
1179
⚌C—H, δ(aromatic)
1098
1117
C—O, υ
1068
1077
C—O, υ
–
925
⚌C—H, γ(aromatic)
–
887
⚌C—H, γ(aromatic)
–
844
⚌C—H, γ(aromatic)
–
810
⚌C—H, γ(aromatic)
747
760
⚌C—H, γ(aromatic)
690
753
The stretching vibration of C⚌O group of the asymmetric molecules was calculated as 1840 cm−1, N—H stretching vibration was calculated as 3354 cm−1, experimentally these vibrations were observed at 1753 cm−1 and 3240 cm−1. The reason of the difference between experimental and theoretical stretching frequencies is that theorotical values are obtained in gas phase while experimental values are obtained in solid phase.
3.6 UV–Vis spectra analysis
In the recorded UV–Vis spectrum of compound 1 in ethanol, absorptions were observed at wavelengths of 205 nm, 230 nm and 280 nm. According to the method of B3LYP/6-311G (d,p), absorptions at 259 nm were observed (Fig. 11a and b). The observed values are π → π* transitions of aromatic ring and the most severe experimental absorption is 230 nm while theoretical absorption is 259 nm. The experimentally observed n → π* transition at 280 nm was not clearly observed in the theoretical calculation.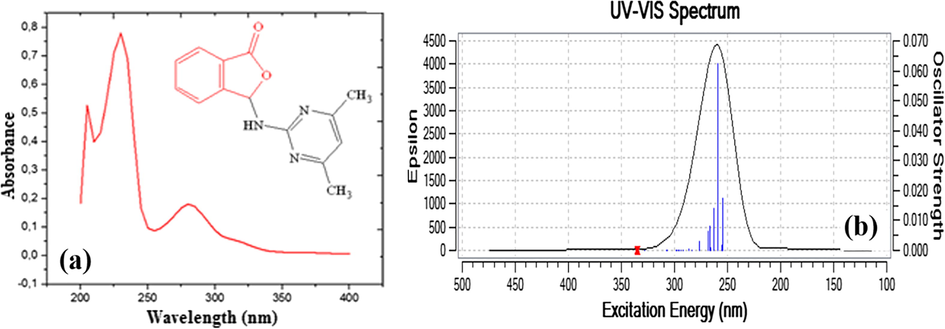
UV–Vis spectrum of compound 1 (a), Comparison of calculated and experimental UV–Vis of compound 1 (b).
3.7 NMR spectra analysis
NMR chemical deviation calculations are used to determine the structures of large molecular systems (Tamer, 2016). Therefore, in the synthesis of all organic compounds, spectrum of 1H- and 13C NMR are used. Moreover, usage of calculated NMR spectra along with theoretical NMR data yields more accurate results obtained. 1H- and 13C NMR spectra of compound 1 in DMSO‑d6 are given in Figs. S1 and S2. Chemical shift values of compound 1 are calculated by using B3LYP/6-31 + G(d,p) level with GIAO method in gas state. The theoretically calculated results are compared with the experimental observations in Table 6 and Fig. 12.
Position of proton
δcalcd
δexp
Position of carbon
δcalcd
δexp
27-H
8.16
8.30
10-C
168.36
134.71
29-H
8.09
7.84–7.77
12-C
168.36
134.71
30-H
7.97
7.45
1-C
167.55
169.56
31-H
7.91
7.66–7-64
9-C
159.20
161.17
28-H
7.91
7.84–7.77
7-C
145.77
146.66
32-H
6.82
6.68
5-C
132.32
130.55
26-H
5.27
7.66–7-64
4-C
127.93
127.76
18-H
2.41
2.28
2-C
126.46
124.91
19-H
2.41
2.28
3-C
122.84
124.91
20-H
2.41
2.28
6-C
121.41
124.14
14-H
2.30
2.28
11-C
110.08
112.43
15-H
2.30
2.28
8-C
85.63
85.01
16-H
2.30
2.28
13-C
26.01
23.91
17-C
26.01
23.91
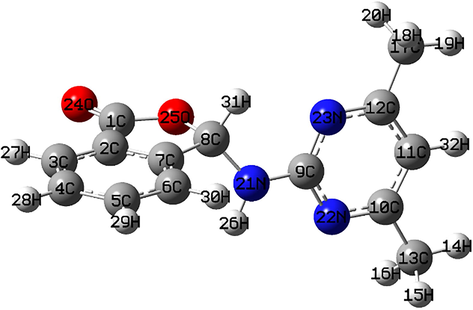
Theoretically (B3LYP/6-311G (d,p)) and experimentally numbered compound 1.
3.8 Antioxidant activities
The collective studies on evaluation of the antioxidant activities of compound 1 showed that, it has minor antioxidative ability compared to a reference substance ascorbic acid. Ascorbic acid at the same concentration with sample solution in the total phenolics content assay showed 1000 times greater activity. However; compound 1 showed slight DPPH activity in low concentration which is a method using worldwide for evaluation of the scavengering activity based on radicalic reactions. The metal chelating ability based on ferrous ions were also evaluated due to the biological and environmental importance of Fe2+/Fe3+ ions. The compound 1 was showed considerable percentage inhibition up to 20% and in FRAP assay which is based on ferric reducing power of the compound having a reducing capability of 8.24 mM Fe(II) per g of sample. The comparative results (n = 3) of the mentioned methods are given in Table 7.
3.9 DNA binding studies
3.9.1 Absorption spectra measurements
Ultraviolet absorption spectroscopy, is one of the most preferred methods for determining nucleic acid interactions. The binding mode of the molecule being examined and changes in the structure of DNA in the presence of this molecule can be clearly understandable from the UV–Vis spectra. The absorption of double helix DNA was caused by conjugated double bonds in the purine and pyrimidine rings within the structure. When there is an interaction between dsDNA and molecules such as compound 1, wavelength changes in the absorption of dsDNA are observed. The interaction between DNA and such molecules varies according to the magnitude of the peak position and absorbance associated with the interaction position. In general, the absorption spectra of small molecules that bind to DNA in the groove binding mode exhibit significant hypochromic effect, while the position of the absorption band is almost unchanged; this can be explained by the fact that the electronic states of the chromophore of the complex overlap with the nitrogen groups within the grooves of DNA.
In this part of our dsDNA study, the interaction of compound 1 with dsDNA was investigated by examining the absorption spectra of the mixed solutions prepared at the specified concentrations. That is, a series of solutions were prepared by adding increasing amounts of dsDNA solution (from 10 to until reaching 200 µM) to solutions of compound 1 at a certain concentration (80 µM) in each measurement prepared from stock solutions. The UV–Vis absorption spectra of compound 1 in the absence and presence of dsDNA are given in Fig. 13. The addition of different amounts of dsDNA exhibited that the intensity of absorption decreased gradually (hypochromic effect) for about 21.50% and was not shifted in terms of wavelength. The spectrum analysis and the changes in absorption peaks are shown in Fig. 13 clearly. The decrease in the absorbance values and the absence of significant wavelength shifts in the experiments at the constant concentrations of compound 1 showed that it was binding to dsDNA via groove binding mode. In the scientific literature, the same binding mode has been proposed in some significant drugs (Somerville et al., 2003; Shahabadi et al., 2018) with similar spectral properties, i.e., hypochromism in the presence of dsDNA and no shift in the wavelength. In addition, DNA binding constant (Kb) of compound 1 is calculated based on the titration data. The intrinsic binding constant Kb of compound 1 with dsDNA represents the binding constant per DNA base pair, can be obtained by monitoring the changes in absorbance between 200 and 400 nm with extended concentrations of dsDNA from plots [DNA]/εa–εf versus [DNA] and is given by the ratio of slope to the y-intercept, according to Benesi-Hildebrand equation (Benesi and Hildebrand, 1949):
where εa is the apparent extinction coefficient obtained by calculating Aobsd/[compound 1], εf is the extinction coefficient of the drug-free in solution, εb = extinction coefficient for the drug in the fully bound form and [DNA] is the concentration of DNA in terms of base-pairs. The Kb value was 8.13 × 10⁴ ± 0.07 L mol−1 for compound 1 (from Fig. 13 and log Kb = 4.91 ± 0.04) and is lower than the known value for basic intercalator such as ethidium bromide (107 L mol−1). However, this Kb value is highly consistent with the previously reported Kb value (9.59 × 10⁴), as the minor groove binding phthalide ligand which is investigated in our previous report (Yılmaz et al., 2020). It has been found that compound 1 was bounded to dsDNA by the groove binding mode, but more experimental methods are needed to confirm the binding mechanism more precisely, so that the thermal denaturation, viscosity measurements, and theoretical studies are good tools to obtain information about the binding mode (see Scheme 1).![UV–Vis absorption spectra of compound 1 (80 µM) upon the titration of dsDNA (20–120 µM) in Tris-HCl buffer. The arrow shows the decreases in absorbance with respect to an increase in dsDNA concentration. The maximum wavelength of compound 1 (λmax = 288 nm) has not shifted. The inset shows the linear fit of [DNA]/(εa − εf) vs. [DNA], and the binding constant (Kb) was calculated using this linearity.](/content/184/2020/13/6/img/10.1016_j.arabjc.2020.03.013-fig13.png)
UV–Vis absorption spectra of compound 1 (80 µM) upon the titration of dsDNA (20–120 µM) in Tris-HCl buffer. The arrow shows the decreases in absorbance with respect to an increase in dsDNA concentration. The maximum wavelength of compound 1 (λmax = 288 nm) has not shifted. The inset shows the linear fit of [DNA]/(εa − εf) vs. [DNA], and the binding constant (Kb) was calculated using this linearity.
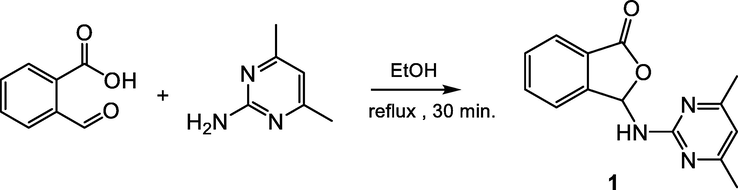
Synthesis of 3-((4,6-dimethylpyrimidin-2-yl)amino)isobenzofuran-1(3H)-one (1).
3.9.2 Thermal denaturation studies
The stability of the secondary structure of dsDNA resulting from the binding of compound 1 to the dsDNA strand is often widely determined by the thermal denaturation technique. The melting temperature of the dsDNA is an important consideration showing the interaction of small molecules with nucleic acids. As the temperature of the dsDNA solution medium increases, the hydrogen bonds between the base pairs in the dsDNA structure break and the dsDNA structure begins to decompose into single strands. The temperature at which half of the total base pairs separate is defined as the melting temperature (Tm) of DNA (Marmur and Doty, 1962). Tm is an extremely important parameter for the balance of the double helical structure. The molecules change their Tm values depending on their binding affinity to DNA. As can be seen from Fig. 14, the denaturation process for compound 1 is completed in one step. In the absence of compound 1, the Tm value of 120 µM dsDNA was measured as 72.2 °C. Also, as shown in Fig. 14, the Tm value of dsDNA solution was not significantly increased by the addition of compound 1 (at a given concentration). As an example, at r = 0.083, the Tm value of dsDNA was 77.8 °C and the temperature difference was 5.6 °C, a pretty low increase in DNA melting temperature, suggesting that the introducing of this compound doesn’t diminish the stability of DNA’s double helical conformation. The Tm value of EtBr compound + dsDNA solution was much greater (83.4 °C, temperature difference: 11.2 °C in Fig. 14) compared to compound 1′s introduction into DNA indicating that EtBr interacted by intercalation (as known) with dsDNA, but compound 1 was not bound to dsDNA by intercalation. This is clear evidence that compound 1 was not bounded to the dsDNA construct by intercalation (Arya et al., 2003).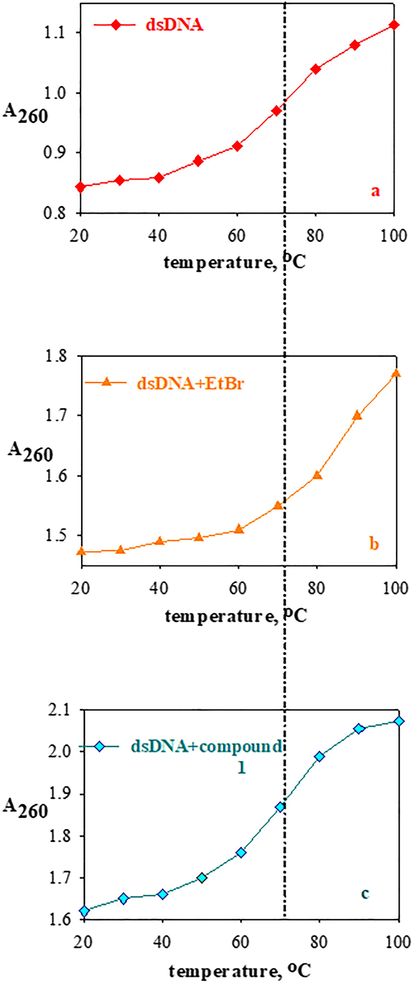
The thermal denaturation profiles of dsDNA (120 µM) (a) in the absence and in the presence of EtBr (10 µM) (b) and compound 1 (30 µM) (c) in Tris-HCl/NaCl buffer solution.
3.9.3 Viscosity measurements
The consistency indices for viscosity studies, the flow behavior indices and the calculated apparent viscosities at 20 s−1 of samples were given in Table 8 at the shear rate of 20 s−1. Samples 1–3 in Table 8 fit the Herschel-Bulkley model. However, samples 4–12 showed pseudoplastic behavior since 0 < n < 1 and no flow event was observed. As can be seen from Table 8, the yield stress values of samples 1–3 were almost the same. The consistency index values of Example 1 (Tris-HCl/NaCl buffer solution) were lower compared to example 2 (dsDNA solution) and 3 (compound 1 solution), but the flow behavior index values had an inverse tendency. The apparent viscosity values of samples 2 and 3 are higher than the apparent viscosity of sample 1. It is evident that the apparent viscosities of examples 4–12 (dsDNA + compound 1) are increased compared to the apparent viscosity values of examples 1–3. According to these data, the effect of increasing amount of compound 1 on the relative viscosity of dsDNA has been given in Fig. 15. As noted in the literature, there is often no change in viscosity since electrostatic or groove surface binders tend to be very small (Arya et al., 2003). However, the increase in viscosity of the nucleic acid solution is a clear indication that the binding mode is intercalation (Mirzaei-Kalar, 2018).
Sample no
Yield stress (Pa)
K (Pa.sn)
n (-)
Apparent viscosity (mPa.s) at 20 s−1
Buffer
0.30 ± 0.02
1.10 × 10⁻⁴ ± 2.32 × 10⁻⁴
1.46 ± 0.02
15.43
Compound 1
0.30 ± 0.03
2.68 × 10⁻⁴ ± 1.00 × 10⁻⁴
1.28 ± 0.01
15.62
dsDNA
0.31 ± 0.01
8.92 × 10⁻⁵ ± 2.22 × 10⁻⁵
1.50 ± 0.05
15.90
Sample 1
0.32 ± 0.01
1.85 × 10⁻⁴ ± 1.85 × 10⁻⁵
1.40 ± 0.03
16.61
Sample 2
0.31 ± 0.01
3.62 × 10⁻⁴ ± 1.54 × 10⁻⁴
1.32 ± 0.01
16.44
Sample 3
0.32 ± 0.02
1.37 × 10⁻⁴ ± 2.00 × 10⁻⁴
1.45 ± 0.04
16.53
Sample 4
0.30 ± 0.02
3.41 × 10⁻⁴ ± 1.98 × 10⁻⁴
1.30 ± 0.02
15.84
Sample 5
0.33 ± 0.00
4.54 × 10⁻⁴ ± 2.31 × 10⁻⁴
1.30 ± 0.03
17.62
Sample 6
0.33 ± 0.00
4.18 × 10⁻⁴ ± 3.87 × 10⁻⁴
1.32 ± 0.01
17.60
Sample 7
0.33 ± 0.04
4.78 × 10⁻⁴ ± 1.01 × 10⁻⁴
1.28 ± 0.01
17.60
Sample 8
0.32 ± 0.02
8.61 × 10⁻⁴ ± 7.41 × 10⁻⁴
1.23 ± 0.01
17.71
Sample 9
0.32 ± 0.01
1.52 × 10⁻³ ± 4.70 × 10⁻⁵
0.83 ± 0.04
16.91
Sample 10
0.34 ± 0.04
6.10 × 10⁻⁴ ± 1.98 × 10⁻⁴
0.66 ± 0.05
17.22
Sample 11
0.33 ± 0.01
1.44 × 10⁻⁴ ± 2.33 × 10⁻⁴
1.11 ± 0.06
16.70
Sample 12
0.33 ± 0.01
3.21 × 10⁻⁴ ± 5.63 × 10⁻⁴
1.15 ± 0.03
17.00
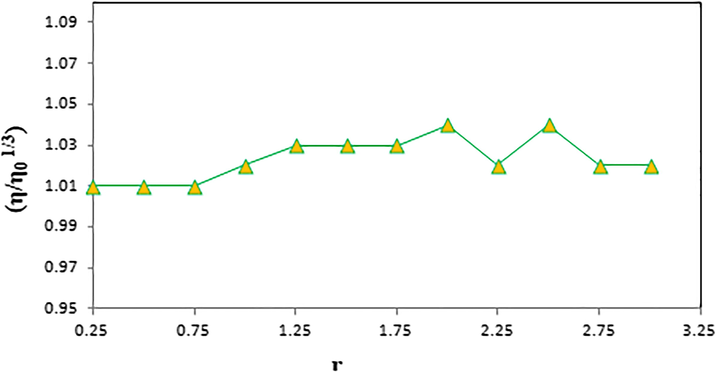
Effect of increasing amount of compound 1 on the relative viscosity of dsDNA.
3.10 Molecular docking studies
Molecular docking calculations have been performed for compound 1 to determine the docking poses and to reveal the possible interactions between the investigated compound 1 and DNA. It has been observed that the compound 1 takes place mainly in the minor groove of DNA. Additionally, some non-bonded molecular interactions have also been observed between the compound 1 and the consecutive base pairs of DNA. It can be said that this compound 1 – base pair interactions may cause an elongation and/or an unwinding in DNA structure and thus a partial intercalation. In Fig. 16, binding modes and compound 1 – DNA interactions compound 1 are represented. The characteristics of the interactions are given in Table 9. It was observed that hydrogen bonds take part in the stabilization of compound 1 – DNA complex, in addition to hydrogen bonds, Pi – alkyl interactions also contribute to the stabilization of the compound 1 – DNA complex. The binding affinities of the lowest energy docking poses was found to be −8.3 kcal/mol for compound 1.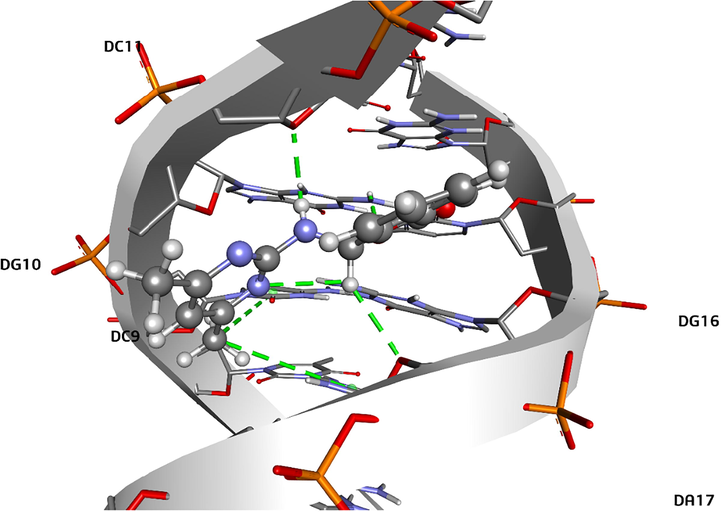
Binding mode and compound – DNA interactions for compound 1.
Interaction No
DNA Strand
Nucleotide
Nucleotide Atom
Compound 1
AtomDistance (Å)
Nature of Interaction
1
A
DC11
O4′
H1
2.32
Conventional H-Bond
2
A
DG10
H21
O2
2.17
Conventional H-Bond
3
B
DG16
H21
N2
2.96
Conventional H-Bond
4
B
DA17
O4′
H6
2.61
Carbon H-Bond
5
A
DC9
Ring
C13
5.41
Pi – Alkyl
6
B
DA17
Ring
C13
5.21
Pi – Alkyl
4 Conclusions
A novel 3-substituted phthalide derivative (compound 1) was synthesized and characterized by various spectral techniques. The single-crystal X-ray analysis shows that compound 1 crystallizes in the triclinic space group P-1 with unit-cell parameters a = 7.9351(4) Å, b = 11.1687(6) Å, c = 16.1281(9) Å, α = 73.713(5)°, β = 80.362(5)°, γ = 72.882(4)° and Z = 4. A complete vibrational analysis and geometry optimization of the related compound were carried out at the DFT level by using the hybrid functional B3LYP with 6-311G(d,p) basis set. DNA binding studies of compound 1 were investigated by UV–Vis, thermal denaturation and viscosity measurements. In the mentioned techniques, the mode of binding of compound 1 to dsDNA is determined as a minor groove with a binding constant of 8.13 × 10⁴ ± 0.07 L mol−1. In molecular docking studies, it was observed also the investigated compound takes place in the minor groove of DNA. It was also observed that compound interacts with the consecutive base pairs of DNA. It was thought that these interactions may cause elongation and/or unwinding in DNA structure and thus partial intercalation. On the other hand, investigated compound shows satisfactorily high binding affinity with the value −8.3 kcal/mol. The title compound was screened also for its antioxidant activity by DPPH, FRAP and TP assays. Further efforts on the development of other analogs derivatives are currently underway in our laboratory. We hope that newly synthesized 3-substituted phthalide derivative will provide an opportunity for synthesis of new heterocyclic compounds that may have considerable applications in initial phases of drug development.
Acknowledgments
The authors wish to thank Istanbul Technical University, Faculty of Science and Letters, Department of Chemistry for some experimental conditions, and Dr. Filiz ALTAY (Istanbul Technical University, Department of Food Engineering, Faculty of Chemical and Metallurgical Engineering) for viscosity measurements and her valuable comments.
Declaration of Competing Interest
The authors declare that they have no known competing financial interests or personal relationships that could have appeared to influence the work reported in this paper.
References
- Ultrasonic synthesis, molecular structure and mechanistic study of 1,3-dipolar cycloaddition reaction of 1-alkynylpyridinium-3-olate and acetylene derivatives. Molecules. 2016;21:848-861.
- [Google Scholar]
- Importance of heterocyclic chemistry: a review. Int. J. Pharm. Sci. Res.. 2012;3:2947-2954.
- [Google Scholar]
- Neomycin binding to Watson-Hoogsteen (W-H) DNA triplex groove: a model. J. Am. Chem. Soc.. 2003;125:3733-3744.
- [Google Scholar]
- Treatment of electronic excitations within the adiabatic approximation of time dependent density functional theory. Chem. Phys. Lett.. 1996;256:454-464.
- [Google Scholar]
- The structural diversity of phthalides from the Apiaceae. J. Nat. Prod.. 2007;70:891-900.
- [Google Scholar]
- A spectrophotometric investigation of the interaction of iodine with aromatic hydrocarbons. J. Am. Chem. Soc.. 1949;71:2703-2707.
- [Google Scholar]
- The ferric reducing ability of plasma (FRAP) as a measure of “Antioxidant Power”: The FRAP assay. Anal. Biochem.. 1996;239:70-76.
- [Google Scholar]
- Crystal structure and DNA binding properties of khellin oxime. J. Molec. Str.. 2019;1197:450-457.
- [Google Scholar]
- Biovia, D.S., 2016. Discovery studio visualizer, v17.2.0.16349, Dassault Systèmes, San Diego.
- Antioxidant determinations by the use of a stable free radical. Nature. 1958;181:1199-1200.
- [Google Scholar]
- Molecular excitation energies to high-lying bound states from time-dependent density-functional response theory: characterization and correction of the time-dependent local density approximation ionization threshold. J. Chem. Phys.. 1998;108:4439-4449.
- [Google Scholar]
- GaussView, Version 5. Shawnee Mission KS: Semichem Inc.; 2009.
- Action of phenolic derivates (acetoaminophen, salycilate and 5-aminosalycilate) as inhibitors of membrane lipid peroxidation and as peroxyl radical scavengers. Arch. Biochem. Biophys.. 1994;315:161-169.
- [Google Scholar]
- Quantitative characterization of the global electrophilicity power of common diene/dienophile pairs in Diels-Alder reactions. Tetrahedron. 2002;58:4417-4423.
- [Google Scholar]
- Global and local reactivity indices for electrophilic/nucleophilic free radicals. Org. Biomol. Chem.. 2013;11:4350-4358.
- [Google Scholar]
- Ligustilide attenuates pain behavior induced by acetic acid or formalin. J. Ethnopharmacol.. 2007;112:211-214.
- [Google Scholar]
- Pharmacological significance of synthetic heterocycles scaffold: a review. Adv. Biol. Res.. 2011;5:120-144.
- [Google Scholar]
- Stereoselective synthesis of 3-substituted phtalides via asymmetric transfer hydrogenation using well-defined ruthenium catalysts under neutral conditions. Tetr. Lett.. 2001;42:1899-1901.
- [Google Scholar]
- Encoding and decoding hydrogen-bond patterns of organic compounds. Acc. Chem. Res.. 1990;23:120-126.
- [Google Scholar]
- WinGX suite for small-molecule single-crystal crystallography. J. Appl. Cryst.. 1999;32:837-838.
- [Google Scholar]
- ORTEP-3 for Windows - a version of ORTEP-III with a Graphical User Interface (GUI) J. Appl. Cryst.. 1997;30 565–565
- [Google Scholar]
- Low barrier hydrogen bonds in sterically modified Schiff bases. J. Chem. Soc. Perkin Trans.. 2002;2:835-842.
- [Google Scholar]
- Structural and aromatic aspects of tautomeric equilibrium in hydroxy aryl Schiff bases. J. Phys. Org. Chem.. 2008;21:939-944.
- [Google Scholar]
- Exploring Chemistry with Electronic Structure Methods (second ed.). Pittsburg, PA: Gaussian Inc.; 1996.
- Gaussian 09. Wallingford CT: Gaussian Inc; 2010.
- Role of frontier molecular orbitals in chemical reactions. Science. 1982;218:747-754.
- [Google Scholar]
- Total synthesis of (–)-herbaric acid through organocatalyzed asymmetric halolactonization of acrylate-type benzoic acids. Synlett.. 2017;28:225-230.
- [Google Scholar]
- Quantum mechanical study of the structure, NBO and HOMO–LUMO analysis of molecule Ooxaliplatinium. J. Appl. Chem. Res.. 2014;8:25-33.
- [Google Scholar]
- Cyclo-(trp-phe) diketopiperazines from the endophytic fungus Aspergillus versicolor isolated from Piper aduncum. Quim. Nova. 2017;40:138-142.
- [Google Scholar]
- Pestacin: a 1,3-dihydro isobenzofuran from Pestalotiopsis microspora possessing antioxidant and antimycotic activities. Tetr.. 2003;59:2471-2476.
- [Google Scholar]
- Evaluation of antioxidant activity, phenolic, flavonoid and ascorbic acid contents of three edible plants from Erbil/Kurdistan. Tikrit J. Pure Sci.. 2013;18:46-51.
- [Google Scholar]
- A further exploration of a nucleophilicity index based on the gas-phase ionization potentials. J. Mol. Struct. Theochem.. 2008;865:68-72.
- [Google Scholar]
- Phthalides and phthalans: synthetic methodologies and their applications in the total synthesis. Chem. Rev.. 2014;114:6213-6284.
- [Google Scholar]
- Molecular structure, spectroscopic properties and quantum chemical calculations of 8-t-buthyl-4-methyl-2H-chromen-2-one. J. Mol. Struct.. 2016;1123:407-415.
- [Google Scholar]
- Selfconsistent molecular orbital methods. XX. A basis set for correlated wave functions. J. Chem. Phys.. 1980;72:650-654.
- [Google Scholar]
- Definition of aromaticity basing on the harmonic oscillator model. Tetr. Lett.. 1972;13:3839-3842.
- [Google Scholar]
- Crystallographic studies of inter- and intramolecular interactions reflected in aromatic character of.pi.-electron systems. J. Chem. Inf. Comput. Sci.. 1993;33:70-78.
- [Google Scholar]
- Lamberth C., Dinges J., eds. Bioactive heterocyclic compound classes: Pharmaceuticals. Weinheim, Germany: Wiley-VCH Verlag&Co; 2012.
- Phthalides: distribution in nature, chemical reactivity, synthesis, and biological activity. Prog. Chem. Org. Nat. Prod.. 2017;104:127-246.
- [Google Scholar]
- Structural considerations in the interaction of DNA and acridines. J. Mol. Biol.. 1961;3:18-30.
- [Google Scholar]
- dl-3n-butylphthalide prevents stroke via improvement of cerebralmicrovessels in RHRSP. J. Neurol. Sci.. 2007;260:106-113.
- [Google Scholar]
- Theoretical calculation of UV-Vis, IR spectra and reactivity properties of Tamoxifen drug: A methodology comparison. MOJ Biorg. Org. Chem.. 2017;1:87-96.
- [Google Scholar]
- Antiplatelet activity of 3-butyl-6-bromo-1(3H)-isobenzofuranoneon rat platelet aggregation. J. Thromb. Thrombolysis. 2012;33:64-73.
- [Google Scholar]
- Mercury: Visualization and analysis of crystal structures. J. Appl. Crystallogr.. 2006;39:453-457.
- [Google Scholar]
- Determination of the base composition of deoxyribonucleic acid from its thermal denaturation temperature. J. Molec. Biol.. 1962;5:109-118.
- [Google Scholar]
- In vitro binding interaction of atorvastatin with calf thymus DNA: multispectroscopic, gel electrophoresis and molecular docking studies. J. Pharm. Biomed. Anal.. 2018;161:101-109.
- [Google Scholar]
- AutoDock4 and AutoDockTools4: automated docking with selective receptor flexibility. J. Comput. Chem.. 2009;30:2785-2791.
- [Google Scholar]
- A novel cytosporone 3-Heptyl-4,6-dihydroxy-3H-isobenzofuran-1-one: synthesis; toxicological, apoptotic and immunomodulatory properties; and potentiation of mutagenic damage. BMC Cancer. 2015;15:1-15. Article Number: 561
- [Google Scholar]
- Regiospecific synthesis of isopestacin, a naturally occurring isobenzofuranone antioxidant. Tetr. Lett.. 2004;45:5109-5112.
- [Google Scholar]
- Efficient PhB(OH)2-catalyzed one-pot synthesis of 3-substituted isoindolin-1-ones and isobenzofuran-1(3H)-ones under solvent free conditions. Tetr.. 2018;74:4174-4181.
- [Google Scholar]
- Absolute hardness: companion parameter to absolute electronegativity. J. Am. Chem. Soc.. 1983;105:7512-7516.
- [Google Scholar]
- Density Functional Theory of Atoms and Molecules. Oxford, New York: Oxford University Press; 1989.
- Absolute electronegativity and hardness correlated with molecular orbital theory. Proc. Nati. Acad. Sci. USA. 1986;83:8440-8441.
- [Google Scholar]
- Absolute electronegativity and hardness: applications to organic chemistry. J. Org. Chem.. 1989;54:1423-1430.
- [Google Scholar]
- Experimental and theoretical study on solvent and substituent effects on the intramolecular charge transfer in 3-[(4-substituted)phenylamino] isobenzofuran-1(3H)-ones. J. Serb. Chem. Soc.. 2018;83:139-155.
- [Google Scholar]
- Fundamentals of Heterocyclic Chemistry: Importance in Nature and in the Synthesis of Pharmaceuticals. Hoboken, NewJersey: John Wiley & Sons Inc; 2010.
- Intermolecular interactions from a natural bond orbital, donor-acceptor viewpoint. Chem. Rev.. 1988;88:899-926.
- [Google Scholar]
- Density-functional theory for time-dependent systems. Phys. Rev. Lett.. 1984;52:997-1000.
- [Google Scholar]
- Synthesis and theoretical chemical calculations of 4-chloromethyl-6,8-dimethylcoumarin compound. BEU Journal of Science. 2018;7:311-319.
- [Google Scholar]
- Heavy metals chelating ability and antioxidant activity of Phragmites Australis stems extracts. J. Ecol. Eng.. 2019;20:116-123.
- [Google Scholar]
- Electronic molecular structure, reactivity and intermolecular forces: an euristic interpretation by means of electrostatic molecular potentials. Adv. Quant. Chem.. 1979;11:115-193.
- [Google Scholar]
- The effect of dimerization on the interaction of ibuprofen drug with calf thymus DNA: molecular modeling and spectroscopic investigation. Nucleosides, Nucleotides Nucl. Acids. 2018;37:147-168.
- [Google Scholar]
- SHELXS-97 and SHELXL-97, Program for the solution and refinement of crystal structures. Germany: University of Gottingen; 1997.
- Colorimetry of total phenolics with phosphomolybdic-phosphotungstic acid reagents. Amer. J. Enol. Viticult.. 1965;16:144-158.
- [Google Scholar]
- Structure and dynamics of thioguanine-modified duplex DNA. J. Biol. Chem.. 2003;278:1005-1011.
- [Google Scholar]
- Ab Initio calculation of vibrational absorption and circular dichroism spectra using density functional force fields. J. Phys. Chem.. 1994;98:11623-11627.
- [Google Scholar]
- Caspase-1 inhibitors from an extrennophilic fungus that target specific leukemia cell lines. J. Nat. Prod.. 2012;75:344-350.
- [Google Scholar]
- An efficient implementation of time-dependent density-functional theory for the calculation of excitation energies of large molecules. J. Chem. Phys.. 1998;109:8218-8224.
- [Google Scholar]
- Isopestacin, an isobenzofuranone from Pestalotiopsis microspora, possessing antifungal and antioxidant activities. Phytochem.. 2002;60:179-183.
- [Google Scholar]
- Elucidation of binding interactions and mechanism of Fludarabine with dsDNA via multispectroscopic and molecular docking studies. J. Pharm. Biomed. Anal.. 2020;179:112994
- [Google Scholar]
- Structural, spectroscopic, electronic and nonlinear optical investigations on cis-2,6-bis(2-chlorophenyl)-3,3-dimethylpiperidin-4-one. SAU Fen Bil. Der.. 2016;20:565-571.
- [Google Scholar]
- Teixeira, R.R., Bressan, G.C., Pereira, W.L., Ferreira, J.G., Oliveira F.M. Thomaz, D.C., 2013. Synthesis and antiproliferative activity of C-3 functionalized isobenzofuran-1(3H)-ones. Molecules 18, 1881–1896.
- AutoDock Vina: Improving the speed and accuracy of docking with a new scoring function, efficient optimization, and multithreading. J. Comput. Chem.. 2010;31:455-461.
- [Google Scholar]
- A novel 3-((5-methylpyridin-2-yl)amino)isobenzofuran-1(3H)-one: molecular structure describe, X-ray diffractions and DFT calculations, antioxidant activity, DNA binding and molecular docking studies. J. Molec. Str.. 2020;1205:127585
- [Google Scholar]
- Synthesis of chiral 3-substituted phthalides by a sequential organocatalytic enantioselective aldol-lactonization reaction. Three-step synthesis of (S)-(−)-3-Butylphthalide. J. Org. Chem.. 2010;75:368-374.
- [Google Scholar]
Appendix A
Supplementary material
Supplementary data to this article can be found online at https://doi.org/10.1016/j.arabjc.2020.03.013.
Appendix A
Supplementary material
The following are the Supplementary data to this article:Supplementary data 1
Supplementary data 1


