

Translate this page into:
Kinetic features of Gualou-Xiebai-Banxia decoction, a classical traditional Chinese medicine formula, in rat plasma and intestine content based on its metabolic profile
⁎Corresponding authors at: College of Pharmacy, Jinan University, Guangzhou 510632, PR China. tyaoxs@jnu.edu.cn (Xinsheng Yao), yaozhihong_jnu@163.com (Zhihong Yao)
-
Received: ,
Accepted: ,
This article was originally published by Elsevier and was migrated to Scientific Scholar after the change of Publisher.
Abstract
Abstract
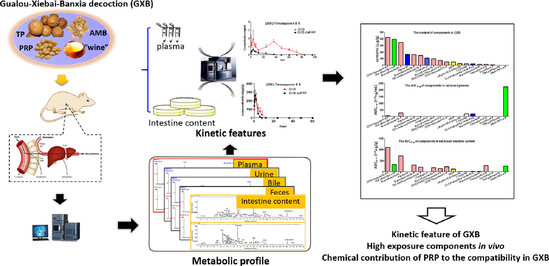
Gualou-Xiebai-Banxia decoction (GXB) is a famous classical traditional Chinese medicine (TCM) formula for the treatment of coronary heart disease (CHD, namely chest stuffiness and pain syndrome in Chinese medicine). Compared with Gualou-Xiebai-Baijiu decoction, which only consists of Trichosanthis Pericarpium (TP), Allii Macrostemonis Bulbus (AMB) and wine, GXB comprises one additional herbal medicine, Pinellinae Rhizoma Praeparatum (PRP). However, due to a lack of kinetic profile studies on GXB, its in vivo components with high exposure remain unknown, making it difficult to interpret bioactive components likely linked to its efficacy, but also fails to provide substance-related evidence for reflecting the compatibility in GXB. The goal of this study was to systematically characterize the kinetic features of GXB in rat plasma and intestine content for revealing its in vivo high-exposure components on the basis of their metabolic fates, and to compare the kinetic differences between GXB and GXB-dePRP (GXB deducted PRP) for describing the chemical contribution of PRP to the compatibility in GXB. Firstly, the metabolic profile of GXB was systematically investigated by UPLC-Q/TOF-MS. Subsequently, quantitative methods for representative xenobiotics in rat plasma and intestine content were respectively validated and developed by UPLC-TQ-MS. Then, the established approaches were successfully applied to characterize the kinetic features of GXB through estimating pharmacokinetic parameters. These results showed that only a few kinds of xenobiotics at low exposure levels were observed in plasma, while various xenobiotics possessed high exposure in intestine content. Among them, steroidal saponins and triterpenoid saponins displayed relatively high exposure in plasma and intestine content, which are likely associated with the therapeutic effects of GXB. Moreover, there were no significant differences between metabolic profiles of GXB and GXB-dePRP, whereas the pharmacokinetic parameters, including area under the concentration–time curve (AUC) and Cmax (p < 0.05) for most xenobiotics in GXB were significantly larger than those in GXB-dePRP, implying that the introduction of PRP improved the bioavailability of constituents from TP and AMB. Altogether, this study laid a solid foundation and provided theoretical guidance for further clarification of bioactive components of GXB, as well as the synergistic effect of PRP to the compatibility in GXB.
Keywords
Gualou-Xiebai-Banxia decoction
Metabolic profile
Kinetic feature
Compatibility
Bioactive components
Coronary heart disease

- AMB
-
Allii Macrostemonis Bulbus
- AUC
-
area under the concentration–time curve
- CHD
-
coronary heart disease
- Cmax
-
maximum plasma concentration
- GLXB
-
Gualou-Xiebai-Baijiu decoction
- GXB
-
Gualou-Xiebai-Banxia decoction
- GXB-dePRP
-
GXB deducted PRP
- MRM
-
Multiple Reaction Monitoring
- MRT0-∞
-
mean residence time
- PRP
-
Rhizoma Pinellinae Praeparatum
- TCM
-
Traditional Chinese medicine
- TP
-
Trichosanthis Pericarpium
- UPLC-TQ-MS
-
ultra-performance liquid chromatography triple quadrupole-mass spectrometry
Abbreviations
1 Introduction
Traditional Chinese Medicine (TCM) formulae have been used in East Asian countries for thousands of years, and have played a pivotal role in maintaining human healthcare. In recent years, with the global popularization of practices seeking natural and holistic means of disease treatments, the demand for TCM formulae around the world has steadily increased. Generally, TCM formulas can exert synergistic therapeutic efficacy through the compatibility of single herbs for the treatment of diverse chronic and complex diseases while greatly reducing side effects (Zhou et al., 2016, Xu et al., 2019). Despite their favorable efficacies, the “blackbox” impression formed by the complexity of the ingredients severely limits the disclosure of the bioactive components.
In particular, Gualou-Xiebai-Banxia decoction (GXB), a classical TCM formula recorded in Golden Chamber written by famous physician Zhang Zhongjing in Chinese Han dynasty, has been used to improve the syndrome of chest stuffiness and pains, namely coronary heart disease (CHD) in modern medicine. With thousands of years of practice experiences in medicinal use, GXB has been proved the identified bioactivities on expanding coronary artery, anti-inflammation, anti-oxidant, ischemia–reperfusion injury protection and ameliorating myocardial fibrosis based on various pharmacological studies (Zhang et al., 2011; Xun et al., 2014; Liu et al., 2016; Shi et al., 2016; Xue et al., 2018). It was included in the first batch of the Chinese ancient classical formulae directory in 2018 (https://kjs.satcm.gov.cn/zhengcewenjian/2018–04-16/7107.html.) due to its widespread clinical use and long medicinal history, which demonstrates proven therapeutic efficacy and good safety. Compared with Gualou-Xiebai-Baijiu decoction (GLXB), an analogous formula of GXB, which is also used to treat CHD and only consists of Trichosanthis Pericarpium (TP), Allii Macrostemonis Bulbus (AMB) and wine, GXB was added an additional herbal medicine, Pinellinae Rhizoma Praeparatum (PRP), and decreased the proportion of the other two (TP and AMB), making it more suitable for severe atherosclerosis and hyperlipidemia. Unfortunately, so far even the in vivo bioactive components of GXB have not yet been elucidated, let alone how the in vivo chemical contribution of PRP to the compatibility may cause the therapeutic characteristics of GXB different from GLXB.
In general, the absorbed components and related metabolites are considered to be the direct bioactive components, especially the high-exposure xenobiotics maintaining a certain concentration in the plasma for a certain period of time (Huang et al., 2021; Yin et al., 2022). In fact, many TCM formulae are taken orally in the form of decoctions with long-term medication to treat chronic diseases, and numerous studies have found that herbal components play therapeutic roles in the development and progression of CHD by regulating gut microbiota imbalance (Wang et al., 2017; Feng et al., 2019; Li et al., 2020). These findings indicated that xenobiotics observed in intestine content should not be ignored due to the possibility of indirect efficacy by alteration in the organismal and functional composition of the gut microbiome. Thus, the components mentioned above with in vivo high-exposure level are the mostly likely to be responsible for the therapeutic effect of GXB. The in vivo kinetic study is acknowledged to play an essential role in revealing the dynamic feature of TCM related components circulating in vivo and explaining their bioavailability, at the same time it can be also expected to interpret the compatibility of individual herbal medicine in TCM formula. (Xie et al., 2019; Zhao et al., 2019).
Previously, our group have performed several studies on deciphering the chemical profile of GXB, as well as its related formula and medicinal herb (Qin et al., 2016; Lin et al., 2018; Zhang et al., 2019; Lin et al., 2021), which laid a solid foundation for kinetic study of GXB. In this paper, the metabolic profile and proposed pathways after oral administration of GXB in rats were comprehensively investigated by UPLC-Q/TOF-MS. Subsequently, practical and sensitive UPLC-TQ-MS methods were validated and applied for simultaneous quantification of prototypes and metabolites in rat plasma and intestine content. Furthermore, the comparative analysis regarding metabolic profile and dynamic features of GXB and GXB-dePRP were investigated. In sum, this study accomplished the metabolic profile and kinetic characteristics of GXB, along with the contribution of PRP in vivo disposal. The results would provide an in vivo material basis for elucidating the bioactive components of GXB and better explain the compatibility of PRP with two other herbs in the perspective of pharmacokinetic behaviors.
2 Materials and methods
2.1 Chemical and reagents
Trichosanthis Pericarpium (TP), Allii Macrostemonis Bulbus (AMB) and Rhizoma Pinellinae Praeparatum (PRP) were purchased from Kangmei pharmaceutical Co., ltd. All the above had been authenticated by Associate Prof. Menghua Wu, a related expert in the National Engineering Research Center for Modernization of Traditional Chinses Medicine Lingnan Resources Branch, Guangzhou, China. Adenosine, l-tryptophan, luteolin-7-O-β-d-glucopyranoside, timosaponin B III, cucurbitacin B, (25R)-timosaponin A III, macrostemonoside A, macrostemonoside B and rutin were obtained from Chengdu Push Biotechnology Co., ltd. (-)-Loliolide was supplied by Shanghai Chengshao Biotechnology Co., ltd. 2,3,4,9-Tetrahydro-1H-pyrido[3,4-b]indole-3-carboxylic acid was purchased from Chengdu Chroma-Biotechnology Co., ltd. Other reference standards were isolated and identified in our laboratory. All the above standards possess a purity of 98 % by HPLC-UV-ELSD. LC-MS grade methanol, acetonitrile and water were purchased from Fisher Scientific (Fair Lawn, New Jersey, USA). LC-MS grade formic acid was obtained from Sigma Aldrich (St. Louis, USA).
2.2 Instrumentation and analytical conditions
The analytical condition for metabolic profile was according to the previous method (Lin et al., 2021). For pharmacokinetics study, the separation was performed on a HSS T3 column (2.1 mm × 100 mm, 1.8 µm) maintained at 35 °C using an AcquityTM UPLC I-Class system (Waters Corp., Milford, MA, USA), performing at a flow rate of 0.4 mL/min with the mobile phase consisted of water (A) and acetonitrile (B) (both including 0.1 % formic acid, v/v). The elution program was operated as follows: 0–2 min, 8–17 % B; 2–3 min, 17–25 % B; 3–5 min, 25–28 %; 5–6 min, 28–30 %; 6–7 min, 30–60 % B; 7–8 min, 60 %; 8–10 min, 60–100 %. An aliquot of 2 µL samples were injected into UPLC system. Triple quadrupole Xevo-mass spectrometer (TQ-XS, Waters Corp., Milford, MA, USA) was applied to quantify. The operating parameters were determined as follows: the ion source was operated in positive ion mode with the scan mass range at 100–2000 Da; 2 kV for capillary voltage; 150 °C for source temperature; 600 °C for desolvation temperature; 1000 L/h for desolvation gas flow; 150 L/h for cone gas flow. The optimized Multiple Reaction Monitoring (MRM) parameters and structures of quantitative analytes were listed in Table 1 and Fig. 1. All data acquisition and possessing were completed on the Masslynx 4.1 platform.
Analytes
tR (min)
Precursor ion (m/z)
Daughter ion (m/z)
Cone Voltage (V)
Collision energy (V)
Quantitative analytes
2,3,4,9-tetrahydro-1H-pyrido[3,4-b]indole-3-carboxylic acid
3.32
217.10
144.08
20
40
(-)-Loliolide
4.96
197.12
133.10
20
15
(25R)-timosaponin B II
5.80
903.50
255.21
50
40
Macrostemonoside B
6.02
1227.60
273.22
30
40
Glycyrrhetic acid
10.76
471.35
189.16
20
30
Luteolin-7-O-β-glucoside
5.43
449.11
287.06
30
20
Rutin
3.99
611.16
303.05
35
20
Macrostemonoside M
4.32
627.37
465.32
30
20
Macrostemonoside I
4.01
915.46
429.30
55
20
Macrostemonoside G
3.62
917.48
413.31
25
25
(25R)-12α-OH-timosaponin B II
4.12
919.49
397.31
30
30
(25R)-timosaponin A III
5.86
739.43
271.21
20
30
18 β-glycyrrhizic acid
7.80
823.41
453.34
20
25
Timosaponin B III
7.45
903.50
255.21
50
40
5(6)-ene-macrostemonoside B
5.88
1225.59
577.38
28
24
Semi-quantitative analytes
Pedatisectine D + CH2
1.88
213.12
135.09
20
15
Luteolin-3′-O-gluA-1
4.21
463.09
287.05
30
20
Apigenin-7-O-gluA
4.84
447.09
271.06
30
20
Luteolin-3′-O-gluA-2
5.09
463.09
287.05
30
20
Timosaponin B II-glc-2H
7.17
625.36
253.19
25
30
Macrostemonoside G-glc-H2O
7.70
755.42
431.32
15
25
25(27)-ene-elephanpside H-glc
7.89
591.35
429.30
10
15
25R-12-OH-timosaponin A III
7.92
757.44
253.19
15
25
Glycyrrhetic acid + gluA + OH
7.93
663.37
487.34
25
35
Glycyrrhetic acid + gluA + OH-2H
8.17
661.36
485.32
25
30
2α-OH-Macrostemonoside A
8.27
1081.54
433.33
30
30
Glycyrrhetic acid + gluA
9.00
647.38
471.35
20
30
Macrostemonoside G-2glc-gal-1
9.22
449.33
271.21
20
15
Macrostemonoside G-2glc-gal-2
9.41
449.33
271.21
20
15
Macrostemonoside G-2glc-gal-3
10.13
449.33
271.21
20
15
Capsicoside A2
10.64
579.39
255.21
20
30
Internal
standardsDexamethasone (IS)
7.77
393.21
355.19
25
10
Tolbutamide (IS)
8.13
271.11
91.00
20
25
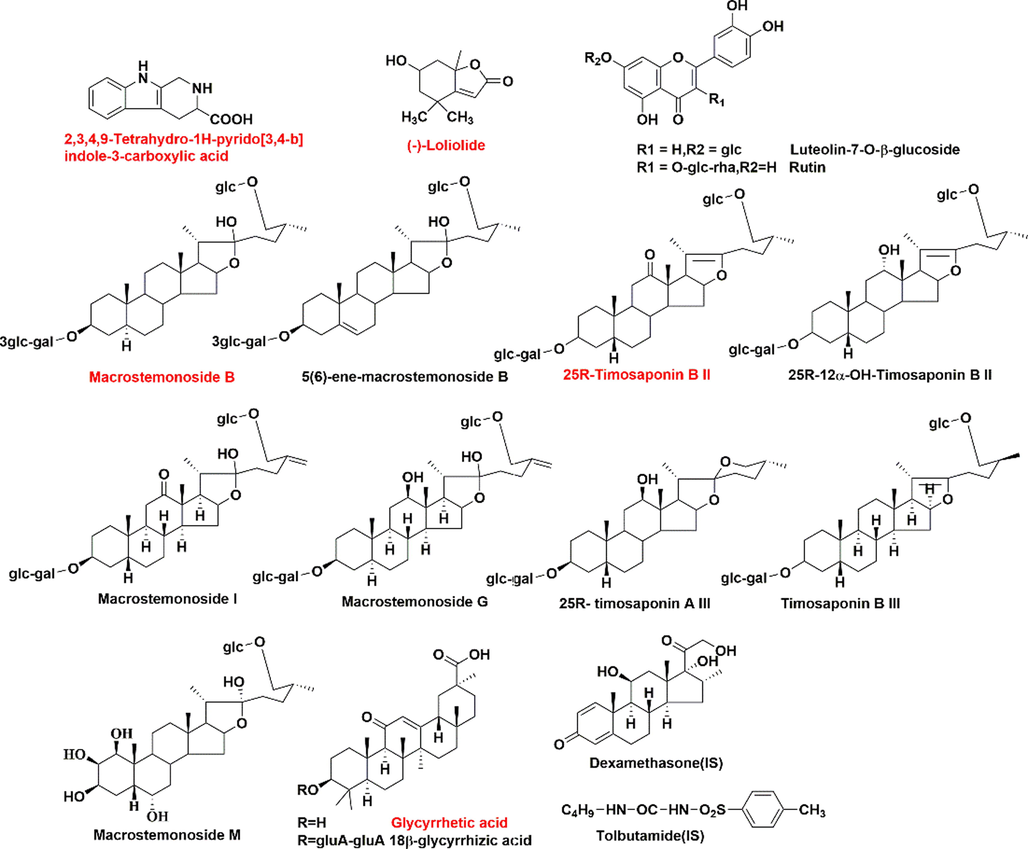
Structures of quantitative components and internal standards (Red color represent the components analyzed both in plasma and intestine content.)(For interpretation of the references to colour in this figure legend, the reader is referred to the web version of this article.).
2.3 Preparation of standard and quality control samples
For plasma: stock solution of 2,3,4,9-tetrahydro-1H-pyrido[3,4-b]indole-3-carboxylic acid, (-)-loliolide, (25R)-timosaponin B II, macrostemonoside B, glycyrrhetic acid and dexamethasone (IS) were prepared in methanol at the concentration of 7000, 180, 696, 47120, 15,862 and 160 ng/mL, respectively. Appropriate volumes of each stock solution were mixed together and serially diluted to obtain a series of working standard solutions. Calibration standards including nine concentrations for each analyte were prepared by spiking 50 μL working standard solutions into 100 μL blank plasma. Quality control (QC) samples for each component were prepared by adding 50 μL corresponding working standard solutions into blank plasma to obtain LLOQ, low, medium and high concentrations.
For intestine content: stock solution of 2,3,4,9-tetrahydro-1H-pyrido[3,4-b]indole-3-carboxylic acid, (-)-loliolide, (25R)-timosaponin B II, macrostemonoside B, glycyrrhetic acid, luteolin-7-O-β-glucoside, rutin, macrostemonoside M, macrostemonoside I, macrostemonoside G, (25R)-12α-OH-timosaponin B II, (25R)-timosaponin A III, 18 β-glycyrrhizic acid, timosaponin B III, 5(6)-ene-macrostemonoside B and tolbutamide (IS) were prepared in methanol at the concentration of 10, 72, 3160, 4360, 350.9, 218, 250, 535, 2920, 2310, 3880, 2540, 3200, 1760, 2180 and 320 μg/mL, respectively. Appropriate amounts of each stock solution were mixed together and serially diluted to obtain a series of working standard solutions. Calibration standards including nine concentrations for each analyte were prepared by spiking 20 μL working standard solutions into blank intestine content. Quality control (QC) samples for each component were prepared by adding 20 μL corresponding working standard solutions into blank intestine content to obtain LLOQ, low, medium and high concentrations.
2.4 Preparation of GXB and GXB-dePRP decoction
The preparation methods of GXB and GXB-dePRP (GXB deducted PRP) decoction were similar with our previous study (Lin et al., 2021). In brief, the three consisting herbal medicines were extracted with 60 % ethanol–water (v/v) at a ratio of 1:1:1. The, the extractions were evaporated and freeze-dried to powder, and the yield of GXB powder was about 30 % by calculation. Similarly, GXB-dePRP was performed as abovementioned approach without PRP at a ratio of 1:1 with a yield of 50 %.
2.5 Sample preparation
2.5.1 For metabolic profile
In vivo assay: The preparation method of plasma, urine, bile acid and feces sample were according to the previous reports with a minor modification (Lin et al., 2018). The intestine content freeze-dried powder collected from different time points were extracted with appropriate amount of methanol, vortexed and ultrasonicated for 30 min at low temperature. The mixture was centrifuged for 10 min at 14,000 rpm (4 °C) to obtain supernatant. Next, transferred it into a new 1.5 mL Eppendorf tube and evaporated to dryness under the stream of nitrogen. The residue was re-dissolved in 200 μL methanol. Then vortexed and centrifuged (14,000 rpm, 15 min). The supernatants were injected into the UPLC-Q/TOF-MS system for the following analysis.
In vitro phase I metabolism assay: as previously published with a minor adjustment (Xu et al., 2018), the test compounds were respectively mixed into phase I incubation system (200 μL), which contained 50 mM Tris-HCl buffer solution (pH = 7.4), 0.5 mg/ml of rat liver microsomes (RLM) or rat intestinal microsomes (RIM), 5 mM MgCl2. After 5 min pre-incubation (37 °C), 1 mM of NAPDH solution was added and mixed. After 1 h incubation at 37 °C, the reaction was terminated by 200 μL cold acetonitrile. Then centrifuging at 13000 rpm for 15 min, the supernatant was subjected into UPLC-Q/TOF-MS system.
In vitro glucuronidation assay: as previously described (Xu et al., 2018), the incubation system contained 50 mM Tris-HCl buffer (pH = 7.4), 0.5 mg/ml of RLM or RIM, 0.88 mM MgCl2, 22 μg/mL alamethicin, 4.4 mM saccharolactone, 3.5 mM UDPGA and test compounds. After 1 h incubation (37 °C), 200 μL cold acetonitrile was added into incubation mixture to terminate the reaction by centrifugation at 13000 rpm for 15 min, and the supernatant were subjected into UPLC-Q/TOF-MS system.
2.5.2 For quantitative study
Plasma: A 100 μL aliquot of plasma sample were mixed with 10 μL of dexamethasone (IS) solution and 300 μL methanol–acetonitrile at a ratio of 1:1 (v/v). The mixture was centrifuged for 10 min at 14,000 rpm (4 °C) to obtain supernatant. Next, transferred it into a new 1.5 mL Eppendorf tube and evaporated to dryness under the soft stream of nitrogen. The residue was reconstituted with 100 μL of methanol. Then, vortexed and centrifuged at 14,000 rpm for 15 min. The supernatants were injected into the UPLC-TQ-XS system for further analysis.
Intestine content: approximately 2 mg intestine content freeze-dried powder were accurately weighted, dissolved with 500 μL methanol and 10 μL of tolbutamide (IS), vortexed and ultrasonicated for 30 min at low temperature. The mixture was centrifuged for 10 min at 14,000 rpm (4 °C) to obtain supernatant. Next, transferred it into a new 1.5 mL Eppendorf tube and evaporated to dryness under the stream of nitrogen. The residue was re-dissolved in 200 μL of methanol containing 0.01 % formic acid (v/v). Then vortexed and centrifuged (14,000 rpm, 15 min). The supernatants were injected into the UPLC-TQ-XS system for further analysis.
2.6 Animals
The male Sprague-Dawley rats were purchased from Beijing Vital River Laboratory Animal Technology Co., ltd. All procedures of animal experiments were according to the protocol which was approved by the Guide for the Care and Use of Laboratory Animals of Jinan University. All animals were fed a standard diet and water ad libitum. They were housed in an animal room with constant temperature (23 ± 2) °C, humidity (60 ± 5) % and a 12 h dark/light cycle for a week before experiment.
2.6.1 Metabolic profile study
Thirty rats were fasted with free access to water in metabolic cages separately over night before experiment. There were divided into three groups: 10 rats were orally administered with GXB at the dose of 20.0 g/kg/day for one week; 10 rats were orally administered with GXB-dePRP at the dose of 13.2 g/kg/day for one week; 3 rats as control group were received an equivalent volume of distilled water for consecutive 7 days. The urine and feces samples for each group were collected separately during 0–12 h, 12–24 h, 24–36 h and 36–48 h on the last two days of intragastric administration. Blank urine and feces samples were collected before drug administration. After the last oral administration, the rats in each group were anesthetized by intraperitoneal injection of 10 % pentobarbital sodium. The blood samples were obtained from hepatic portal vein in heparinized tube at 0.25, 0.5, 1, 2, 4, 6 and 8 h with 7 rats. Blank plasma samples were collected in the same way. The rats (n = 3) in each group were implanted with a PE-0503 cannula into the bile duct after an abdominal incision anaesthetized with 10 % pentobarbital sodium. During the experiment, a heating lamp was used to maintain their body temperature. Bile samples were collected and recorded during 0–4 h, 4–8 h and 8–12 h. Blank bile samples were obtained in the same way.
2.6.2 Pharmacokinetic study
Plasma: twelve rats were fasted with free access to water in metabolic cages separately over night before experiment. Then the rats were divided into two groups (n = 6) and orally administered with GXB and GXB-dePRP extract as prepared at the dose of 20.0 and 13.2 g/kg for a week, respectively. Blood samples were collected from external jugular veins into heparinized eppendorf tubes at 0.25, 0.5, 1, 2, 4, 6, 8, 12, 24, 36, 48, 60, 72, 84, 96 h after last administration, and immediately centrifuged at 14,000 rpm for 15 min. The supernatant plasma samples were transferred and stored at −80 °C until analysis. WinNonlin 6.3 software was employed to calculate the pharmacokinetic parameters of analytes.
Intestine content: After one week acclimation, they were separated into two groups and orally administrated GXB and GXB-dePRP extract as prepared at the dose of 20.0 and 13.2 g/kg for a week, respectively. After last intragastric administration, immediately anaesthetization, the rats were dissected at 0.25, 0.5, 1, 2, 4, 6, 8, 12, 24, 36, 48, 60 h (n = 5 for each time-point) and carefully removed small intestine after tying the ends with tweezers. The small intestine was washed with saline solution, and dried with filter paper. Then the small intestine contents were slowly and evenly flushed by distilled water, and freeze-dried to obtain intestine content freeze-dried powder. All the samples were stored at −80 °C until further analysis. WinNonlin 6.3 software was employed to calculate the pharmacokinetic parameters of analytes.
3 Results and discussion
3.1 Metabolic profile
3.1.1 Metabolic profile of GXB
Since the metabolic profile of GLXB, a GXB-associated formula, had been systematically characterized previously in our laboratory (Lin et al., 2018). Herein, the metabolic profile of GXB was described simply to avoid repetition.
Firstly, on the basis of chemical profile of GXB (Lin et al., 2021), a total of 103 prototypes were observed in dosed rat biological samples by comparing with retention times, accurate molecular ions and fragment ions, and there were respectively 8, 60, 19, 49 and 85 prototypes detected in plasma, urine, bile acid, feces and intestine content by UPLC-Q/TOF-MS. The specific mass spectrometry data of prototypes characterized in rat bio-samples were depicted in Fig. S1 and Table S1.
In addition, the strategy of “representative structure based homologous xenobiotics identification-RSBHXI” proposed in our laboratory previously (Geng et al., 2014) was applied to characterize the metabolites after oral administration of GXB. Considering that the metabolic behaviors of steroidal saponins from AMB and flavonoids from TP had been investigated comprehensively (Qin et al., 2016; Lin et al., 2018), other representative structures were further selected to develop their metabolic fates in vivo and in vitro serving as supplements. Among them, cucurbitacin B is a tetracyclic triterpenoid that was a representative structure original from TP, and a metabolic profile was developed in rat liver microsomes and intestine microsomes as well as rats after intragastric administration. The proposed metabolic pathway of cucurbitacin B was summarized in Fig. 2, and hydroxylation, dehydrogenation, hydrogenation, and glucuronidation were the major transformation reaction. Similarly, liquirtigenin and glycyrrhizic acid were two representative structure components derived from PRP, and their metabolic behaviors were shown in Figs. 3-4.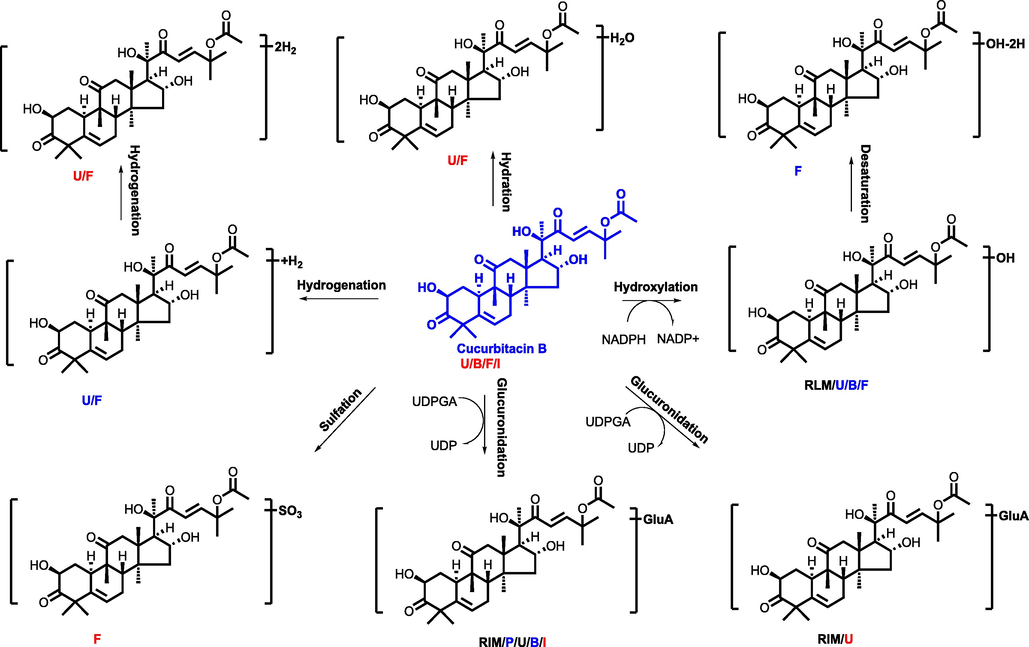
The proposed metabolic pathway of cucurbitacin B (P, U, B, F, I, meant metabolites detected in plasma, urine, bile, feces, intestine content, respectively. RLM, RIM meant that cucurbitacin B were incubated in the system of rat liver microsome enzyme and rat intestinal microsome enzyme, respectively; red, blue and black mark meant metabolites detected in different biosamples after dosing GXB extract, single compounds, and both two groups, respectively.) (For interpretation of the references to colour in this figure legend, the reader is referred to the web version of this article.).
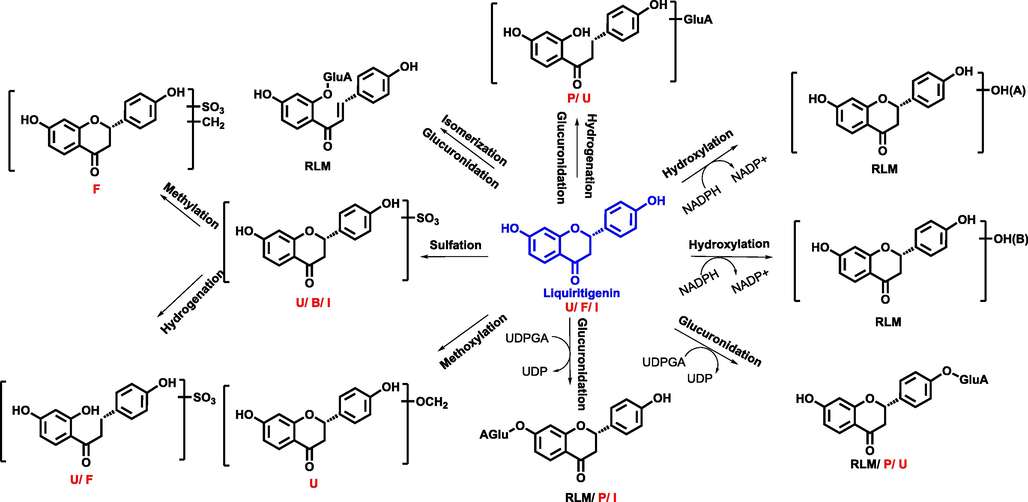
The proposed metabolic pathway of liquirtigenin (P, U, B, F, I, meant metabolites detected in plasma, urine, bile, feces, intestine content, respectively. RLM, RIM meant that liquirtigenin were incubated in the system of rat liver microsome enzyme and rat intestinal microsome enzyme, respectively; red, blue and black mark meant metabolites detected in different biosamples after dosing GXB extract, single compounds, and both two groups, respectively.) (For interpretation of the references to colour in this figure legend, the reader is referred to the web version of this article.).
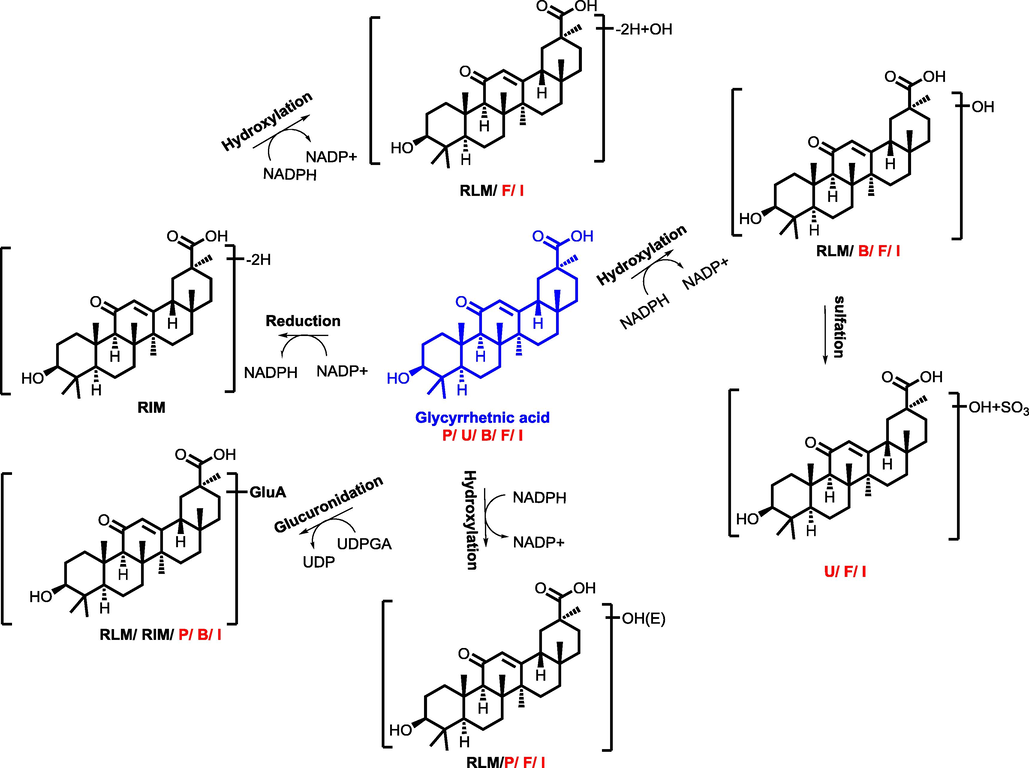
The proposed metabolic pathway of glycyrrhizic acid (P, U, B, F, I, meant metabolites detected in plasma, urine, bile, feces, intestine content, respectively. RLM, RIM meant that glycyrrhizic acid were incubated in the system of rat liver microsome enzyme and rat intestinal microsome enzyme, respectively; red, blue and black mark meant metabolites detected in different biosamples after dosing GXB extract, single compounds, and both two groups, respectively.) (For interpretation of the references to colour in this figure legend, the reader is referred to the web version of this article.).
Subsequently, by comparing the retention times, fragment behaviors, accurate molecular weights with that of single components in vivo and in vitro experiments, a total of 118 GXB-related metabolites were tentatively identified. Specifically, there were 12, 25, 25, 63 and 59 observed in dosed plasma, urine, bile acid, feces and intestine content, respectively (Table S2). The structure types of metabolites detected in intestine content were almost similar with those in feces samples, indicating that small intestine also plays an indispensable role in vivo disposal.
3.1.2 Comparison of metabolic profile
After clarified the metabolic profile of GXB, we further characterized the metabolic properties in complex system after oral administration of GXB-dePRP, so as to make a comparison with that of GXB for describing the contribution of PRP on the metabolism of this formula. The prototypes and metabolites identified in GXB-dePRP containing biological samples were also displayed in Fig. S1 and Table S1-S2. Due to the existing of PRP, the prototypes and metabolites related to flavonoids and triterpenoids saponins from PRP were naturally appeared in dosed GXB bio-samples, but not presented in GXB-dePRP dosed bio-samples. However, the xenobiotics derived from TP and AMB did not displayed obvious difference between GXB and GXB-dePRP groups, which inferred that PRP could not significantly influence the metabolite pathway of TP and AMB in GXB.
3.2 Method validation of quantification method
Specificity of the quantification method in plasma was to make sure no endogenous interferences. The representative chromatograms of blank plasma, blank plasma spiked with five standard solutions at LLOQ concentrations and IS, and plasma samples obtained 2 h following administration of GXB were displayed in Fig. S2. As result, there were no interference peaks were detected at the retention time of five analytes and IS.
The calibration curves for five analytes in plasma were respectively constructed by plotting peak-area ratios (y) to IS versus concentrations (x) of the analyte, using least-squares linear regression (1/x2 weight). The linear regression, ranges and coefficient (r) were displayed in Table S3. Lower limit of quantification (LLOQ) was determined as the lowest concentration on the calibration curve at a signal-to-noise (S/N) ratio of 10 with an acceptable accuracy (-9.0 < RE < 12.9 %) and precision (RSD ≤ 17.2 %) (Table S4). As shown in Fig. S3, there is no residual interference for quantifying these five analytes in rat plasma.
The intra- and inter-day precision and accuracy of individual components were estimated by analyzing 6 replicate QC samples at four concentration levels (LLOQ, low, medium and high) on one day and on consecutive days with daily calibration curves, respectively. As shown in Table S5, the intra-and inter-day precision were expressed as RSD, and ranged from 7.1 % to 14.9 %, 2.7 % to 16.2 %, respectively. For accuracy was evaluated as RE and no more than 15.8 %. All the above results suggested that the developed method was reproducible and accurate for quantification of five components in rat plasma.
The matrix effect and extraction recovery were evaluated with 6 replicates of QC samples at three concentrations levels (low, medium and high). The matrix effect was determined by comparing the peak area of QC samples with the corresponding standard solutions. The extract recovery was investigated by calculating the peak area ratio of QC samples with components and IS spiked before and after extraction. The matrix effect of five analytes and IS were ranged from 85.2 % to 112.3 %. The mean extraction recoveries of five analytes and IS were between 71.8 % and 98.3 %, except for glycyrrhetic acid with low extraction recovery ranged from 23.5 % to 51.5 % at three concentrations (Table S6).
The QC samples at three concentrations (low, medium and high) subjected to different storage condition were analyzed to observe the stability of quantitative components, including room temperature (25 °C) for 12 h, −80 °C for a month and three freeze–thaw cycle. The results of stability for five analytes in three different conditions were depicted in Table S7, which indicated that the quantitative components in plasma remained stable during the short-term, long-term and three freeze–thaw cycles experiments.
Similarly, full method validation in terms of specificity, linearity, accuracy, precision, matrix effect, extraction recovery and stability in rat intestine content samples were also preformed, and the detail data were summarized in Fig. S4-S5 and Table S8-S12. These acceptable results demonstrated that 15 analytes in rat intestine content could be simultaneously determined by the established method.
3.3 Pharmacokinetic study
3.3.1 Plasma
According to the result of metabolic profile of GXB, five major components were selected for quantification and pharmacokinetic study to explore their kinetic features and exposure characteristics in plasma. Among of them, nitrogenous of 2,3,4,9-tetrahydro-1H-pyrido[3,4-b]indole-3-carboxylic acid, steroidal saponins of (25R)-timosaponin B II and macrostemonoside B were derived from AMB; other types of (-)-loliolide were originated from TP; and tritepenoid saponins of glycyrrhetic acid from PRP. As shown in Fig. 5 and Table 2, almost all the major prototypes exhibited a lower maximum plasma concentration (Cmax) at 14.08 ± 0.52, 2.45 ± 0.13, 9.73 ± 0.50, 8.09 ± 0.46, 53.65 ± 3.40 ng/mL for 2,3,4,9-tetrahydro-1H-pyrido[3,4-b]indole-3-carboxylic acid, (25R)-timosaponin B II, macrostemonoside B, (-)-loliolide and glycyrrhetic acid, respectively. The time to reach the maximum concentration (Tmax) of 2,3,4,9-tetrahydro-1H-pyrido[3,4-b]indole-3-carboxylic acid, (25R)-timosaponin B II, macrostemonoside B were reached quickly than other two absorbed components, whereas almost all these five analytes displayed a long half-time with higher T1/2 values. The value of area under the concentration–time curve (AUC) could reflect the overall exposure of absorbed constituents in vivo. Glycyrrhetic acid showed the maximum AUC value, followed by macrostemonoside B, 2,3,4,9-tetrahydro-1H-pyrido[3,4-b]indole-3-carboxylic acid, (-)-loliolide and (25R)-timosaponin B II, with values of 2232.93 ± 104.29, 280.31 ± 8.29, 198.21 ± 4.20, 188.00 ± 5.53, 88.50 ± 3.55 h • ng/mL, respectively. Considering the ignorable abundance in GXB extract, the high exposure of glycyrrhetic acid in plasma was mainly attributed to de-glucuronization of 18 β-glycyrrhizic acid in vivo, which exhibited a higher content in this formula and that might be highly associated with the microbiota or intestine metabolism. Note:* p < 0.05; ** p < 0.01; *** p < 0.001.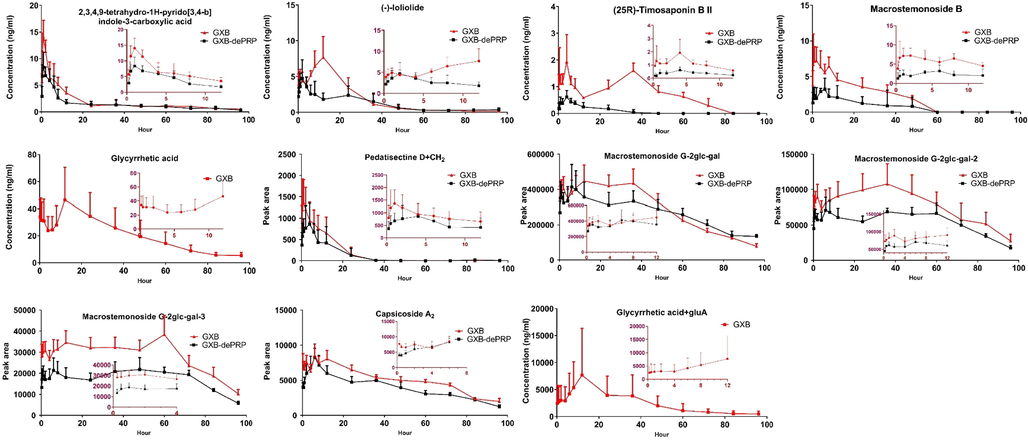
Mean plasma concentration–time profile of 5 components and peak area-time profiles of 6 semi-quantitative components after oral administration of GXB and GXB-dePRP (mean ± SD, n = 6).
Analytes
Group
Tmax (h)
T1/2 (h)
Cmax (ng/mL)
AUC0-t (h•ng/ml)
AUC0-∞ (h•ng/ml)
MRT0-∞ (h)
2,3,4,9-tetrahydro-1H-pyrido
[3,4-b]indole-3-carboxylic acidGXB
1.50 ± 0.20
22.84 ± 1.38
14.08 ± 0.52
179.55 ± 2.54
198.21 ± 4.20
36.02 ± 1.01
GXB-dePRP
2.25 ± 0.37**
25.24 ± 2.81
8.84 ± 0.41***
136.57 ± 2.37***
151.68 ± 4.55***
40.04 ± 2.62**
(-)-Loliolide
GXB
9.50 ± 0.74
20.98 ± 1.94
8.09 ± 0.46
182.43 ± 5.21
188.00 ± 5.53
22.62 ± 0.95
GXB-dePRP
7.00 ± 1.44**
56.57 ± 13.35***
5.66 ± 0.31***
111.85 ± 5.94***
143.64 ± 7.26***
75.13 ± 16.09***
(25R)-timosaponin B II
GXB
4.42 ± 1.04
29.98 ± 2.84
2.45 ± 0.13
66.50 ± 0.68
88.50 ± 3.55
52.23 ± 3.15
GXB-dePRP
4.67 ± 1.15
17.55 ± 6.00**
0.71 ± 0.14***
6.85 ± 2.29***
12.94 ± 4.95***
26.37 ± 9.61***
Macrostemonoside B
GXB
3.25 ± 0.46
33.65 ± 3.66
9.73 ± 0.50
187.15 ± 5.61
280.31 ± 8.29
47.56 ± 4.31
GXB-dePRP
4.00 ± 0.01**
33.94 ± 6.41
3.70 ± 1.41***
46.54 ± 6.78***
152.78 ± 16.54***
51.08 ± 9.40
Glycyrrhetic acid
GXB
24.00 ± 2.53
32.93 ± 3.59
53.65 ± 3.40
1973.86 ± 101.83
2232.93 ± 104.29
47.22 ± 2.37
Pedatisectine D + CH2
GXB
3.54 ± 0.78
5.44 ± 0.59
1647 ± 90
15912 ± 774
15246 ± 801
7.88 ± 0.26
GXB-dePRP
4.83 ± 0.65*
12.28 ± 3.55***
1170 ± 54***
11556 ± 639***
11970 ± 558***
18.12 ± 2.51***
Macrostemonoside G-2glc-gal
GXB
16.04 ± 2.05
29.51 ± 4.06
4184100 ± 451800
144900000 ± 14885100
163517400 ± 16203600
40.39 ± 3.41
GXB-dePRP
27.08 ± 4.07***
61.81 ± 6.37***
498600 ± 45900***
25645500 ± 1767600***
36724500 ± 1488600***
93.71 ± 8.18***
Macrostemonoside G-2glc-gal-2
GXB
34.00 ± 2.42
30.23 ± 5.38
148500 ± 10800
7567200 ± 522900
9246600 ± 901800
59.20 ± 4.91
GXB-dePRP
27.08 ± 4.07***
23.58 ± 3.17***
105300 ± 4500***
5285700 ± 196200***
5997600 ± 207000***
55.30 ± 2.81
Macrostemonoside G-2glc-gal-3
GXB
38.04 ± 4.45
22.51 ± 1.38
44100 ± 3600
2745900 ± 159300
3096000 ± 184500
52.83 ± 2.58
GXB-dePRP
36.08 ± 4.17
22.66 ± 4.35
28800 ± 1800***
1699200 ± 108000***
1931400 ± 99000***
60.73 ± 12.74
Capsicoside A2
GXB
7.04 ± 0.74
32.22 ± 4.22
9342 ± 603
489600 ± 16200
612900 ± 27900
39.07 ± 5.44
GXB-dePRP
7.00 ± 0.46
27.59 ± 1.91*
9000 ± 621
384300 ± 45000***
440100 ± 27000***
37.95 ± 3.40
Glycyrrhetic acid + gluA
GXB
24.00 ± 2.53
39.96 ± 10.20
9900 ± 900
248400 ± 27900
311400 ± 35100
61.05 ± 12.27
Since few prototypes were observed with available sensitivity, several metabolites transformed by prototypes could be detected according to the results of metabolic profile orally administration of GXB (Table S2), and the dynamic changes of metabolites together with those of prototypes were helpful to depict the whole dynamic feature in vivo of GXB (Table 1). Therefore, a total of six metabolites detected in dosed plasma were selected to monitor their in vivo dynamic process, including one metabolite of nitrogenous (pedatisectine D + CH2), four metabolites of steroidal saponins (macrostemonoside G-2glc-gal, macrostemonoside G-2glc-gal-2, macrostemonoside G-2glc-gal-3, capsicoside A2) and one metabolite of tritepenoid saponins (glycyrrhetic acid + gluA). Due to the lack of available reference standards, the semi-quantitative method obtained peak area values of these six metabolites at different time points to characterize in vivo dynamic profiles, and was consistent with the following published literature (Qin et al., 2016). The results of mean plasma peak area-time profiles of above metabolites were displayed in Fig. 5 and pharmacokinetic parameters calculated by peak area were illustrated in Table 2. Compared with those of corresponding prototypes, the Tmax values were obviously longer for most metabolites in this experiment, and the mean residence time (MRT0-∞) values were also slightly prolong. As depicted in Fig. 5, especially for four metabolites of steroidal saponins, they were maintained a relatively stable concentration for a long time in rat plasma, which might be attributed to the continuous transformation of these components abundant in GXB formula, suggesting that these metabolites could play an important role in the improvement of CHD syndrome.
3.3.2 Intestine content
For the reason that small intestine possessing relative larger surface area, which is the important place of in vivo disposal, and the majority of prototypes and metabolites after administration of GXB were also observed in rat small intestine content. Thus, the major prototypes and metabolites in intestine content were further analyze to characterize their kinetic feature in vivo. Consequently, a total of 15 prototypes (Fig. 1) were chosen to determine their concentration–time changes, and 5 analytes presented in plasma were also included. As depicted in Fig. 6 and Table 3, nine steroidal saponins from AMB were quickly reached the maximum concentration in intestine content with the values of Tmax<2 h. Their value of Cmax could reached the level of μg/g, and which were significant higher by comparing with the content levels of two shared steroidal saponins ((25R)-timosaponin B II and macrostemonoside B) in plasma. The values of MRT0-∞ for these components were<8 h, which indicated that most of steroidal saponins could be quickly metabolized and/or discharged into the next intestinal tract. Whereas these components showed a higher exposure in intestine content, which might be responsible for the high abundance in GXB extract, especially for (25 R)-timosaponin B II and macrostemonoside B. Luteolin-7-O-β-glucoside and rutin were two flavonoids derived from TP, of which reached the maximum concentration within 2 h. Since the higher abundance of rutin in GXB extract, rutin displayed a higher Cmax value than that of luteolin-7-O-β-glucoside. Similarly, these two flavonoids also exhibited a short residual time in small intestine tract. 2,3,4,9-tetrahydro-1H-pyrido[3,4-b]indole-3-carboxylic acid not only rapidly reach to the Cmax within half an hour, but also quickly eliminate in intestine content. (-)-loliolide is originated from TP, compared with that of pharmacokinetic parameters in plasma, it could more quickly reach to the Cmax, while other parameters did not exhibit significantly difference in rat plasma and intestine content. Glycyrrhetic acid and 18 β-glycyrrhizic acid are two common triterpenoid saponins derived from PRP, and bimodal phenomena were apparently observed in the dynamic changes of intestine contents, which were attributed to the hepatic and intestinal circulation or biotransformation between aglycone and glycoside. Relative to the abovementioned analytes, the Tmax of these two constituents were prolonged more than 7 h. Interestingly, the abundance of glycyrrhetic acid in GXB extract were much lower than 18 β-glycyrrhizic acid (Lin et al., 2021), but the exposure level in intestine content were almost presented at the same level, which might be caused by the quickly biotransformation from 18 β-glycyrrhizic acid or other analogues. Note: N.A. means not acquired. * p < 0.05; ** p < 0.01; *** p < 0.001.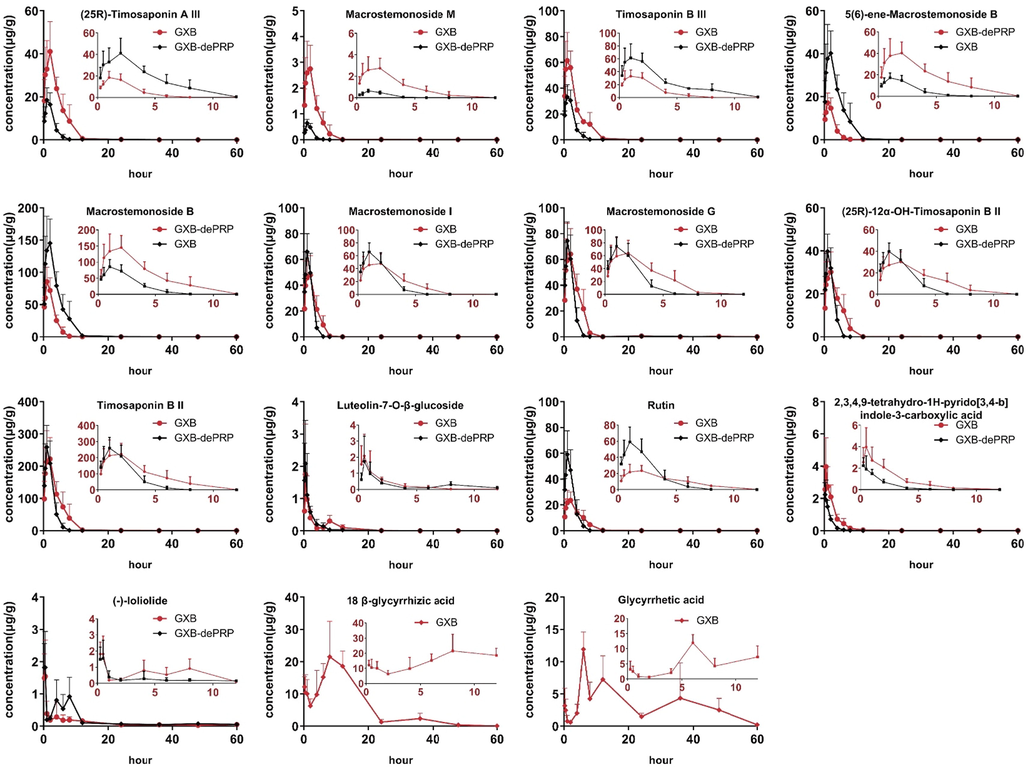
Concentration-time curves of 15 components in intestine content after oral administration of GXB and GXB-dePRP in rats (mean ± SD, n = 5).
Analytes
Group
Tmax (h)
T1/2 (h)
Cmax (μg/g)
AUC0-t (h•μg/g)
AUC0-∞(h•μg/g)
MRT0-∞ (h)
2,3,4,9-tetrahydro-1H-pyrido[3,4-b]
indole-3-carboxylic acidGXB
0.55 ± 0.27
4.34 ± 1.17
4.84 ± 0.65
10.61 ± 1.60
11.16 ± 1.59
5.69 ± 3.91
GXB-dePRP
0.50 ± 0.31
5.83 ± 1.32
2.64 ± 0.85**
4.14 ± 1.12***
4.43 ± 1.13***
6.33 ± 3.90
(-)-loliolide
GXB
0.35 ± 0.14
20.22 ± 4.10
2.15 ± 0.84
6.00 ± 1.75
7.49 ± 2.06
29.57 ± 4.43
GXB-dePRP
0.40 ± 0.14
18.42 ± 8.16
2.14 ± 0.92
10.59 ± 3.34*
12.07 ± 2.68*
26.26 ± 16.84
(25R)-Timosaponin B II
GXB
1.00 ± 0.61
6.75 ± 5.29
262.46 ± 65.72
1099.45 ± 384.19
1099.99 ± 384.46
3.58 ± 0.38
GXB-dePRP
1.10 ± 0.55
4.50 ± 0.51
296.91 ± 20.12
748.04 ± 137.79
748.32 ± 137.67
2.05 ± 0.18***
Macrostemonoside B
GXB
1.30 ± 0.67
22.71 ± 5.38
161.98 ± 39.34
718.06 ± 187.14
724.74 ± 193.39
4.59 ± 1.15
GXB-dePRP
1.10 ± 0.55
5.09 ± 3.31***
95.68 ± 2.77**
274.01 ± 52.75***
297.31 ± 44.85***
2.74 ± 0.28**
Luteolin-7-O-β-glucoside
GXB
0.65 ± 0.34
7.17 ± 1.06
2.21 ± 1.09
5.22 ± 1.90
5.32 ± 1.88
8.88 ± 2.78
GXB-dePRP
0.40 ± 0.14
10.62 ± 5.50
2.44 ± 1.06
4.14 ± 1.67
4.30 ± 1.53
11.91 ± 2.78
Rutin
GXB
1.30 ± 0.67
3.22 ± 2.61
26.41 ± 6.91
124.15 ± 25.54
124.20 ± 25.53
3.80 ± 0.40
GXB-dePRP
1.10 ± 0.55
3.49 ± 3.65
67.44 ± 7.05***
173.96 ± 30.00*
174.30 ± 29.90*
4.28 ± 0.15
Macrostemonoside M
GXB
1.60 ± 0.55
4.14 ± 2.98
3.21 ± 0.96
11.82 ± 4.21
11.95 ± 4.37
4.46 ± 1.82
GXB-dePRP
1.10 ± 0.55
3.32 ± 10.25
0.69 ± 0.07***
1.67 ± 0.27***
1.85 ± 0.28***
3.74 ± 0.28
Macrostemonoside I
GXB
1.30 ± 0.67
4.59 ± 1.34
56.84 ± 15.05
191.36 ± 56.62
191.48 ± 56.62
6.78 ± 0.38
GXB-dePRP
1.10 ± 0.55
2.84 ± 0.73
73.78 ± 5.92*
165.86 ± 29.31
166.08 ± 29.26
4.86 ± 0.23**
Macrostemonoside G
GXB
1.30 ± 0.67
10.08 ± 4.36
75.26 ± 20.48
303.98 ± 71.95
309.40 ± 71.88
4.99 ± 1.34
GXB-dePRP
1.10 ± 0.55
9.19 ± 4.77
84.25 ± 5.80
214.56 ± 34.79*
217.02 ± 35.28*
3.56 ± 0.50
(25R)-12α-OH-timosaponin B II
GXB
1.30 ± 0.67
5.45 ± 1.52
33.91 ± 9.76
151.10 ± 47.02
151.15 ± 47.02
3.49 ± 0.30
GXB-dePRP
1.10 ± 0.55
6.32 ± 4.89
45.10 ± 2.65*
110.68 ± 19.03
110.71 ± 19.02
1.81 ± 0.29***
(25R)-Timosaponin A III
GXB
1.30 ± 0.67
21.09 ± 5.57
46.02 ± 12.73
215.23 ± 57.74
221.15 ± 56.45
8.47 ± 5.73
GXB-dePRP
1.10 ± 0.55
14.31 ± 1.26
20.79 ± 3.21**
66.19 ± 10.65***
87.82 ± 36.80**
11.05 ± 1.85
Timosaponin B III
GXB
1.20 ± 0.76
10.64 ± 8.50
75.21 ± 15.89
281.51 ± 50.71
282.33 ± 50.74
4.03 ± 0.09
GXB-dePRP
0.80 ± 0.27
23.58 ± 4.35*
38.45 ± 6.50**
112.51 ± 16.59***
114.06 ± 17.83***
4.33 ± 1.70
5(6)-ene- Macrostemonoside B
GXB
1.30 ± 0.67
2.03 ± 0.87
45.45 ± 11.39
205.99 ± 61.57
206.94 ± 61.06
3.55 ± 0.42
GXB-dePRP
1.10 ± 0.55
10.29 ± 6.24*
19.74 ± 1.41**
55.36 ± 10.27***
60.25 ± 8.84***
4.62 ± 1.90
Glycyrrhetic acid
GXB
7.20 ± 2.68
25.71 ± 4.57
12.67 ± 2.22
207.17 ± 88.85
256.82 ± 91.21
41.99 ± 28.80
18 β-glycyrrhizic acid
GXB
7.30 ± 4.18
5.44 ± 1.67
24.21 ± 9.19
336.29 ± 99.37
337.01 ± 99.12
12.32 ± 1.46
Pedatisectine D + CH2
GXB
0.50 ± 0.31
5.95 ± 0.41
86130.35 ± 14821.40
365016.38 ± 54145.78
365475.13 ± 54180.07
6.71 ± 0.62
GXB-dePRP
0.65 ± 0.43
10.55 ± 1.80***
84256.29 ± 15832.63**
222434.28 ± 34163.01**
225523.24 ± 34874.80**
9.72 ± 1.18***
Luteolin-3′-O-gluA-1
GXB
2.20 ± 1.64
9.76 ± 3.20
245364.78 ± 56384.81
2084182.70 ± 482356.45
2113425.90 ± 457336.69
10.96 ± 3.46
GXB-dePRP
1.90 ± 1.34
6.26 ± 2.60
288651.90 ± 10878.28
1513309.10 ± 359209.19
1517476.80 ± 358357.62
13.35 ± 1.31
Apigenin-7-O-gluA
GXB
4.40 ± 3.51
7.79 ± 2.08
475485.78 ± 109550.45
4557952.70 ± 751088.94
4575006.20 ± 744875.42
9.84 ± 1.41
GXB-dePRP
2.50 ± 1.50
10.17 ± 3.67
341172.34 ± 77245.49
3405852.40 ± 616703.30*
3467279.40 ± 643063.57*
13.29 ± 2.05*
Luteolin-3′-O-gluA-2
GXB
6.20 ± 4.60
15.99 ± 8.00
200034.24 ± 74571.90
2349286.40 ± 1260901.30
2422093.00 ± 1247895.10
15.01 ± 3.57
GXB-dePRP
1.55 ± 1.52
10.05 ± 3.43
180508.48 ± 33021.14
1638393.10 ± 245951.26
1686811.30 ± 239188.88
15.97 ± 1.46
Timosaponin B II-glc-2H
GXB
1.30 ± 0.67
6.52 ± 1.01
25939.84 ± 3524.41
128669.50 ± 28697.72
128882.90 ± 28589.89
4.01 ± 0.33
GXB-dePRP
1.30 ± 0.67
4.63 ± 1.53
12578.55 ± 1452.47***
36513.28 ± 4473.28***
36619.09 ± 4546.42***
2.82 ± 0.60**
Macrostemonoside G-glc-H2O
GXB
3.42 ± 1.92
3.94 ± 0.24
37760.04 ± 20045.95
667121.54 ± 136383.39
668407.49 ± 136383.39
20.09 ± 5.23
GXB-dePRP
5.51 ± 1.91
5.13 ± 1.33
32138.56 ± 12823.34
401420.78 ± 35596.78**
402750.17 ± 35143.47**
18.33 ± 3.34
Macrostemonoside G-2glc-gal-1
GXB
7.50 ± 1.00
18.73 ± 8.64
23141.40 ± 7742.21
488915.22 ± 81606.84
655078.17 ± 127833.66
50.87 ± 5.34
GXB-dePRP
5.20 ± 1.79
16.05 ± 3.89
24164.28 ± 7807.79
459937.90 ± 98546.36
508020.20 ± 111372.84
31.65 ± 3.26***
25R-12-OH-timosaponin A III
GXB
5.06 ± 2.34
5.37 ± 0.72
17298.10 ± 7435.28
460165.30 ± 186525.27
464188.61 ± 187246.82
23.68 ± 2.92
GXB-dePRP
6.00 ± 2.30
7.10 ± 0.72**
18434.26 ± 4744.38
235269.14 ± 49290.31*
238639.79 ± 50493.94*
18.29 ± 2.97*
25(27)-ene-elephanpside H-glc
GXB
24.40 ± 4.90
45.26 ± 10.58
44370.14 ± 12833.33
1066397.90 ± 498239.57
1033990.20 ± 396633.03
56.41 ± 9.09
GXB-dePRP
4.50 ± 2.78***
9.69 ± 1.35***
37395.72 ± 6592.20
404147.44 ± 104167.74*
407984.61 ± 105604.43***
15.75 ± 3.39***
2α-OH-Macrostemonoside A
GXB
6.80 ± 1.10
8.29 ± 1.68
223785.00 ± 106442.51
3013123.80 ± 1431371.30
3041220.10 ± 1451574.00
13.79 ± 3.79
GXB-dePRP
3.20 ± 1.10***
8.43 ± 2.51
166855.63 ± 63978.34
1261606.10 ± 240282.63*
1271321.20 ± 238819.55*
12.19 ± 1.30
Capsicoside A2
GXB
8.00 ± 0.02
19.72 ± 3.08
111379.49 ± 23979.76
2392266.80 ± 351603.73
3047883.40 ± 478384.76
38.40 ± 7.91
GXB-dePRP
4.05 ± 2.35**
14.55 ± 3.80*
160079.40 ± 101448.89
2663874.30 ± 627310.66
2955569.00 ± 733058.60
28.97 ± 2.37*
Glycyrrhetic acid + gluA
GXB
9.60 ± 2.19
12.33 ± 2.51
660751.24 ± 221171.23
17919507.00 ± 7204877.60
18826677.00 ± 6706645.40
27.41 ± 9.48
Glycyrrhetic acid + gluA + OH
GXB
9.20 ± 2.68
22.33 ± 2.14
2047996.40 ± 388988.31
57767927.00 ± 13716525.00
73984131.00 ± 18454869.00
39.02 ± 3.10
Glycyrrhetic acid + gluA + OH-2H
GXB
43.20 ± 6.57
N.A
5742102.40 ± 3033922.10
167792580.00 ± 67936819.00
N.A
N.A
Generally, the residence time of 15 prototypes were much shorter than corresponding metabolites detected in intestine content from the results of concentration–time curves and pharmacokinetic parameters (Figs. 6 and 7 and Table 3). As we all known, longer residence time in vivo will absolutely enhance the drug action time so as to improve the efficacy of GXB. Therefore, it could speculate that the metabolites detected in intestine content exert a more important therapeutic effects than corresponding prototypes.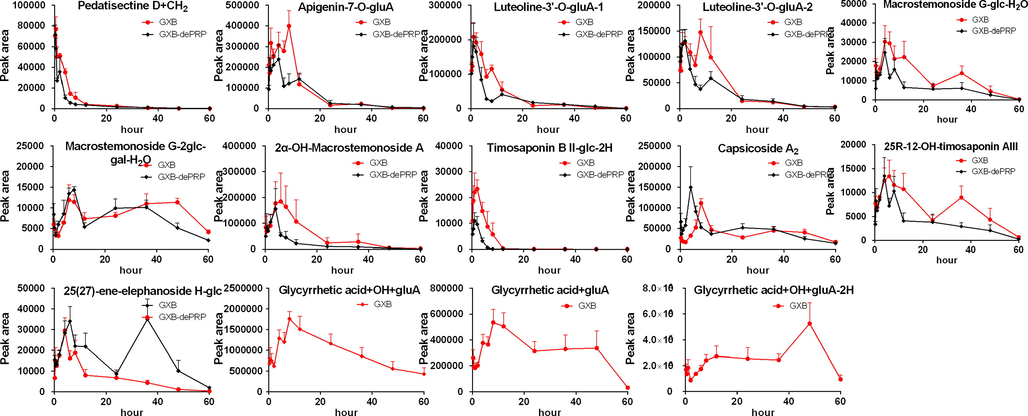
Mean peak area-time profile of 14 metabolites after oral administration of GXB and GXB-dePRP in rats (mean ± SD, n = 5).
In addition, we longitudinally compared the content distribution of various prototype components in GXB extract (Lin et al., 2021), GXB-contained plasma, and GXB-contained small intestine contents. The results (Fig. 8) can be more intuitive to find that the exposure profile of prototypes in rat plasma were apparently different from that of GXB extract. For example, the steroidal saponins with a very low exposure in rat plasma, but possessing a higher abundance in GXB extract. On the contrary, low percentage of glycyrrhetic acid in GXB extract, while high exposure in rat plasma. The exposure characteristic of prototypes in intestine content were generally similar to those in GXB extract. Especially, steroidal saponins were the major abundant components in GXB extract and intestine content, indicating that the contribution of so many components exposure in the gut to the efficacy of GXB should not be ignored, and the major exposure components of steroidal saponins in small intestine content play an important role in the efficacy of GXB.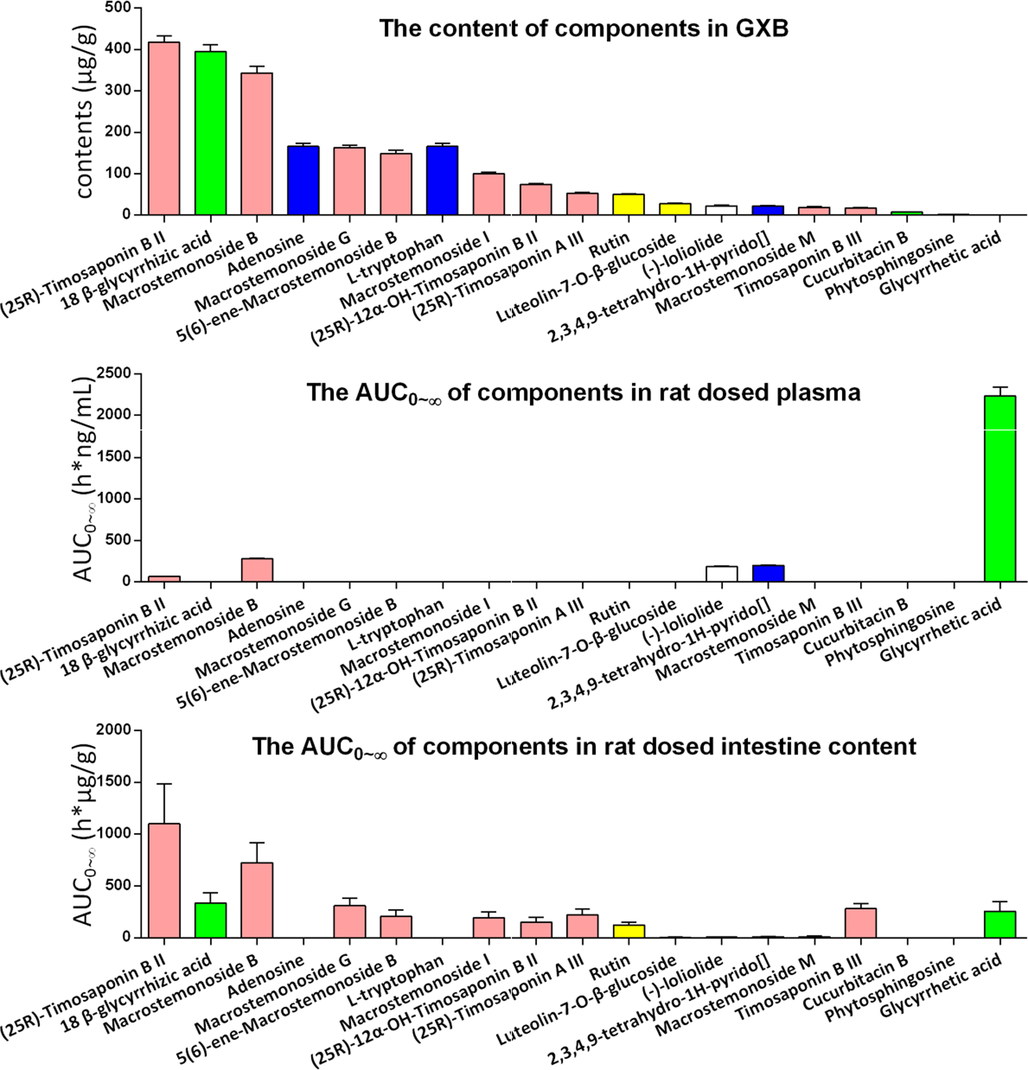
The content of different prototypes in GXB extract, GXB-contained rat plasma and GXB-contained rat intestine content (pink, green, blue, yellow and white columns respectively belongs to steroidal saponins, triterpenoids saponins, nitrogenous, flavonoids, other types components.) (For interpretation of the references to colour in this figure legend, the reader is referred to the web version of this article.).
3.4 Comparative pharmacokinetic study
Compared with GLXB, GXB adds one more herbal medicine, PRP, which make GXB more suitable for the treatment of severe atherosclerosis and dyslipidemia. By the results of metabolic profile, there was no obvious effect on the metabolic behaviors of components derived TP and AMB. Whereas the components originating from PRP absolutely enriched metabolic reactions for the whole formula of GXB comparing with those of GXB-dePRP. For example, liquirligenin and glycyrrhetic acid are two typical components from PRP, their transformation in rat mainly including glucuronidation, hydrogenation, sulfation, oxidation, and above combination products. What’s more, the addition of one more herbal medicine might influence the dynamic feature in vivo so as to alter their exposure level. Accordingly, a comparative pharmacokinetic study in rat plasma and intestine content after oral administration of GXB and GXB-dePRP were applied to explore the synergistic effect between PRP and other two herbal medicines in this formula.
As presented in Fig. 5 and Table 2, it was easily to find that the addition of PRP could significantly increase the AUC0-∞ values (p < 0.001) of 4 prototypes and 4 metabolites in rat plasma, as well as 9 prototypes and 7 metabolites detected in intestine content (Figs. 6 and 7 and Table 3), which were all derived from TP and AMB. What’s more, the values of MRT for most of target xenobiotics after oral administration of GXB were also prolong compared with those of GXB-dePRP. The increase values of AUC and MRT indicated that the bioavailability of components could also be improved in vivo. Moreover, the enhanced bioavailability of components was mainly focused on the steroidal saponins. Based on the available literatures, steroidal saponins possess a series of cardiovascular related pharmacological effects, such as anti-antiplatelet aggregation, lipid lowering and antioxidant activity (Yao et al., 2016). Thus, the above comparative study could speculate that PRP could efficiently promote the exposure of bioactive components, so as to make GXB more suitable for severe atherosclerosis and dyslipidemia.
4 Conclusion
In the present study, the metabolic profile of GXB was systematically characterized by UPLC-Q/TOF-MS, and a total of 103 prototypes and 118 metabolites were identified in GXB-contained bio-samples, which preliminarily determined representative xenobiotics for kinetic profile study. Furthermore, two rapid and practical UPLC-TQ-XS methods were successfully established and employed to monitor kinetic feature after oral administration of GXB and GXB-dePRP in rat plasma and intestine content, respectively. The results indicated that GXB-related xenobiotics displayed a higher exposure in rat intestine content than plasma, of which prototypes could rapidly convert to corresponding metabolites and then exhibit a relative long residence time in plasma and intestine content after multi-dose. By comparing with the group administrating GXB-dePRP, the values of AUC and Cmax were significantly increased (p < 0.05) in GXB groups, suggesting that the introduction of PRP could improve the bioavailability of active components from TP and AMB, and that might be one of the important reasons why GXB was more suitable for the severe atherosclerosis and dyslipidemia than its analogous formula (GLXB). These results would provide an in vivo dynamic feature basis for further investigation on bioactive components and therapeutic mechanism research of GXB.
Acknowledgements
This work was supported by the National key R&D Program of China [2017YFC1700400, 2017YFC1700405]; the National Natural Science Foundation of China [81773880]; Guangdong Basic and Applied Basic Research Foundation [2021A1515111045]; Guangzhou Key Laboratory of Formula-Pattern of Traditional Chinese Medicine [202102010014]; and the National Major Scientific and Program of Introducing Talents of Discipline to Universities [B13038].
Declaration of Competing Interest
The authors declare that they have no known competing financial interests or personal relationships that could have appeared to influence the work reported in this paper.
References
- Gut microbiota, a new frontier to understand traditional Chinese medicines. Pharmacol Res.. 2019;142:176-191.
- [CrossRef] [Google Scholar]
- Metabolites profile of Xian-Ling-Gu-Bao capsule, a traditional Chinese medicine prescription, in rats by ultra performance liquid chromatography coupled with quadrupole time-of-flight tandem mass spectrometry analysis. J Pharm Biomed Anal.. 2014;96:90-103.
- [CrossRef] [Google Scholar]
- Evaluation of the effect of Shengxian Decoction on doxorubicin-induced chronic heart failure model rats and a multicomponent comparative pharmacokinetic study after oral administration in normal and model rats. Biomed Pharmacother.. 2021;144:112354
- [CrossRef] [Google Scholar]
- Inflammation inhibition and gut microbiota regulation by TSG to combat atherosclerosis in ApoE−/− mice. J. Ethnopharmacol.. 2020;247:112232
- [CrossRef] [Google Scholar]
- Metabolites profile of Gualou Xiebai Baijiu decoction (a classical traditional Chinese medicine prescription) in rats by ultra-performance liquid chromatography coupled with quadrupole time-of-flight tandem mass spectrometry. J Chromatogr B Analyt Technol Biomed Life Sci.. 2018;1085:72-88.
- [CrossRef] [Google Scholar]
- Qualitative and quantitative analysis of the chemical profile for Gualou-Xiebai-Banxia decoction, a classical traditional Chinese medicine formula for the treatment of coronary heart disease, by UPLC-Q/TOF-MS combined with chemometric analysis. J Pharm Biomed Anal.. 2021;197:113950
- [CrossRef] [Google Scholar]
- The Effect of Chinese Herbal Medicine Gualouxiebaibanxia Decoction for the Treatment of Angina Pectoris: A Systematic Review. Evid Based Complement Alternat Med.. 2016;2016:8565907.
- [CrossRef] [Google Scholar]
- Study on chemical profiles and metabolites of Allii Macrostemonis Bulbus as well as its representative steroidal saponins in rats by ultra-performance liquid chromatography coupled with quadrupole time-of-flight tandem mass spectrometry. Food Chem.. 2016;192:499-515.
- [CrossRef] [Google Scholar]
- Quantification and semiquantification of multiple representative components for the holistic quality control of Allii Macrostemonis Bulbus by ultra high performance liquid chromatography with quadrupole time-of-flight tandem mass spectrometry. J. Sep. Sci.. 2016;39(16):1834-1841.
- [CrossRef] [Google Scholar]
- Evaluation Research of Saliva Collection Method in Rat Model of Spleen Deficiency by Using Salivary Amylase Activity Index. Journal of Basic Chinese Medicine. 2016;22:906-921.
- [Google Scholar]
- Gut Microbiota-Mediated Personalized Treatment of Hyperlipidemia Using Berberine. Theranostics.. 2017;7:2443-2451.
- [CrossRef] [Google Scholar]
- Development of an UHPLC-MS/MS method for comparative pharmacokinetics of nine anthraquinones in rats and application to dosage conversion between different Semen Cassiae forms. J Pharm Biomed Anal.. 2019;174:696-706.
- [CrossRef] [Google Scholar]
- In vitrometabolic mapping of neobavaisoflavone in human cytochromes P450 and UDP-glucuronosyltransferase enzymes by ultra high-performance liquid chromatography coupled with quadrupole time-of-flight tandem mass spectrometry. J Pharm Biomed Anal.. 2018;158:351-360.
- [CrossRef] [Google Scholar]
- ETCM: an encyclopaedia of traditional Chinese medicine. Nucleic Acids Res.. 2019;47:D976-D982.
- [CrossRef] [Google Scholar]
- Comparison about protective effect of different ingredients extracted from Gualou-Xiebai-Banxia Decoction on cardiomyocytes induced by ischemia-hypoxia. Drug Evaluation Research.. 2018;41
- [CrossRef] [Google Scholar]
- Experimental Study of Blood Lipid-regulating and Myocardium-protecting Function of Gualou Xiebai Banxia Decoction. Journal of Shandong University of TCM.. 2014;38:593-595.
- [Google Scholar]
- Phytochemistry and pharmacology of Allii Macrostemonis Bulbus, a traditional Chinese medicine. Chinese Journal of Natural Medicines.. 2016;14:481-498.
- [CrossRef] [Google Scholar]
- Prediction of the mechanism of Dachengqi Decoction treating colorectal cancer based on the analysis method of “ into serum components -action target-key pathway”. J Ethnopharmacol.. 2022;293:115286
- [CrossRef] [Google Scholar]
- Gualou Xiebai Banxia Decoction Inhibits NF-kappa B-dependent Inflammation in Myocardial Ischemia-reperfusion Injury in Rats. J. Tradit. Chin. Med.. 2011;31:338-343.
- [CrossRef] [Google Scholar]
- Discovery of cardio-protective constituents of Gualou Xiebai Decoction, a classical traditional Chinese medicinal formula. Phytomedicine. 2019;54:318-327.
- [CrossRef] [Google Scholar]
- Comparative Pharmacokinetics of Hydrophilic Components in Salvia miltiorrhiza Bge. and Carthamus tinctorius L. in Rats That Underwent Cerebral Ischemia Reperfusion Using an HPLC-DAD Method. Front Pharmacol.. 2019;10:1598.
- [CrossRef] [Google Scholar]
- Synergistic Effects of Chinese Herbal Medicine: A Comprehensive Review of Methodology and Current Research. Front Pharmacol.. 2016;7:201.
- [CrossRef] [Google Scholar]
Appendix A
Supplementary material
Supplementary data to this article can be found online at https://doi.org/10.1016/j.arabjc.2022.104417.
Appendix A
Supplementary material
The following are the Supplementary data to this article:Supplementary data 1
Supplementary data 1


