

Translate this page into:
LC-HRMS-based metabolomics to evaluate the phytochemical profile and antioxidant capacity of Cosmos caudatus with different extraction methods and solvents
⁎Corresponding authors at: Department of Chemistry, Faculty of Mathematics and Natural Sciences, Jalan Tanjung-Dramaga Campus, IPB University, Bogor 16680, West Java, Indonesia (M. Rafi). mra@apps.ipb.ac.id (Mohamad Rafi), ahuhalim76@yahoo.com (Abdul Halim Umar)
-
Received: ,
Accepted: ,
This article was originally published by Elsevier and was migrated to Scientific Scholar after the change of Publisher.
Peer review under responsibility of King Saud University.
Abstract
Cosmos caudatus, a medicinal plant used in traditional medicine, is also consumed as a vegetable. This study aimed to determine the total phenolics, total flavonoids, antioxidant activity, and metabolite profiles of C. caudatus extracts obtained using different extraction methods (direct and successive macerations) and solvents. In addition, metabolite profiles were analyzed using principal component analysis (PCA) and partial least squares discriminant analysis (PLS-DA) to distinguish samples and correlate them with their antioxidant activity. The total phenolic and flavonoid content in C. caudatus varied from 97.03 to 472.60 mg gallic acid equivalent/g dried sample and 24.56–68.00 mg quercetin equivalent/g dried sample. Ethanol extracts obtained through direct maceration method showed the highest antioxidant capacity. PCA using LC-HRMS chromatogram data distinguished the samples with a total PC of 95.1% (positive ionization mode) and 98.5% (negative ionization mode). Using PLS-DA, we identified several compounds, such as isoquercitrin, quercetin-3-O-rutinoside, avicularin, rutin, quercitrin, and vitexin, which likely contribute to the antioxidant capacity of C. caudatus.
Keywords
Antioxidants
Chemometrics
Cosmos caudatus
Maceration
Metabolomics
UHPLC-Q-Orbitrap-HRMS

1 Introduction
Cosmos caudatus, known as kenikir in Indonesia, belongs to the Asteraceae family. In Indonesia, young leaves of this plant are used as ingredients in salads and appetizers because of their distinctive taste and aroma. This plant is also used in traditional medicine as herbal tea. C. caudatus has been reported to have very low toxicity and its pharmacological effects include antibacterial, anti-inflammatory, antioxidant, and antidiabetic properties (Afrianto et al., 2021; Firdaus et al., 2021; Gunasekaran et al., 2021; Herlina et al., 2021; Latiff et al., 2021; Seyedreihani et al., 2017; Yusoff et al., 2021). In addition, this plant has been reported to contain carotenoids, flavonoids, phenolic acids, phenylpropanoids, sesquiterpene lactones (Herlina et al., 2021), vitamins (B1, B2, C, and-carotene), minerals (potassium, calcium, magnesium, phosphorus, iron, zinc, sodium, and copper), and low-calorie content (Yusoff et al., 2021; Cheng et al., 2015).
Phytochemical compounds present in this plant include various quercetin derivatives (quercetin-3-O-rhamnoside, quercetin-3-rutinoside, quercetin glucoside, quercetin 3-O-β-arabinofuranoside, quercetin 3-O-β-glucoside), proanthocyanidin, crypto-chlorogenic acid, neo-chlorogenic acid, chlorogenic acid, catechin, epicatechin, myricetin, and naringenin (Latiff et al., 2021; Seyedreihani et al., 2017; Mediani et al., 2012). Some of these compounds have exhibited antioxidant effects (Fombang et al., 2021; Pyo et al., 2021). Furthermore, to obtain plant bioactive compounds, selecting organic solvents and appropriate extraction methods is essential (Rafi et al., 2022; Aziz et al., 2021; Sinan et al., 2020). Thus, it is crucial to investigate the extraction solvent and mode of extraction to achieve the highest level of bioactive metabolites from this plant and to evaluate its antioxidant activity. Additionally, untargeted metabolomics can be used to identify the metabolites detected with antioxidant activity.
Untargeted metabolomics is widely used to assess the changes in the metabolite profiles of plants and is one of the most widely applied methods for identifying and quantifying highly complex natural metabolites (Beniddir et al., 2021; Ningsih et al., 2021). Untargeted metabolomics using LC-HRMS have been widely used owing to their high sensitivity, selectivity, and accuracy in detecting natural metabolites (Aziz et al., 2021; Umar et al., 2021). However, interpreting complex natural compounds and their correlations with conventional biological activities can be challenging and often requires chemometric techniques (Umar et al., 2021). Nevertheless, this technique provides a comprehensive overview of the compounds contributing to the primary biological activity and compares samples and their compounds based on the solvent and extraction methods used (Sinan et al., 2020).
Previous studies have investigated various ways to identify metabolites in C. caudatus (Mediani et al., 2012; Firdaus et al., 2021; Gunasekaran et al., 2021; Yusoff et al., 2021). However, no report has described the composition and concentration of metabolites in C. caudatus using different extraction methods and extracting solvents and their antioxidant activity levels with predicted metabolites that can act as potent antioxidants. Therefore, in this study, we evaluated direct and successive maceration using different extraction solvents (n-hexane, ethyl acetate, and ethanol) and measured their antioxidant activities. We also determined the total phenolic and flavonoid content and identified the putative metabolites in C. caudatus using UHPLC-Q-Orbitrap-HRMS. Furthermore, we correlated the UHPLC-Q-Orbitrap-HRMS chromatogram with the antioxidant capacity to identify the antioxidant compounds present in this plant extract.
2 Material and methods
2.1 Plant materials and chemicals
Cosmos caudatus leaves were collected from the Tropical Biopharmaca Research Center, IPB University, Bogor, West Java, Indonesia. The specimen was identified by Mr. Taopik Ridwan, a botanist from TropBRC, using a voucher specimen (BMK0433012018). Ethanol, ethyl acetate, n-hexane, Folin-Ciocalteu reagent, sodium carbonate, aluminum chloride, sodium acetate, copper chloride, ammonium acetate, ferric chloride, acetic acid, water (LC–MS grade), acetonitrile (LC–MS grade), methanol (LC–MS grade), and formic acid (LC–MS grade) were purchased from Merck (Darmstadt, Germany). 2,2-diphenyl-1-picrylhydrazyl (DPPH), 6-Hydroxy-2,5,7,8- tetramethylchroman-2-carboxylic acid (Trolox), and gallic acid were obtained from Sigma–Aldrich (St. Louis, USA).
2.2 Sample preparation
The leaves of C. caudatus were dried at 40 °C in a drying cabinet for three days, pulverized, and sieved through a 40-mesh sieve before extraction. Samples (100 g each) were extracted using two maceration methods: direct maceration (DM) and successive maceration (SM). In the DM method, three batches of C. caudatus powder (100 g) were separately extracted with 1 L of n-hexane (Hex), ethyl acetate (EtOAc), or ethanol (EtOH) for 24 h at room temperature (25 °C) with occasional shaking. In the SM method, 100 g of C. caudatus powder was first extracted with n-hexane for 24 h at room temperature with occasional shaking at pH 7.0, followed by extraction with EtOAc for 24 h at room temperature (pH 6.0). Finally, the EtOAc residues were extracted with EtOH under the same conditions (pH 7.0). All the extract solutions were filtered (Whatman No.1 filter paper), and the filtrate was evaporated using a rotary evaporator (Rotavapor R-210, BÜCHII Labortechnik, Switzerland) below 50 °C to obtain the dry extract. All dry extracts were prepared in triplicates.
2.3 Determination of total phenolics
Total phenolic content (TPC) was determined using the Folin–Ciocalteu method described by Kruawan and Kangsadalampai (2006). Approximately 10 μL of the extract solution, 160 μL distilled water, 10 μL of 10% Folin-Ciocalteu reagent, and 20 μL of 7.5% Na2CO3 were transferred to a 96-well plate (Costar®, Washington, DC, USA). The mixture was homogenized and incubated for 30 min at 37 °C in the dark. Absorbance was measured at 750 nm using a microplate reader (Epoch-BioTek, Winooski, USA). The TPC was calculated based on the calibration curve of gallic acid using the following equation: y = 0.0075x + 0.0446, with R2 = 0.9968. The results were expressed as gallic acid equivalents (GAE) in mg GAE g−1 of dried samples. The measurements were performed in triplicates.
2.4 Determination of total flavonoids
Aluminum chloride (colorimetric method) was used to determine the total flavonoid content, following the procedure described by Lee et al. (2011). Briefly, 10 μL sample extract, 60 μL ethanol, 10 μL of 10% AlCl3, 10 μL of 1 M potassium acetate, and 120 μL distilled water were added to a 96-well plate and incubated for 30 min at 37 °C. The absorbance of the solution was measured at 415 nm using a microplate reader. The total flavonoid content was calculated using a quercetin calibration curve (y = 0.0135x + 0.0095, R2 = 0.9974), and the quantity was expressed as quercetin equivalents (QE) in mg QE g−1 dried sample. Measurements were performed in triplicates for each sample extract.
2.5 DPPH radical scavenging activity
Radical scavenging activity was measured using the DPPH method described by Salazar-Aranda et al. (2011). In a 96-well plate, 40 μL of extract solution was briefly mixed with 250 μL of 125 μM DPPH solution (in ethanol). The solution was then immediately incubated for 30 min in the dark at room temperature. The absorbance of the solution was measured at 515 nm against ethanol as a blank using a microplate reader. The radical scavenging activity was determined using the equation: y = 0.001x + 0.00111, with R2 = 0.9916. Trolox was used as a standard, and measurements were performed in triplicates and expressed as micromolar Trolox equivalents/g extract (μM TE g−1 extract).
2.6 Identification of metabolites by LC-HRMS
Approximately 50 mg of dried extract was ultrasonically extracted (Branson Ultrasonic Corporation, Danbury, CT, USA) with 1.5 mL of methanol at 30 °C for 15 min and filtered through a 0.2 µm syringe filter membrane (SY25TF PTFE mdi). The filtrates were collected in vials. Metabolite profiling was performed in a UHPLC-Q Exactive Plus Orbitrap High-Resolution Mass Spectrometer using Accucore™ Phenyl Hexyl (100 × 2.1 mm, 2.6 µm) (Thermo Scientific™, Waltham, MA, USA) as the separation column and UV detector at 254 nm. The MS ionization source was electrospray ionization, and a Q-Orbitrap was used as the mass analyzer with collision energies of 18, 35, and 53 eV. A spray voltage of 3.8 kV, a capillary temperature of about 320 °C, sheath gas and auxiliary gas flow rates of 15 and 3 mL min−1, respectively, and a resolving power of 70,000 FWHM were used.
The flow rate from the delivery system was adjusted at 0.3 mL min−1, the autosampler temperature was maintained at 10 °C, and the sample injection volume was 0.5 µL. The mobile phase comprises 0.1% formic acid in water (A) and acetonitrile (B). A linear gradient elution program was applied as follows: 0–1.5 min (5% B), 1.5–9 min (5–10% B), 9–13 min (10–20% B), 13–17 min (20–28% B), 17–23 min (28–78% B), 23–26 min (70–95% B), 26–29 min (95% B), and 29–32 min (5% B). The total run time was 32 min, with a relative abundance of 0–100, and the MS full-scan type (100–1500) in positive and negative modes.
2.7 Data analysis
The experimental results of total phenolics and flavonoid contents and the determination of antioxidants are expressed as means ± SD of three replicates for each sample. One-way ANOVA was performed using R ver. I386 3.6.0, and significance levels were tested at p < 0.05 using Welch’s test.
Metabolites were identified using Compound Discoverer ver. 3.1 (Thermo Scientific™, Waltham, MA, USA), MS-DIAL ver. 4.70 (for peak detection, identification, and alignment) and MS-FINDER ver. 3.52 for formula predictions, in silico MS/MS fragment annotations, and structure elucidation. Unknown raw spectral data (*. raw format) from Xcalibur™ (Thermo Fisher Scientific) were imported into Abf Converter.4.0.0 (*. abf format) (Tsugawa et al. 2015).
The following peak detection parameters were used: a minimum peak height of 10,000 (Orbitrap), smoothing method (linear weighted moving average), smoothing level (2), and minimum peak width (3). Identification used an in-house database (MSP File) in MS/MS positive and negative modes (http://prime.psc.riken.jp/compms/msdial/main.html#MSP) (accessed on 16th Nov 2021) with a score cut off (80%), adduct types [M + H]+ and [M − H]−, and alignment was performed using reference quality control. We then calculated the mass error value (10 ppm) as the filtering criterion for the compounds identified in the scanning experiments.
Processed UHPLC-Q-Orbitrap HRMS data (peak area values) (Umar et al., 2021) were analyzed using MetaboAnalyst 5.0 (https://www.metaboanalyst.ca/) for multivariate data analysis (Xia and Wishart 2016). Principal component analysis (PCA) was used to obtain information on sample grouping, similarities, and differences among the different extracting solvents. The partial least squares-discriminant analysis (PLS-DA) method was used to analyze further the correlation between antioxidants and the metabolites detected in the C. caudatus samples. In addition, a heatmap of the hierarchical cluster analysis was generated to present the results of the putatively identified compounds in C. caudatus samples. This analysis helps discover the clustering patterns in a dataset. Euclidean distance measures, complete clustering algorithms, and autoscale standardization were chosen for the hierarchical clustering analysis.
3 Results and discussion
3.1 Total phenolic and flavonoid content
We designed the experiment based on code samples, solvents, and extraction methods, as summarized in Table 1. The TPC of the examined C. caudatus with different solvents and extraction methods ranged from 97.03 to 472.60 mg GAE/g extract (Table 1). The highest phenolic concentration was obtained using the DM method with ethanol solvent (472.60 mg GAE g−1), whereas the lowest value (97.03 mg GAE g−1) was observed in the sample extracted using with n-hexane in the DM method. A similar trend was also observed for the total flavonoid content in this work ranging from 24.56 to 68.00 mg QE g−1 (Table 1). The highest (68.00 mg QE g−1) and lowest (24.56 mg QE g−1) values were recorded for SM-EtOH and SM-Hex, respectively. The reported value is the mean ± SD of a triplicate assay for each sample. Values in the same column followed by different superscript letters indicate significant differences at p < 0.05 (Welch’s test). TPC (total phenolic content); TFC (total flavonoid content); DM (direct maceration); SM (successive maceration); EtOAc (ethyl acetate); EtOH (ethanol); Hex (n-hexane).
Samples
TPC(mg GAE g−1)
TFC(mg QE g−1)
Antioxidant(µmol Trolox g−1)
DM-EtOAc
430.36 ± 1.21 d
46.81 ± 2.49b
216.91 ± 8.81c
DM-EtOH
472.60 ± 6.46 e
55.85 ± 0.58c
561.86 ± 9.33 e
DM-Hex
97.03 ± 0.24 a
25.00 ± 0.98 a
147.82 ± 9.19b
SM-EtOAc
262.06 ± 1.28b
50.91 ± 2.92 bc
165.71 ± 11.79b
SM-EtOH
310.53 ± 0.63c
68.00 ± 1.90 d
490.51 ± 2.44 d
SM-Hex
100.31 ± 3.14 a
24.56 ± 1.07 a
101.16 ± 5.53 a
Several studies have indicated that factors such as solvent, pH, the extraction or calibration method, temperature, and extraction time play crucial roles in phenolic content (Firdaus et al., 2021; Rahimmalek et al., 2020, Yusoff et al., 2021). The drying method of C. caudatus samples also significantly affects their concentration and biological activity (Mediani et al., 2012; Sukrasno et al., 2011). Water and ethanol with maceration are solvents and extraction methods that can maximize the extraction of phenolic and flavonoid compounds in samples of C. caudatus (Firdaus et al., 2021; Latiff et al., 2021; Widiyantoro and Harlia, 2021). Ideally, the metabolic analysis should aim to extract as many classes of metabolites as possible in polar (e.g., ethanol) and non-polar (e.g., ethyl acetate and hexane) solvents (Saw et al., 2021).
3.2 Antioxidant activity
Based on antioxidant values, the highest (561.86 µmol Trolox g−1) and lowest (101.16 µmol Trolox g−1) antioxidant capacities were observed for the DM-EtOH and SM-Hex extracts, respectively (Table 1). The high antioxidant capacities of the ethanol extracts from both extraction modes were attributed to the contribution of phenolic compounds. The antioxidant activity of this plant is also reported to be very high owing to its phenolic and flavonoid contents (Firdaus et al., 2021; Latiff et al., 2021; Sharifuldin et al., 2016). In this experiment, free radical scavenging activity was positively correlated with total phenolic and flavonoid compounds (0.71 and 0.79, respectively) (Fig. 1). Positive correlations between phenolic and flavonoid compounds and antioxidant values indicate that higher antioxidant activity is associated with higher polyphenol concentrations necessary to obtain antioxidant activity (Tohidi et al., 2017). Overall, the observed differences may be attributed to the variations in the solvents and extraction methods used. Several species from the Lamiaceae family have been reported to have different antioxidant capacities (DPPH test) because of the influence of solvent and extraction methods. In addition, the ability to scavenge free radicals may be influenced by the type and concentration of radicals and the chemical structure of the polyphenols involved (Rahimmalek et al., 2020).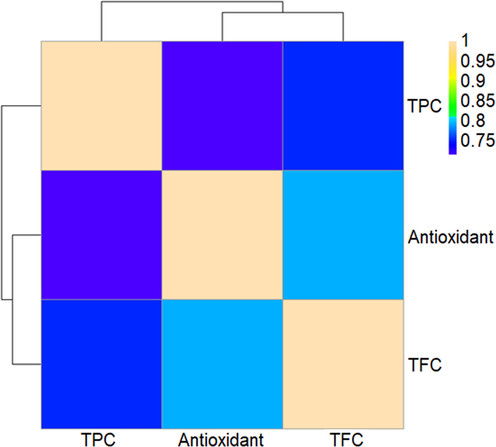
Heatmap correlation between total compound content and antioxidant capacity. TPC (total phenolic content) and TFC (total flavonoid content).
3.3 Identification of C. caudatus metabolites
LC-HRMS was used to determine the chemical compounds in the extracts obtained from all the studies using different solvents and extraction methods. The compounds identified in all samples were mainly phenolic and terpenoid groups, with some alkaloid and steroid groups. The heat maps generated from the post hoc ANOVA analysis are shown in Figs. 2 and 3 for the positive and negative modes, respectively. The number of compounds identified in the positive mode was higher than in the negative mode. Supplementary Table S1 lists the metabolites detected in the raw compounds from all samples at the MS1 and MS2 levels. The compounds were identified based on their accurate mass, retention time, and mass spectrometry (MS) fragmentation patterns, with a mass error of 10 ppm as the screening criterion.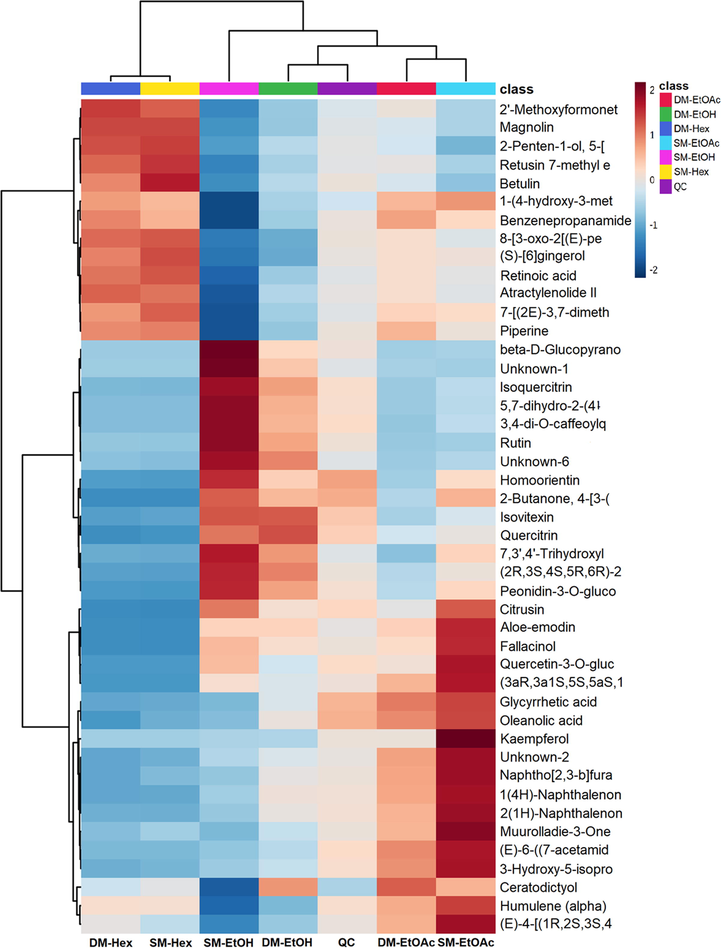
Heatmap of identified metabolites (top 45) in positive modes of group samples. Their distribution and relative abundance are high (2) to low (-2) (colors gradient box at the top right) in each C.caudatus sample. The group means simplified the distribution visualization of this hierarchical cluster analysis derivative.
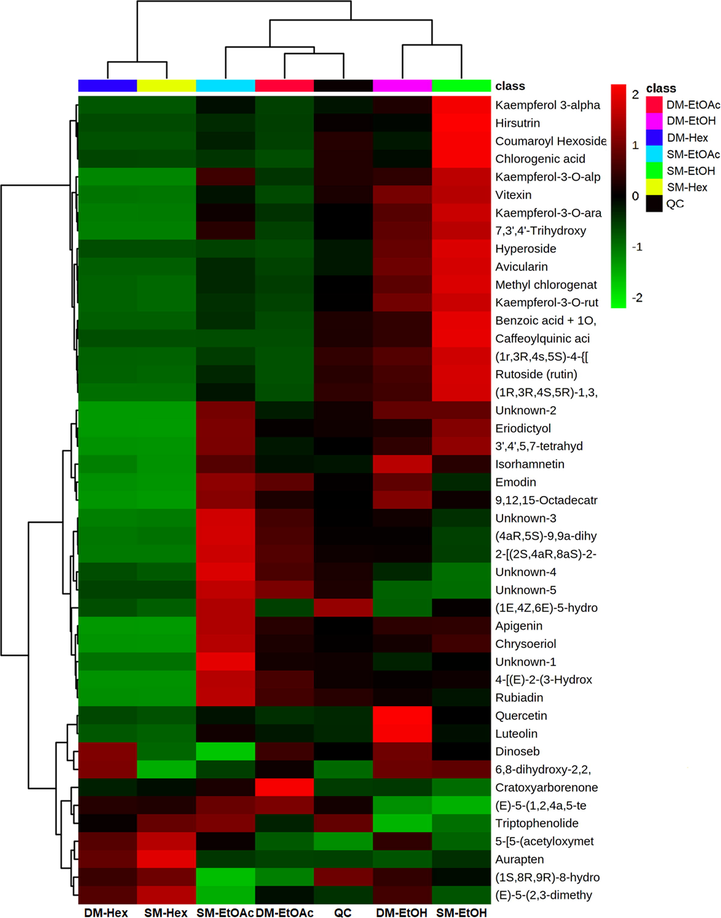
Heatmap of identified metabolites in negative modes of group samples. Their distribution and relative abundance are high (2) to low (-2) (colors gradient box at the top right) in each C.caudatus sample. The group means simplified the distribution visualization of this hierarchical cluster analysis derivative.
1H NMR, HPLC, and LC–MS-based metabolomics techniques has been used to identify the phenolic and flavonoid compounds in this species, such as chlorogenic acid, rutin, and quercetin (Mediani et al., 2012; Sharifuldin et al., 2016; Seyedreihani et al., 2017; Gunasekaran et al., 2021). Terpenes, including ingenol, identified in this species, are used for topically treating actinic keratosis caused by Euphorbia trigona (Hammadi et al., 2021). The compound 14-deoxyandrographolide, an antiviral from Andrographis paniculata (Jadhav and Karuppayil 2021), and betulin is used for osteoarthritis (Su et al., 2021).
3.4 Multivariate analysis
PCA was performed to distinguish the extracts from different solvents and extraction methods based on tentative phytochemical compounds (peak area). In the positive mode (Fig. 4), the PCA plot produced a total principal component (PC) value of 95.1%, indicating that the first two PCs achieved 95.1% of the total variability. More specifically, PC-1 explained 86.7% of the total variance in the dataset, whereas PC-2 explained the remaining 8.4% and was mode negative (Fig. 5) with a total PC of 98.5% (PC-1 58.7%, PC-2 39.8%). This study used PCA as an unsupervised pattern recognition technique to obtain sample grouping patterns, similarities, and differences between the solvent and extraction methods (Mashiane et al., 2021). A PCA plot consists of two PCs to capture most of the variants of the data and the closer PC values of the samples. The cumulative percentages of the total variance (PC-1 and PC-2) obtained from the UHPLC-Q-Orbitrap HRMS data were 98.5% and 98.5%, respectively. Therefore, it can be concluded that the PCA used for sample clustering shows good accuracy in terms of both solvent and extraction methods (Umar et al., 2021).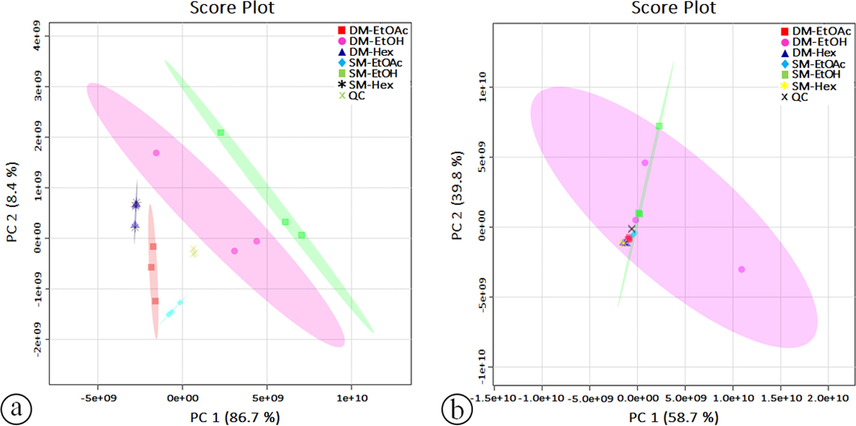
PCA score plots for the main components (PC-1) and (PC-2) on all extract samples of C. caudatus in positive (a) and negative (b) modes using UHPLC-Q-Orbitrap HRMS data.
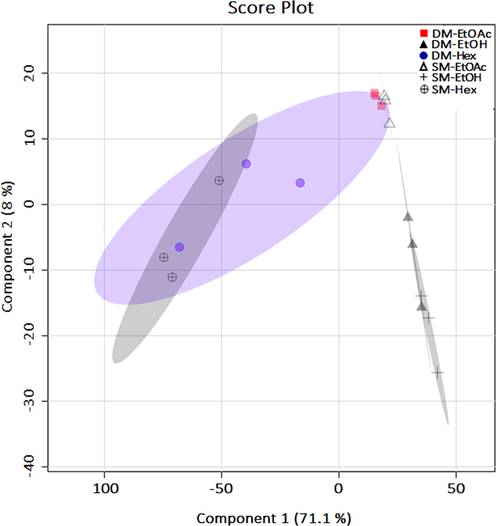
PLS-DA plots for the main components (Component-1) and (Component-2) on all extract samples of C. caudatus using UHPLC-Q-Orbitrap HRMS data.
PLS-DA is often used as a supervised pattern recognition method to correlate the biological activities of medicinal plants with spectroscopic data (peak area or peak and absorbance value) (Aziz et al., 2021; Hawrył et al., 2020). We performed PLS-DA to obtain a more detailed view of the correlation between the antioxidant activity and the presence of phytochemicals. We adopted this approach because PLS-DA successfully linked biological activity with phytochemicals and provided prediction models (Mediani et al., 2012). In this study, we used the PLS-DA model to determine the linear relationship between the independent dataset of measurement X (peak area from the detected metabolites) and the dependent set of variable Y (antioxidant activity) to predict the bioactive compounds (Kim et al., 2020). The component 1 (LV-1) and 2 (LV-2) values in the PLS-DA model (Fig. 5) for antioxidant activity were 71.1% and 8%, respectively.
We further conducted a correlation analysis to determine the relationship between the identified compounds and their activities. In this study, twenty compounds were identified that showed a strong correlation with antioxidant activity (Fig. 6a) based on the correlation coefficients of each compound. The images present a vertical bar graph indicating both positively (light pink) and negatively (light blue) correlated metabolites (Föcker et al., 2021). Fig. 6b shows the VIP scores of each compound. Based on the correlation coefficients (cc) of the compounds (top 25 features) and VIP scores, six compounds were identified as the main contributors to the antioxidant activity of C. caudatus, namely: isoquercitrin (r = 0.823, VIP = 3.808), quercetin-3-O-rutinoside (r = 0.820, VIP = 0.020), avicularin (r = 0.843, VIP = 2.484), rutin (r = 0.849, VIP = 0.383), quercitrin (r = 0.862, VIP = 0.276), and vitexin (r = 0.858, VIP = 0.233). These six compounds were identified as the most important based on the VIP score in the PLS-DA analysis (Xia and Wishart 2016). Compounds with VIP values greater than 1 significantly contribute to biological activities (Mashiane et al., 2021).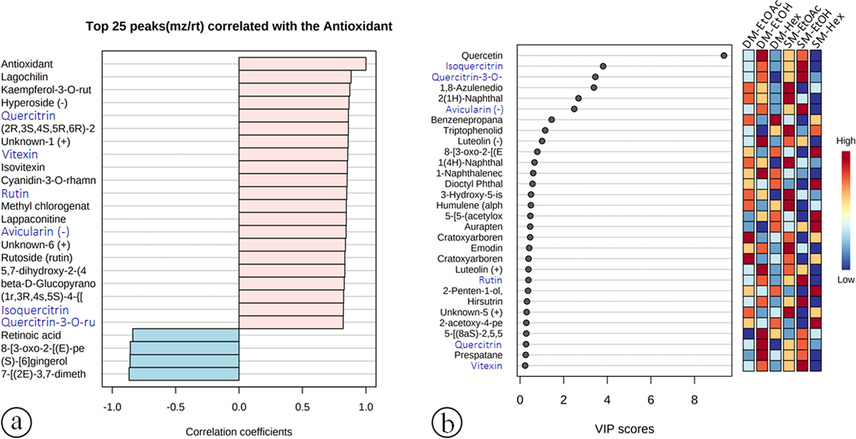
Compounds (top 25) correlated to each compound's antioxidant capacity (a) and VIP scores (b). Metabolite names provided in blue fonts are shared between both analyses.
4 Conclusions
The type of solvent strongly influenced the total metabolites and the extraction method used. For example, the gradual maceration method uses ethanol as a polar solvent, producing a higher number of total metabolites and exhibiting high antioxidant activity. UHPLC-Q-Orbitrap HRMS data and biological activity assays combined with PCA provided a comprehensive approach to distinguish the extracted samples from the two extraction methods and solvents. PLS-DA can be used to predict chemical compounds that contribute to antioxidant activity. In the case of C. caudatus, the chemical compounds, including isoquercitrin, quercetin-3-O-rutinoside, avicularin, rutin, quercitrin, and vitexin, contribute to its antioxidant activity.
CRediT authorship contribution statement
Mohamad Rafi: Conceptualization, Methodology, Project administration, Funding acquisition, Validation, Software, Visualization, Writing – original draft, Writing – review & editing. Fitroh Hayati: Data curation, Formal analysis, Investigation. Abdul Halim Umar: Conceptualization, Methodology, Project administration, Funding acquisition, Validation, Data curation, Formal analysis, Investigation, Software, Visualization, Writing – original draft, Writing – review & editing. Dewi Anggraeni Septaningsih: Conceptualization, Methodology, Project administration, Funding acquisition, Validation, Data curation, Formal analysis, Investigation, Software, Visualization, Writing – review & editing. Tiah Rachmatiah: Conceptualization, Methodology, Project administration, Funding acquisition, Validation, Writing – review & editing.
Acknowledgments
The authors thank the Tropical Biopharmaca Research Center and Advanced Research Laboratory, IPB University, for their financial support.
Declaration of Competing Interest
The authors declare that they have no known competing financial interests or personal relationships that could have appeared to influence the work reported in this paper.
References
- Local knowledge of plant-based nutrition sources from forgotten foods in Datengan Village, East Java. Indonesia. Asian J. Ethnobiol.. 2021;4:53-64.
- [CrossRef] [Google Scholar]
- Investigation of yacon leaves (Smallanthus sonchifolius) for α-glucosidase inhibitors using metabolomics and in silico approach. Plant Foods Hum. Nutr.. 2021;76:487-493.
- [CrossRef] [Google Scholar]
- Advances in decomposing complex metabolite mixtures using substructure- and network-based computational metabolomics approaches. Nat. Prod. Rep.. 2021;38:1967-1993.
- [CrossRef] [Google Scholar]
- Potential medicinal benefits of Cosmos caudatus (Ulam Raja): a scoping review. J. Res. Med. Sci.. 2015;20:1000-1006.
- [CrossRef] [Google Scholar]
- Phytochemical constituents and in vitro antidiabetic and antioxidant properties of various extracts of kenikir (Cosmos caudatus) leaves. Pharmacogn. J.. 2021;13:890-895.
- [CrossRef] [Google Scholar]
- Evaluation of metabolic profiles of patients with anorexia nervosa at inpatient admission, short- and long-term weight regain—descriptive and pattern analysis. Metabolites. 2021;11:7.
- [CrossRef] [Google Scholar]
- Impact of post harvest treatment on antioxidant activity and phenolic profile of Moringa oleifera lam leaves. Food Prod. Process and Nutr.. 2021;3:22.
- [CrossRef] [Google Scholar]
- Discovery of anthocyanin biosynthetic pathway in Cosmos caudatus Kunth. using omics analysis. Agronomy. 2021;11:661.
- [CrossRef] [Google Scholar]
- Ingol and ingenol-type diterpenes from Euphorbia trigona Miller with keratinocyte inhibitory activity. Plants. 2021;10:1206.
- [CrossRef] [Google Scholar]
- HPLC fingerprint analysis with the antioxidant and cytotoxic activities of selected lichens combined with the chemometric calculations. Molecules. 2020;25:4301.
- [CrossRef] [Google Scholar]
- Acute toxicity test of kenikir leaf (Cosmos caudatus H.B.K) ethanolic extract on Wistar white male rats with fixed dose procedure method and its effect on histopathology of pancreatic cells. J. Adv. Pharm. Technol. Res.. 2021;12:157-161.
- [CrossRef] [Google Scholar]
- Andrographis paniculata (Burm. F) Wall ex Nees: antiviral properties. Phytother. Res.. 2021;35:5365-5373.
- [CrossRef] [Google Scholar]
- Discrimination of Adzuki Bean (Vigna angularis) geographical origin by targeted and non-targeted metabolite profiling with gas chromatography time-of-flight mass spectrometry. Metabolites. 2020;10:112.
- [CrossRef] [Google Scholar]
- Antioxidant activity, phenolic compound contents and antimutagenic activity of some water extract of herbs. Thai. J. Pharm. Sci.. 2006;30:28-35.
- [Google Scholar]
- Enhancing recovery of bioactive compounds from Cosmos caudatus leaves via ultrasonic extraction. Sci. Rep.. 2021;11:17297.
- [CrossRef] [Google Scholar]
- Acetylcholineterase inhibitory and antioxidant properties of Rhododendron yedoense var. Poukhanense bark. J. Med. Plant Res.. 2011;5:248-254.
- [CrossRef] [Google Scholar]
- Cooking african pumpkin leaves (Momordica balsamina L.) by stir-frying improved bioactivity and bioaccessibility of metabolites-metabolomic and chemometric approaches. Foods. 2021;10:2890.
- [CrossRef] [Google Scholar]
- 1H-NMR-based metabolomics approach to understanding the drying effects on the phytochemicals in Cosmos caudatus. Food Res. Int.. 2012;49:763-770.
- [CrossRef] [Google Scholar]
- Ripe pulp metabolite profiling of ten Indonesian dessert banana cultivars using UHPLC-Q-Orbitrap HRMS. Eur. Food Res. Technol.. 2021;247:2821-2830.
- [CrossRef] [Google Scholar]
- Profile chemical compounds and antioxidant activity of Korean commercial vinegars produced by traditional fermentation. Chem. Pap.. 2021;75:2537-2547.
- [CrossRef] [Google Scholar]
- Using HPLC and multivariate analyses to investigate variations in the polyphenolic compounds as well as antioxidant and antiglycative activities of some Lamiaceae species native to Iran. Ind. Crops Prod.. 2020;154:112640
- [CrossRef] [Google Scholar]
- Salazar-Aranda, R., Pérez-López, L.A., López-Arroyo, J., Alanís-Garza, B.A., Waksman de Torres, N., 2011. Antimicrobial and antioxidant activities of plants from Northeast of Mexico. J. Evid. Based Complement. Altern. Med. 2011, Article ID 536139. https://doi.org/10.1093/ecam/nep127.
- Influence of extraction solvent on nontargeted metabolomics analysis of enrichment reactor cultures performing enhanced biological phosphorus removal (EBPR) Metabolites.. 2021;11:269.
- [CrossRef] [Google Scholar]
- Total phenolic content and antioxidant activity of Ulam raja (Cosmos caudatus) and quantification of its selected marker compounds: effect of extraction. Int. J. Food Prop.. 2017;20:260-270.
- [CrossRef] [Google Scholar]
- Quantification of rutin, quercitrin and quercetin in Cosmos caudatus Kunth by reverse phase high performance liquid chromatography. Qual. Assur. Saf. Crops Foods.. 2016;8:617-622.
- [CrossRef] [Google Scholar]
- A comparative study of the chemical composition, biological and multivariate analysis of Crotalaria retusa L. stem barks, fruits, and flowers obtained via different extraction protocols. S. Afr. J. Bot.. 2020;128:101-108.
- [CrossRef] [Google Scholar]
- Betulin suppresses TNF-α and IL-1β production in osteoarthritis synovial fibroblasts by inhibiting the MEK/ERK/NF-κB pathway. J. Funct. Foods.. 2021;86:104729
- [CrossRef] [Google Scholar]
- Influence of drying method on flavonoid content of Cosmos caudatus (Kunth) leaves. Res. J. Med. Plant.. 2011;5:189-195.
- [CrossRef] [Google Scholar]
- Essential oil composition, total phenolic, flavonoid contents, and antioxidant activity of Thymus species collected from different regions of Iran. Food Chem.. 2017;220:153-161.
- [CrossRef] [Google Scholar]
- MS-DIAL: data-independent MS/MS deconvolution for comprehensive metabolome analysis. Nat. Methods. 2015;12:523-526.
- [CrossRef] [Google Scholar]
- Untargeted metabolomics analysis using FTIR and UHPLC-Q-Orbitrap HRMS of two Curculigo species and evaluation of their antioxidant and α-glucosidase inhibitory activities. Metabolites. 2021;11:42.
- [CrossRef] [Google Scholar]
- Antioxidant activity of leaves extract of kenikir (Cosmos caudatus Kunth) with various extraction methods. Indones. J. Pure. Appl. Chem.. 2021;3:9-20.
- [CrossRef] [Google Scholar]
- Using MetaboAnalyst 3.0 for comprehensive metabolomics data analysis. Curr. Protoc. Bioinform.. 2016;55:14.10.1-14.10.91.
- [CrossRef] [Google Scholar]
- Antimicrobial stability of Cosmos caudatus extract at varies pH and temperature, and compounds identification for application as food sanitiser. Food Res.. 2021;5:83-91.
- [CrossRef] [Google Scholar]
- Rafi, M., Karomah, A.H., Septaningsih, D.A., Trivadila, Rahminiwati, M., Putri, S.P., Iswantini, D., 2022. LC-MS/MS based metabolite profiling and lipase enzyme inhibitory activity of Kaempferia angustifolia Rosc. with different extracting solvents. Arab. J. Chem. 15, 104232. doi:10.1016/j.arabjc.2022.104232.
Appendix A
Supplementary material
Supplementary data to this article can be found online at https://doi.org/10.1016/j.arabjc.2023.105065.
Appendix A
Supplementary material
The following are the Supplementary data to this article:Supplementary data 1
Supplementary data 1


