

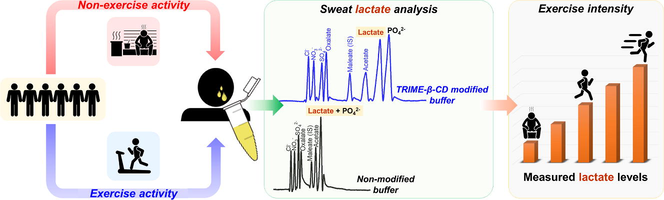
Measurement of sweat lactate levels in exercise and non-exercise activities using capillary electrophoresis system with contactless conductivity detection and cyclodextrin-modified buffer
⁎Corresponding author. rattikan.cha@mahidol.ac.th (Rattikan Chantiwas) rattikan.cha@mahidol.edu (Rattikan Chantiwas)
-
Received: ,
Accepted: ,
This article was originally published by Elsevier and was migrated to Scientific Scholar after the change of Publisher.
Abstract
Abstract
-
Two CDs (CM-β-CD, TRIME-β-CD) were investigated for buffer modification in anion separation using CE-C4D.
-
Validation parameters for the lactate analysis method described.
-
Analysis of sweat lactate conducted for two subgroups of perspiration activities: exercise and non-exercise (after sauna).
-
Sweat lactate levels as indicators of exercise intensity, with a proposed decision limit.
Abstract
This study presents the analysis of lactate in sweat using capillary electrophoresis with contactless conductivity detection. Two cyclodextrin (CD) compounds, carboxymethyl-β-cyclodextrin sodium salt (CM-β-CD) and heptakis (2,3,6-tri-O-benzoyl)-β-cyclodextrin (TRIME-β-CD), were evaluated as buffer modifiers for the separation of chloride, nitrate, sulfate, oxalate, maleate, acetate, lactate, and phosphate anions. The concentrations of these modifiers were tested at 0.05, 0.1, and 0.5 mM for eight anions separation. The buffer was 40.0 mM MES/L-His (pH 6.0) with 0.05 mM CTAB, resulting in anodic separation. Due to separation efficiency in resolving lactate and phosphate peaks, TRIME-β-CD at a concentration of 0.1 mM was selected as the suitable buffer additive for sweat lactate analysis. The calibration of the developed method, using maleate as an internal standard, resulted in the linear ranges of 0.1–5.0 mM, r2 of 0.9999, and an instrumental LOD of 0.042 mM. The intra-day and inter-day precisions of the relative migration time (RMT) were 0.3–0.4% and 3–4% RSD, respectively. Lactate levels in sweat samples from the same group of volunteers were measured after two distinct activities: exercise (after running) and non-exercise (after sauna). For non-exercise activities, lactate concentrations ranged from 15 ± 1 mM to 36 ± 2 mM. While, after exercise, the concentrations were between 26 ± 1 mM and 136 ± 1 mM. Further evaluation of the stability of sweat storage for monitoring lactate contents, it was found that the changes in lactate levels were insignificant when stored for up to 24 weeks at 4 °C. This was confirmed by paired t-tests (t-stat ragnes from -0.59 to 2.49; t-critical = 2.57, P = 0.05). The measured lactate concentrations from volunteers were significantly higher, approximately 2–6 times, in exercise activities compared to non-exercise activities. This substantial difference in lactate secretion indicates a clear distinction in the factors that stimulate sweat lactate production. To evaluate the intensity of exercise based on lactate levels in sweat, a proposed cut-off level of 36.0 mM, with a decision limit of 40.0 mM, can be proposed.
Keywords
Lactate
Sweat
Exercise
Cyclodextrin
Capillary electrophoresis
C4D

1 Introduction
Lactate anion is a by-product of anaerobic glucose metabolism (Derbyshire et al., 2012). Its levels in biological fluids such as blood, saliva, and sweat can be employed as a marker of the state of health (Jadoon et al., 2015), especially in sweat as collection of sweat is non-invasive (Derbyshire et al., 2012). The lactate in sweat is the product of glucose metabolism by the eccrine sweat gland under anaerobic conditions (Wolfe et al., 1970). These levels typically range from 5 to 20 mM (Bariya et al., 2018) and are influenced by physiological activity and anaerobic metabolism (Wolfe et al., 1970, Baker and Wolfe 2020).
Abnormal lactate levels can indicate certain medical conditions, such as metabolic disorders, where lactate levels may range from 33 to 57 mM in patients with pressure-induced ischemia (Taylor et al., 1994). Monitoring lactate levels in sweat can also provide information on an athlete's exertion level during training and help identify optimal training intensities to improve performance. During vigorous exercise, lactate levels can increase to 43–115 mM (Mitsubayashi et al., 1994).
Various analytical methods are available for lactate analysis in sweat, including nuclear magnetic resonance spectroscopy (Kutyshenko et al., 2011), colorimetric and electrochemical biosensors (Rattu et al., 2021), nonenzymatic sensors (Zaryanov et al., 2017), and high-performance liquid chromatography with UV detection (Biagi et al., 2012). High-performance capillary electrophoresis (CE) has also been developed for lactate analysis, employing both UV and contactless conductivity detection. While electrophoretic analyses with UV detection require derivatization (Bertaso et al., 2020) or the addition of Cu2+ ions to enhance separation selectivity (Makeeva et al., 2020), contactless conductivity detection has emerged as a promising technique with high sensitivity in CE, particularly for small ions (Law et al., 2005, Pormsila et al., 2011, Kubáň et al., 2013). This method has been used for lactate detection in various biological and non-biological samples, including vitamin C beverages (Law et al., 2005), plasma (Pormsila et al., 2011), and blood serum (Kubáň et al., 2013). Their LODs were 5.5, 3.2, and 2.2 μM, respectively and the lactate linearity were 0.03–2.2 mM and 0.01–1.0 mM.
Analysis of sweat for anions, including lactate, requires high separation efficiency due to the presence of various small ions, organic acids, and amino acids (Kubáň et al., 2019). CE has advantages for lactate analysis, as it requires small sample volumes, provides high separation efficiency, and has a short analysis time (Hauser and Kubáň 2020, Tůma 2022). Lactate levels in sweat can provide information about a person's health condition during hypoxia or exercise (Luo et al., 2021). Electrochemical detection has been used for the sensitive measurement of lactate levels. Table 1 summarizes previous reports on lactate measurement in sweat for both exercise and non-exercise activities (Fellmann et al., 1983, Mitsubayashi et al., 1994, Alvear-Ordenes et al., 2005). This table also presents four different methods used to measure sweat lactate levels. Among these methods, the lactate dehydrogenase (LDH) activity was employed for the conversion of lactate to pyruvate, which is an indirect approach (Fellmann et al., 1983, Alvear-Ordenes et al., 2005). The detection of lactate using spectrometric methods introduces potential reliability and specificity concerns (Fellmann et al., 1983, Alvear-Ordenes et al., 2005). Furthermore, sensor-based measurements of lactate can be affected by limitations in sensitivity and specificity. It is important to consider these factors when interpreting the results obtained from these methods. While the CE method with conductivity detection is an alternative and it is a promising analytical method for sweat lactate analysis due to its high separation efficiency, short analysis time, and small sample volume requirements (Hauser and Kubáň 2020, Tůma 2022). Capacitively Coupled Contactless Conductivity Detectors (or C4D) do not employ electrodes that come into direct contact with the solution, unlike conventional conductivity detectors. Instead, two narrow adjacent metal bands are placed close together around the detection end of the silica CE capillary. The separation between these bands is very small, typically in the mm range. When a high-frequency alternating electrical voltage is applied to one of these electrodes, it generates an alternating electrical current (AC) that is monitored. The magnitude of the AC is proportional to the conductivity of the solution within the capillary, specifically between the gaps of the two metal bands (Kubáň and Hauser 2004).
| Method | Detection | The mean of measured sweat lactate (mM) | The ratio of lactate levels(Ex./Non-ex.) | Total number of analyzed samples (Number of volunteers) |
Calibration range and LOD |
Ref. | ||
|---|---|---|---|---|---|---|---|---|
|
Non-exercise (n = number of samples) |
Exercise (n = number of samples) |
|||||||
| Gutmann and Wahlefeld’ method | ||||||||
| Measurement of lactate dehydrogenase (LDH) activity | Spectrometric |
ca. 21 mM (n = 1, Sedentary) ca. 20 mM (n = 1, Fit) ca. 19 mM (n = 1, Vary fit) |
21.71 mM (n = 1, Sedentary) 16.75 mM (n = 1, Fit) 12.83 mM (n = 1, Vary fit) |
ca. 1 | 3 (3) |
Range: NA LOD: NA |
(Fellmann et al., 1983) | |
| Test kit | ||||||||
| Measurement of lactate dehydrogenase (LDH) activity | Spectrometric |
ca. 8 mM (n = 15) |
ca. 8 mM (n = 15) |
1 | 15 (15) |
Range: NA LOD: NA |
(Alvear-Ordenes et al., 2005) | |
| Sensor | ||||||||
| Biosensor connected flow-injection system (Non-commercial): Measurement of lactate oxidase (LOX) activity | Amperometry | 22.1 mM (n = 4) |
115.8 mM (n = 4) |
5.2 | 8 (4) |
Range: 0.06 – 1.85 mM LOD: NA |
(Mitsubayashi et al., 1994) | |
| Capillary electrophoresis | ||||||||
| CE with TRIME-β‐CD modified buffer | Contactless conductivity |
24 mM (n = 6) |
94 mM (n = 6) |
4 | 12 (6) |
Range: 0.1 – 5.0 mM LOD: 0.042 mM |
This work | |
Abbreviation: NA; not available, and LOD; limit of detection.
Cyclodextrins (CDs) are cyclic oligosaccharides utilized as buffer additives in capillary electrophoresis, particularly for chiral separation. Their structural cavity can form inclusion complexes preferentially with one enantiomer over the other, leading to differences in their migration times and thus separation of the enantiomers (Escuder-Gilabert et al., 2014). CDs have a variety of functional groups, giving different types of chemical-physical interactions, enabling applications for a wide range of compounds. Non-ionic CDs have been commonly reported in previous studies, with detection by UV absorbance or electrical conductivity. Table 2 provides a summary of previous studies involving the use of cyclodextrins (CDs) to modify buffers for anion separation. The table lists the CD-modified buffers employed for anion separation, highlighting the CD types, concentrations, buffer compositions, and their effects on variables in different analytical applications (de Macedo et al., 2014; Law et al., 2005; Masár et al., 1999; Stathakis and Cassidy, 1998).
| Detection | Application | CD-modified buffer | Run buffer composition | Variable | Separation efficiency (N/m) and resolution (Rs) | Ref. | |||
|---|---|---|---|---|---|---|---|---|---|
|
CD type (exterior functional group, charged)/ chemical name (abbreviation) |
Concentration range | Run buffer | Concentration of CD | ||||||
| UV | NA | • α-CD (hydroxyl group, non-ionic charged)/ N.A. • β-CD (hydroxyl group, non-ionic charged)/ N.A. • γ-CD (hydroxyl group, non-ionic charged)/ N.A. |
0 – 40 mM (α- and γ-CD) 0 – 10 mM (β-CD) |
5 mM Na2CrO4, pH 7.9 | 17 mM (α-CD) |
Effect on anion mobility, EOF mobility, and resolution | NA | (Stathakis and Cassidy 1998) | |
| Contactless conductivity |
Iodide analysis in dietary and milk | • α-CD (hydroxyl group, non-ionic charged)/ N.A. | 25 – 90 mM | 7 mM succinate, 0.5 mM BTP, pH 3.55 with 0.2% w/v m-HEC | 75 mM (α-CD) |
Effect on migration time and anion mobility |
N/m: 6 – 18 × 104 m−1 for all pairs of peaks |
(Masár et al., 1999) | |
| UV | Iodide analysis in urine | • α-CD (hydroxyl group, non-ionic charged)/ N.A. | 0 – 70 mM | 180 mM LiOH, 180 mM H3PO4, pH 3.0 | 36 mM (α-CD) |
Effect on migration time, and anion mobility | NA | (Macedo et al., 2014) | |
| Contactless conductivity |
Acetate, lactate, benzoate, sorbate, and ascorbate in soft drinks and vitamin C tablets | • β-CD (hydroxypropyl group, non-ionic charged)/ hydroxypropyl β-CD (HP-β-CD) | 0.025 – 0.06%, (ca. 0.2 – 0.4 mM) |
10 mM His, 0.135 mM Tar buffer, pH 6.5 with 0.1 mM CTAB | 0.025% (ca. 0.2) mM (β-CD) |
Effect on resolution | Rs: ca. 2a and ca. 4b | (Law et al., 2005) | |
| Contactless conductivity |
Lactate analysis in sweat |
• β-CD (methyl group, non-ionic charged)/ heptakis(2,3,6-tri-O-methyl)-β‐CD (TRIME-β‐CD) • β-CD (carboxymethyl group, anionic charged)/ carboxymethyl β‐CD sodium salt (CM-β‐CD) |
0 – 0.05 mM | 40.0 mM MES/L-His buffer, pH 6.0, 0.05 mM CTAB | 0.1 mM (TRIME-β-CD) |
Effect on the migration time, plate number, and resolution |
N/m: 2.5 – 5.8 × 10⁴ m−1 Rs: 0.89 – 4.69 for all pairs of peaks |
This work | |
Abbreviation: Na2CrO4; sodium chromate, NA; Not Available, BTP; 1,3-Bis[tris(hydroxymetyl)methylamino]propane, m-HEC; methylhydroxyethylcellulose, LiOH; lithium hydroxide, H3PO4; phosphoric acid, His; histidine, Tar; tartaric acid, CTAB; cetyltrimethylammonium bromide, MES; 2-(N-morpholino)ethanesulfonic acid, L-His; L-Histidine.
We describe a method for analyzing sweat lactate using a TRIME-β-CD modified buffer for capillary electrophoresis with contactless conductivity detection (C4D). The method has been validated for measuring lactate in sweat samples and applied to samples collected from volunteers who participated in the exercise and non-exercise activities. The detected lactate levels can serve as an indicator of workout intensity, as heightened exercise intensity generally leads to elevated lactate production.
2 Experimental
2.1 Chemicals
Two cyclodextrin additives (Fine chemical grade) were obtained from Cyclolab (Budapest, Hungary), viz.: carboxymethyl-β-cyclodextrin sodium salt and heptakis(2,3,6-tri-O-benzoyl)-β-cyclodextrin. Sodium chloride, potassium nitrate, sodium sulfate, potassium oxalate, maleic acid, acetic acid, lactic acid, and potassium dihydrogen phosphate were of analytical grade (AR) and were purchased from Sigma-Aldrich (St. Louis, MO, USA). 2-(N-morpholino)ethanesulfonic acid (MES, 99% assay) was obtained from Acros Organics (USA). 3-(N-morpholino)propanesulfonic acid (MOPS, 98.5% assay, ultrapure grade), and 4-(2-hydroxyethyl)-1-piperazineethane sulfonic acid (HEPES, 99% assay) were acquired from Affymetrix Inc. (Ohio, USA). L-Histidine (L-His, 99.5% assay, BioUltra grade), cetyltrimethylammonium bromide (CTAB, biology grade), and boric acid (analytical grade) were supplied by Merck (Darmstadt, Germany). Orthophosphoric acid (85% assay, UNIVAR® Analytical Reagents) was obtained from Ajax Finechem Pty Ltd. (Australia).
2.2 Preparation of standard and buffer solutions
Standard working solutions of chloride, nitrate, sulfate, oxalate, maleate, acetate, lactate, and phosphate were prepared in ultrapure water by diluting individual 100.0 mM aqueous standard solutions to concentrations of 0.1, 0.3, 0.5, 1.0, 3.0, and 5.0 mM. The MES/L-His buffer was freshly prepared by diluting stock solutions of MES and L-His (150 mM each) to a concentration of 40.0 mM MES and 40.0 mM L-His (pH 6.0) with 0.05 mM CTAB. CTAB was added to reverse the EOF and allow for the migration reversal of anions. This buffer exhibits low conductivity and is commonly employed for CE-C4D works (Kubáň and Hauser 2004). The running buffer also contained two different CD additives, TRIME-β-CD and CM-β-CD, at concentrations of 0.05, 0.1, and 0.5 mM. Before use, the buffer solution was degassed by sonication.
2.3 Collection and preparation of sweat samples
The collection of sweat samples from volunteers was conducted with the approval of the Mahidol University Central Institutional Review Board (MU-CIRB 2020/116.1805). Six healthy volunteers, comprising 3 females and 3 males, were recruited for the study and provided written informed consent. Detailed information about the participants, including their gender, age, height, and weight, can be found in Table S1 of Supplementary Material A.
Two activities were performed to collect the sweat samples: a non-exercise activity after a 30-minute sauna session at 60 °C and 70% humidity, and an exercise activity after a 30-minute treadmill run covering a distance of 3.0 km. Before each activity, the volunteers were instructed to clean their skin using soap. Approximately 0.3–0.4 mL aliquots of sweat were directly collected from the face area and transferred into 0.5 mL microcentrifuge tubes. The collected sweat samples were then stored at a temperature of 4 °C until further analysis. Each sweat sample was prepared by diluting it with ultrapure water and adding an internal standard (1.0 mM maleate). For the non-exercise activity samples, a 25-fold dilution was performed, while a 50-fold dilution was applied to the exercise activity samples.
2.4 Capillary electrophoresis with Capacitively Coupled contactless conductivity detector (C4D)
The CE system was assembled in-house and connected to a contactless conductivity detector (C4D, eDAQ ET 120, Denistone East, NSW, Australia). The CE unit was placed in a Plexiglas box and connected to a micro switch that controlled the ON/OFF function of the high-voltage power supply unit (Spellman CZE1000R, Hauppauge, USA). The signal from the detector, measured in millivolts, was recorded using an E-corder (ED410, Denistone East, NSW, Australia) and analyzed using the eDAQ Chart software (eDAQ, Denistone East, NSW, Australia). A fused-silica capillary (360.0 µm o.d. and 50.0 µm i.d.) was provided by Polymicro Technologies (Phoenix, AZ, USA). A total length of 30.0 cm with an effective length of 18.5 cm was used for the capillary. Before analysis, the capillary was conditioned by sequentially flushing it with 0.1 M NaOH, ultrapure water, and the MES/L-His buffer for 5 min using a manual syringe pump. The hydrodynamic injection was performed by raising the inlet end of the capillary 7.5 cm higher than the outlet end for 3.0 s. A potential of −10.0 kV (a field strength of –333 V cm−1) was applied for the analysis.
3 Results and discussion
3.1 Application of cyclodextrin-modified buffers
Our study investigates the potential of TRIME-β-CD and CM-β-CD as new additives for anion separation (see Table 2). These CDs were chosen based on their commercial availability. While they have been extensively studied for enantiomeric separation, their application in anion separation remains unexplored. TRIME-β-CD is a non-ionic CD that has not been employed previously as a buffer modifier for anion separation. In contrast, CM-β-CD is an anionic CD type that has found application in various contexts involving anionic chiral compounds (Chankvetadze et al., 1995, Organero et al., 2007). Using the latter CD for anion binding might initially seem counterintuitive because of the intrinsic repulsion between similar charges. However, we hypothesized that using the CM-β-CD modifier buffer for anion separation is based on the degree of inclusion complexation strength. The anions with variation of distinct properties such as charge and size, exhibit diverse binding affinities. Despite the electrostatic repulsion, these anions can access the hydrophobic cavity of the CD, forming a host–guest complex. The resulting strength and stability of these complexes influence the anion migration.
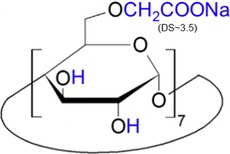
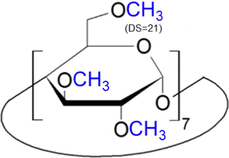
The eight anions (chloride, nitrate, sulfate, oxalate, maleate, acetate, lactate, and phosphate anions) are investigated for their migration affecting binding behavior with these two CDs. Table 3 presents their structures. As listed, TRIME-β-CD (carboxymethylated) and CM-β-CD (trimethylated) have distinct electrostatic properties due to their substituents. Fig. 1 shows the electropherograms of the separation of eight anions using CM-β-CD and TRIME-β-CD additives, see Fig. 1(A) and (B), respectively. The migration patterns of the anions exhibited varying separation characteristics. Slight changes in anion migration were observed at all concentrations of TRIME-β-CD (0.05, 0.1, 0.5 mM) as shown in Fig. 1B(b)–(d). However, regarding CM-β-CD, smaller changes in the migration times were observed for peaks 1–4 (chloride, nitrate, sulfate, and oxalate), as shown in Fig. 1A(b)–(d). On the other hand, significantly longer anion migration times were observed for peaks 5–8 (maleate, acetate, lactate, and phosphate) for CM-β-CD addition, Fig. 1A(b)–(d). These findings show that CM-β-CD has a pronounced effect on the migration of these latter anions. Broadening of peaks 7–8 (lactate and phosphate) was obtained when the amounts were more than 0.05 mM. The binding affinity of TRIME-β-CD with all the anions was lower compared to that of CM-β-CD. This translated into slight changes in the migration times of all anions when TRIME-β-CD was employed. To provide a clearer observation of these changes see Fig. 1C and 1D. The figures offer a clearer view of the changes in anion migration times in response to the concentrations of the CD.
| CM-β-CD | TRIME-β-CD | |
|---|---|---|
| Name (Abbreviation) |
Carboxymethyl-β-cyclodextrin sodium salt, (CM-β-CD) |
Heptakis(2,3,6-tri-O-methyl)-β-cyclodextrin, (TRIME-β-CD) |
| Structure |
|
|
Abbreviation: CD; cyclodextrin, DS; the average number of substituents per one CD molecule.
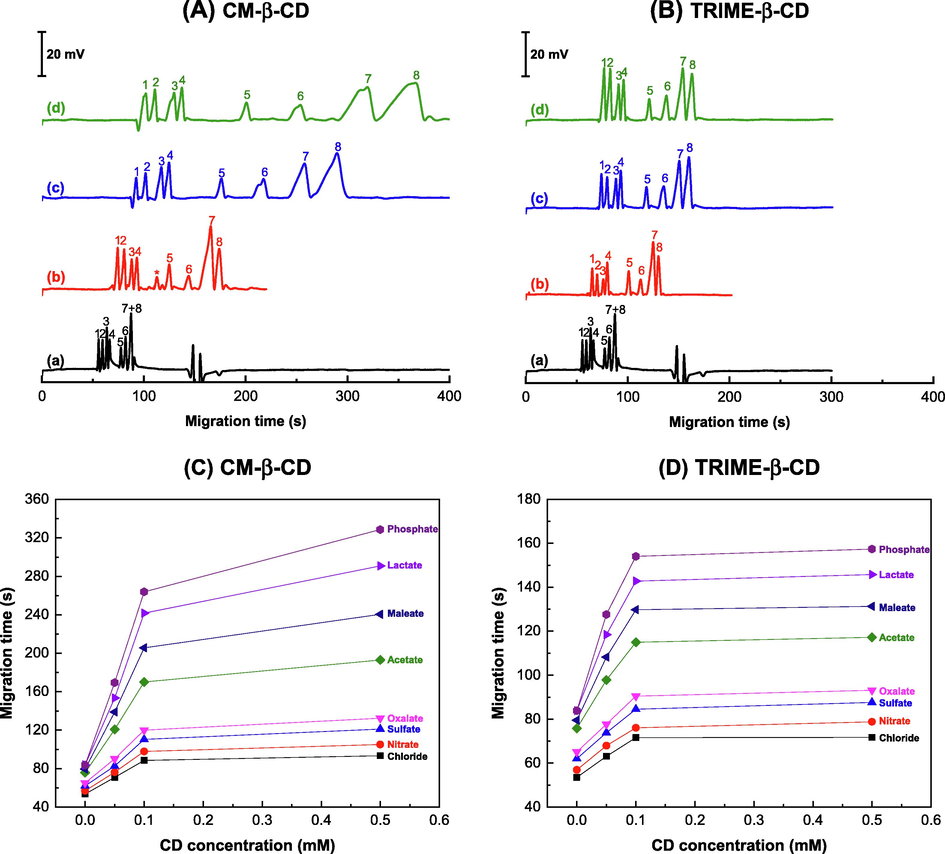
- Electropherograms of eight anions by capillary electrophoresis with C4D using buffer modified with CD additive: (A) CM-β-CD and (B) TRIME-β-CD at (a) 0 mM, (b) 0.05 mM, (c) 0.1 mM and (d) 0.5 mM. The migration times of the eight anions (chloride, nitrate, sulfate, oxalate, maleate, acetate, lactate, and phosphate) are plotted in response to the concentration of CD modification: (C) CM-β-CD and (D) TRIME-β-CD. Note: Lines connecting the points in the graph are included for visual clarity and do not represent any specific trends. The running buffer is 40.0 mM MES/L-His buffer (pH 6.0) containing 0.05 mM CTAB. Peak identification: 1. Chloride (0.3 mM), 2. Nitrate (0.3 mM), 3. Sulfate (0.3 mM), 4. Oxalate (0.4 mM), 5. Maleate (1.0 mM, IS), 6. Acetate (0.4 mM), 7. Lactate (1.0 mM), 8. Phosphate (1.0 mM), *unidentified peaks. (See Section 2.4. for CE conditions).
Based on the results, a concentration of 0.1 mM of TRIME-β-CD was chosen for modifying the buffers for anion separation. This modifier composition offers improved performance, as evidenced by the high separation efficiency (N/m) ranging from 2.5 to 5.8 × 10⁴ m−1 and resolution (Rs) ranging from 0.88 to 4.69, achieved for the eight analyzed anions. The inclusion of TRIME-β-CD resulted in narrow peaks with high resolution. It is essential to achieve effective separation of lactate and phosphate peaks, whichare anions contained in sweat (phosphate, chloride, and sulfate) (Maughan 1991). Hence selectivity in the separation of these anions is critical.
3.2 Measurements of lactate in human sweat
The lactate measurement method was validated following the US-FDA guidelines for the validation of bioanalytical methods (US-FDA Guidelines, 2018). The CE analysis with conductivity detection employed a running buffer consisting of 40.0 mM MES/L-His buffer (pH 6.0), which contained 0.05 mM CTAB and 0.1 mM TRIME-β-CD. The evaluated parameters included linearity, intra and inter-day precision, limit of detection (LOD), specificity, accuracy, and repeatability with the latter based on relative migration time (RMT), as detailed in subsequent sections.
3.2.1 Analytical characteristics of lactate analysis
Calibration curve: A calibration curve was constructed by plotting the mean of the lactate peak area ratio to the internal standard (IS) (1.0 mM maleate) against lactate concentrations ranging from 0.1 to 5.0 mM. The lactate peak area was measured across a wide concentration range of 0.1–5.0 mM, with consistent IS peak areas and high precision of migration time (131 ± 3 s with 2% RSD for the IS peak, and 172 ± 3 s with 2% RSD for the lactate peak) as shown in Fig. S1A (Supplementary Material B). The calibration curve demonstrated linearity with a regression equation of y = (4.18 ± 0.02)x + (0.43 ± 0.06) and a coefficient of determination (r2) of 0.9999 in the lactate concentration range of 0.1–5.0 mM, as depicted in Fig. S1B (Supplementary Material B).
Precision: The intra-day and inter-day precisions of the RMT and the peak area ratios for lactate quantitation were determined through five replicated injections (n = 5) of three standard lactate concentrations (0.1, 0.5, and 5.0 mM) with the addition of the internal standard (1.0 mM maleate). The injections were conducted on the same day for the intra-day precision and on three different non-consecutive days for the inter-day precision. The intra-day and inter-day precisions of the RMT were found to be within the range of 0.3–0.4% RSD and 3–4% RSD, respectively. Similarly, the intra-day and inter-day precisions of the peak area ratio were determined to be 3–4% RSD and 5–7% RSD, respectively (see Table 4). The% RSDs of the method fall within the acceptable range for analysis (<15% RSD) as specified by the US-FDA (US-FDA Guidelines, 2018).
| Lactate concentration |
Average of RMTa ± SD (% RSD), n = 5 |
Average of peak area ratio ± SD (% RSD), n = 5 |
||
|---|---|---|---|---|
| Intra-day | Intra-day | Inter-day | Inter-day | |
| Low (0.1 mM) | 1.28 ± 0.00 (0.3%) |
1.33 ± 0.05 (3.7%) | 0.38 ± 0.02 (4.0%) | 0.39 ± 0.02 (5.0%) |
| Medium (0.5 mM) | 1.34 ± 0.00 (0.3%) | 1.41 ± 0.06 (4.2%) | 2.48 ± 0.08 (3.2%) | 2.36 ± 0.15 (6.3%) |
| High (5.0 mM) | 1.48 ± 0.00 (0.4%) | 1.43 ± 0.05 (3.4%) | 21 ± 1 (4.2%) | 22 ± 2 (7.2%) |
Limit of detection: The instrumental limit of detection (LOD) was calculated using the equation 3×(SD of intercept)/(slope of calibration line) (Miller and Miller 2018). The obtained LOD value was determined to be 0.042 mM.
3.2.2 Measurement of lactate contents in sweat: Exercise activity (after treadmill running) and non-exercise activity (after sauna)
Sweat samples were collected from six volunteers who participated in two activities: a non-exercise activity and an exercise activity. The electropherograms of the sweat samples from the two activities are shown in Fig. 2(b) and 2(c), respectively, and were compared to the standard electropherograms of lactate, chloride, and maleate (IS) peaks (Fig. 2(a)). The lactate, chloride, and IS peaks were well separated in approximately 2.5 min. Spiking with a standard solution of lactate (1 mM) confirmed the lactate peak from the increase in peak height. The chloride peak in the sweat samples was also identified and analyzed using maleate as the IS. The mean chloride content of the samples was found to be 65 mM (n = 3). Moreover, peak specificity was established for lactate and phosphate to confirm that the identified lactate peak was not overlapped by any interfering substances.
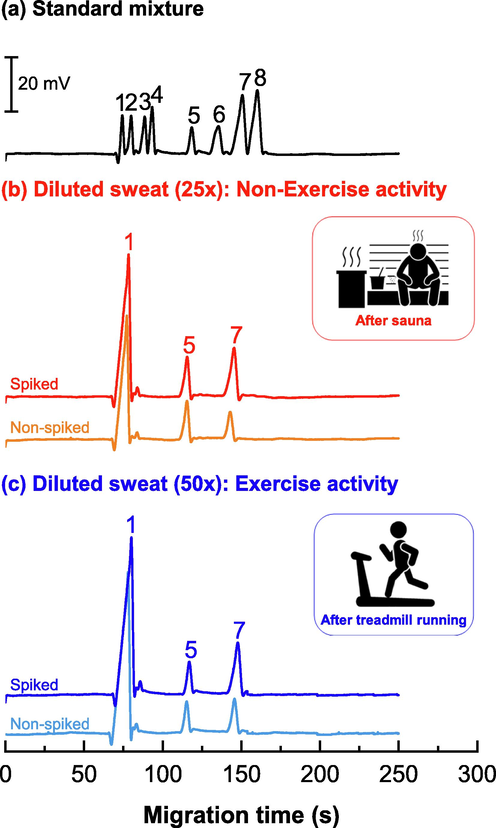
- Electropherograms of (a) a standard mixture of eight anions; (b) diluted sweat (25-fold) from a non-exercise activity (after sauna); (c) diluted sweat (50-fold) from an exercise activity (after treadmill running). The samples were spiked with standard lactate (0.5 mM) and maleate (1.0 mM, IS). Peak identifications: 1. Chloride (0.3 mM), 2. Nitrate (0.3 mM), 3. Sulfate (0.3 mM), 4. Oxalate (0.4 mM), 5. Maleate (1.0 mM, IS), 6. Acetate (0.4 mM), 7. Lactate (1.0 mM), 8. Phosphate (1.0 mM). The running buffer condition is 40.0 mM MES/L-His buffer (pH 6.0) containing 0.05 mM CTAB and 0.1 mM TRIME-β-CD. (See Section 2.4. for CE conditions).
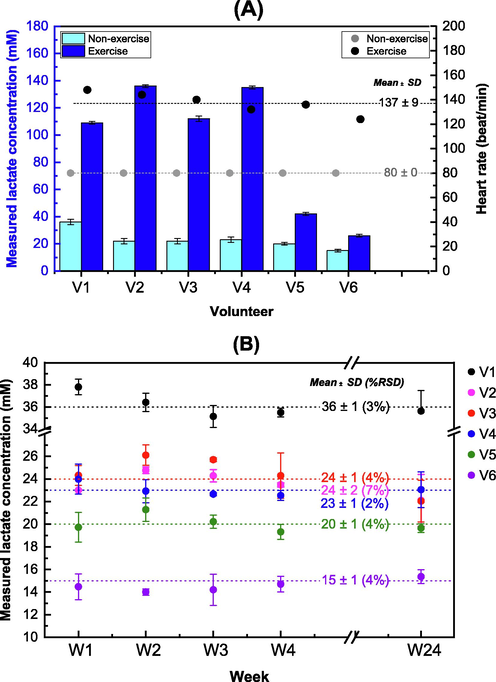
Lactate measurement and recovery study: Table 5 lists the measured lactate concentrations from the sweat samples collected from the non-exercise and exercise activities. The lactate values in the sweat samples collected from the non-exercise activity ranged from 15 to 36 mM (4% RSD), while those collected from the exercise activity ranged from 26 to 136 mM (4% RSD). Calculation of percent recoveries of spiked samples was carried out to determine the accuracy of the method. The percent recovery of the spiked diluted sample was calculated using the formula:% recovery = [[S1 - S2] / S0] × 100, where S0 is the peak area ratio of the spiked standard lactate solution, S1 is the peak area ratio of the spiked diluted sample, and S2 is the peak area ratio of the original diluted sample. Table 5 lists the percent lactate recoveries for all samples, which ranged from 80 ± 1 – 100 ± 2% (<1% RSD) for the non-exercise activity (n = 6) and from 100 ± 1 – 105 ± 1% (<2% RSD) for the exercise activity (n = 6). The mean heart rates were 80 ± 0 bmp (0% RSD, n = 6) and 137 ± 9 bmp (6% RSD, n = 6) for the non-exercise and exercise activities, respectively (refer to Fig. 3A, right y-axis). The bar plot in Fig. 3A overlays the lactate levels (left y-axis) obtained from the same volunteer for the two types of sweat formation activities. Table S1 in Supplementary Material A presents the heart rates of all volunteers measured during each activity. According to the bar graph, the lactate levels observed in all samples collected during the exercise activity were higher, ranging from 26 to 136 mM. The mean lactate value was 94 ± 48 mM (51% RSD, n = 6). In contrast, during the non-exercise activity, the lactate levels ranged from 15 to 36 mM, with a mean value of 24 ± 7 mM (30% RSD, n = 6) for the same group of volunteers.
| Sample | Lactate concentration (mM) | RMT ± SD | Percent recovery ± SD | Lactate in sample ± SD, n = 3 (mM) | ||
|---|---|---|---|---|---|---|
|
Diluted sample ± SD, n = 3 |
Spiked concentration | Spiked diluted sample ± SD, n = 3 | (% RSD), n = 3 | |||
| Non-exercise (after sauna) | ||||||
| V1 | 1.43 ± 0.07 | 1 | 2.40 ± 0.06 | 1.25 ± 0.02 (1.40%) | 96 ± 2 | 36 ± 2 |
| V2 | 0.88 ± 0.09 | 1 | 1.88 ± 0.09 | 1.24 ± 0.02 (1.20%) | 100 ± 1 | 24 ± 2 |
| V3 | 0.88 ± 0.07 | 1 | 1.87 ± 0.08 | 1.20 ± 0.02 (1.40%) | 100 ± 2 | 23 ± 1 |
| V4 | 0.92 ± 0.06 | 1 | 1.87 ± 0.05 | 1.20 ± 0.01 (0.95 %) | 95 ± 2 | 23 ± 2 |
| V5 | 0.80 ± 0.02 | 1 | 1.78 ± 0.03 | 1.25 ± 0.01 (0.96%) | 98 ± 1 | 20 ± 1 |
| V6 | 0.60 ± 0.02 | 1 | 1.44 ± 0.02 | 1.27 ± 0.02 (1.70%) | 80 ± 1 | 15 ± 1 |
| Exercise (after treadmill running) | ||||||
| V1 | 2.20 ± 0.02 | 0.5 | 2.70 ± 0.01 | 1.28 ± 0.02 (1.30%) | 105 ± 1 | 110 ± 1 |
| V2 | 2.70 ± 0.02 | 0.5 | 3.23 ± 0.02 | 1.24 ± 0.01 (1.00%) | 100 ± 2 | 136 ± 1 |
| V3 | 2.24 ± 0.03 | 0.5 | 2.75 ± 0.04 | 1.36 ± 0.01 (0.50%) | 100 ± 2 | 112 ± 2 |
| V4 | 2.70 ± 0.01 | 1 | 3.70 ± 0.01 | 1.32 ± 0.01 (1.05%) | 100 ± 1 | 135 ± 1 |
| V5 | 0.84 ± 0.01 | 1 | 1.88 ± 0.01 | 1.30 ± 0.00 (0.15%) | 104 ± 1 | 42 ± 1 |
| V6 | 1.05 ± 0.03 | 1 | 2.10 ± 0.02 | 1.32 ± 0.00 (0.30%) | 104 ± 2 | 26 ± 1 |
Note: Dilution factors for all samples were 25-fold and 50-fold for non-exercise and exercise activities, respectively.
The mean migration time values were between 134.28 ± 1.27 (0.95% RSD) and 141.50 ± 0.43 (0.30% RSD) for IS (maleate peaks), and between 169.00 ± 1.90 (1.12% RSD) and 185.26 ± 1.18 (0.64% RSD) for lactate peaks across all tested sweat samples. Each sample was injected in triplicate.
-
(A) Bar graphs of the sweat lactate concentrations from V1 to V6 (volunteers who participated in two activities: a non-exercise (after sauna) and an exercise (after treadmill running)) and scatter plots of heart rates from both activities. Dash lines are the mean values of the heart rate for both activities, with values of mean ± SD (n = 6). (B) Scatter plot showing the measured lactate concentrations of samples V1 – V6 at 1, 2, 3, 4, and 24 weeks of storage at 4 °C. The samples were collected from volunteers who participated in the non-exercise activity. Dash lines are the mean ± SD (n = 5) with% RSD.
Relative migration time: The RMT (n = 3 injections) of the lactate and IS peaks for all injected diluted sweat samples are listed in Table 5. The mean of RMT of the 12 samples was 1.27 ± 0.05 (4% RSD, n = 12), demonstrating the good repeatability of the CE system. The result could also be due to the conditioning of the capillary surface, particularly the rate of CTAB equilibration with the silica capillary surface which might be slow.
In summary, validation parameters included lactate linearity (0.01–5.0 mM, r2 = 0.9999), intra- and inter-day precision (< 4% RSD for RMT and < 7% RSD for peak area ratio), limit of detection (LOD) of 0.042 mM, percent recoveries (80–105%), and system repeatability (evaluated based on RMT < 4% RSD. The values of these parameters not only demonstrate the method's accuracy and reliability but also emphasize its practical suitability for quantifying lactate in human sweat with peak specificity.
3.2.3 Stability of sweat samples
The lactate levels of six sweat samples were measured over time, with storage times of 1 week (W1), 2 weeks (W2), 3 weeks (W3), 4 weeks (W4), and 24 weeks (W24), respectively. Fig. 3B illustrates the mean lactate content of the six samples determined in five replicates (n = 5). As shown the lactate content of the samples was found to be stable with% RSD of 2–7%. The values of V1–V6 were 36 ± 2, 24 ± 2, 23 ± 1, 23 ± 2, 20 ± 1, and 15 ± 1 mM, respectively. See Table S2 in Supplementary Material C for details. Paired t-tests for all pairs of weeks showed that there were no statistically significant differences in lactate levels between each pair of storage times (t-stat ranges from -0.59 to 2.49; t-critical = 2.57, P = 0.05) (See Table S3 in the Supplementary Material C for details.).
3.3 Comparison of lactate measurement methods for two activities (exercise and non-exercise) with a proposed decision threshold and potential applications
Table 1 provides an overview of previous methods utilized for the analysis of sweat lactate from both non-exercise and exercise activities. These methods employ various approaches and are characterized by the detection and levels of lactate measured, the number of analyzed samples, and the number of volunteers involved. The calibration range and limit of detection (LOD) for each method are also presented. Among these methods, Gutmann and Wahlefeld's method focuses on measuring LDH activity (Fellmann et al., 1983, Alvear-Ordenes et al., 2005), while the remaining methods primarily measure LOX activity (Mitsubayashi et al., 1994), see Table 1. Our method involves the utilization of capillary electrophoresis with buffer-modified TRIME-β‐CD for precise lactate measurement. Table 1 includes the calibration range and limit of detection (LOD) for our method, as well as for other methods, offering comprehensive information regarding their analytical performance. In addition to the comparison of methods, we evaluated the ratio of lactate levels measured between exercise and non-exercise conditions. The ratio values obtained ranged from approximately 1–5.2. Our developed method demonstrated a significant increase in mean lactate levels measured during exercise for the same group of volunteers, the mean lactate values were 94 ± 48 mM during exercise and 24 ± 7 mM during non-exercise activities, resulting in a four-fold increase. The results of our developed method demonstrate a significantly improved range in the measurement of sweat lactate levels. This method offers a broader linearity range (i.e., 0.1–5.0 mM) when compared to previous studies using CE-C4D (Law et al., 2005; Pormsila et al., 2011). This enables differentiation between the two types of activities, i.e., exercise and non-exercise, compared to previous methods (see Table 1 for details). These findings highlight the significant advancements and capabilities of various analytical methods in the analysis of sweat lactate. Nevertheless, the measurements of sweat lactate levels can be employed to indicate the intensity of exercise activity. This study suggests a decision level of 40.0 mM for sweat lactate, determined based on a cut-off level of 36.0 mM. This decision level is established by adding a guard band of + 1.645 × SD to the cut-off value, where SD is the standard deviation of the data at the cut-off value (WADA, 2019). Lactate levels in both sweat and blood are commonly associated with exercise intensity (McCaughan et al., 2000). With increased exercise intensity, lactate production rises, accumulating in the blood and subsequently becoming detectable in sweat. However, blood sampling is invasive with infection risks and requires a more complex, time-consuming lactate analysis method due to its matrix content. In contrast, a sweat sample offers straightforward markers of exercise physiology and performance evaluation. Our suggested decision threshold for sweat lactate is meaningful in evaluating exercise intensity levels. Further research involving a more diverse population and larger sample sizes as well as a broader range of exercise parameters, such as variations in exercise duration and levels of intensity would further strengthen the validity of this research.
4 Conclusion
This work presents a method for lactate analysis using capillary electrophoresis with C4D, incorporating TRIME-β-CD as a buffer modifier. The method exhibits excellent efficiency, with plate numbers ranging from 2.5 to 5.8 × 10⁴ m−1 and peak resolutions from 0.88 to 4.69. The analytical performance of the method is validated, with a calibration range of 0.1–5.0 mM, a coefficient of determination (r2) of 0.9999, and a limit of detection (LOD) of 0.042 mM. The method demonstrates good precision with intra and inter-day precision (<4% RSD for RMT and < 7% RSD for peak area ratio). Recovery studies indicate acceptable results, with recoveries ranging from 80 to 105%. System repeatability was indicated by an RMT with < 4% RSD. Additionally, the study investigated the stability of sweat samples stored for at least 24 weeks at 4 °C, showing no significant changes in lactate content based on paired t-tests. The measurement of sweat lactate levels in six volunteers during exercise activity (after treadmill running) and non-exercise activity (after sauna) is described. A decision limit of 40.0 mM is proposed to differentiate between exercise-induced sweat and heat exposure-induced sweat. The method shows considerable potential for accurately assessing exercise intensity and facilitating precise comparisons.
Declaration of Generative AI and AI-assisted technologies in the writing process
During the preparation of this work, the authors used Grammarly in order to improve the grammatical correctness and fluency of the sentences. After using this tool, the authors reviewed and edited the content as needed and take full responsibility for the content of the publication.
Acknowledgments
This project is supported by Mahidol University and is partially supported by the National Research Council of Thailand (NRCT) [NRCT5-RSA63015-18] and the International Research Network (IRN/502/2564). Thanks to the Center for Scientific Instrumentation and Platform Services, Faculty of Science, Mahidol University. The Science Achievement Scholarship of Thailand (SAST) is gratefully acknowledged for scholarships to AO. The Center of Excellence for Innovation in Chemistry (PERCH-CIC), and the Ministry of Higher Education, Science, Research, and Innovation are gratefully acknowledged for support.
Declaration of Competing Interest
The authors declare that they have no known competing financial interests or personal relationships that could have appeared to influence the work reported in this paper.
References
- Sweat lactate, ammonia, and urea in rugby players. Int. J. Sports Med.. 2005;26:632-637.
- [CrossRef] [Google Scholar]
- Physiological mechanisms determining eccrine sweat composition. Eur. J. Appl. Physiol.. 2020;120:719-752.
- [CrossRef] [Google Scholar]
- Lactate determination in human vitreous humour by capillary electrophoresis and time of death investigation. Electrophoresis. 2020;41:1039-1044.
- [CrossRef] [Google Scholar]
- Simultaneous determination of lactate and pyruvate in human sweat using reversed-phase high-performance liquid chromatography: a noninvasive approach. Biomed. Chromatogr.. 2012;26:1408-1415.
- [CrossRef] [Google Scholar]
- Enantiomeric resolution of anionic R/S-1,1′-binaphthyl-2,2′-diyl hydrogen phosphate by capillary electrophoresis using anionic cyclodextrin derivatives as chiral selectors. J. Chromatogr. A. 1995;704:234-237.
- [CrossRef] [Google Scholar]
- Lactate in human sweat: a critical review of research to the present day. J. Physiol. Sci.. 2012;62:429-440.
- [CrossRef] [Google Scholar]
- Cyclodextrins in capillary electrophoresis: Recent developments and new trends. J. Chromatogr. A. 2014;1357:2-23.
- [CrossRef] [Google Scholar]
- Human frontal sweat rate and lactate concentration during heat exposure and exercise. J. Appl. Physiol.. 1983;54:355-360.
- [CrossRef] [Google Scholar]
- Capacitively coupled contactless conductivity detection for analytical techniques – Developments from 2018 to 2020. J. Chromatogr. A. 2020;1632:461616
- [CrossRef] [Google Scholar]
- Recent developments in sweat analysis and its applications. Int. J. Anal. Chem.. 2015;2015
- [CrossRef] [Google Scholar]
- Capillary electrophoresis with contactless conductometric detection for rapid screening of formate in blood serum after methanol intoxication. J. Chromatogr. A. 2013;1281:142-147.
- [CrossRef] [Google Scholar]
- Capillary electrophoresis of small ions and molecules in less conventional human body fluid samples: a review. Anal. Chim. Acta. 2019;1075:1-26.
- [CrossRef] [Google Scholar]
- Contactless conductivity detection in capillary electrophoresis: a review. Electroanalysis. 2004;16:2009-2021.
- [CrossRef] [Google Scholar]
- Analyzing and mapping sweat metabolomics by high-resolution NMR spectroscopy. PLoS One. 2011;6:e28824.
- [CrossRef] [Google Scholar]
- Determination of vitamin C and preservatives in beverages by conventional capillary electrophoresis and microchip electrophoresis with capacitively coupled contactless conductivity detection. Electrophoresis. 2005;26:4648-4655.
- [CrossRef] [Google Scholar]
- A robust method for iodine status determination in epidemiological studies by capillary electrophoresis. Anal. Chem.. 2014;86:10010-10015.
- [CrossRef] [Google Scholar]
- Determination of native amino acids and lactic acid in Lactobacillus helveticus culture media by capillary electrophoresis using Cu2+ and β-cyclodextrins as additives. J. Chromatogr. B. 2020;1156:122304
- [CrossRef] [Google Scholar]
- Separations of inorganic anions based on their complexations with α-cyclodextrin by capillary zone electrophoresis with contactless conductivity detection. J. Chromatogr. A. 1999;834:179-188.
- [CrossRef] [Google Scholar]
- Fluid and electrolyte loss and replacement in exercise. J. Sports Sci.. 1991;9:117-142.
- [CrossRef] [Google Scholar]
- The Stability of Lactate Concentration in Preserved Blood Microsamples. Int. J. Sports Med.. 2000;21:37-40.
- [CrossRef] [Google Scholar]
- Statistics and Chemometrics for Analytical Chemistry. Pearson Education; 2018.
- Analysis of metabolites in sweat as a measure of physical condition. Anal. Chim. Acta. 1994;289:27-34.
- [CrossRef] [Google Scholar]
- Complexation effect of γ-cyclodextrin on a hydroxyflavone derivative: formation of excluded and included anions. J. Photochem. Photobiol. A Chem.. 2007;188:74-82.
- [CrossRef] [Google Scholar]
- Quantification of plasma lactate concentrations using capillary electrophoresis with contactless conductivity detection. Electrophoresis. 2011;32:884-889.
- [CrossRef] [Google Scholar]
- Lactate detection sensors for food, clinical and biological applications: a review. Environ. Chem. Lett.. 2021;19:1135-1152.
- [CrossRef] [Google Scholar]
- Control of relative migration of small inorganic and organic anions with cyclodextrins in capillary electrophoresis (CE) Can. J. Chem.. 1998;76:194-198.
- [CrossRef] [Google Scholar]
- The analysis of metabolites in human sweat: analytical methods and potential application to investigation of pressure ischaemia of soft tissues. Ann. Clin. Biochem.. 1994;31:18-24.
- [CrossRef] [Google Scholar]
- WADA Technical Document TD2019DL v. 2.0, 2019. https://www.wada-ama.org/sites/default/files/resources/files/td2019dl_v2_finalb.pdf (Accessed on 19 August 2023).
- Monitoring of biologically active substances in clinical samples by capillary and microchip electrophoresis with contactless conductivity detection: a review. Anal. Chim. Acta. 2022;1225:340161
- [CrossRef] [Google Scholar]
- US-FDA, 2018. Bioanalytical method validation guidance for industry. https://www.fda.gov/files/drugs/published/Bioanalytical-Method-Validation-Guidance-for-Industry.pdf (Accessed on 19 August 2023).
- Metabolic studies of isolated human eccrine sweat glands. J. Clin. Invest.. 1970;49:1880-1884.
- [CrossRef] [Google Scholar]
- Nonenzymatic sensor for lactate detection in human sweat. Anal. Chem.. 2017;89:11198-11202.
- [CrossRef] [Google Scholar]
Appendix A
Supplementary data
Supplementary data to this article can be found online at https://doi.org/10.1016/j.arabjc.2023.105255.
Appendix A
Supplementary data
The following are the Supplementary data to this article:


