

Translate this page into:
Metabolomic-based investigation of Yinlan alleviating hyperlipidemia by inhibiting blood stasis and phlegm turbidity through the PXR-CYP3A4-ABCB1-FXR pathway
⁎Corresponding authors at: 60 Hengfu rd., Guangzhou 510095, China. caolizhong1123@163.com (Li-Zhong Cao), cz04101103@hotmail.com (Zhao Chen)
-
Received: ,
Accepted: ,
This article was originally published by Elsevier and was migrated to Scientific Scholar after the change of Publisher.
Peer review under responsibility of King Saud University.
Abstract
Abstract
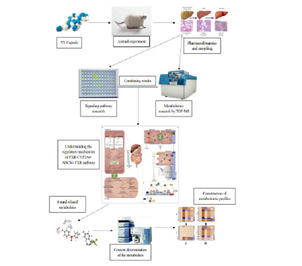
Yinlan lipid regulatory capsule (YL) is a composite traditional Chinese medicine (TCM) new drug to alleviate hyperlipidemia, while its therapeutic mechanism in vivo was not clarified with nontargeted metabolomics investigation. An animal model was established in rats fed a high-fat diet, and their body weights, body mass index (BMI) and blood cholesterol levels were measured. Serum, liver and kidney tissue samples were also extracted for PXR-CYP3A4-ABCB1-FXR signaling pathway research using PCR and UHPLC–MS. The obtained plasma samples were analyzed by UHPLC-Q-TOF-MS metabolomic investigation, which revealed PXR-CYP3A4-related metabolites and changes induced by YL. Finally, the key metabolites were chosen as index components, and their levels in the serum, liver, small intestine and bile were used for simultaneous UHPLC–MS-MS determination. The results indicated that YL was effective in rebalancing blood TG and TC levels (compared to controls). With respect to the PXR-CYP3A4-ABCB1 pathway, as a result of YL’s effect, gene expression or activity of the two targets decreased significantly in both the liver and kidney. The same trend was observed in the serum samples mentioned above. Metabolomics screening and data revealed that 44 metabolites can be regarded as biomarkers related to hyperlipidemia, fatty acids synthesis, and body energy consumption, as well as synthesis, transportation and exertion of cholesterol. YL’s treatment focused on 26 of them, primarily bile acids, indicating that the antihyperlipidemic effect of this drug lies in its inhibitory activity of cholesterol metabolism. Subsequent analysis of those in vivo components revealed that significant increases (compared to the model group) occurred in the blood, liver, small intestine and bile in groups that received medium and high doses of YL (while the low dose was relatively unchanged). Those target components exhibit a close relationship with PXR and/or CYP3A4. The use of YL repressed PXR expression and subsequently decreased CYP3A4 activity. As a result, synthesis of related bile acids increased, while cholesterol levels decreased, consequently leading to the attenuation of hyperlipidemia. This study comprehensively investigated the antihyperlipidemia mechanism of YL based on its repression of PXR-CYP3A4 activity and related metabolite yield, establishing an accurate method for evaluating the therapeutic effect of YL.
Keywords
Yinlan lipid regulatory capsule
Hyperlipidemia
PXR-CYP3A4
Metabolomics

- ABCB1
-
ATP binding cassette subfamily B member 1
- ADP
-
Adenosine diphosphate
- α-MCA
-
alpha-Muricholic acid
- AMP
-
Adenosine monophosphate;ATP, Adenosine Triphosphate
- BA
-
bile acid
- β-MCA
-
beta-Muricholic acid
- CA
-
Cholic acid
- CYP3A4
-
cytochrome P450 enzyme type 3A4
- CDCA
-
Chenodeoxycholic acid
- DCA
-
Deoxycholic acid
- ESI
-
electrospray ionization
- FXR
-
farnesoid X receptor
- GCA
-
Glycocholic acid
- GDCA
-
Glycodeoxycholic acid
- GHCA
-
Glycohyocholic acid
- GHDCA
-
Glycochenodeoxycholie acid
- GUDCA
-
Glycoursodeoxycholic acid
- HDCA
-
Hyodeoxycholic acid
- 3-keto-LCA
-
3-keto-Lithocholic Acid
- LCA
-
Lithocholic Acid
- OPLS-DA
-
orthogonal projections of latent structures discriminant analysis
- PCA
-
principal components analysis
- PLS-DA
-
partial least squares discrimination analysis
- PXR
-
pregnane X receptor
- TCCA
-
Trichloroisocyanuric acid
- TC
-
total cholesterol
- TCDCA
-
Taurochenodeoxycholic acid
- TCM
-
traditional Chinese medicine
- TDCA
-
Tauroursodeoxycholic acid
- THCA
-
Tetrahydrocannabinol acid
- TG
-
triglyceride
- THDCA
-
Taurosulodeoxycholic acid
- TIC
-
total ion current
- TUDCA
-
Taurocholic acid
- UDCA
-
Ursodeoxycholic acid
- YL
-
Yinlan lipid regulatory capsule
Abbreviations
1 Introduction
TCM treatments for metabolite diseases such as hyperlipidemia usually do not have acute but rather stable effects as chemical drugs, which focus more on adjusting or rebalancing the function of the organ and/or the whole body (Wang, et al., 2021; Chu, et al., 2015; Xie, et al., 2012). By increasing energy consumption to accelerate stored fatty acid decomposition or decreasing the synthesis of lipids and cholesterol, TCM attenuates symptoms of hyperlipidemia, lowering blood lipid levels (Chen, et al., 2021; Parks et al. (1999); Makishima, et al., 1999). Although traditionally, there is no typical discrimination of hyperlipidemia in TCM, like other antihyperlipidemia TCM medicines, YL’s treatment is based on relieving blood stasis and repelling phlegm turbidity, which corresponds to increased blood viscosity and cholestasis (Fiorucci, et al., 2022; Xie, et al., 2012; Ying, et al., 2020). However, despite the obvious therapeutic effects reported using TCM for antihyperlipidemia, questions arise regarding the mechanisms, target(s) and signaling pathways the component(s) of TCM regulate and the changes in metabolites caused by its use (Chen, et al., 2019).
YL is a TCM and new drug undergoing phase two clinical testing; it contains Exocarpium Citri Grandis, Folium Ginkgo, Gynostemma pentaphylla, and propolis. Traditionally explained by TCM theory, this formula reduces phlegm, repels stasis, strengthens Qi and promotes circulation and can be used to treat phlegm turbidity-type hyperlipidemia (in TCM) or hyperlipidemia with the complication of atherosis. In our previous studies (Chen, et al., 2021 and 2019), we reported that YL effectively reduces blood lipid levels, lowering both TG and TC (among which TC levels dropped more significantly than TG levels), and such activity has a stronger relationship with PXR than other targets that regulate lipid levels in the body. However, despite the abovementioned pharmacological effects and active targets, the signaling pathways affected by YL in treating hyperlipidemia still have gaps: (1) When PXR is regulated by components in YL, does it subsequently regulate the downstream gene(s) as a result? (2) What is the connection of changes in those targets, in other words, how is the signal translated? (3) What metabolite(s) will be changed in response to the PXR-related signaling pathway and to what extent? (4) What is the relationship among the metabolites and indices regulating blood lipid levels (such as TC and TG) during the course of hyperlipidemia treatment? (Patel et al., 2022; Hakkola et al., 2016).
To better understand the biological basis for YL’s attenuating of phlegm turbidity and blood stasis, a scientific and comprehensive path is needed to evaluate hyperlipidemia-related metabolites based on the primary regulatory pathway that YL influences (Thibaut, et al., 2022; Ferrel et al., 2021; Xie, et al., 2021). As indicated by previous studies, binding of regulatory components to PXR results in the generation of increased amounts of certain bile acids, such as UDCA, TCA, THCA and LCA, ect. which serve as ligands to regulate CYP activities, including CYP7A1 and CYP3A4 (Ke, et al., 2019; Li, et al., 2007; Russell, et al., 2003). Subsequently, repression of CYP3A4 reduces the synthesis of bile acids (BAs) that participate in the synthesis of cholesterol by suppressing hydroxylation of BAs and uptaking LCA, a BAs specified for activating other CYP enzymes (Qin, et al., 2021; Bartonkova, et al., 2018). Therefore, YL induces multiple in vivo changes along with the associated regulatory proteins, genes or enzymes, which will help us better understand YL’s therapeutic effect, signaling pathway, and key metabolites. Unlike targets such as LXR and FXR, which are primarily distributed in the liver, PXR exhibits much higher levels in the liver but also has marked expression in the kidney and spleen, and playing a critical role in the detoxification of bile acids, cholesterol metabolites, and xenobiotics by influencing CYPs in the liver (Kumagai, et al., 2016; Doricakova, et al., 2015; Bodin, et al., 2005). In other words, it is assumed that components in YL first affiliate with PXR in the liver, regulating CYPs distributed therein and resulting in interorgan signal transcription (kidney-liver) that subsequently affects the synthesis of cholesterol by reducing material and signal compounds such as bile acid(s), all of which ultimately provide antihyperlipidemia effects (Liu, et al., 2021).
Additionally, regulation of PXR alters the activity of ABC transporters, namely, ABCB1a and ABCB1b (Ticho, et al., 2019; Kliewer, et al., 2002). As defenders against molecular and xenotoxic drug entry, ABCB1a and ABCB1b do not directly deny the metabolism and transportation of bile acids; instead, transcription of these two targets is regulated by changes in their levels, which cause cholestasis that markedly affects bile acid metabolism (Biagioli, et al., 2021). Additionally, ABCB1a and ABCB1b are sensitive to xenobiotics and tend to induce the regulation of PXR expression after affiliation with xenobiotics, indicating a complicated signaling mechanism of transcriptional changes in cholesterol- and bile acid-related metabolism pathways (Biagioli, et al., 2021; Guo et al., 2003). Furthermore, changes in PXR-CYP3A4 expression and related variation in metabolites regulate ligands (mostly agonists) of FXR, exhibiting an obvious influence on FXR activity and subsequently decreasing cholesterol levels and stimulating its excretion (Zhang, et al., 2020; Yang, et al., 2018). Therefore, understanding the abovementioned variations in ABCB1a and ABCB1b is significant for elucidating the mechanism of YL’s influence on cholesterol metabolism, filling in a missing part of the puzzle.
Metabolomics is reported by various groups to be a helpful and powerful tool in pathology, signal transcription and investigating mechanisms of certain diseases and/or their therapy (using specifics treatments). During the course of their study, metabolites related to the expression/activity change(s) in the entire chain of signaling pathways of the target disease are involved. Using high-throughput, high-sensitivity analytical methods, such as UPLC-TOF-MS (with the help of a metabolomics database), those components will be identified and comprehensively screened to determine their variation in serum and/or tissue; after data processing of the obtained results, key metabolites influenced by changes in the expression and activity of the disease-related targets can be clarified, finally leading to an understanding of the therapeutic mechanism of the drug YL (Liu, et al., 2020; Zhu, et al., 2019; Wang, et al., 2018).
In this study, our efforts included pharmacology research that validated the antihyperlipidemia effect of YL, with the presentation of key physiology indices such as TG and TC levels and BMI. Subsequently, the expression of lipid metabolism-related targets such as PXR, CYP3A4, CYP7A1, ABCB1a, and ABCB1b in different animal experimental groups was compared to determine the signaling pathway of YL’s antihyperlipidemia effect, and metabolites related to the abovementioned targets were screened and identified. Using data analysis software (based on UPLC-Q-TOF-MS), the metabolomics profile of YL’s effect via PXR-CYP3A4 regulation was clarified. Finally, key metabolites were quantitatively analyzed to accurately and comprehensively investigate YL’s influence on cholesterol synthesis and transportation and its ability to reduce lipid levels.
2 Materials and methods
2.1 Materials
Decoction components (Exocarpium Citri Grandis, Folium Ginkgo, Gynostemma pentaphylla, and propolis) used for preparing the YL capsules were purchased from Zhixin Pharmaceutical Co., ltd. (Guangzhou, China). Acetonitrile, formic acid, methanol, ethanol, and DMSO, all of HPLC grade, were purchased from Merck (Darmstadt, Germany). Ultra-pure water from a Milli-Q water purification system (Millipore ltd., Massachusetts, USA) was used in all experiments. All other chemical reagents were of analytical grade and were produced by Guangzhou Chemical Reagent Co., ltd. (Guangzhou, China). Antibodies against ABCB1a (ab202976), ABCB1b (ab255605), and β-actin (ab8226) were all purchased from Abcam (Cambridgeshire, UK), primers of PXR, CYP3A4 and CYP7A1 was purchased from TaQ Biological (Dalian, China), Trizol RNA lysate was from Ding Guochangsheng Biotechnology Co. ltd, (Beijing, China), PerfectStart Green qPCR SuperMix was from TransGen Biotech Co., ltd, (Beijing, China), Evo M−MLV RT Premix for qPCR purchased from Ecorui Bioengineering Co., ltd (Hunan, China).
2.2 Animal experiments and sample collection
Thirty-six healthy Sprague–Dawley (SD) rats, equal numbers of both sexes, were provided by the Experimental Animal Center of Guangzhou University of Chinese Medicine (Guangzhou, China, license: SYXK (Yue) 2018–0085). The animals were housed under standard conditions (room temperature, 22 ± 2 °C; humidity, 55 ± 5 %). The animal welfare and experimental procedures were supervised and approved by the Animal Ethics Committee of Guangzhou University of Chinese Medicine.
Before the experiment (oral administration), all rats were administered a high-fat diet continuously for 30 days, except for 6 rats that were fed a normal diet and used as controls. Next, TG and TC levels of the rats on a high-fat diet were measured, and those with obvious increases in the values were chosen as the model. Then, the model animals were divided into several groups (6 rats each, equal numbers in each sex): (1) model reference, in which the rats were administered a normal diet only; (2) positive control group, in which rats were administered a normal diet and atorvastatin tablets (diluted in distilled water) at a dose of 0.9 mg/kg crude drug; (3) YL low dose, in which rats were administered a normal diet and YL capsules equivalent to 36 mg/kg crude drug; (4) YL high dose, in which rats were given a normal diet and YL capsules equivalent to 72 mg/kg crude drug. After 30 days of the experiment and subsequent lipid level tests, all groups, including the control, were sacrificed to collect blood, liver, kidney and intestine, and the obtained biological samples were stored T −20 °C until further use.
2.3 Expression of cholesterol metabolism-related targets
Serum (extracted from rat blood samples by centrifugation at 13000 rpm), kidney, liver and intestine samples from each group (see “Animal experiments and sample collection” section) underwent RT-Q-PCR analysis to evaluate changes in cholesterol targets caused by YL. Serum/tissue samples were processed in TRIzol RNA extraction reagent according to the manufacturer’s instructions (Invitrogen™, Thermo Fisher Scientific, USA) for total RNA isolation. Assessment of total RNA was performed using a Varioskan Flash scanning digital reader (Thermo-Fisher Scientific, San Jose, CA, USA). The kit included components such as RT Enzyme Mix, SYBR Green Master Mix and Rox reference dye. The treated samples were transferred into 96-well plates and placed in an IQTM5 RT-Q-PCR system (Bio–Rad, Hercules, CA, USA) for subsequent analysis. All target mRNA (PXR, FXR, CYP3A4, CYP7A1) transcript levels (fold changes) were normalized to β-actin and quantified using the 2-ΔΔCt method.
2.4 Activity tests for each target using western blot
The obtained samples were homogenized in RIPA lysis buffer containing a blended protease inhibitor. Referring to our previous report (Chen et al., 2019), the homogenized solution was first centrifuged (4 °C, 13000 rpm) to acquire the supernatant, followed by quantification of protein concentration using a BCA assay; then, a certain amount (60 μg) of the protein was separated by SDS–PAGE. After separation, the samples were transferred to PVDF membranes (0.2 μm, Bio–Rad) and blocked in 5 % BSA in 0.1 % Tween 20 (TBST) for 2 h; subsequently, membranes were incubated with the following primary antibodies: ABCB1a, ABCB1b, and β-actin. After incubation (overnight at 4 °C), the secondary antibody (IgG-HRP) was added and incubated at room temperature (22 °C) for 60 min. Finally, the membranes were processed using an ECL kit (Thermo-Fisher Scientific, San Jose, CA, USA) and quantified using a Varioskan Flash scanning digital reader. Protein expression was assessed by densitometric analysis of the loading control (β-actin).
2.5 UPLC-TOF-MS detection and metabolite identification
Serum and tissue samples obtained from each experimental group were prepared by protein precipitation: 100 μl of serum or homogenized tissue sample was transferred into a 1.5 ml EP tube, and 300 μl acetonitrile was added. The resulting solution was then centrifuged (4 °C, 13000 rpm) for 10 min, followed by collection of 300 μl of the supernatant into a new 1.5 ml EP tube. The obtained clear solution was dried using nitrogen and redissolved in 100 μl methanol containing 100 ng/ml piperine.; Finally, the sample solution was centrifuged (4 °C, 13000 rpm) for 5 min, and 80 μl of the supernatant was used for UPLC-TOF-MS analysis.
For UPLC-TOF-MS analysis, the chromatographic conditions were as follows: a Waters BEH C18 column (2.1X100 mm, 1.7 μm, Waters, MA, USA) was used with a mobile phase consisting of 0.1 % formic acid (A) and acetonitrile (B). The gradient elution procedure was 0–3 min, 5–60 % B; 3–12 min, 60–80 % B; 12–14 min, 80–90 % B; 14–15 min, 90–100 % B; 15–18 min, 100 % B; and 18 to 22 min, 100 % − 5 %B. The column temperature was 35 °C, and the flow rate was 0.3 ml/min. The mass spectrum conditions were as follows: positive and negative ions were simultaneously scanned, and the mass charge ratio was in the range of 50–1500 Da. The spray voltage was 4500 V, and the vaporization temperature was 500 °C. The collision was 35 eV, the dissociation voltage was 100 V, the ion source pressure was 55 psi, and the nitrogen curtain pressure was 35 psi. The remaining settings were instrument presets. The obtained atlas and data were imported into AB Sciex Analyst Software 1.6 for analysis, and its standard procedure was used to identify the peaks to provide information on the components (ion pair and retention time).
2.6 Metabolomics profiling based on UPLC-TOF-MS data
To identify differences in the peaks in various pharmacological experimental groups, data obtained in the “UPLC-TOF-MS detection and metabolite identification” section were transected to the SIMCA software package (version 14.1, Umetrics, Sweden). Statistical analysis was performed as follows: the matrices first underwent Pareto scaling (par transformation); then, multivariable statistics, such as principal component analysis (PCA), partial least-squares discrimination analysis (PLS-DA), and orthogonal projections of latent structures discriminant analysis (OPLS-DA), were performed to determine the relationship among experimental groups, as well as differences in the forms of the type and content of the metabolites.
The established OPLC-DA model was validated and evaluated for applicability using the permutation test. The significance of each variable was evaluated using Student’s t test, and the processed values were categorized using the following criteria: metabolites with variable importance in projection (VIP) values > 1.0 in the OPLS-DA model and p < 0.05 in the t test were selected as candidate biomarkers, while others were excluded. In addition, |P (corr)| ≥ 0.5 in the S-plot was set as the standard for the variables, and the values fulfilled were regarded as those most correlated with OPLS-DA discriminant scores. This step significantly reduces the possibility of selecting a false biomarker candidate.
Peaks detected in UPLC-TOF-MS analysis were processed using MS-Dial (version 3.7) to identify components in the peaks of the TIC chromatogram, and the given prediction was analyzed in combination with related literature. Raw data acquired from MS were converted using an ABF converter ( http://www.reifycs.com/AbfConverter/) before being imported into MS-Dial. Data analysis parameters were as follows: RT, 0–22 min; mass range, 50–1500 Da; MS1 tolerance, 0.01 Da; and MS2 tolerance, 0.05 Da. The parameters for peak detection were as follows: smoothing method, linear weighted moving average with smoothing level of two scans; minimum peak width, five scans; minimum peak height, 1000 amplitude; mass slice width, 0.1 Da; and exclusion mass list, none. The parameters for metabolite identification were RT tolerance, 2 min; MS1 accurate mass tolerance, 0.01 Da; MS2 accurate mass tolerance, 0.05 Da; and identification score cut off, 80 %. Using the databases, the Human Metabolome Database (HMDB) (https://www.hmdb.ca), Metlin (https://metlin.scripps.edu/) and Massbank (https://massbank.eu/MassBank/), the MS and MS-MS spectra were accurately compared to identify metabolites in the process of MS Dial analysis. For the discovery and identification of possible cholesterol metabolism and transportation pathways in which the abovementioned biomarkers are involved, the metabolomics information was processed in KEGG and SMPDB, and based on those metabolomics databases, the mechanism and dynamics of the potential pathway were determined by Metaboanalyst 4.0 (https://www.metaboanalyst.ca/faces/home.xhtml). The threshold of pathway impact (calculated from topology analysis) was set as 0.1, and values above that were selected as potential signaling pathways.
2.7 Determination of target-related metabolites in vivo
Metabolites identified in the UPLC-TOF-MS analysis mentioned above were set as indices, and a UHPLC–MS-MS method was established for their in vivo assessment. Analysis was performed in a Thermo TSQ Quantum UHPLC–MS-MS (Thermo-Fisher, San Jose, USA) with a Phenomenex C18 column (2.1X150 mm, 1.7 μm, Torrance, CA, USA). Pretreatment of plasma samples was performed according to the method described in “UPLC-TOF-MS detection and metabolite identification”. The obtained sample solution was injected into a UHPLC–MS-MS instrument, which was operated under ESI mode, detecting both positive and negative ions. The spray voltage was 3500 V, the vaporization temperature was 350 °C, the capillary temperature was 300 °C, the sheath gas pressure was 30 psi, the auxiliary gas pressure was 10 psi, and the skimmer offset was 1 V. Parameters affecting the signal strength and specificity of each metabolite, including ion pair, tube length offset and collision energy, were optimized using TSQ maters software (Thermo-Fisher, San Jose, USA), and the optimum conditions for their detection are listed in Table 1, with a representative TIC chromatogram shown in Fig. 1.
Compound
Mass parameters
Polarity
Parent (m/z)
Fragment (m/z)
Retention time (min)
Tetrahydrocannabinol acid
343.200
229.200
5.830
–
Glycocholic acid
464.623
446.290, 402.230, 382.273
6.800
–
Glycohyocholic acid
464.630
446.290, 402.230, 382.273
10.960
–
Tauroursodeoxycholic acid
498.700
480.281, 355.261
9.500
–
Taurocholic acid
514.710
80.200, 106.900, 124.100
7.150
–
Cholic acid
407.570
289.267, 345.270, 343.277
9.840
–
Chenodeoxycholic acid
391.570
322.800, 326.900, 343.100
12.760
–
Taurochenodeoxycholic acid
498.704
480.281, 355.261
0.760
–
Glycodeoxycholic acid
448.307
74.200, 386.100, 402.100
7.210
–
Glycoursodeoxycholic acid
448.620
74.200, 386.100, 402.100
8.010
–
alpha-Muricholic acid
407.570
289.267, 345.270, 343.277
7.740
–
beta-Muricholic acid
407.570
289.267, 345.270, 343.277
8.270
–
Glycochenodeoxycholie acid
448.623
74.200, 386.100, 402.100
12.470
Taurosulodeoxycholic acid
514.710
80.200, 106.900, 124.100
5.280
–
Trichloroisocyanuric acid
232.410
Hyodeoxycholic acid
391.580
322.800, 326.900, 343.100
13.400
–
Lithocholic Acid
375.570
282.900, 358.800,375.000
15.110
–
Deoxycholic acid
391.570
322.800, 326.900, 343.100
8.910
–
Ursodeoxycholic acid
391.570
322.800, 326.900, 343.100
9.360
–
3-keto-Lithocholic Acid
374.557
282.900, 358.800, 374.900
4.210
–
Adenosine Triphosphate
507.180
136.030
3.310
–
Adenosine diphosphate
427.200
136.030
3.280
–
Adenosine monophosphate
347.220
136.030
3.340
–
Hypoxanthine
136.110
136.030
4.210
–
Adenosine
267.240
136.030
4.233
–
Inosine
268.230
135.000
3.272
–
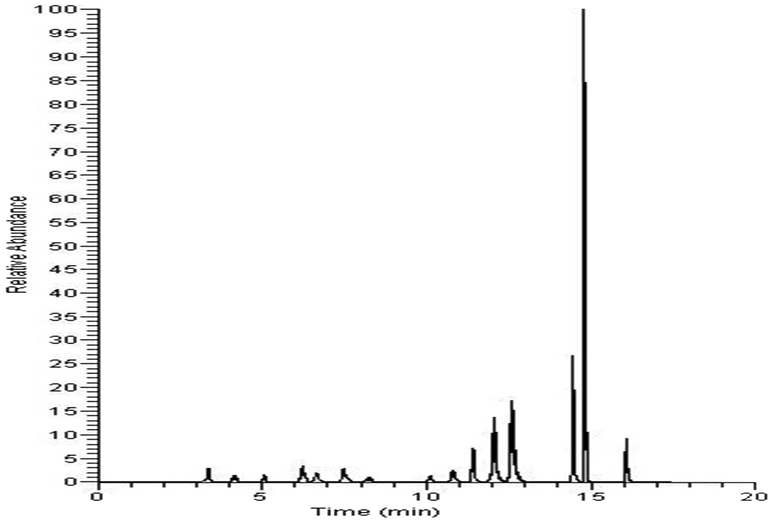
TIC chromatogram of serum samples (representative); for details of the components, see Table 1.
After determining standard and sample solutions, the peak area of each index component was used to calculate the concentration of those metabolites identified in the acquired biological samples (serum, kidney, liver and intestine) and analyzed for significant differences among the different groups. The results reveal the regulatory mechanism of YL on cholesterol metabolism and transportation.
2.8 Statistics and data processing
Calculation of the obtained data, including the results of pharmacodynamics, mRNA expression and metabolite contents, was performed using SPSS 20.0 (Chicago, IL, USA), and the results are presented as the mean ± SD (n ≥ 3). The statistical method used was one-way ANOVA followed by Dunnett’s t test using SPSS. Groups of values with significant differences are marked as p < 0.05, while the opposite groups are marked as p > 0.05.
3 Results
3.1 YL’s therapeutic effect on hyperlipidemia
The effect of the drug administered to different groups of rats was evaluated by its ability to reduce TG and TC levels. Blood was collected from the rats, and their TG and TC concentrations were measured as described in the manufacturer’s instructions for the lipid analysis kit (Kexin Biotec Inc., Shanghai, China). The statistical results showed that YL effectively reduced both TG and TC levels in the medium- and high-dose groups, while the low-dose group only had a significant effect on TC. These effects were not comparable to those of the positive control (p > 0.05, in TC), yet the difference between the high-dose and positive control groups was relatively small (Fig. 2). The results of the other two groups also indicated that YL was relatively more effective in reducing TC levels than TG levels, which initially validated our hypothesis of YL’s emphasis on cholesterol metabolism and transportation.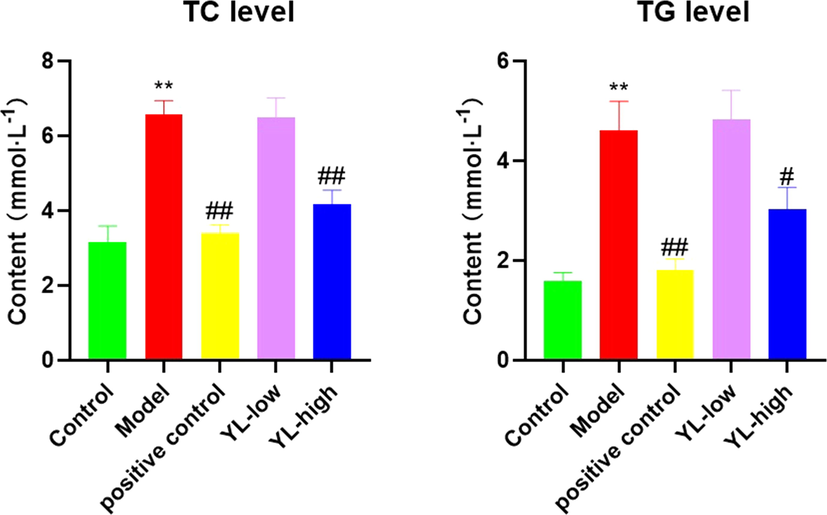
Lipid levels (both TC and TG) in each experimental group, compared to control, *<0.05, **<0.01; compared to model, #<0.05, ##<0.01.
Histology results corresponded to the changes in rat lipid levels. A clear cavity was observed in the liver of the model group, with severe damage to the core. Inferred from the images of the administration group administered different doses of YL, repair of the abovementioned damage occurred, and the condition of the liver improved as the dose increased, demonstrating the dose-dependent therapeutic effect of YL (Fig. 3, Fig. 4).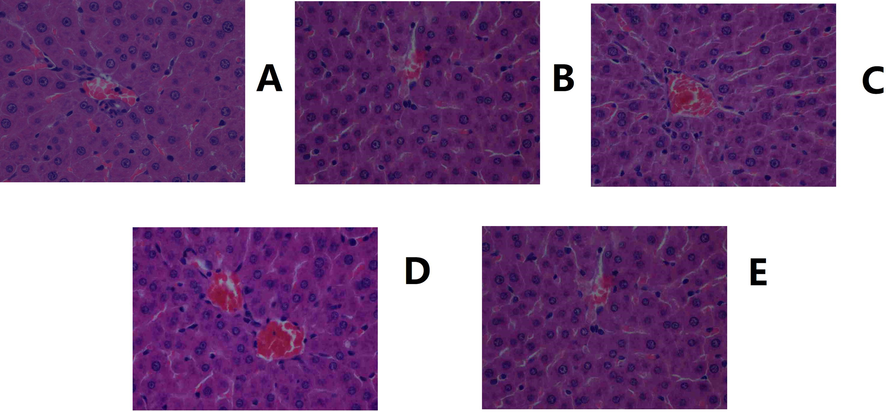
Histological images of the liver. A. Control. B. Model. C. Positive control. D. YL high dose. E. YL low dose (400X magnification).
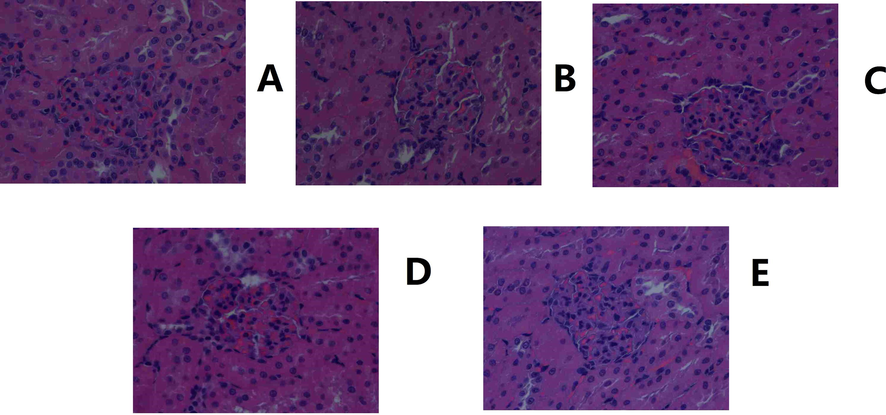
Histological images of the kidney. A. Control. B. Model. C. Positive control. D. YL high dose. E: YL low dose (400X magnification).
3.2 Expression of lipid regulatory targets in response to YL administration
The results of RT-Q-PCR (in both the liver and kidney) indicated that PXR expression obviously increased in the model group compared to the control (p < 0.05). For the positive control and administration groups, the values dropped significantly (p < 0.05, except for the YL low dose), and that of the YL groups increased as the YL dose increased, indicating that the antihyperlipidemia effect and PXR repression activity of YL were dose-dependent (Fig. 5). With respect to differences between individual organs, we observed insignificant variation, indicating that the relative expression for control vs model and model vs administration in both organs were roughly the same.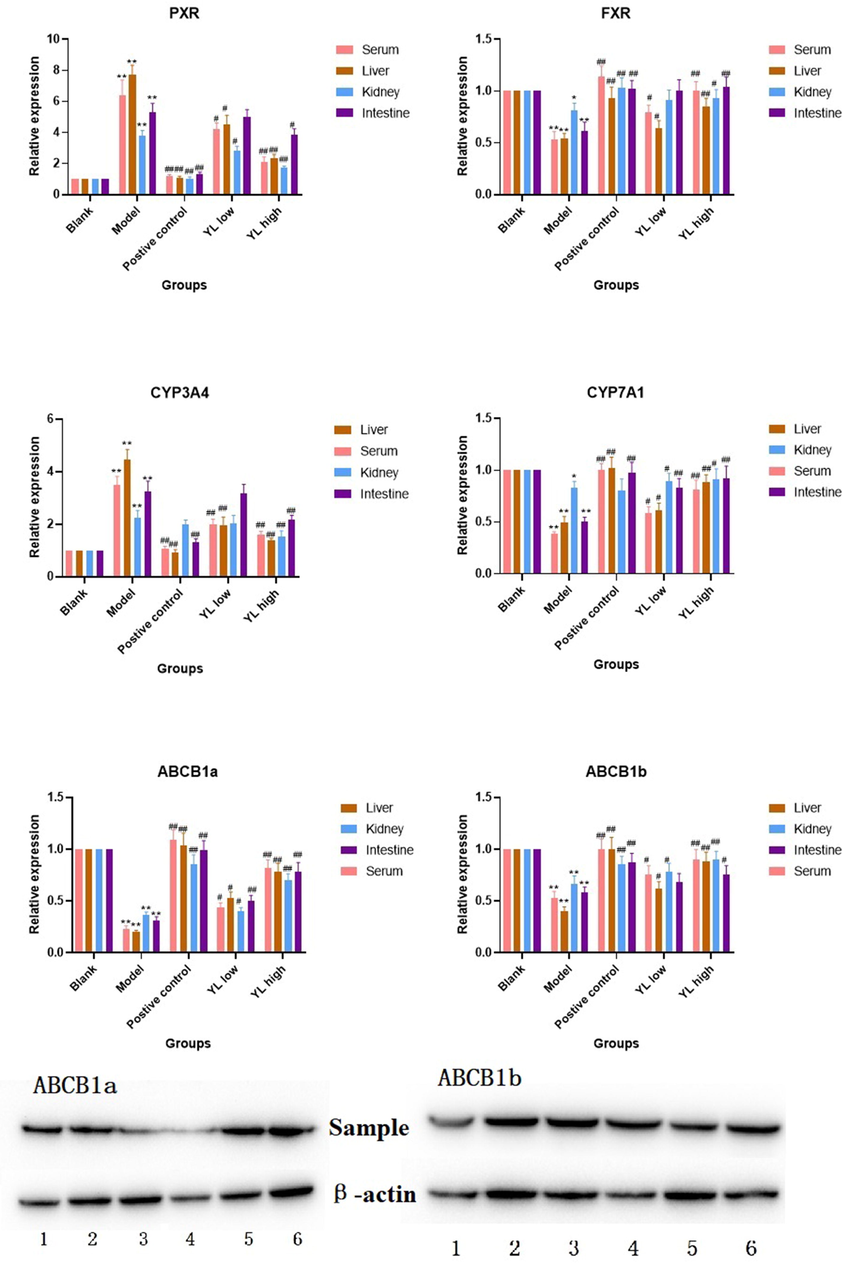
Relative expression of targets in each experimental group, compared to control, *<0.05, **<0.01; compared to model, #<0.05, ##<0.01. For Western-Blot image, ABCB1a: 1. Blank, 2. Positive control, 3 and 4. Model, 5. YL low dose, 6. YL high dose; ABCB1b: 1. Model, 2. Blank, 3. Positive control, 4. YL high dose, 5 and 6. YL low dose.
A similar observation was made in the PCR and Western blot tests (in the liver) for FXR, CYP3A4, CYP7A1, ABCB1a, and ABCB1b. The expression of CYP3A4 also decreased with the inhibition of PXR by YL, and this activity was more sensitive than that of the latter (Fig. 5). Additionally, the extent of downregulation was closely related to the increase in dose. Decreased PXR expression led to significantly higher activation of FXR in the administration groups (all doses) compared to the model and subsequently stimulated the so-called “classic” cholesterol pathway. On the other hand, both ABCB1a and ABCB1b had higher values at all YL doses compared to the model but with a relatively milder increasing trend with increasing dose (Fig. 5).
3.3 Statistical results of the metabolomics data
Based on the satisfactory antihyperlipidemia effect of YL, after our discovery of its primary active targets, to achieve a deeper and more comprehensive understanding of the signaling mechanism of PXR-CYP3A4-ABCB1, different groups of rats, such as the control, model, and administration groups mentioned in the “Animal experiment and sample collection” section, underwent a metabolomics study based on UPLC-TOF-MS determination of PXR-CYP3A3-ABCB1-related in vivo substances in the serum, kidney, liver and intestine.
Serum and tissue samples obtained from all experimental groups were used as representatives, and TIC chromatograms for both negative and positive ions are presented. As shown in Fig. 6, obvious changes occurred in those groups due to significant changes in their corresponding metabolite content. Some metabolites exhibited obviously higher or lower in vivo concentrations compared to other groups, while for others, the change overlapped with the signals of other metabolites but could still be judged from the obtained peak area data. Such changes were recorded and calculated to reveal the metabolomic variation caused by hyperlipidemia and/or YL treatment. Along with the identification of peaks in TIC chromatograms, a clear map of metabolites and the biological basis of YL’s antihyperlipidemia activity via PXR-CYP3A4-ABCB1 was created.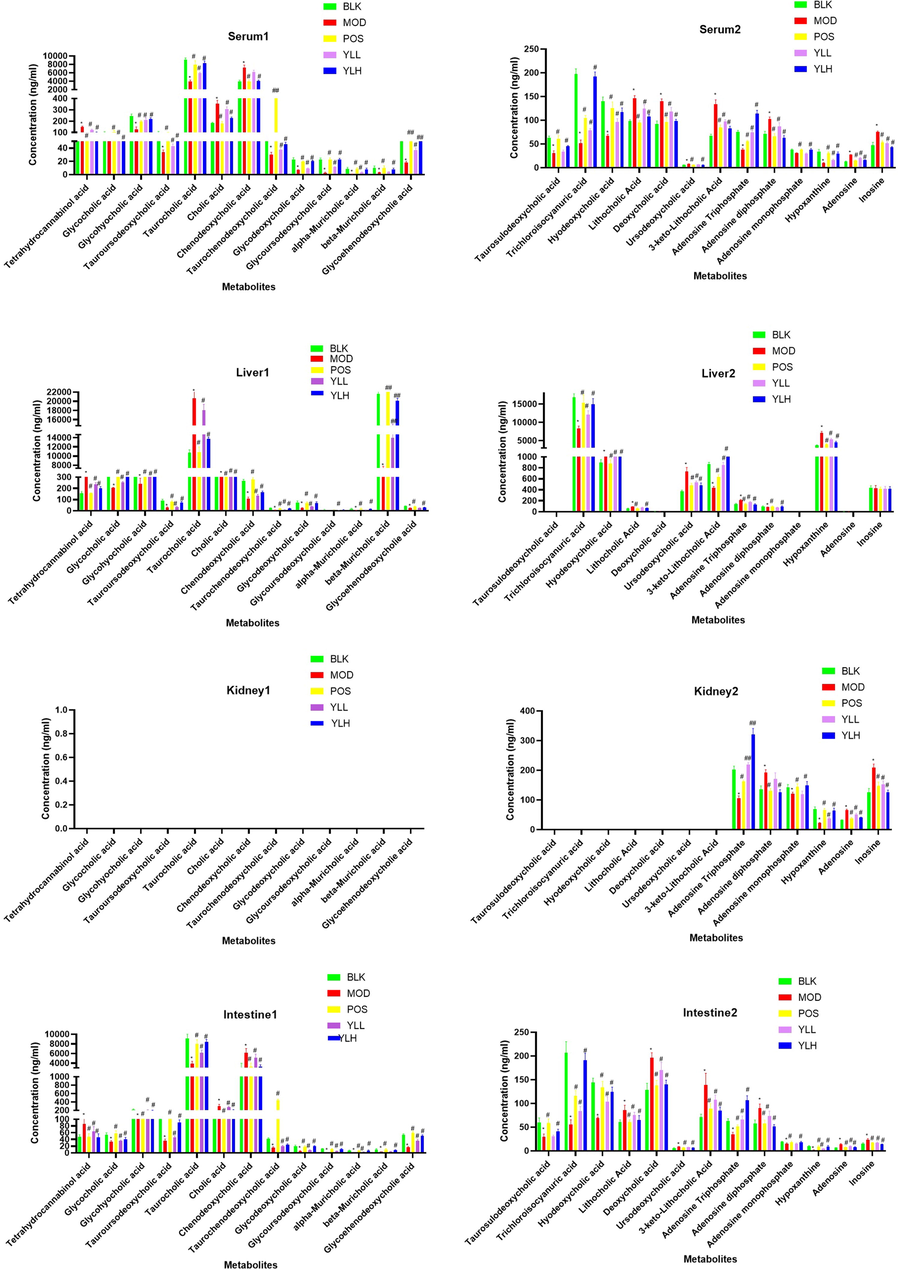
Metabolite content in each experimental group in different organs, compared to control, *<0.05, **<0.01; compared to model, #<0.05, ##<0.01.
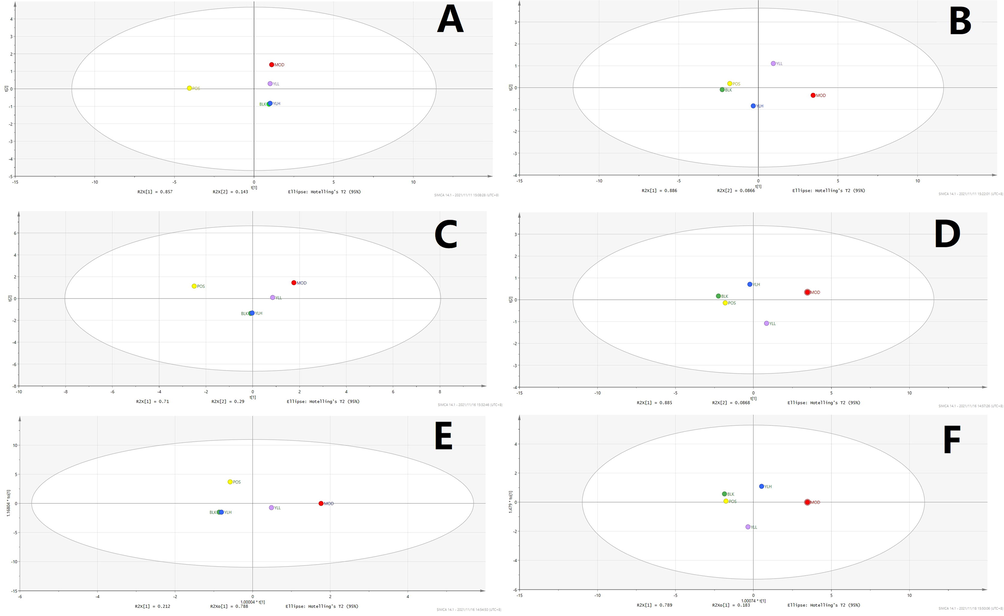
Statistical analysis was performed using PCA, wherein differences in metabolites of the groups mentioned in the “Animal experiment and sample collection” section were calculated with this supervised method, and peaks from both positive and negative mode of UPLC-TOF-MS were obtained and processed to create their own PCA score plots. Figs. 7-11 show that segregation occurred in all experimental groups, as well as 2 random samples among them. This result indicates that significant changes were induced by modeling and treatment, and along with the increase in YL dose, related metabolites continued to change.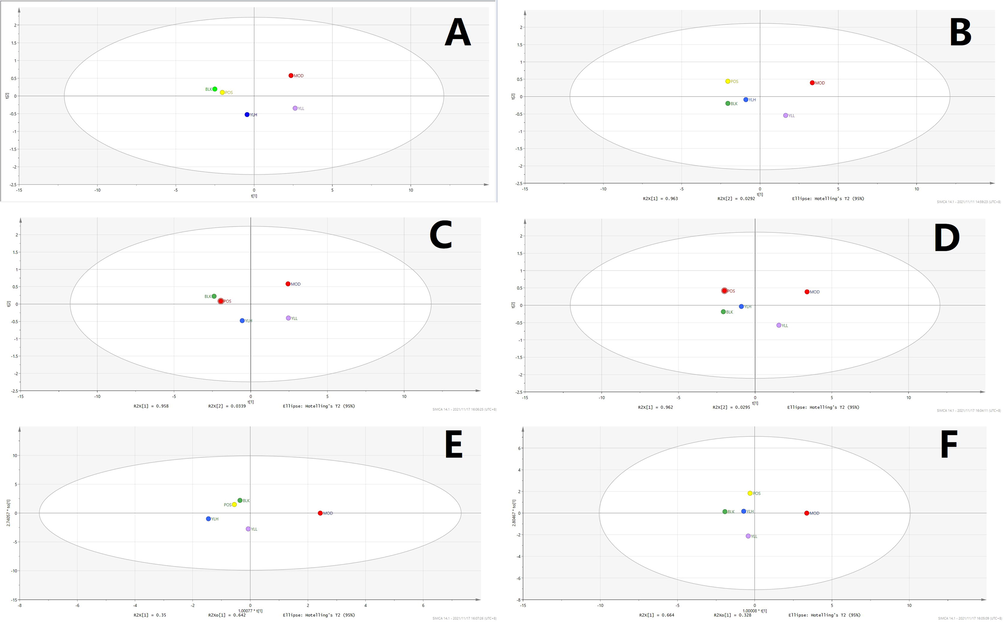
Statistical analysis of serum samples. A. PCA, positive ion. B. PCA, negative ion. C: PLS-DA, positive ion. D. PLS-DA, negative ion. E: OPLS-DA, positive ion. F: OPLS-DA, negative ion. BLK: blank (control); MOD: model; POS: positive control; YLL: YL low dose; YLH: YL high dose.
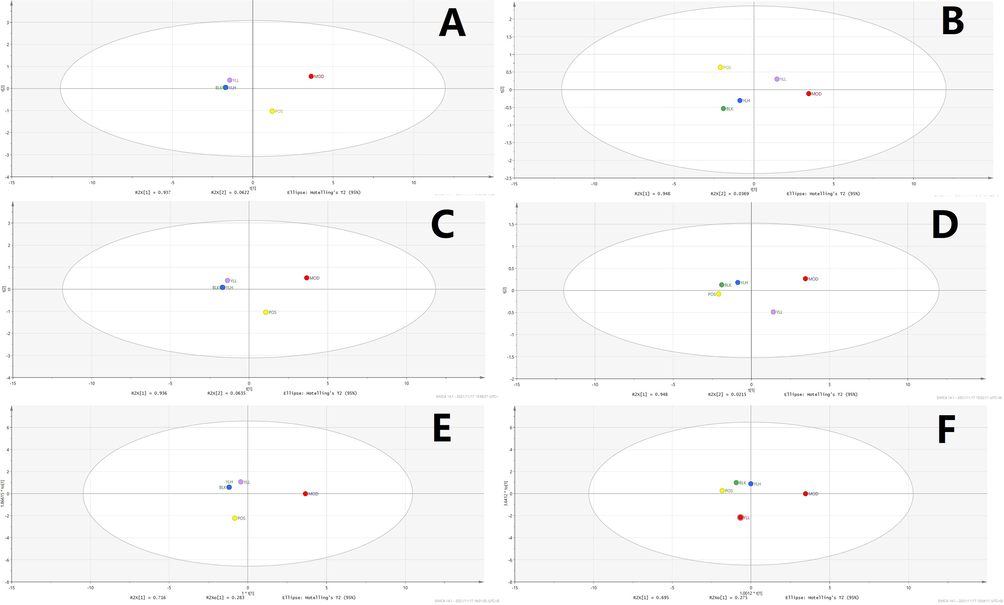
Statistical analysis of liver samples. A: PCA, positive ion. B: PCA, negative ion. C: PLS-DA, positive ion. D: PLS-DA, negative ion. E: OPLS-DA, positive ion. F: OPLS-DA, negative ion; BLK: blank (control); MOD: model; POS: positive control; YLL: YL low dose; YLH: YL high dose.
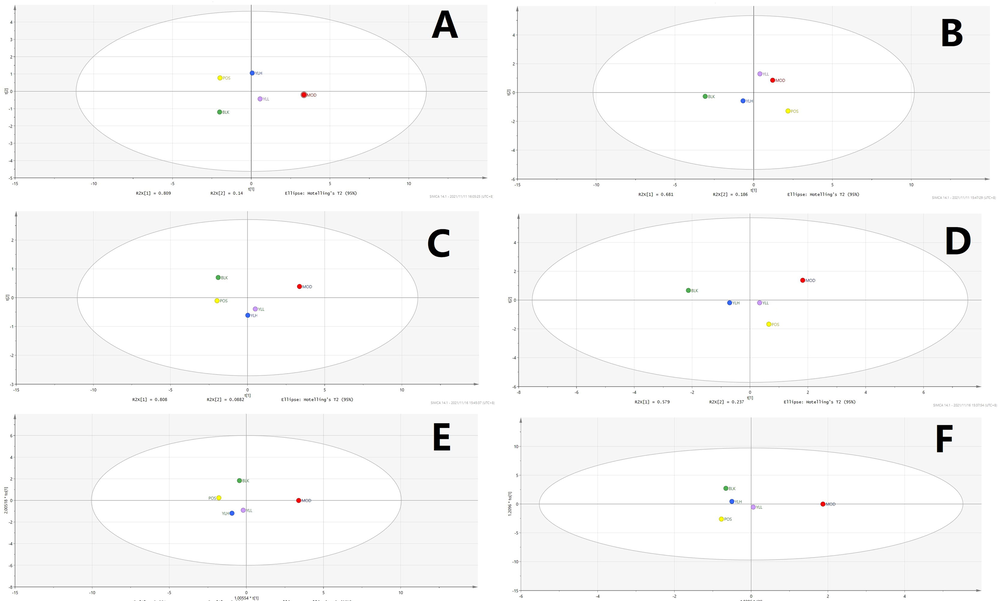
Statistical analysis of kidney samples. A: PCA, positive ion. B: PCA, negative ion. C: PLS-DA, positive ion. D: PLS-DA, negative ion. E: OPLS-DA, positive ion. F: OPLS-DA, negative ion. BLK: blank (control); MOD: model; POS: positive control; YLL: YL low dose; YLH: YL high dose.
Statistical analysis of intestine samples. A. PCA, positive ion. B. PCA, negative ion. C. PLS-DA, positive ion. D. PLS-DA, negative ion E. OPLS-DA, positive ion. F. OPLS-DA, negative ion. BLK: blank (control); MOD: model; POS: positive control; YLL: YL low dose; YLH: YL high dose.
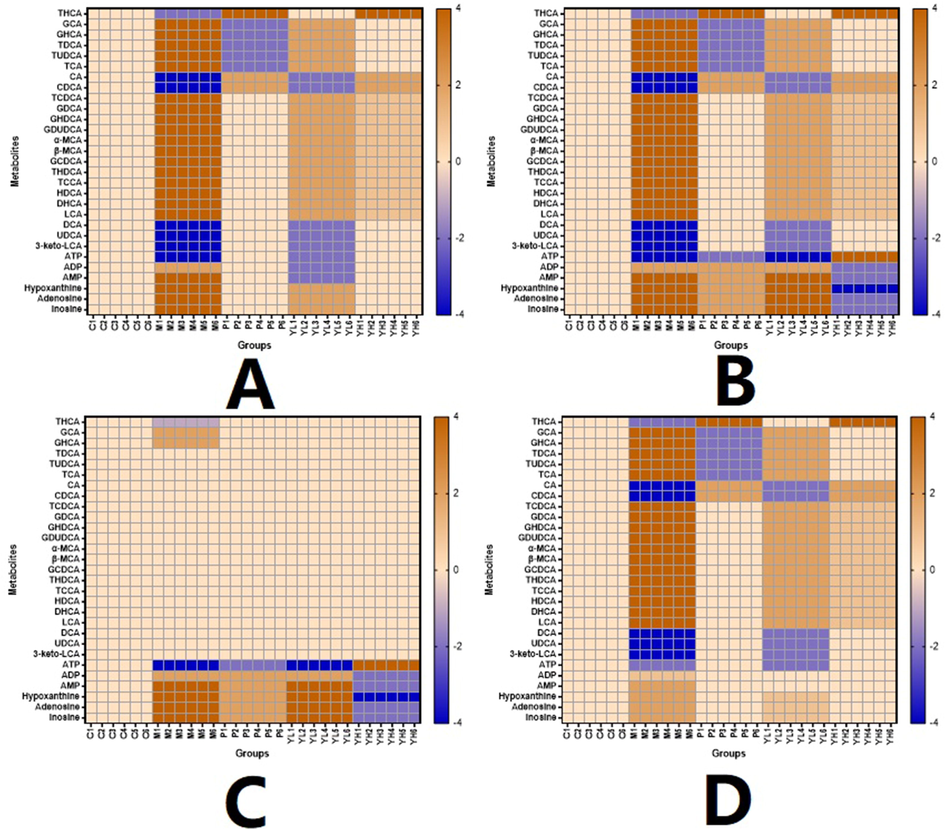
Heatmap of the metabolites in different organs and groups. A. Serum. B. Liver. C. Kidney. D. Intestine.
Subsequent statistical analysis was performed using PLS-DA, a supervised method with dimensionality reduction. This evaluation highlighted additional differences among the experimental groups, revealing more evident distinctions. Deeper investigation was subsequently performed using the OPLS-DA method, and variation between the control and model groups, as well as the value for the model and administration groups, were observed. As shown in Figs. 7-11, metabolites in the administration groups of all doses were significantly different from those of the model. This difference was also observed when comparing the control and model groups. After a permutation test with 20 iterations, the validated OPLS-DA method revealed that hyperlipidemia causes marked distinctions in PXR-CYP3A4-ABCB1-related metabolites, and YL treatment induced regulatory and dose-dependent effects on the in vivo levels of those substances.
Metabolites identified in liver, kidney and intestine samples displayed differential trends of variation. Specifically, for the liver, the statistical results of the different groups were similar to those of the serum (Figs. 7-11), in which significant changes occurred when comparing the control and model groups, as well as the model and administration groups (of all doses). When examining data from the kidney, although significant differences were observed for PXR-CYP3A4 in the model vs control and vs administration groups, far fewer numbers of metabolites exhibited obvious changes in those groups compared to the liver. These results indicate that the kidney primarily functions in regulatory and transcriptional roles in cholesterol metabolism, while most of the related synthesis and metabolism occurs in the liver. In the intestine, although there were fewer metabolites identified than in the liver, the result of compound identification revealed that those in vivo components were either metabolism products of bile acids found in the liver (THCA, GCA, GHCA, TDCA, TUDCA, TCA, CA, CDCA, TCDCA, GDCA, GHDCA, GDUDCA, α-MCA, β-MCA, GCDCA, THDCA, TCCA) or those exported from the liver to the intestine (LCA, DCA, 3-keto-LCA).
3.4 Identified biomarkers and possible metabolic pathways
Peaks that fit the criteria described in the “Metabolomics profiling based on UPLC-TOF-MS data” section were further evaluated using their statistical results, and components that |P (corr)| ≥ 0.5 and p < 0.05 by T test were selected as differential metabolites. Subsequently, MS and MS-MS data of those peaks were introduced into metabolomics databases, such as those mentioned in the last paragraph of the “Metabolomics profiling based on UPLC-TOF-MS data” section. As a result, 36 in vivo compounds were identified as biomarkers representing PXR-CYP3A4-ABCB1-induced hyperlipidemia, 26 of which were identified as affected by YL therapy by regulating key targets in the pathway. These results are shown in Fig. 11. Details of the biomarkers, including their MS parameters and screening results of the metabolomics database (MS Dial), are shown in Table 1 in the supplementary material. According to the results, a schematic of the metabolism of YL’s PXR-CYP3A4-ABCB1-induced hyperlipidemia treatment and changes in related metabolites are presented in Fig. 12.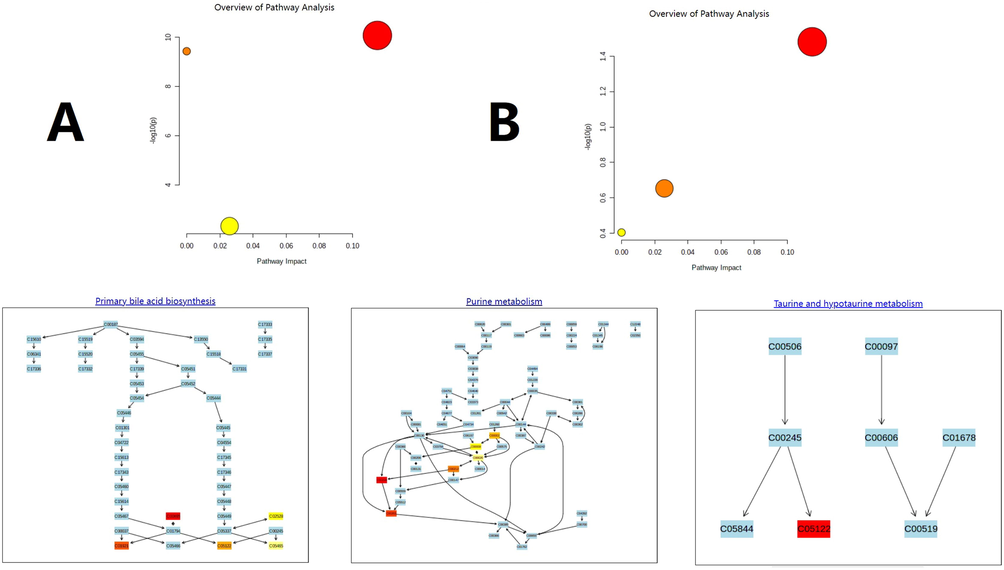
Overview of the metabolomic pathway. A. High-fat diet-induced hyperlipidemia. B. YL treatment.
The following step was pathway analysis, which was performed using MetaboAnalyst 4.0 (https://www.metaboanalyst.ca/) with KEGG and SMPDB. The analytical results revealed 4 different pathways involved in PXR-CYP3A4-ABCB1-induced hyperlipidemia: bile acid metabolism, taurine metabolism, and amino acid and purine metabolism (Fig. 12). For the metabolites involved, all 26 key biomarkers were changed in accordance with the abovementioned pathways, indicating their close relationship in hyperlipidemia and YL therapy.
As indicated by metabolomics analysis (Figs. 12, 13), PXR-CYP3A4-ABCB1-induced synthesis, decomposition, and transportation of cholesterol were influenced by multiple factors, among which amino acid, bile acid and ATP metabolism were the top factors. This discovery supported our hypothesis that YL induced relatively strong activity on PXR-CYP3A4-ABCB1, and in the liver, such an effect regulates bile acid and cholesterol metabolism; in the kidney, on the other hand, it influenced energy metabolism and transportation that affected the liver’s lipid regulatory function.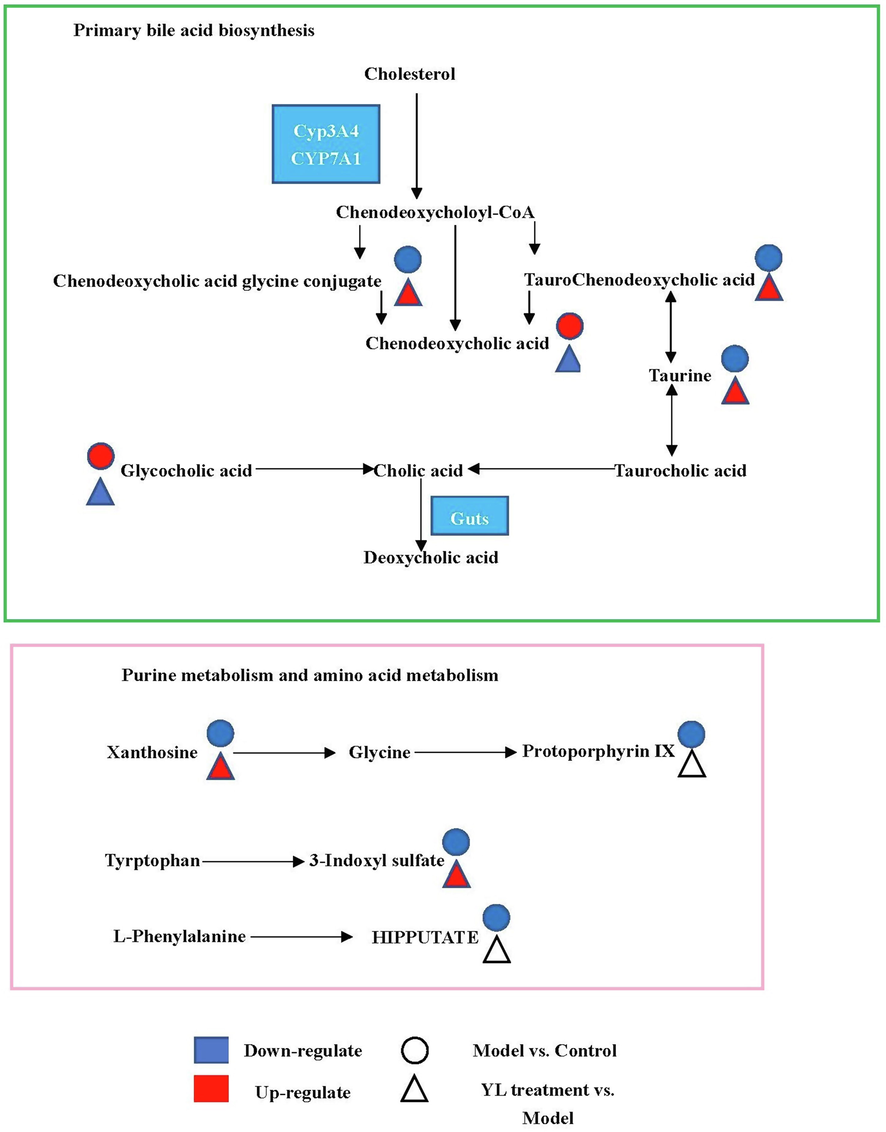
Schematic overview of metabolomic changes in high-fat diet-induced hyperlipidemia and YL treatment.
3.5 Analytical results of PXR-CYP3A4-ABCB1-related metabolites
All metabolites analyzed passed method validation, indicating that the proposed LC–MS method for in vivo content determination was accurate and reproducible (Table S1-S8). Fig. 6 shows levels of PXR-CYP3A4-ABCB1-related metabolites in each experimental group and their distribution in different tissues. The obtained analytical results were statistically compared within groups. Specifically, 20 components (for details, see Table 1), primarily bile acids, changed significantly (compared to the control) when modeling, indicating that they can be regarded as indicators of PXR-CYP3A4-ABCB1 changes induced by hyperlipidemia. For the administration groups, almost all biomarkers, except for serum and liver levels, were significantly changed in a dose-dependent trend. These results indicate that some components showed obvious differences in medium doses and beyond, while other markers experienced such regulation in response to low doses.
However, the selected biomarkers exhibited distinct tissue distributions. For instance, as shown in Fig. 6, the contents of most bile acids, namely, THCA, GCA, GHCA, TDCA, TUDCA, TCA, CA, CDCA, TCDCA, GDCA, GHDCA, GDUDCA, α-MCA, β-MCA, GCDCA, THDCA, TCCA, HDCA, DHCA, LCA, DCA, UDCA, and 3-keto-LCA, were primarily concentrated in the liver and serum. In contrast, their kidney contents were much lower than those of the former two tissues. Other metabolites, such as ATP, ADP, AMP, hypoxanthine, adenosine, and inosine, which are mostly amino or energy related, exhibited accumulation in the kidney that was not comparable (p < 0.05) to that in the liver and serum, while the gaps between the matrix (serum vs kidney, liver vs kidney) were significantly narrower (p < 0.05).
4 Discussion
4.1 Characteristic of YL’s efficacy demonstrated its mechanism based on TCM theory
Hyperlipidemia can be diagnosed by TG and TC levels in the body. However, its symptomatic treatment should be performed strictly in accordance with its pathogenesis, which is of physiological and biological importance for TCM (Wang, et al., 2021; Chu, et al., 2015). Because TCM has a unique theory to explain its mechanism and therapeutic effect, deeper and wider evidence of changes in physiological indices, target expression and metabolites needs to be included to present a clear and persuasive view of TCM treatment (Zhang, et al., 2021; Zhu, et al., 2019). In our previous study and theoretical investigation, YL’s effect was categorized as treating the phlegm turbidity and blood stasis type of hyperlipidemia (Chen, et al., 2021 and 2019). Because simply using the results of TG and TC tests cannot represent this type of disease, nor YL’s therapeutic effect, macroscopic and microscopic views of the animal and course of treatment were presented in this manuscript. For the former, histological images of liver tissue (Fig. 3) revealed that hyperlipidemia caused cavities throughout the cytoplasm and central vein, which became much narrower in the model, and as the Fig. 3 indicated, the cavity gradually returned to normal, along with the recovery of both the cytoplasm and central vein. The results indicated that hyperlipidemia damages hepatocytes, which primarily presented as the hindrance of inner mobility, blood flow and substance exchange, meaning turbidity and stasis occurred in the liver (El-hawary, et al., 2019; Cariello, et al., 2018). Additionally, similar findings were observed in kidney histological images (Fig. 4), in which large and obvious cavities were observed in the model and low-dose administration groups, indicating that the low dose medication was not enough, while the positive control and high-dose group, on the other hand, exhibited much smaller cavities. In addition, the concentration of glomeruli was observed in the model group, indicating lesions in the kidney and influencing its permeability. However, again, these pathologies were alleviated by YL, and the extent of recovery increased with the increase in dose. In summary, hyperlipidemia affects the mobility of the liver and kidney, which can be regarded as turbidity and stasis. The hemorheology results confirmed the histological findings that blood viscosity and erythrocyte electrophoresis time increased significantly in the model group compared to the control, while administration of YL helped the body gradually return those values to normal with a dose-dependent relationship.
The abovementioned pharmacological results biologically validated the theory of YL reducing phlegm turbidity and repelling blood stasis activity. In summary, although the model rat used in this study was a conventional type of hyperlipidemia, YL-induced recovery occurred through a specific mechanism: this formula emphasizes returning blood flow and permeability of key metabolite organs to normal such as the liver and kidney, which corresponds to its TCM efficacy of repelling blood stasis. For the other therapeutic function, namely, phlegm turbidity, based on TCM theory, the appropriate explanation arises from YL’s regulatory activity of PXR-CYP3A4-ABCB1 expression and pathway-related metabolites (Kullak-Ublick, et al., 2003).
4.2 YL’s PXR-CYP3A4-ABCB1 regulatory effects influence the liver and kidney
PXR and FXR act as core receptor for the regulation of CYP(such as CYP3A4 and CYP7A1) expressions, and the latter strongly influence the bio-transformation and transportation of bile acid, as well as the metabolism of cholesterol (Fiorucci, et al., 2021). To be specific, changes in PXR activity regulates the expression and activity of CYP3A4, which is the main metabolism enzyme of bile acid and drug. As Fig. 5 indicated, model group had a higher CYP3A4 expression, and such value were down-regulated in positive control and YL groups of different dosages in all organism (except YL low dose intestine); These results were corresponding to that of Fig. 6, bile acids responsible for higher TC level and hyperlipidemia were much higher in model than other groups, and all the medication groups showed trend of recovery in a dose-dependent manner. In this condition, lower concentration of bile acids like TDCA, CDCA, GCDCA, ect, whose blood and tissue levels affected by CYP3A4 and serves as ligand to regulate the activity of ABCB1 or its upstream gene recovered to normal (see Fig. 5, close to Blank group). In summary, PXR, CYP3A4 and ABCB1 consists important rate limiting sites of cholesterol metabolism and transportation pathway, and worth of investigation in order to understand YL’s therapeutic mechanism. As for FXR, the literature reported that it interacts with PXR, regulation of the latter and its related metabolites will change ligands affiliating FXR, and regulates the pathway it involved (Fiorucci, et al., 2021; Leandro, et al., 2019;).
The relative expression of PXR in the liver and kidney was roughly the same (Fig. 5), indicating the collective influence of YL. As a core receptor widely distributed in the two abovementioned organs, PXR plays different but connected roles in these tissues. Jonker et al. (Jonker, et al., 2012) reported the regulatory mechanism of PXR, in which the target was activated by several types of ligands, such as xenobiotics and bile acids (Fiorucci, et al., 2021; Kliewer, et al., 2002), and the changes in biological function induced by PXR expression are different in different organs. In the liver, inhibition of PXR caused by administration of YL suppressed CYP3A4 activity, while activation of FXR and subsequent upregulation of CYP7A1, which wane and wax in cytochrome P450, significantly decreased serum and liver concentrations of bile acids necessary for cholesterol synthesis, as well as those components that regulate the former’s transportation and metabolism (Hakkola, et al., 2016). In the kidney, PXR regulation primarily acts on energy metabolism and transportation. As the literature indicates, ATP concentration and metabolism decelerate when PXR expression is inhibited, which results in a lower yield of lipids; however, the degradation of lipids is also suppressed (Ge, et al., 2022; Ferrell, et al., 2021; Shubbar, et al., 2018). This mechanism appropriately explains why YL had a stronger effect on TC than on TG levels. In other words, an insufficient supply of ATP becomes an obstacle for cholesterol and TG synthesis, but this shortage also slows the tricarboxylic acid cycle, which has an obvious influence on the metabolism of fatty acids. Additionally, ABCB1 targets, such as ABCB1a and ABCB1b, are sensitive to bile acid levels in the body. Therefore, expression changes in PXR-FXR-CYPs affect ABCB activity and ultimately downregulate cholesterol synthesis (Leandro, et al., 2019; Kullak-Ublick, et al., 2002). In general, the influence of the PXR-CYP3A4-ABCB1 pathway is multifaceted and complex; regulation of its targets usually causes contradictory effects, and such effects can easily be covered by its final result—in this case, TG and TC levels. Therefore, investigation of the therapeutic effect of complex formulas, such as YL, should include its influence on at least the primary targets of the entire pathway. Only then can the material basis of TCM be identified.
There are multiple CYP enzymes exist in the pathways of Glycolipid metabolism, regulating lipid and cholesterol bio-transformation. Besides CYP3A4 and CYP7A1 that investigated in this study, other enzymes, like CYP11A1, CYP11B1, CYP21A2 and CYP27A1, ect., were reported to be participated to certain extent (Theiler-Schwetz, et al., 2019). The aim of our research, on the other hand, was to reveal the therapeutic mechanism of YL against hyperlipidemia, our previous studies indicated that active components in YL had stronger regulatory effect on PXR-CYP3A4 pathway than the other (Chen, et al, 2021), therefore, in consideration of focusing on the main active mechanism, and the cost of time and expenses, we confirmed the main purposed of discovering signaling mechanism as well as metabolite changes in PXR-CYP3A4-ABCB1 and the FXR-CYP7A1 pathway that obviously influenced by the former. As for other related CYPs, they will be evaluated in future for their value and correlation with YL, and the perspective ones will be considered as the target of continued investigation to perfect the evidence chain of YL’s anti-hyperlipidemia effect as TCM formula.
4.3 Changes in PXR-CYP3A4-ABCB1-related metabolites provide a clear picture of YL’s antihyperlipidemia mechanism
In the metabolomic aspect, Correlation between tissues and the metabolites can be embodied much clearer. Higher level of LCA in the model group than the blank demonstrated the damage in liver caused by hyperlipidemia (details see “Characteristic of YL’s efficacy demonstrated its mechanism based on TCM theory” section), as well as changes in 3-keto-LCA and DCA; decomposition of tissue, congestion of blood vessel and decreased permeability of the latter represented such changes. In contrast, the damages and malfunction recovered to different extent and levels of those metabolites changed gradually closed to that of the blank. Therefore, the bile acids mentioned above can be recognized as indicators of tissue morphology, as well as the drug efficacy.
The literature describes ligands of core receptors that regulate lipid and/or cholesterol metabolism, such as 3-keto-LCA, LCA, CDCA, DCA, and CA. These bile acids not only serve as regulators of PXR activity but also participate in the synthesis of cholesterol and the adjustment of its transportation by influencing CYPs and oxidative stress (Fiorucci, et at, 2021). Metabolomics profiling based on UPLC-TOF-MS identification and data analysis confirmed 20 key metabolites closely related to the PXR-CYP3A4-ABCB1 pathway, and the changes in their concentrations in different groups outline the biological basis of YL’s treatment of phlegm turbidity and blood stasis hyperlipidemia. Specifically, bile acids such as 3-keto-LCA, LCA, and CDCA represent “products” of cholesterol metabolism and/or biotransformation. As reported in the literature, the abovementioned metabolites participate in the “classic” and “alternative” processes of cholesterol metabolism and transportation (Chiang, 2009; Russell, 2003), which are primarily regulated by CYP7A1 and CYP3A4, respectively. When absorbed, active components in YL first affiliate with PXR, adjusting its expression and regulating the activity of the two CYPs.
Combining the results of UPLC-TOF-MS and UPLC–MS, we can infer that YL’s suppression of PXR expression not only downregulated the activity of CYP3A4 in the metabolome but also stimulated cholesterol’s biotransformation of CDCA, TCDCA, CA, GCDCA, α- and β-MAC (Fig. 6) in the liver, intestine and serum. These bile acids serve as ligands of FXR activation, which results in upregulation of CYP7A1—the key target for the “classic” cholesterol metabolism pathway. In addition, the content of LCA and UDCA in the abovementioned matrix significantly decreased in response to YL (Fig. 6), indicating obvious inhibition of PXR expression, which corresponded to what we observed in histological images. In summary, changes in bile acid levels induced by variations in PXR-CYP3A4 regulation confirmed that YL has a stronger effect on TC than TG. This mechanism primarily affects the synthesis, transformation, and transportation of cholesterol-related bile acids other than fatty acids and alleviates liver injury as well as cholestasis, which decreases bile acid and cholesterol concentrations in the liver, intestine and serum.
In the kidney, the UPLC-TOF-MS and UPLC–MS results showed no obvious peak for the bile acids mentioned in the last paragraph. Components that experienced significant changes induced by YL in the kidney primarily included ATP- or TG-related molecules, and their roles in lipid and/or energy metabolism are 1) participating in the tricarboxylic acid cycle, serving as “material”, such as THCA, GCA, GHCA, TDCA, TUDCA, TCA, CA, CDCA, TCDCA, GDCA, GHDCA, and GDUDCA; 2) as “material” for ATP synthesis, such as ADP and AMP; and 3) affiliating with ABCB1s, adjusting their function, namely, α-MCA, β-MCA, GCDCA, THDCA, TCCA, HDCA, DHCA, LCA, DCA, UDCA, and 3-keto-LCA. Metabolomics profiling indicated that YL’s influence on kidney PXR levels led to variation in several lipid and energy metabolism pathways, which corresponded with a previous report (Hakkola, et al., 2016;). The role of PXR regulation in the kidney primarily lies in the adjustment of oxidative stress (by changing ABCA1 function, which is induced by regulation of its ligand) and cholesterol metabolism (by regulating ATP generation, which is induced by changing the kidney concentration of precursors such as ADP and AMP; and subsequent changes in blood flow or organ functions). Through these means, an interaction between the kidney and liver is formed, decelerating ATP synthesis and transportation, also decreasing rate of cholesterol excretion, resulting in aggravation of cholestasis. However, this aggravation can be complemented by a much lower yield of cholesterol synthesis induced by PXR inhibition in the liver. PXR in the former plays a supplementary role in cholesterol metabolism, which indirectly affects liver function, while in the latter, on the other hand (Figure), it regulates the biotransformation of metabolites and results in variation in ligand synthesis, which subsequently influences the former (Ge, et al., 2022; Ferrell, et al., 2021; Shubbar, et al., 2018).
Our previous study reported YL’s regulatory effect on PXR-CYP3A4 and related active components (Chen, et al, 2021), but YL’s therapeutic mechanism in the whole body still need deeper investigation. As Fig. 5 indicated, high dosage of YL had similar activity for PXR-CYP3A4-ABAB1-FXR pathways as positive control; however, the mechanisms of the two are different: atorvastatin mainly regulates the level of lipid, as well as its regulation of CYPs activity; YL on the other hand, its regulatory effect on PXR expression not only influence synthesis of bile acids, fat acid and cholesterol, but also changes the elimination and transportation of bile acids by adjusting inflammatory reactions (Thibaut, et al., 2022; Li, et al., 2007). Such effect can be proven in metabolomic aspect in Fig. 6, that multiple bile acids, like LCA, DCA, CA, TDCA, ect., their levels returned to normal (close to blank) as the increase of YL’s dosage, which means the drug regulates the synthesis and metabolism of those biological indicators, controlling key metabolites of cholesterol metabolism, and finally influenced the disease course of hyperlipidemia.
5 Conclusion
This manuscript explained the reason that YL’s antihyperlipidemia effect relies more on reduction of TC levels than that of TG. Specifically, the inhibitory activity of PXR-CYP3A4-ABAB1 expression induced by YL, as well as its subsequent effect of the upregulation of FXR, resulted in a much lower yield of cholesterol. Although PXR inhibition leads to deceleration of cholesterol and bile acid excretion, this “side effect” can be mostly compensated by lower cholesterol concentrations in both serum and related organs. Therefore, rats administered YL generally exhibited alleviated hyperlipidemia, indicating its good activity for such disease.
Metabolomic profiling strengthened our argument and the discoveries of YL’s therapeutic mechanism that the PXR-CYP3A4-ACAB1-FXR pathway causes in vivo changes in target-related metabolites (most of which are products or precursors of cholesterol or ligands for downstream targets) in the liver, kidney and intestine. The latter change not only resulted in lowering the cholesterol concentration but also drew a clear picture of the YL-induced PXR-CYP3A4-ACAB1-FXR mechanism for treating hyperlipidemia with respect to the steps, key ligands, and, most importantly, signaling pathway.
In conclusion, our work on the YL-induced antihyperlipidemia effect explains why rats administered the drug exhibit a stronger reduction in TC than TG levels. YL’s mechanism primarily lies in the PXR-CYP3A4-ACAB1-FXR pathway, which regulates the metabolism and transportation of cholesterol, ATP and bile acids, as well as ligands for those targets. Additionally, pathway-guided metabolomics profiling provides a more scientific and comprehensive assessment for researchers to better understand the biological basis of YL’s treatment of phlegm turbidity and blood stasis hyperlipidemia.
CRediT authorship contribution statement
Dongmei Li: . Guanlin Xiao: . Weitao Chen: . Xiaohui Zeng: . Li-Zhong Cao: Supervision. Zhao Chen: Investigation, Supervision.
Acknowledgements
The authors thank National Natural Science Foundation of China (number 81903761) its financial and policy support.
Declaration of Competing Interest
The authors declare that they have no known competing financial interests or personal relationships that could have appeared to influence the work reported in this paper.
References
- Essential oils of culinary herbs and spices activate PXR and induce CYP3A4 in human intestinal and hepatic in vitro models. Toxic Let.. 2018;296(1):1-9.
- [Google Scholar]
- Bile acid activated receptors: Integrating immune and metabolic regulation in non-alcoholic fatty liver disease. Liver Res.. 2021;5(3):119-141.
- [Google Scholar]
- Novel pathways of bile acid metabolism involving CYP3A4. Biochim. Biophys. Acta (BBA) - Mol. Cell Biol. Lipids. 2005;1687(1-3):84-93.
- [Google Scholar]
- Nuclear receptor FXR, bile acids and liver damage: Introducing the progressive familial intrahepatic cholestasis with FXR mutations. BBA – Mol. Basis Dis.. 2018;1864:1308-1318.
- [Google Scholar]
- Selection and evaluation of quality markers from Yinlan capsule and its LXRα-mediated therapy for hyperlipidemia. Phytomed.. 2019;59:152896
- [Google Scholar]
- Selection and evaluation of quality control markers in propolis based on its hyperlipidemia therapy via regulating PXR/CYP3A4 expression. Phytomed. Plus. 2021;1(1):100006
- [Google Scholar]
- Use of traditional Chinese medicine in patients with hyperlipidemia: a population-based study in Taiwan. J. Ethnopharm.. 2015;168:129-135.
- [Google Scholar]
- A food contaminant ochratoxin A suppresses pregnane X receptor (PXR)-mediated CYP3A4 induction in primary cultures of human hepatocytes. Toxico.. 2015;337(1):72-78.
- [Google Scholar]
- Hepatoprotective potential of standardized Ficus species in intrahepatic cholestasis rat model: Involvement of nuclear factor-κB, and Farnesoid X receptor signaling pathways. J. Ethnopharm.. 2019;231(2019):262-274.
- [Google Scholar]
- Bile acid receptors and signaling crosstalk in the liver, gut and brain. Liver Res.. 2021;5(3):105-118.
- [Google Scholar]
- Linking liver metabolic and vascular disease via bile acid signaling. Trends Mole. Med.. 2022;28(1):51-66.
- [Google Scholar]
- Bile acids and their receptors in metabolic disorders. Prog. Lipid Res.. 2021;82:101094
- [Google Scholar]
- Cadmium induced Fak -mediated anoikis activation in kidney via nuclear receptors (AHR/CAR/PXR)-mediated xenobiotic detoxification pathway. J. Inorg. Biochem.. 2022;227:111682
- [Google Scholar]
- Complementary roles of Farnesoid X Receptor, Pregnane X Receptor, and constitutive androstane receptor in protection against bile acid toxicity. J. Bio. Chem.. 2003;278(46):45062-45071.
- [Google Scholar]
- 2016, Regulation of hepatic energy metabolism by the nuclear receptor PXR. BBA - Gene Regul. Mech.. 2016;1859(9):1072-1082.
- [Google Scholar]
- FXR and PXR: Potential therapeutic targets in cholestasis. J. Steroid Biochem. & Mole. Bio.. 2012;130:147-158.
- [Google Scholar]
- Effects of carbamazepine on the P-gp and CYP3A expression correlated with PXR or NF-κB activity in the bEnd. 3 cells. Neurosci. Let.. 2019;690(1):48-55.
- [Google Scholar]
- Regulation of xenobiotic and bile acid metabolism by the nuclear pregnane X receptor. J. Lipid Res.. 2002;43:359-364.
- [Google Scholar]
- ABC transporter regulation by bile acids: where PXR meets FXR. J. Hepato.. 2003;39:628-630.
- [Google Scholar]
- Indirubin, a component of Ban-Lan-Gen, activates CYP3A4 gene transcription through the human pregnane X receptor. Drug Metab. & Pharmaco.. 2016;31(1):139-145.
- [Google Scholar]
- ABC transporters in drug-resistant epilepsy: mechanisms of upregulation and therapeutic approaches. Pharmacol. Res.. 2019;144:357-376.
- [Google Scholar]
- PXR induces CYP27A1 and regulates cholesterol metabolism in the intestine. J. Lipid Res.. 2007;48:373-384.
- [Google Scholar]
- Liu, P., Jiang, L., Kong, W., Xie, Q., Li, P., Liu, X., Zhang, J., Liu, M., Wang, Z., Zhu, L., Yang, H., Zhou, Y., Zou, J., Liu, X., Liu, L.. 2021. PXR activation impairs hepatic glucose metabolism partly via inhibiting the HNF4α–GLUT2 pathway, Acta Pharmaceutica Sinica B, available online.
- 5-Hydroxy-4-methoxycanthin-6-one alleviates dextran sodium sulfate-induced colitis in rats via regulation of metabolic profiling and suppression of NF-κB/p65 signaling pathway. Phytomed.. 2021;82:153438
- [Google Scholar]
- Bile acids: natural ligands for an orphan nuclear receptor. Science.. 1999;284:1365-1368.
- [Google Scholar]
- Bile acid-based receptors and their applications in recognition. Steroids 2022:108981.
- [Google Scholar]
- CYP3A deficiency alters bile acid homeostasis and leads to changes in hepatic susceptibility in rats. Toxico. & Appl. Pharmaco.. 2021;429:115703
- [Google Scholar]
- The enzymes, regulation, and genetics of bile acid synthesis. Annu. Rev. Biochem. 2003;72:137-174.
- [Google Scholar]
- Effect of amyloid beta on ATP-binding cassette transporter expression and activity in porcine brain microvascular endothelial cells. Biochim. Biophys. Acta (BBA) - General Subjects. 2018;1862(10):2314-2322.
- [Google Scholar]
- Bile acids and glucocorticoid metabolism in health and disease. BBA – Mol. Basis Dis.. 2019;1865:243-251.
- [Google Scholar]
- Thibaut, M.., Bindels, L.. 2022. Crosstalk between bile acid-activated receptors and microbiome in entero-hepatic inflammation, Trends in Molecular Medicine, available online.
- Semi-quantitative profiling of bile acids in serum and liver reveals the dosage-related effects of dexamethasone on bile acid metabolism in mice. J. Chromatogr. B. 2018;1095:65-74.
- [Google Scholar]
- Integrated multiplatform-based metabonomics and network analysis to explore the mechanism of Polygonum cuspidatum on hyperlipidemia. Chromatogr. B. 2021;1176:122769
- [Google Scholar]
- Bile acids as regulatory molecules and potential targets in metabolic diseases. Life Sci.. 2021;287:120152
- [Google Scholar]
- Emerging approaches of traditional Chinese medicine formulas for the treatment of hyperlipidemia. J. Ethnopharm.. 2012;140(2):345-367.
- [Google Scholar]
- Bile acid homeostasis paradigm and its connotation with cholestatic liver diseases. Drug Discovery Today. 2018;24(1):112-128.
- [Google Scholar]
- Pharmacokinetic-pharmacodynamic modeling of the antioxidant activity of Quzhou Fructus Aurantii Decoction in a rat model of Hyperlipidemia. Biomed. & Pharmacother.. 2020;131:110646
- [Google Scholar]
- Hesperidin alleviates cholestasis via activation of the farnesoid X receptor in vitro and in vivo. Euro. J. Pharmaco.. 2020;885:173498
- [Google Scholar]
- A UPLC-MS/MS-based metabolomics analysis of the pharmacological mechanisms of rabdosia serra against cholestasis. Phytomed.. 2021;91:153683
- [Google Scholar]
- UPLC-MS-based metabonomic analysis of intervention effects of Da-Huang-Xiao-Shi decoction on ANIT-induced cholestasis. J. Ethnopharm.. 2019;238:111860
- [Google Scholar]
Appendix A
Supplementary material
Supplementary data to this article can be found online at https://doi.org/10.1016/j.arabjc.2022.104272.
Appendix A
Supplementary material
The following are the Supplementary data to this article:Supplementary data 1
Supplementary data 1


