

Translate this page into:
Metabolomic profile and in vitro evaluation of the cytotoxic activity of Asphodelus microcarpus against human malignant melanoma cells A375
⁎Corresponding authors. hesham.el-seedi@fkog.uu.se (Hesham R. El-Seedi), Mohamed.said@fop.usc.edu.eg (Mohamed S. Refaey)
-
Received: ,
Accepted: ,
This article was originally published by Elsevier and was migrated to Scientific Scholar after the change of Publisher.
Peer review under responsibility of King Saud University.
Abstract
Melanoma is a huge worldwide health problem that must be handled more effectively with better therapeutic options. As a result, new treatment drugs are required to treat this condition. The goal of this study was to investigate the cytotoxic activity of the anthraquinone-rich fractions obtained from Asphodelus microcarpus against human melanoma cell A375. On these melanoma cell lines; the cytotoxicity of these fractions had never been studied before. Liquid chromatography linked to mass spectrometry (LC-MS-MS) and Nuclear Magnetic Resonance was used to determine the chemical profiles of these fractions. The cytotoxicity of the fractions studied was determined by measuring cell viability and calculating IC50 values. Both ethyl acetate (EtOAC) and the precipitate fractions (PPT) exhibited selective cytotoxicity on human melanoma A 375 cell line with IC50 values of 83 and 65 µg/mL, respectively. The antiproliferative properties of EtOAc fraction and PPT were supported by a noticeable decrease in cell numbers during the G2/M cell cycle arrest. Our findings suggest that the anthraquinone content of A. microcarpus tubers is responsible for its anti-proliferative and apoptotic properties and that further in vivo investigations should be conducted to establish the viability of using them to treat human melanomas.
Keywords
Anthraquinone
Apoptosis
Melanoma
Metabolomic
Cell cycle

1 Introduction
Cancer is a major global health issue and the world's second-largest cause of death (Ijaz et al., 2018). With more instances reported each year, skin cancer has emerged as one of the most common cancers (Simões et al., 2015). Skin cancer comes in two different varieties: non-melanoma and melanoma. Although melanoma is the most lethal and the main cause of mortality, non-melanoma skin cancer is the most common (Kuphal and Bosserhoff 2009). The death rate for malignant melanoma is higher than that of other cancer types. Skin cancer that is fatal and has a high chance of spreading is called melanoma (Yang et al., 2018). It is an aggressive, treatment-resistant melanocyte cancer (De Stefano et al., 2009). Advanced melanoma patients almost always have a dismal prognosis and are incurable (Leonardi et al., 2018). Melanoma is on the rise and is becoming a greater concern to public health. Early sickness patients may gain from receiving conventional care. On the other hand, patients with severe disease typically respond poorly and advance swiftly. Therefore, these people have an unmet demand for health care and are in need of new, more potent treatments. In-depth research over the past few decades has resulted in the development of several synthetic anti-cancer medications. However, the main reasons why chemotherapy fails are the development of multi-drug resistance, as well as its significant adverse effects and expensive cost (Oliveira Pinho et al., 2019, Wang et al., 2019). Recently, a number of immunotherapies have been investigated as potential treatments for melanoma, including CTLA-4 and PD-1 receptor inhibitors, even though their efficacies are variable and their side effects are still severe (Rodríguez-Cerdeira et al., 2017). New strategies that are both successful and secure are thus desperately needed.
The identification of anti-cancer drugs from nature is amongst the most important approaches for combating specific types of malignancies; yet it necessitates ongoing screening of natural origins such as seaweeds, terrestrial plants, and marine species (Boopathy and Kathiresan 2010, Bader et al., 2019). Secondary metabolites from plants, including anthraquinone, are a class of chemicals that have antiproliferative properties (Bajpai et al., 2018, Siddamurthi et al., 2020, Malik et al., 2021). Anthraquinone compounds have been shown to have anticancer potential by induction of apoptosis in HER2 breast cancer (Chang et al., 2012) as well as mercury-induced kidney tumors (Chowdhury et al., 2005). They have cytotoxic effects on leukemic 1301 cell lines, EOL-1 cell lines, and T cell lines (Khan 2019). A. microcarpus (Fig. S1) was found to have a significant amount of anthraquinone (Ghoneim et al., 2013), which revealed to be a promising candidate for the treatment of various malignancies (Abdellatef et al., 2021).
Traditional medicine has used A. microcarpus bulbs and roots to treat ectodermal parasites, jaundice, psoriasis, and microbiological infections (El-Seedi 2007). Various secondary metabolite groups such as sterols, triterpenes, anthraquinones, naphthalenes, and arylcoumarins have been isolated from the plant in previous phytochemical analyses (El-Seedi 2007, Ghoneim et al., 2013). It also displayed antileishmanial, antimalarial, antileukemic, antibacterial, tyrosinase inhibition, and antioxidant properties (El-Seedi 2007, Ghoneim et al., 2013, Ghoneim et al., 2014a, Ghoneim et al., 2014b, Di Petrillo et al., 2016, Di Petrillo et al., 2017). The purpose of this study is to evaluate the cytotoxicity of anthraquinone-rich fractions from A. microcarpus on human malignant melanoma cells A375, as well as to determine the phytoconstituents present in these fractions using the LC-MS-MS method.
2 Material and methods
2.1 Plant material
The tubers of A. microcarpus Salzm. et Vivi (Asphodelaceae) were collected from the 70 km West of Marsa Matrouh, Egypt, in February 2021. The plant was identified by Dr. Mohamed F. Azzazy, professor of plant ecology at the surveys of the natural resources department, Environmental Studies and Research Institute, University of Sadat City. A voucher specimen (AM 21) was placed in surveys of the natural resources department.
2.2 Extraction procedure
Fresh tubers plant material (3 kg) was cut into little pieces with a knife before being combined with 2.5 L of 80 % methanol. The mixture was allowed to macerate for 24 h with regular shaking before filtering on cellulose filter paper. The technique was repeated three times until the plant material was exhausted. The filtrate was collected and concentrated under a vacuum at 40 °C until it reached 1L volume, after which it was partitioned with n-hexane (500 mL × 3), dichloromethane (500 mL × 4), and ethyl acetate (500 mL × 6) to give 0.21 g, 1.95 g, and 5.21 g, respectively. A yellowish-red precipitate (PPT) was generated during the partitioning process that did not dissolve in the remaining aqueous portion. It was taken apart and weighed 7.68 g.
2.3 Metabolomic analysis
The ethyl acetate fraction and PPT were analyzed using LC-MS-MS. A Shimadzu LC-10 HPLC with a Grace Vydac Everest Narrowbore C18 column (100 mm × × 2.1 mm i.d., 5 µm, 300 Å) LC-MS, linked to an LCQ electrospray ion trap MS (Thermo Finnigan, San Jose, CA). The raw data files were converted to mzXML format using MSConvert from the ProteoWizard suite (https://proteowizard.sourceforge.net/tools. shtml). The molecular network was created using the Global Natural Products Social Molecular Networking (GNPS) online workflow (Purves et al., 2016, El-Garawani et al., 2020). The spectra in the network were then searched against GNPS’ spectral libraries and published data. Proton nuclear magnetic resonance (1H NMR) and 2D HSQC spectra were recorded at 298 K on a Bruker 600 MHz (TCI CRPHe TR-1H and 19F/13C/15 N 5 mm-EZ CryoProbe) spectrometer. Chemical shifts were referenced to the solvent peak for CDCl3 at δ H and 13C at 7.260 and 77.160 ppm, respectively.
2.4 Cell culture
The cell line human melanoma A375 was purchased from Nawah Scientific Inc., (Mokatam, Cairo, Egypt). Cells were maintained in Dulbecco's Modified Eagle Medium (DMEM) media supplemented with 100 mg /mL of streptomycin,100 units/mL of penicillin, and 10 % of heat-inactivated fetal bovine serum in humidified, 5 % (v/v) CO2 atmosphere at 37 °C.
2.5 Determination of cell viability
The sulforhodamine B (SRB) assay was used to determine cell viability as described in (Attallah et al., 2022). Briefly, in 96 well plates, aliquots of 100 μL cell suspension (5x10³ cells) were put and incubated in full media for 24 h. Cells were treated with another aliquot of 100 μL media containing extracts (EtOAc fraction and PPT) at various concentrations (0.01, 0.1, 1, 10, 100 µg/mL). The extracts were dissolved in dimethyl sulfoxide (DMSO) and a stock solution was prepared for up to 100 µmol (DMSO concentration was 0.1 % which is safe for cell). After 72 h of extracts exposure, cells were fixed by replacing media with 150 μL of 10 % Trichloroacetic acid (TCA) and incubated at 4 °C for 1 h. The TCA solution was removed, and the cells were washed five times with distilled water. Aliquots of 70 μL SRB solution (0.4 %w/v) were added and incubated at room temperature for 10 min in the dark. Plates were washed three times with 1 % acetic acid and air-dried overnight. The absorbance was measured at 540 nm using a BMGLABTECH®-FLUO star Omega microplate reader (Ortenberg, Germany) after, 150 μL of TRIS (10 mM) was introduced to break down the protein-bound SRB stain. In addition, the images were taken using the optical microscope to register any morphological change on the tested cell.
2.6 Flow cytometry analysis of cell cycle
Cells (105 cells) were collected by trypsinization and rinsed twice with ice-cold PBS (pH 7.4) after treatment with test extracts for 24 or 48 h and paclitaxel (1 µM) for 24 h as a positive control. For fixation, the cells were re-suspended in two milliliters of 60 % ice-cold ethanol and incubated at 4 °C for 1 h. Fixed cells were resuspended in 1 mL of PBS containing 50 µg/mL RNAase A and 10 µg/mL propidium iodide (PI) after being rinsed twice with PBS (pH 7.4). After 20 min of incubation in dark at 37 °C, cells were analyzed for DNA contents using flow cytometry analysis using FL2 (λex/em 535/617 nm) signal detector (ACEA Novocyte™ flow cytometer, ACEA Biosciences Inc., San Diego, CA, USA). For each sample, 12,000 events were acquired. ACEA NovoExpress™ software (ACEA Biosciences Inc., San Diego, CA, USA) was used to calculate cell cycle distribution.
2.7 Analysis of apoptosis assay
Annexin V-FITC apoptosis detection kit (Abcam Inc., Cambridge Science Park, Cambridge, UK) and two fluorescent channels flowcytometry were used to determine apoptosis and necrosis cell populations as reported in (Alaufi et al., 2017, Kameyanda Poonacha et al., 2021, Gomathi et al., 2022) with some modifications. After treatment with test extracts for 24/48 or 72 h and doxorubicin (10 μM) for 24 or 48 h as a positive control, cells (105 cells) were collected by trypsinization and washed twice with ice-cold phosphate buffer solution (PBS; pH 7.4). The cells were incubated with 0.5 mL of Annexin V-FITC/ propidium iodide (PI) solution for 30 min in dark at room temperature according to manufacturer protocol. After staining, cells were injected via ACEA Novocyte™ flow cytometer (ACEA Biosciences Inc., San Diego, CA, USA) and analyzed for FITC and PI fluorescent signals using FL1 and FL2 signal detectors, respectively (λex/em 488/530 nm for FITC and λex/em 535/617 nm for PI). For each sample, 12,000 events were acquired and positive FITC and/or PI cells were quantified by quadrant analysis and calculated using ACEA NovoExpress™ software (ACEA Biosciences Inc., San Diego, CA, USA).
Statistical analysis
Data were presented as mean ± standard deviation (SD). To compare for significant changes between groups, one-way ANOVA tests were used, followed by Tukey–Kramer as a post ANOVA test. For all comparisons, a significant level of p < 0.05 was used. All statistical testing was performed with the GraphPad Prism® Software program, version 7 (GraphPad software Inc., San Diego, CA, USA). The IC50 values were calculated from concentration-response curves by Sigma Plot software, version 12.0 (System Software, San Jose, CA, USA), using an E-max model equation. Flow cytometry and apoptosis were analyzed using the generalized linear models (GLM) of SAS (2003). Separation among means was achieved using Least Significant Difference (LSD).
3 Results
The fresh tubers of A. microcarpus were extracted with MeOH/H2O (8:2) by maceration at room temperature. The concentrated hydroalcoholic extract was partitioned using n-hexane, dichloromethane, and ethyl acetate to afford their corresponding fractions. During the fractionation process, a precipitate was formed, collected, and investigated for its phytochemical composition and biological activity. According to the previous literature concerning the active constituents of A. microcarpus, anthraquinone derivative compounds predominant in the plant (Bonsignore et al., 1998) and its tubers (Hammouda et al., 1974). We investigated the different fractions of the plant together with the precipitate formed during the fractionation process for their anthraquinone content using ultraviolet (UV) lamb and thin layer chromatography (TLC) plates, sprayed with potassium hydroxide reagent. The ethyl acetate fraction and the precipitate were rich in their anthraquinone content.
3.1 Identification of ethyl acetate fraction and PPT components
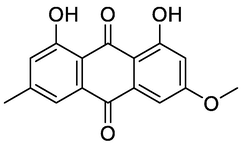
Principal components of A. microcarpus ethyl acetate fraction and PPT were successfully identified using LC-MS-MS. The MS chromatograms are shown in (Fig. 1). The compounds were identified after interpreting their MS, and MS-MS and comparing their data with those reported in the mass bank, GNPS, and literature (Gauthier-Jaques et al., 2001, Xie et al., 2019, Lazarova et al., 2020). The identified compounds are listed in Table 1, including retention times, molecular weight, MS/MS fragments, as well as their identifications.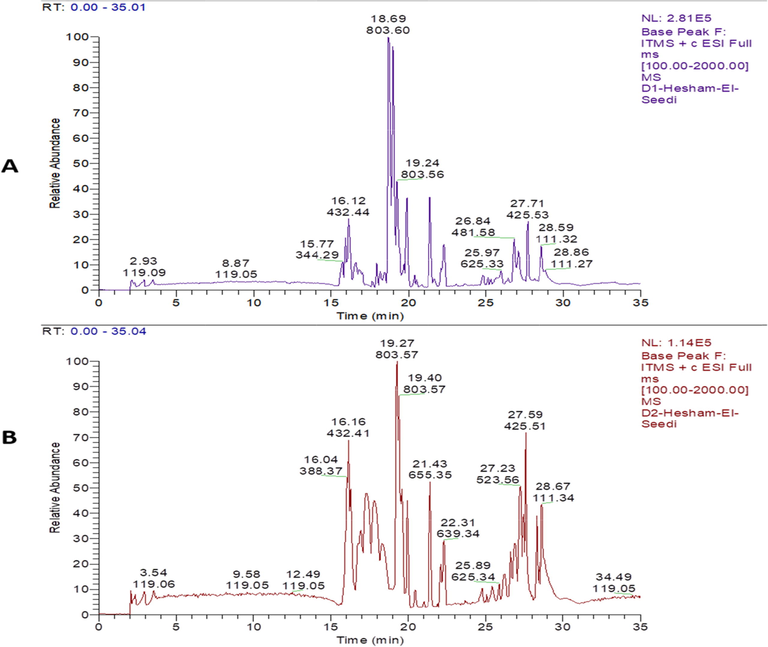
Chromatogram of A. microcarpus (A): ethyl acetate fraction and (B): PPT.
NO.
Rt
MF
[M+H]+
Fragmentation
Compound name
Structure
Reference
N1
22.13
C15H11O4
255.24
227.00, 212.00, 199.00, 183.00
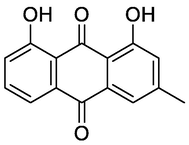
Chrysophanol
Xie et al. (2019), Lazarova et al. (2020)
N2
24.31
C15H13O3
241.25
223.08, 206.07, 141.03, 75.02
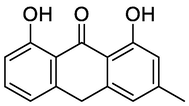
Chrysothrone
N3
16.28
C30H23O6
479.49
239.07, 224.05, 207.04, 133.03
chrysophanol-10,10′-bianthrone
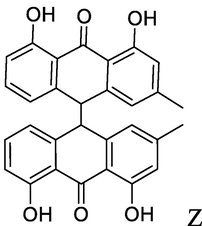 Z
Z
N4
15.63
C16H13O5
285.26
285.10, 242.00
Physcion
N5
18.63
C42H43O16
803.41
641.14, 479.14, 238.99
10, 10′-chrysphanol bianthrone-di-O-hexoside
N6
22.25
C36H33O11
641.35
623.12, 479.14, 241.08
10, 10′-chrysphanol bianthrone-O-hexoside
N7
21.34
C36H31O12
655.29
493.24, 239.03
Unknown
–
N8
20.43
C36H29O13
671.27
509.05, 491.03, 473, 463,
Unknown
–
N9
16.19
C28H29O16
461.36
415.16
Unknown
–
N10
15.6
C19H23O9
395.21
377.04, 329.05, 275.03, 257.03
Aloesin
GNPS
N11
17.98
C19H23O8
401.22 [M+Na]+
359.11, 238.95, 185.00
Ethanone, 1-[1-(beta-d-glucopyranosyloxy)-8-hydroxy-3-methyl-2-naphthalenyl]-
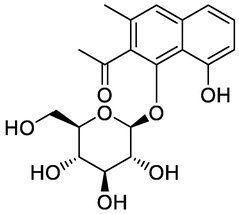
GNPS
N12
21.41
C13H19O7
288.434
227.08, 105.9, 87.95
Salicin
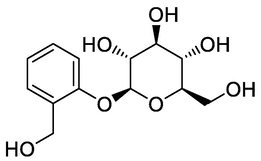
GNPS
Molecular network analysis (Fig. 2) described the identified compounds in A. microcarpus extracts. It showed two types of nodes; turquoise color and olive-green color. The turquoise color describes the ethyl acetate fraction sample and olive-green for the PPT sample. The size of nodes denotes the precursor intensity (number of ions) of each compound in the extract. While the edges between the nodes show a mass difference for derivatives of the compounds in the same cluster.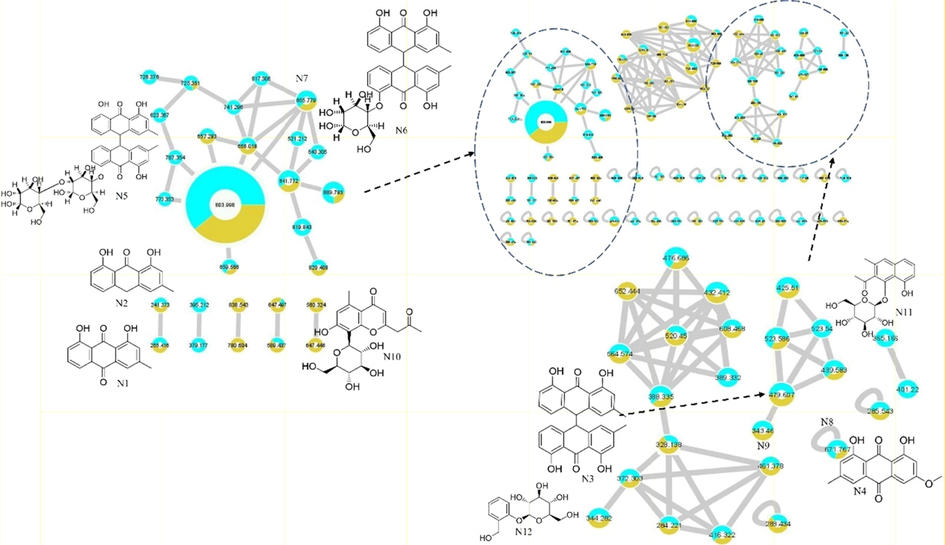
Molecular network prescribing the identified compounds in EtOAc fraction in turquoise color nodes and PPT in an olive-green color of A. microcarpus.
Although NMR did not provide any conclusive information, the combination of MS and NMR data helped in determining the compounds. Major peaks annotated using 1H NMR corresponded to unsaturated fatty acids as follows. A key feature of unsaturated fatty acid present in 1H NMR spectra is the signals of olefinic protons at δ 5.30–5.37 ppm showing HSQC cross-peak correlation with 13C signals at δ 128–133 ppm. Moreover, such unsaturation was also confirmed by the allylic methylenes resonating at δ 2.05–2.10 ppm and correlated with the 13C signals at δ 28.0 ppm. In detail, ω-9 fatty acid was detected as evident from the terminal methyl signal resonating at δ 0.90, whereas a triplet at δ 2.77 (J = 6.6 Hz) was readily assigned to the allylic methylenes of ω-6 fatty acid, respectively as exhibited in (Figs. 3 and 4).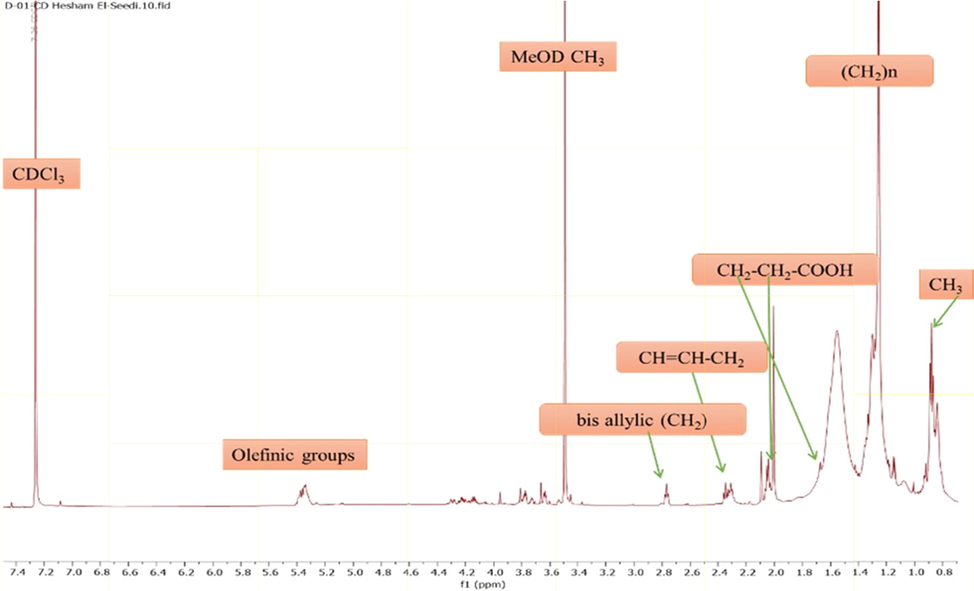
1H NMR spectrum illustrating major metabolites in A. microcarpus ethyl acetate extract and PPT.
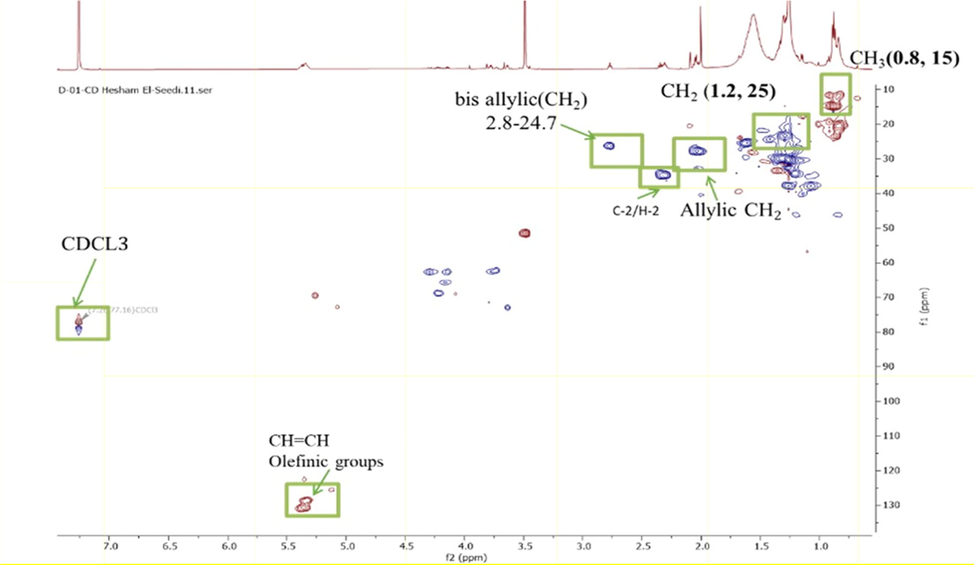
HSQC correlation spectrum illustrating major metabolites in A. microcarpus ethyl acetate extract and PPT.
3.2 SRB's colorimetric assay
The EtOAc fraction and PPT were examined for their cytotoxicity against human melanoma A375. According to the SRB assay, Sulforhodamine B is an anionic aminoxanthene dye that forms an electrostatic complex with the basic amino acid residues of proteins under moderately acid conditions, which provides a sensitive linear response. The color development was readily measured at absorbance between 560 and 580 nm. EtOAc fraction and PPT of A. microcarpus tubers exhibited selective cytotoxic effects on the melanoma A375 cancer cells compared to control (Table 2 and Figs. 5–7). The maximum inhibitory concentration (IC50) of EtOAc fraction and PPT of the A. microcarpus after 72 h of treatment was 83 µg/mL and 65 µg/mL, respectively (Fig. 5). Values are expressed as the mean ± SEM (n = 3); EtOAc, ethyl acetate; PPT, precipitate.
Percent cell viability at various concentrations on Human Melanoma A375
sample
0.01 (µg/mL)
0.1 (µg/mL)
1 (µg/mL)
10 (µg/mL)
100 (µg/mL)
Control
100 ± 0
100 ± 0
100 ± 0
100 ± 0
100 ± 0
EtOAc
99.02 ± 1.51
98.18 ± 1.57
98.58 ± 0.19
97.54 ± 0.35
42.11 ± 0.71
PPT
99.16 ± 0.51
97.29 ± 1.12
95.71 ± 0.34
95.30 ± 0.14
33.94 ± 0.60
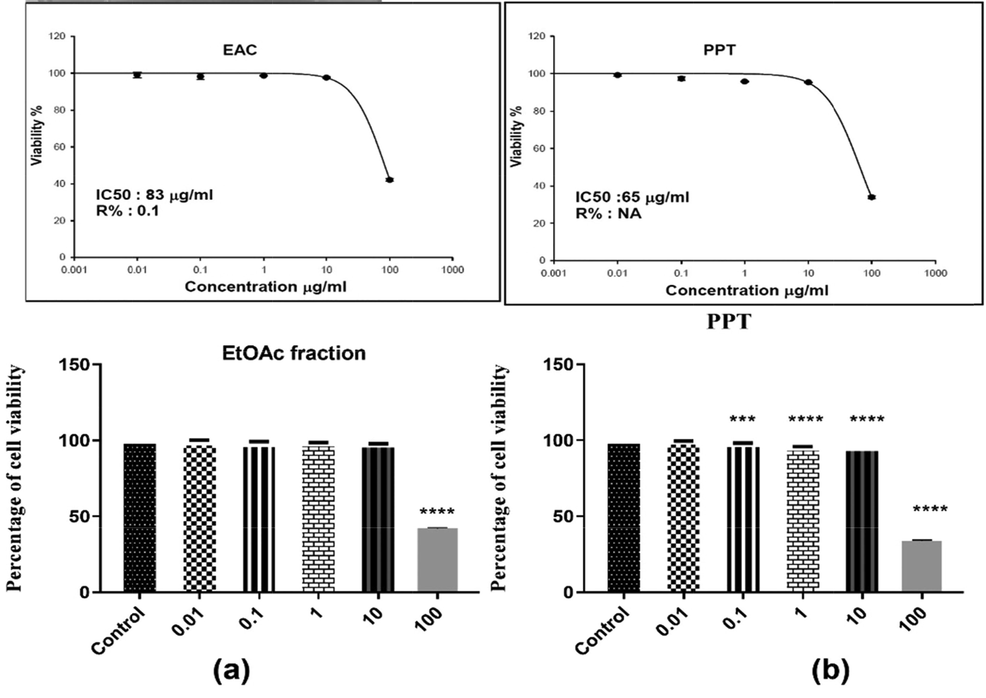
Values are expressed as the mean ± SEM (n = 3); EtOAc, ethyl acetate; PPT, precipitate. Statistical significance (p) calculated by one-way ANOVA followed by Tukey-Kramer as post ANOVA test at *p < 0.05 were considered statistically significant by comparing the treated group with the control group.
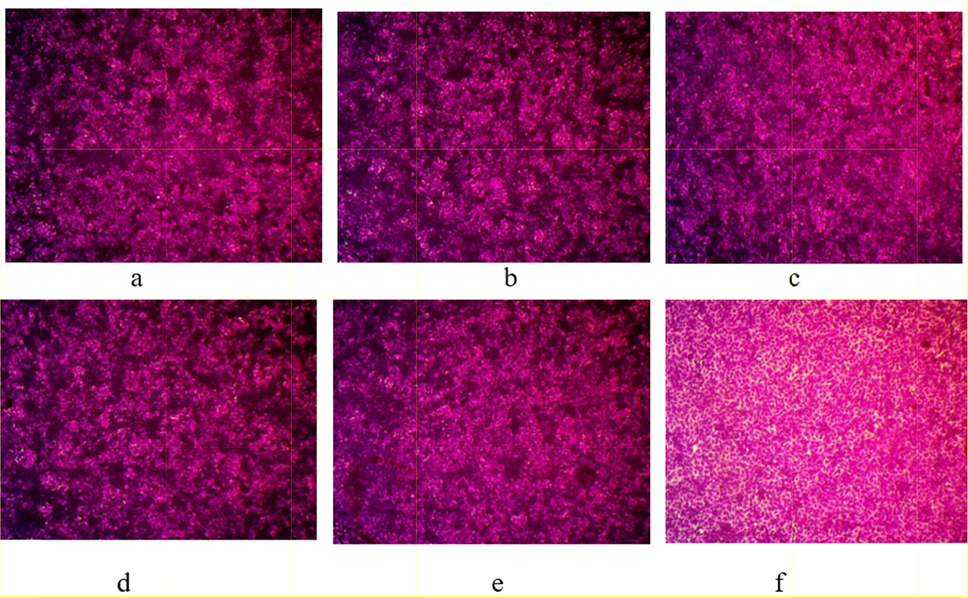
Optical microscope-stained images of cytotoxicity assays at A375 cell line treated by different concentrations of A. microcarpus EtOAc fraction, a: Control, b: 0.01 μg/mL, c: 0.1 μg/mL, d: 1 μg/mL; e: 10 μg/mL and f: 100 μg/mL, magnification power: 100×.
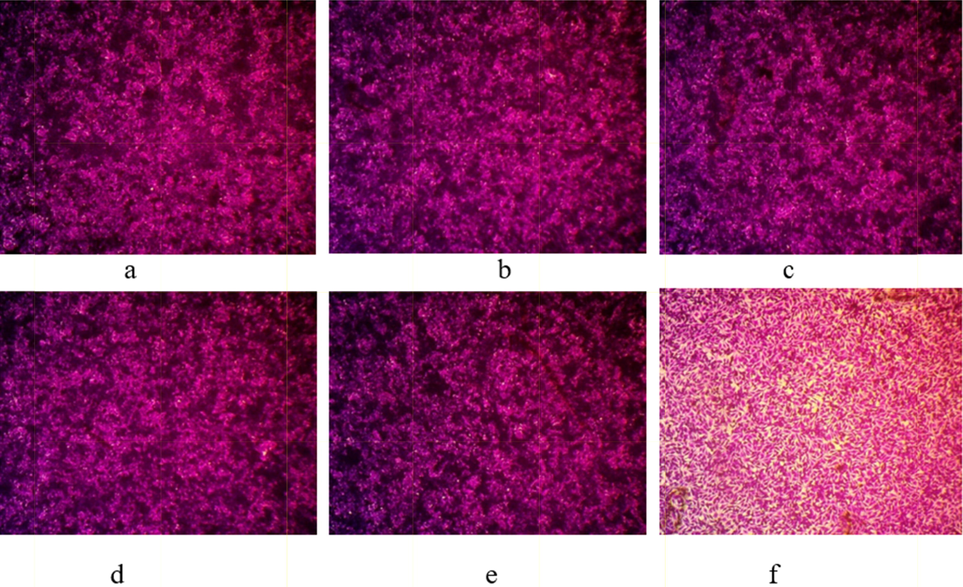
Optical microscope-stained images of cytotoxicity assays at A375 cell line treated by different concentrations of A. microcarpus PPT, a: Control, b: 0.01 μg/mL, c: 0.1 μg/mL, d: 1 μg/mL; e: 10 μg/mL and f: 100 μg/mL, magnification power: 100×.
Compared with control (Fig. 6a), no appeared deformation was observed (Fig. 6b–d) at low concentrations of A. microcarpus EtOAc fraction (0.01, 0.1, and 1 μg/mL) but little deformation was observed at 10 μg/mL (Fig. 6e). Morphological characteristics of A375 treated with 100 μg/mL of A. microcarpus EtOAc fraction was more affected (Fig. 6f).
In the same way, compared with control (Fig. 7a), no appeared deformation was observed (Fig. 7b–d) at low concentrations of A. microcarpus PPT (0.01, 0.1, and 1 μg/mL) but little deformation was observed at 10 μg/mL (Fig. 7e). Morphological characteristics of A375 treated with 100 μg/mL of A. microcarpus PPT was more affected (Fig. 7f).
3.3 Cell cycle distribution
The effect of A. microcarpus EtOAc fraction and PPT on cell cycle was investigated by flow cytometry. For this purpose, A375 melanoma cells were incubated with different concentrations of EtOAc fraction and PPT for 24, 48, and 72 h, then labeled with propidium iodide and subjected to fluorescence-activated cell sorting (FACS) analysis. At 83 µg/mL and 100 µg/mL for EtOAc fraction, and 65 µg/mL and100 µg/mL for PPT, the cell cycle was affected (Figs. 8 and S2). The IC50 concentrations of cytotoxicity study (83 µg/mL for EtOAc and 65 µg/mL for PPT) were used in this assay, beside another concentration at 100 µg/mL. In particular, the PPT at a concentration of 100 µg/mL significantly promoted an increase in cells at S phase with a reduction in G2 phase population, while at the concentration of 65 µg/mL, it induced a reduction in G0/G1 phase and an increase in the S phase. The EtOAc fraction showed an increase in S phase with a reduction in G2 phase at a concentration of 100 µg/mL, while, at concentration of 83 µg/mL, it decreased the G1 and G2 phases with an increase in the S phase. It was noticed, both EtOAc fraction and PPT concentrations were able to reduce the cell numbers at the G2/M phase. Additionally, at concentrations of 65 µg/mL of PPT and 83 µg/mL of EtOAc fraction, there was a remarkably reduction of the cell numbers at the G1 phase and an increase in the cell number at the S phase compared to the control cells.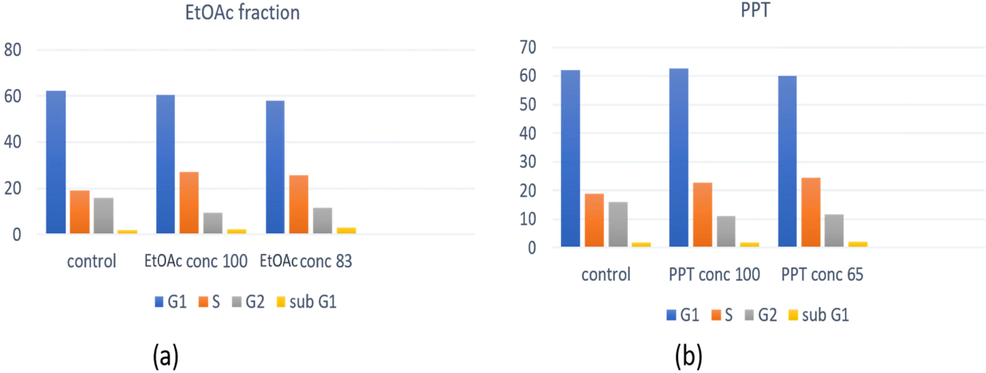
Cell cycle analysis of A. microcarpus EtOAc fraction and PPT treated with melanoma A375 cells after 72 h.
3.4 Apoptosis assessment
To investigate the anti-cancer activity of A. micrpcarpus EtOAc fraction and PPT on human melanoma A375 cancer cell lines, we employed Annexin V and propidium iodide (PI) co-staining to examine possible induction of cell death (necrosis and/or apoptosis). Most of the control-treated cells were healthy and unstained by either FITC-labelled annexin V or PI at all three treatment times (Figs. S3a and 9a). A. microcarpus EtOAc fraction and PPT treatment resulted in the translocation of PS molecules, as evidenced by the binding of FITC-labelled annexin V. After 24 h, approximately 60 % of cell population were in necrosis stages and 0.06 % in early apoptosis and 27.6 % in late stages of apoptosis and finally 11 % live cell in EtOAc fraction at 83 µ/mL (Figs. S3b, 9a). At concentration of 100 µg/mL of EtOAc fraction, 48.6 % of cell population were in necrosis stage after 24 h, 0.11 % in early apoptosis and 45 % in late apoptosis and 5.5 % live cells (Figs. S3c, 9a).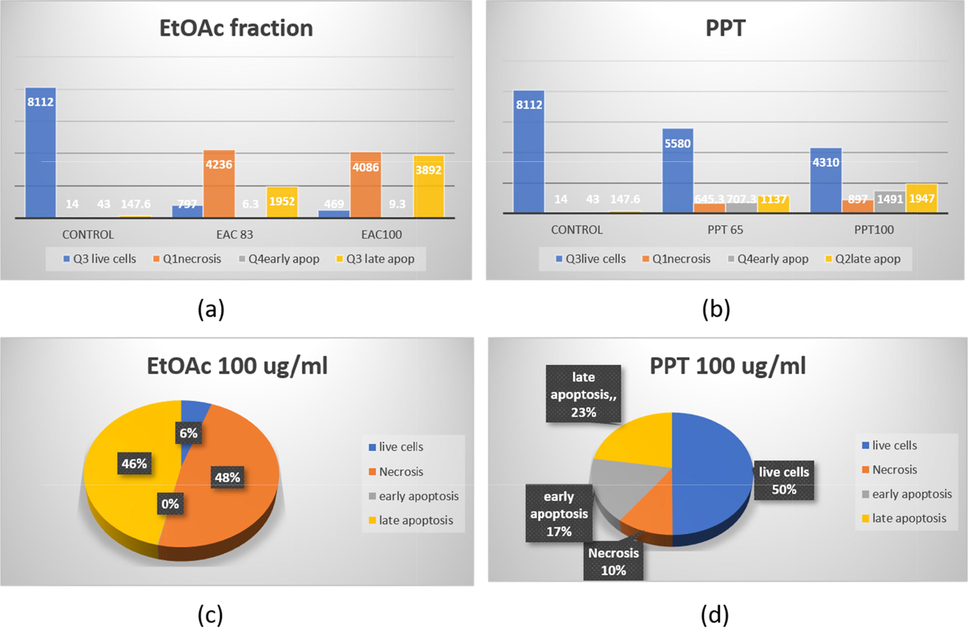
Apoptotic analysis of A. microcarpus treated with melanoma A375 cells (a) different concentrations of EtOAc fraction showing highly effect on late apoptosis in 100 µg/mL (b) different concentrations of PPT fraction showing a noticeable deficiency in live cells and noticeable increase in late apoptosis & necrosis with increasing concentration (c) highly effect on necrosis and apoptosis of the two fractions with same concentration 100 µg/ml (d) low effect on necrosis and apoptosis, increase live cell 50 % of the two fractions with the same concentration.
At a concentration of 65 µg/mL of PPT, 8.2 % of the cell population were in the necrosis stage, 8.2 % in early apoptosis, 14 % in late apoptosis, and 69 % live cells (Fig. S3b), while at a concentration of 100 µg/mL 11.6 % of cell population were in necrosis stage, 16.6 % in early apoptosis, 22.5 % in late apoptosis and 49.5 % live cells in relation of the control group (Fig. 9b). After 72 h of treatment EtOAc at concentration 83 µg/mL, necrosis stage increases approximately to 60.28 % and late apoptosis to 28.25 % and while live cells of 11 % were observed, but in EtOAc at concentration 100 µg/mL, necrosis stage of 48.16 %, and late apoptosis of 46.27 % and live cells of 5.4 % were reported in relation of the control group. Finally, the PPT at 65 µg/mL & 100 µg/mL, showed the low effects on necrosis and apoptosis (Figs. S2d, S2e).
A. microcarpus significantly showed a greatly effect in EtOAc fraction both on late apoptosis and necrosis at a concentration of 100 µg/mL (Fig. S4), early apoptotic cells (that retain cell membrane integrity), and late apoptotic cells (with compromised cell membranes), which act like necrotic cells (which also lack intact cell membranes).
The early apoptosis phase (Q4) means that cells just initiated the apoptosis programed cell death process with their cell membrane still intact, while late apoptosis phase (Q2) means that cells initiated the apoptosis programmed cell death process with their cell membrane perforated (damaged). The necrosis phase (Q1) means that cells undergoing a non-programmed cell death process (necrosis) with their cell membrane perforated (damaged). Normal intact cells are represented by the cell population in (Q3) segment.
4 Discussion
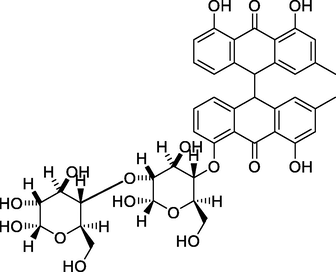
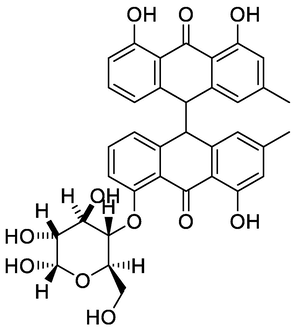
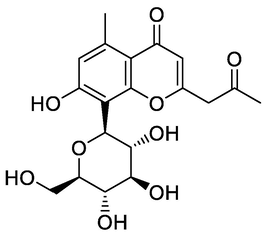
Nine compounds belonging to anthraquinone nucleus were identified, together with chromone derivatives and an aromatic primary alcohol. The anthraquinone derivatives (anthracenes) identified either in the glycosylated or aglycone form. Rafaëlly and his colleagues reported that the anthraquinone fragmentation exhibited two characteristic peaks at m/z [M+H − 28]+ and at m/z [M+H − 28–44]+ (Rafaëlly et al., 2008). This was clear from the application of this rule on chrysophanol (N1) for example, it showed a molecular ion peak at m/z 255.24 [M+H]+ and a fragmentation ion peak at 227.00, which indicated the CO (m/z = 28) loss. The intramolecular hydrogen bond formed between the carbonyl group of C-9 and the hydroxyl groups at positions C-1 and C-8 made the cleavage of the compound at C-10 more easily than at C-9. The MS2 fragmentation of the peak at m/z 227.00 resulted in a loss of methyl radical and CO2 from this fragment, and this was clear from the peaks at m/z 212 and 183, respectively. The predominant compound in both EtOAc fraction and PPT, 10, 10′-chrysphanol bianthrone-di-O-hexoside (N5), showed a base peak at m/z 803.41 [M+H]+, which upon fragmentation yielded fragments at m/z 641.14 and 479.14 [M+H]+ corresponding to the loss of one [M+H − 162]+ and two [M+H − 324]+ hexose units, respectively. The same loss of hexose [M+H − 162]+ moiety with a characteristic peak at m/z 479.14 had been shown for compound 10, 10′-chrysphanol bianthrone-O-hexoside (N6). The peaks at m/z 238.99 and 241.08 indicated the cleavage of dianthrone units to single units. This was clear in chrysophanol-10,10′-bianthrone which exhibited a characteristic peak at m/z 239.07 [M+H]+ corresponding to one anthrone unit. Bianthracene IV-O-hexoside showed a molecular peak [M+H]+ at m/z 655.29 with characteristic peaks at m/z 493.24 and 239.03 corresponding to loss of hexose unit [M+H-162]+ and chrysophanol unit. The chromone-C-glucoside, Aloesin showed a molecular peak [M+H]+ at m/z 395.03 and its first report in the genus Asphodelus was at A. albus and A. aestivus (Lazarova et al., 2020). The molecular [M+H]+ peak at m/z 461.36 and its characteristic fragment at m/z 415.16, loss of CO2, indicate the presence of carboxyl-chrysophanol-O-glucose (Milenković et al., 2012).
The cytotoxicity of the EtOAc fraction of A. microcarpus tuber against the human melanoma A375 cell line was assessed for the first time in this work utilizing the Sulforhodamine B assay, according to the most recent survey. Manosroi and his co-workers suggested that a sample that had an IC50 value of <125 μg/mL could be a possible candidate for further development as a cancer therapeutic agent and a test component with an IC50 value between 125 and 5000 μg/mL was considered to have moderate potential to be developed into a cancer therapeutic agent (Manosroi et al., 2006). Thus, A. microcarpus could be a feasible source for the treatment of cancer. There was no reported research on cytotoxic properties of A. microcarpus tubers, while the methanolic extract of the leaves exhibited cytotoxicity against human lung carcinoma (A-549), human breast cancer (MCF-7), human colon cancer (HCT-116) and human prostate carcinoma (PC-3) cell lines. The highest cytotoxic activity was observed against human lung carcinoma cells (A-549) with an IC50 value of 29.3 µg/ml (El-Ghaly 2017).
The tentatively identified anthraquinone compounds in the EtOAc fraction were reported exerting anticancer activity against various cell lines. Chrysophanol inhibited proliferation and induced apoptosis in MCF-7 and MDA-MB-231 breast cancer cell lines (Ren et al., 2018). Chrysophanol inhibited HepG2 cell viability in a time-dependent manner, with the highest inhibition at 10 μM (Cui et al., 2016). Trybus et al. reported that a substantial increase in apoptosis was seen after chrysophanol treatment using Annexin V/propidium iodide staining on HeLa cells (Trybus et al., 2021a). Physcion has a concentration-dependent effect on HeLa cells, causing apoptosis and autophagy, as well as oxidative damage and cell cycle disruption (Adnan et al., 2021, Trybus et al., 2021b). Aloesin had considerable concentration-dependent cytotoxicity against acute myeloid leukemia (AML) and acute lymphocyte leukemia (ALL) malignant cells, as well as a significant suppression of Ehrlich ascites carcinoma cell number. Internucleosomal DNA fragmentation, a hallmark of cells, was seen in variying degrees in human AML leukemic cells treated with 100 μ/mL (El-Shemy et al., 2010).
Plant-based dietary nutrients were linked to a lower risk of cancer in contrast to animal-based dietary nutrients (Campbell 2017). According to (Heth et al., 2000, Mahmiyat.ps 2016), the main food of underground blind mole rat Spalax leucodon Egyptiacus, is the plant-based nutrient A. microcarpus tubers. This may explain the fact why blind mole rats live exceptionally long lives, with an average lifespan of twenty-one years? (Edrey et al., 2012). Moreover, some reasons for the resistance of these mole rats to cancer have been stated. According to (Seluanov et al., 2008), blind mole rats demonstrate telomerase in their body tissues but do not utilize propagative senescence by way of an anticancer mechanism. Gorbunova et al. reported that blind mole rat cells release interferon β which causes planned cell death by apoptotic and necrotic processes (Gorbunova et al., 2012). Furthermore, blind mole rat cells secrete a substantial amount of hyaluronan, which may aid cancer resistance by suppressing reactive oxygen species (Tian et al., 2013).
However, there is no information on the relation between this blind mole rat's diet and cancer resistance. The anticancer activity of the anthraquinone-rich fraction of A. microcarpus tubers on the human melanoma cell line (A375) could be one of the key findings that aid in the understanding of the cancer resistance of the blind mole rat Spalax leucodon Egyptiacus. Further studies can be explored in detail using in vivo studies that look at the different mechanisms responsible for this activity.
5 Conclusion
This study demonstrated that anthraquinones were the most prevalent class of secondary metabolites in A. micrpcarpus tubers. Investigation of the ethyl acetate fraction of this plant using LC-MS/MS profiling exhibited the presence of 10, 10′-chrysphanol bianthrone-di-O-hexoside as the most prominent compound. The antiproliferative potential of this plant on human melanoma A375 cells was discussed. Apoptosis induction and cell cycle disruption were the key elements responsible for A. microcarpus' antiproliferative activity.
In addition to the future phytochemical isolation of these chemicals, more in vivo studies are needed to stand on the possible explanations and mechanisms for understanding this activity.
Funding
This research did not receive any specific grant from funding agencies in the public, commercial, or not-for-profit sectors.
CRediT authorship contribution statement
Dalia A. Abosedera: Methodology, Data curation, Writing – original draft. S.A. Emara: Conceptualization, Supervision, Validation. Omar A.S. Tamam: Conceptualization, Supervision, Validation. Osama M. Badr: Methodology, Supervision, Validation. Shaden A.M. Khalifa: Methodology, Data curation, Writing – review & editing. Hesham R. El-Seedi: Methodology, Data curation, Writing – review & editing. Mohamed S. Refaey: Data curation, Writing – original draft.
Acknowledgements
This study made use of the NMR Uppsala infrastructure, which is funded by the Department of Chemistry - BMC and the Disciplinary Domain of Medicine and Pharmacy.
Declaration of Competing Interest
The authors declare that they have no known competing financial interests or personal relationships that could have appeared to influence the work reported in this paper.
References
- Inhibition of cell-intrinsic NF-κB activity and metastatic abilities of breast cancer by aloe-emodin and emodic-acid isolated from Asphodelus microcarpus. J. Nat. Med.. 2021;75:840-853.
- [Google Scholar]
- Physcion and Physcion 8-O-β-D-glucopyranoside: Natural Anthraquinones with Potential Anticancer Activities. Curr. Drug Targets. 2021;22:488-504.
- [Google Scholar]
- Cytotoxicity of thymoquinone alone or in combination with cisplatin (CDDP) against oral squamous cell carcinoma in vitro. Sci. Rep.. 2017;7:1-12.
- [Google Scholar]
- Elucidation of the Metabolite Profile of Yucca gigantea and Assessment of its Cytotoxic, Antimicrobial, and Anti-Inflammatory Activities. Molecules. 2022;27:1329.
- [Google Scholar]
- Cytotoxicity of some plants of the asteraceae Family: antiproliferative activity of psiadia punctulata root sesquiterpenes. Rec. Nat. Prod.. 2019;13(10):25135.
- [Google Scholar]
- Cytotoxic properties of the anthraquinone derivatives isolated from the roots of Rubia philippinensis. BMC Compl. Altern. Med.. 2018;18:1-6.
- [Google Scholar]
- Preliminary study on the chemical constituents and# microbiologic activity of Asphodelus microcarpus (Salzm. et Viv.) Boll. Chim. Farm.. 1998;137:186-190.
- [Google Scholar]
- Anticancer drugs from marine flora: An overview (online) J. Oncol.. 2010;2010:214186.
- [Google Scholar]
- Rhein induces apoptosis in human breast cancer cells. Evidence Compl. Altern. Med.. 2012;2012
- [Google Scholar]
- Tumor-specificity and apoptosis-inducing activity of stilbenes and flavonoids. Anticancer Res.. 2005;25:2055-2063.
- [Google Scholar]
- Involvement of PI3K/Akt, ERK and p38 signaling pathways in emodin-mediated extrinsic and intrinsic human hepatoblastoma cell apoptosis. Food Chem. Toxicol.. 2016;92:26-37.
- [Google Scholar]
- Antiproliferative and antiangiogenic effects of the benzophenanthridine alkaloid sanguinarine in melanoma. Biochem. Pharmacol.. 2009;78:1374-1381.
- [Google Scholar]
- Tyrosinase inhibition and antioxidant properties of Asphodelus microcarpus extracts. BMC Compl. Altern. Med.. 2016;16:1-9.
- [Google Scholar]
- Broad-range potential of Asphodelus microcarpus leaves extract for drug development. BMC Microbiol.. 2017;17:1-9.
- [Google Scholar]
- Sustained high levels of neuregulin-1 in the longest-lived rodents; a key determinant of rodent longevity. Aging Cell. 2012;11:213-222.
- [Google Scholar]
- A newly isolated strain of Halomonas sp. (HA1) exerts anticancer potential via induction of apoptosis and G 2/M arrest in hepatocellular carcinoma (HepG2) cell line. Sci. Rep.. 2020;10:1-15.
- [Google Scholar]
- Phytochemical and biological activities of Asphodelus microcarpus leaves. J. Pharmac. Phytochem.. 2017;6:259-264.
- [Google Scholar]
- Antimicrobial arylcoumarins from Asphodelus microcarpus. J. Nat. Prod.. 2007;70:118-120.
- [Google Scholar]
- Antitumor properties and modulation of antioxidant enzymes' activity by Aloe vera leaf active principles isolated via supercritical carbon dioxide extraction. Curr. Med. Chem.. 2010;17:129-138.
- [Google Scholar]
- Improved method to track chlorophyll degradation. J. Agric. Food. Chem.. 2001;49:1117-1122.
- [Google Scholar]
- Isolation and characterization of new secondary metabolites from Asphodelus microcarpus. Med. Chem. Res.. 2014;23:3510-3515.
- [Google Scholar]
- Asphodosides AE, anti-MRSA metabolites from Asphodelus microcarpus. Phytochemistry. 2014;105:79-84.
- [Google Scholar]
- Biologically active secondary metabolites from Asphodelus microcarpus. Natl. Prod. Commun.. 2013;8 1934578X1300800822
- [Google Scholar]
- Apoptosis inducing metabolite from marine mangrove actinobacteria VITGAP173. Anti-cancer Agents Med. Chem. 2022
- [Google Scholar]
- Cancer resistance in the blind mole rat is mediated by concerted necrotic cell death mechanism. Proc. Natl. Acad. Sci.. 2012;109:19392-19396.
- [Google Scholar]
- Anthraquinones of certain Egyptian Asphodelus species. Zeitschrift für Naturforschung C.. 1974;29:351-354.
- [Google Scholar]
- Do Spalax ehrenbergi blind mole rats use food odours in searching for and selecting food? Ethol. Ecol. Evol.. 2000;12:75-82.
- [Google Scholar]
- Plant derived anticancer agents: A green approach towards skin cancers. Biomed. Pharmacother.. 2018;103:1643-1651.
- [Google Scholar]
- Insight into oroxylinA-7-O-β-D-glucuronide-enriched oroxylum indicum bark extract in oral cancer HSC-3 cell apoptotic mechanism: Role of mitochondrial microenvironment. Molecules. 2021;26:7430.
- [Google Scholar]
- Recent progress in understanding the pathology of malignant melanoma. J. Pathol.: J. Pathol. Soc. Great Britain Ireland. 2009;219:400-409.
- [Google Scholar]
- Metabolomics profiling and biological properties of root extracts from two Asphodelus species: A. albus and A. aestivus. Food Res. Int.. 2020;134:109277.
- [Google Scholar]
- Cutaneous melanoma: From pathogenesis to therapy. Int. J. Oncol.. 2018;52:1071-1080.
- [Google Scholar]
- Mahmiyat.ps., 2016. Plastine mole rat. from http://www.mahmiyat.ps/en/floraAndFauna/390.
- Journey of anthraquinones as anticancer agents–a systematic review of recent literature. RSC Adv.. 2021;11:35806-35827.
- [Google Scholar]
- Anti-proliferative activity of essential oil extracted from Thai medicinal plants on KB and P388 cell lines. Cancer Lett.. 2006;235:114-120.
- [Google Scholar]
- The identification of chlorophyll and its derivatives in the pigment mixtures: HPLC-chromatography, visible and mass spectroscopy studies. Adv. Technol.. 2012;1:16-24.
- [Google Scholar]
- Emergent nanotechnological strategies for systemic chemotherapy against melanoma. Nanomaterials. 2019;9:1455.
- [Google Scholar]
- Using molecular networking for microbial secondary metabolite bioprospecting. Metabolites. 2016;6:2.
- [Google Scholar]
- Optimisation of ESI-MS detection for the HPLC of anthraquinone dyes. Dyes Pigm.. 2008;77:191-203.
- [Google Scholar]
- Chrysophanol inhibits proliferation and induces apoptosis through NF-κB/cyclin D1 and NF-κB/Bcl-2 signaling cascade in breast cancer cell lines. Mol. Med. Rep.. 2018;17:4376-4382.
- [Google Scholar]
- Advances in immunotherapy for melanoma: a comprehensive review. Mediat. Inflammat.. 2017;2017
- [Google Scholar]
- Distinct tumor suppressor mechanisms evolve in rodent species that differ in size and lifespan. Aging Cell. 2008;7:813-823.
- [Google Scholar]
- Anthraquinone: a promising scaffold for the discovery and development of therapeutic agents in cancer therapy. Future Med. Chem.. 2020;12:1037-1069.
- [Google Scholar]
- High-molecular-mass hyaluronan mediates the cancer resistance of the naked mole rat. Nature. 2013;499:346-349.
- [Google Scholar]
- Physcion Induces Potential Anticancer Effects in Cervical Cancer Cells. Cells. 2021;10:2029.
- [Google Scholar]
- The potential antitumor effect of chrysophanol in relation to cervical cancer cells. J. Cell. Biochem.. 2021;122:639-652.
- [Google Scholar]
- Drug resistance and combating drug resistance in cancer. Cancer Drug Resist. (Alhambra, Calif.). 2019;2:141.
- [Google Scholar]
- Development of an UHPLC-MS/MS method for comparative pharmacokinetics of nine anthraquinones in rats and application to dosage conversion between different Semen Cassiae forms. J. Pharm. Biomed. Anal.. 2019;174:696-706.
- [Google Scholar]
- An epidemiological review of diet and cutaneous malignant melanoma. Cancer Epidemiol. Prevent. Biomar.. 2018;27:1115-1122.
- [Google Scholar]
Appendix A
Supplementary material
Supplementary data to this article can be found online at https://doi.org/10.1016/j.arabjc.2022.104174.
Appendix A
Supplementary material
The following are the Supplementary data to this article:Supplementary data 1
Supplementary data 1


