

Translate this page into:
Metabolomics-based profiling with chemometric approach to identify bioactive compounds in Salacca zalacca fruits extracts and in silico molecular docking
⁎Corresponding authors. jamshed_siddiqui@iium.edu.my (Mohammad Jamshed Siddiqui), haalshuyeh@iau.edu.sa (Hussah Abdullah Alshwyeh)
-
Received: ,
Accepted: ,
This article was originally published by Elsevier and was migrated to Scientific Scholar after the change of Publisher.
Abstract
Salak (Salacca zalacca) is well-known as snake fruit and it is immensely studied for its antioxidative and antidiabetic active metabolites throughout the southeast Asian countries. However, there are many remaining unidentified metabolites due to very low abundance and natural variation, which need to be further explored. Nowadays mass spectrometry (MS/MS) facilitates the tentative identification of unknown compounds in the crude herbal extracts. This study described the metabolite profiling of hydroalcoholic extracts of S. zalacca analysed by LC-QTOF-MS/MS. The 60% ethanolic extract exhibited the highest α-glucosidase inhibition and ferric reducing antioxidant power activities with IC50 of 15.94 µg/mL and 78.13 μg AAE/g, respectively. Multivariate data analysis (MVDA) by an orthogonal partial least-squares (OPLS) algorithm was conducted to correlate the α-glucosidase inhibition activity with the LC- QTOF-MS data. A total of 4 compounds were reported for first time in this fruit and identified based on the molecular mass and fragment ions. LC-QTOF-MS analysis indicated the presence of carexane I, 5-phenoxytetrazol-1-yl)-2,3,5,6-hexahydrofurofuran-3-ethylurea, 3-acetylphenoxy)-N-[(2)-1-amino-4-methyl-1-oxopentan-2-yl]-4,5-dihydroxycyclohexene-1-carboxamide and Ethyl 4-[5-methyl-2-oxo-1′,2′,5′,6′,7′,7′a-hexahydro-1H-spiro[indole-3,3′-pyrrolizine]-2′-ylamido] benzoate. Molecular docking of those compounds with the α–glucosidase enzyme was performed to confirm their antidiabetic potential. These bioactive compounds could be suggested as α-glucosidase inhibitors and functional food additives.
Keywords
Salacca zalacca
Snake fruit
LC- QTOF-MS
α-glucosidase inhibition activity
Antioxidant activity

1 Introduction
Diabetes mellitus (DM) is a chronic metabolic disorder that may lead to other macro- and micro-vascular complications. Type 2 DM is also known as non-insulin dependent diabetic mellitus (NIDDM) that accounts for more than 90% of all DM cases [1]. It is characterized by abnormal increase in blood glucose level (hyperglycemia) as a result of either insulin resistance or insulin deficiency or both (Patel and Macerollo, 2010). The symptoms of type 2 DM are similar to those observed in type 1 DM. There are many underlined factors responsible for type 2 DM. These include changes in life style, such as lack of body physical activity and high calorie intake, environmental factors as westernization and epidemiology, and genetic factor like family history (Tee and Yap, 2017). There are other diseases associated with type 2 DM, which include obesity, dyslipidemia and hypertension. History of impaired glucose tolerance (IGT), gestational diabetes and aging are also predisposing factors. If type 2 DM is poorly managed or ignored, it may cause different long-term complications, such as nephropathy (kidney failure), retinopathy (eye disease), neuropathy (nerve damage), foot sores and ulcers (peripheral vascular diseases).
α-Glucosidase (EC 3.2.1.20, α-D-glucoside glucohydrolase) is an enzyme secreted from the epithelium of intestine and catalyzes by the degradation of polysaccharides to monosaccharide (Moritoh et al., 2009). The inhibition of α-glucosidase is likely to interfere the digestion of carbohydrate and ultimately decrease the risk of postprandial hyperglycemia in diabetic patients. Currently, two types of drugs are used to inhibit the enzymatic activity of the α-glucosidase in the intestine, including the acarbose and the miglitol, which consequently reduce the postprandial hyperglycemia. However, the prolonged usage of these medications is frequently associated with undesirable side effects depending on dose, including abdominal pain, diarrhea, and flatulence. (Etxeberria et al., 2012). Therefore, the search for effective and safe α-glucosidase inhibitors from natural sources to develop a physiologically functional food, or to design drugs for use against diabetes, is of great interest. Several medicinal plants are used in different parts of the world for the treatment of DM (Saleh et al., 2020a). Numerous studies have shown the potency of the crude extracts of different plants as well as specific bioactive compounds in lowering blood glucose level (Su et al., 2013).
Salacca zalacca (Gaertn.) Voss (Arecaceae) is globally known as snake fruit and locally called salak in Malay language (Saleh et al., 2020b). It is widely distributed in South Asia and widely used as potential medicinal plant in recent times due to its anticancer, antioxidant, antidiabetic, and anti-inflammatory properties (Aralas et al., 2009; Saleh et al., 2018a). Sterols, phenolics, flavonoids, alkaloids and tannins are natural constituents of S. zalacca fruit (Leontowicz et al., 2006; Zaini et al., 2013). According to our previous study, the flesh of S. zalacca exhibited good α-glucosidase inhibition activity (Saleh et al., 2018b). However, it was difficult to identify bioactive metabolites only by FT-IR-based metabolomics. The LC-MS can be applied to compare the different ethanolic extracts from this fruit due to its precision and high sensitivity. The application of LC-MS for studying the bioactive compounds of these extracts is limited and warrant further research. Technically, this study was aimed to correlate the α-glucosidase inhibitory activity of S. zalacca fruits ethanolic extracts to their metabolites identified by MS, applying multivariate data analysis (MVDA) to identify its potential α- glucosidase inhibitors. Apart from that, all the inhibitors identified were subjected to molecular docking study using Saccharomyces cerevisiae isomaltase crystal structure obtained from the protein data bank. This in silico analysis can help to visualise the binding mode and interaction between the inhibitors and the proteins that cause the inhibitory activity.
2 Methods and chemicals
2.1 Chemicals
Methanol, sodium hydroxide and glycine were obtained from Merck (Darmstadt, Germany). Ethanol, potassium dihydrogen phosphate (KH2PO4), sodium carbonate (Na2CO3) and dimethyl sulfoxide (DMSO) were purchased from HmbG Chemicals Inc (Hamburg, Germany). Hydrochloric acid, formic acid and acetic acid were purchased from R & M® Marketing (Essex, UK). Quercetin, p-nitrophenyl-α-D-glucopyronase (PNPG), ascorbic acid, 1,1-diphenyl-2 picrylhydrazyl (DPPH, 95%), 2,4,6-tris (2-pyridyl)-s-triazine (TPTZ, 99%) and iron (III) chloride hexahydrate were obtained from Sigma-Aldrich® (St. Louis, Mo., USA). The α-Glucosidase enzyme from Saccharomyces cerevisiae was procured from Megazyme (Wicklow, Ireland).
2.2 Plant materials and extraction
The fresh fruits of S. zalacca were collected from Bukit Sagu plantation, Felda (Kuantan, Malaysia) and authenticated by the botanist Dr. Shamsul Khamis and the voucher specimen (PIIUM 0215) was deposited in the Kulliyyah of Pharmacy, International Islamic University Malaysia. The fruits were washed, peeled before cutting to small pieces. The flesh of the fruits were dried using the freeze dryer for 6 days. The dried fruits were ground using a laboratory blender to obtain very fine powder and kept at − 80 °C. Ten grams of ground fruits were placed in 500 mL conical flask followed by adding 300 mL of ethanol/water with various ratios (0:100, 20:80, 40:60, 60:40, 80:20 and 100:0; v/v). The mixtures were subjected to a sonicator bath for 1 h at room temperature (30 °C). The mixtures were then filtered through a Whatman filter paper (No. 1), concentrated using a rotary evaporator under vacuum at 40 °C and lyophilized in freeze drier (Saleh et al., 2018a). The crude extracts were stored at − 80 °C for future biological activities and LC- QTOF-MS analysis.
2.3 Determination of total phenolic content
The total phenolic content (TPC) of the S. zalacca fruit extracts was determined according to the previously described method (Ikram et al., 2009). Briefly, 50 μL of the extract solution was pipetted in a 96–well microplate, and then, it was mixed 50 μL of freshly prepared Folin–Ciocalteu reagent (10–fold dilution). The mixture was left to react at room temperature for 5 min, and then, 50 μL of 7.5% (w/v) Na2CO3 was added. After 45 min of incubation at room temperature, the absorbance was measured at 725 nm using UV–VIS spectrophotometer (Tecan, Männedorf, Switzerland). The standard curve was prepared using 50, 100, 150, 200, and 250 μg/L solutions of gallic acid in methanol. The results were expressed as μg of gallic acid equivalents per milligram dry weight (µg GAE/mg dry weight).
2.4 Determination of total flavonoids content
Total flavonoids content (TFC) of S. zalacca extracts was estimated according to the published procedure (Lou et al., 2014). Briefly, 0.1 mL of extract’s solution was added to 0.1 mL 2% (w/v) of aluminium chloride. Then, the reaction mixture was incubated for 1 h at room temperature, and absorbance was determined at 415 nm using UV–VIS spectrophotometer. A standard curve was constructed on the absorbance of quercetin between 5 and 200 µg/mL and the total flavonoid content was presented as mg of quercetin equivalents (QE) per 100 g dry extract.
2.5 Biological activity measurement
2.5.1 α-glucosidase inhibitory activity
The α-glucosidase inhibitory activity of the fruit’s extracts was estimated according to the methods described by Collins et al. (1997) with slight modifications. Briefly, A 100 µL of 30 mM phosphate buffer with pH 6.5 was added to each well and 10 µL of different concentrations (i.e., 320, 160, 80, 40, 20, 10, and 5 µg/mL) of S. zalacca fruits extracts were added to each well. A stock solution of the substrate p-nitrophenyl-α-D-galactopyranoside (PNPG) was initially prepared with 6 mg in 20 mL of 50 mM phosphate buffer pH 6.5. Quercetin (dissolved in DMSO) was used as a positive control. All the extracts were dissolved in DMSO. Afterwards, 15 µL of α-glucosidase enzyme solution (0.02 U/well) was added and allowed to incubate for 5 min at room temperature. After that, 75 µL of substrate (PNPG) was added to each well, and left for 15 min. By adding 50 µL of (2 M) glycine of pH 10, the reaction was stopped. The absorbance was measured using a spectrophotometer at 405 nm. The α-glucosidase inhibition was calculated based on the following equation:
α-Glucosidase inhibitory activity (%) = [(Acontrol − Asample)/Acontrol] × 100%
Where Acontrol is the absorbance control and Asample is the absorbance of sample.
IC50 is the concentration of extract required to inhibit 50% of the α-glucosidase inhibitory activity.
2.5.2 DPPH free radical scavenging activity
The free radical scavenging activity was determined as previously reported (Karthivashan et al., 2013) with slight modification. Briefly, 3.94 mg of DPPH was dissolved in 50 mL methanol. About 80 μL of the methanolic solutions of DPPH (0.2 M) was added to 20 μL extract in a 96–well microplate. An equal amount of alcohol was added to the control. Then, it was left in the dark at room temperature, and the absorbance was measured at 540 nm after 10 min. Ascorbic acid was used as a positive control. A control reaction was carried out without the test sample. Absorbance values were corrected for radical decay using blank solution. The percentage inhibition of the DPPH radical by the samples was calculated according to the following formula:
Where Acontrol is the absorbance control and Asample is the absorbance of sample.
2.5.3 Ferric reducing antioxidant power
The ferric reducing antioxidant power (FRAP) assay was determined according to the previously reported method (Szydłowska-Czerniak et al., 2011). A FRAP stock solution was initially prepared as 2.5 mL of a 10 mM TPTZ solution in 40 mM HCl, 2.5 mL of 20 mM FeCl3, and 25 mL of 0.1 M acetate buffer pH 3.6. The mixture was incubated in the oven for 10 min at 37 °C. About 20 μL of each different extract of S. zalacca was added to 40 μL of FRAP solution, followed by 140 μL of distilled water in a 96–well microplate produces a blue–coloured solution. Then, it was left at room temperature for 20 min in the dark. The absorbance was measured at 593 nm with a spectrophotometer and the standard curve was constructed. The results were corrected for dilution and expressed as μg of ascorbic acid/mg (µg AA/mg).
2.6 LC-QTOF-MS analysis
LC-QTOF-MS analysis was carried out according to Lawal et al. (2016) with some modifications. Briefly, 10 mg of each extracts was dissolved into 1 mL of 80% methanol then filtered through 0.45 µL microsyringe filter. The samples were injected on a Phenomenax Kinetex C18 core–shell technology 100 Å (250 × 4.6 mm, 5µ). The mobile phase consisted of 0.1% formic acid in water (solvent A) and methanol (solvent B). The composition gradient was: 0 min, 5% solvent B, 0–10 min, 100% solvent B, 10–20 min, 100% solvent B; 20–25 min 5% solvent B and 25–30 min 5% solvent B, with flow rate of 0.7 mL/min. The Q-ToF was operated in electrospray ionization (ESI) negative mode. Voltages of the capillary and sampling cone were set at 3 kV and 30 V, respectively. The desolvation flow was set to 700 L/h at 300 °C and the source temperature was set to 110 °C. The Q-ToF MS data were collected in the range of m/z 100 to 17,000 with a scan time of 0.2 s and the interscan delay time of 0.02 s. MS/MS data collection-range: m/z 100 to 1700 with the scan rate of 1 spectra/ scan with collision energy ramp of 30 to 35 eV.
MS data were acquired and analyzed with ACD/Spec Manager v.12.00 (Advanced Chemistry Development, Inc., ACD/Labs Toronto, Canada). The raw (*.xms) files were subsequently converted to netCDF (*.cdf) formats using ACD/Spec Manager v.12.00 (Advanced Chemistry Development, Inc., ACD/Labs Toronto, Canada). After conversion, the files were subjected to pre-processing, peak extraction, retention time correction, and alignment with XCMS (an acronym for various forms, X, of chromatography mass spectrometry). The XCMS package in R version 2.15.1 language (www.bioconductor.org) were performed by simple commands using XCMS’s default settings (http://masspec.scripps.edu/xcms/documentation.php). The resulting peak list was exported as a *. txtfile to Microsoft Excel (Microsoft, Redmond, WA). A list of the peaks detected was generated using the average area, corrected retention time, and m/z data as the identifier for the various peaks.
2.7 Molecular docking
Molecular docking is an important tool for exploring the interactions between an inhibitor molecule and the protein target. The crystal structure of α-glucosidase is not available yet, so, we used homology model as described by Murugesu et al. (2020). In brief, a 3D homology model of Saccharomyces cerevisiae α-glucosidase was constructed based on the complex crystal structure of α-d-glucose bound oligo-1,6-glucosidase with PDB ID: 3A4A which shares 85% similar and 72% identical sequence with α-glucosidase. The chemical structures of five pure compounds were obtained from the PubChem compound database (https://pubchem.ncbi.nlm.nih.gov). All the water molecules were removed from the protein structure using the AutoDockTools (The Scripps Research Institute, La Jolla, CA, USA) of the version 1.5.6. Prior to the molecular dockings, the homology model of the enzyme was developed according to the assay condition with pH of 6.5 using PDB2PQR Server, version 2.0.0 (National Biomedical Computation Resource, San Diego, CA, USA). After the docking process, the grid box resolution was centred at 21.272 X − 0.751 X 18.633, respectively along the x, y, and z axes, respectively, at a grid dimension of 126 Å × 126 Å × 126 to define the binding site. For the ligands, Gasteiger charges were added, while the rotatable bonds in the ligand were assigned with AutoDockTools and all torsions were allowed, to rotate. The docking jobs were performed with AutoDock using the Lamarkian genetic algorithm. A population size of 150 and energy evaluations of 2,500,000 (medium) were set to generate 50 ligand docked conformations. Biovia Discovery Studio (Biovia, San Diego, CA, USA) software was used to generate the 2D of interactions between the protein residues and the compounds. 3D superimposed diagram of the complex was rendered using PyMOL™ 1.7.4.5 (Schrödinger, LLC, New York, NY, USA).
2.8 Statistical analysis
The data were analyzed using the Minitab V17 (Minitab Inc., State College, PA). The data were subjected to analysis of ANOVA by Tukey's test comparison. All the experiments were performed in 6 replicates and the results were presented as mean ± SD. The difference was considered statistically significant when the P value was below 0.05.
3 Results
3.1 Total phenolic content and total flavonoid content
The results obtained from the TPC assay is shown in Table 1. TPC ranged from 3.08 to 14.94 µg GAE/mg. The TPC of 100% ethanol (E100) extract was 14.65 ± 0.56 µg GAE/mg and E60 extract had the highest TPC of 14.94 ± 0.96 µg GAE/mg, whereas E0 contained the lowest TPC of 3.08 ± 0.22 µg GAE/mg. The total flavonoid contents (TFC) of different extracts are presented in Table 1. The E80 extract showed the highest value with 12.37 ± 0.50 mg QU/100 g TFC, whereas E0 contained the lowest TFC of 4.96 ± 0.24 mg QU/100 g as compared to the other extracts. Values represent the mean ± standard deviation (SD), n = 6. The different small letter represents a significant difference (P < 0.05). ND: not determined.
Extracts (ethanol/water)
TPC (mg GAE/g)
TFC (mg QU/100 g)
DPPH%
FRAP (μg AAE/g)
α-glucosidase (IC50 µg/mL)
0% (E0)
3.08 ± 0.22a
4.96 ± 0.24a
36.18 ± 0.18a
55.46 ± 2.50a
271.46 ± 15.55a
20% (E20)
5.66 ± 0.49b
8.11 ± 0.28b
39.22 ± 0.94b
63.43 ± 3.02b
156.12 ± 9.96b
40% (E40)
8.81 ± 0.69c
8.51 ± 0.52b
40.59 ± 0.72b
72.54 ± 1.94c
175.81 ± 12.41c
60% (E60)
14.94 ± 0.96d
11.45 ± 0.56a
54.14 ± 1.61c
78.13 ± 1.31c
15.94 ± 2.52de
80% (E80)
13.96 ± 1.66d
12.37 ± 0.50ad
61.32 ± 1.15d
78.39 ± 2.09c
26.82 ± 1.49d
100% (E100)
14.65 ± 0.56d
10.99 ± 0.23d
55.95 ± 0.73c
75.55 ± 2.51c
19.15 ± 1.82de
Ascorbic acid
ND
ND
99.04 ± 0.22e
ND
ND
Quercetin
ND
ND
ND
ND
4.89 ± 0.48e
3.2 Antioxidant activity of S. Zalacca
The free radical scavenging activity was changed in a concentration-dependent manner as shown in Table 1. From all tested concentrations, the E80 extract displayed the strongest radical scavenging activity with 61.32% (P < 0.05) as compared to standard (ascorbic acid i.e., 99.04%). This was followed by the E100, E60, E40, and the least scavenging activity was obtained in E20 and E0 extracts of S. zalacca’s fruit i.e., 55.95, 54.14, 40.59, 39.22, and 36.18%, respectively. In ferric reducing antioxidant power assay, the reduction is done by a single electron from Fe3+ in the solution to Fe2+ (Mohamed et al., 2014). Results obtained from ferric reducing antioxidant power assay were expressed quantitatively in terms of μg ascorbic acid equivalent (AAE) per μg of ascorbic acid/g. For this study, ascorbic acid was used as standard. As shown in Table 1, it is obvious that E80 extract of the fruit of S. zalacca showed the highest antioxidant activity with 78.39 AAE μg. The activities of the other extracts were observed in the decreasing order as E60 ˃ E100 ˃ E40 ˃ E20 ˃ E0 with the values of 78.13, 75.55, 72.54, 63.43 and 55.46 AAE μg of ascorbic acid/mg, respectively.
3.3 α-Glucosidase inhibitory activity
Table 1 displays the IC50 values of S. zalacca fruits extracts obtained from the α- glucosidase inhibitory assay. The results showed that E60 had promising hypoglycemic effect via inhibition of α- glucosidase with the lowest IC50 value of 15.94 µg/mL that was found to be significant and comparable to that of the positive control i.e. quercetin. The highest value reflecting the lowest activity was observed for the E0 extract with the IC50 value of 271.46 µg/mL. Besides, E80 and E100 also showed potential IC50 values. Overall, 60% ethanolic solvent had potential to extract α- glucosidase inhibitors from S. zalacca fruits extracts.
3.4 MS-based metabolites profiling
Multivariate data analysis was used to determine the correlation between the bioactivity and the analysed spectra to identify the potential inhibitors that may be presented in the S. zalacca fruits extracts. By using the discriminant analysis, the OPLS model was carried out to show discrimination among the extracts and to identify the signals with m/z values (mass to charge ratio) together with their retention times that were significantly correlated with α-glucosidase inhibition activity (Javadi et al., 2014). The negative ionization was used, and the data were explained with 2 principal components (OPLS components 1 & 2). The identity of metabolites and IC50 values of the tested samples were considered as variables x and y, respectively. The goodness of fit for this model was dependent on the cumulative values in which Q2Y of the response as predicted by the model. The cross validation and R2Y indicates the validation of the model. In this study, Q2Y the R2Y values were 0.825 and 0.963, respectively. Thus, the model was considered good and free from overfitting since the cumulative values for both R2Y and Q2Y were greater than 0.5 (Eriksson et al., 2006). RMSEE was used to measure the performance and accuracy of the model by calculating the model’s average deviation from the data. Also, RMSECV was used in measuring performance and accuracy by determining the quality of the model to predict new samples. Lower RMSECV value indicates high predictive accuracy for the new samples. For this model, the RMSEE and the RMSECV values were found to be close to each other with values of 0.0194748 and 0.040409, respectively.
Fig. 1 indicates the score scatter plot of the various extractions were obtained from LC-MS negative mode of ionization. The plot demonstrates the distribution of the variables obtained from OPLS components 1 and 2 (13% and 10.2%). It vividly showed that there was a clear separation between the active and less active extracts from S. zalacca. Based on OPLS component 1, the active extracts (E100, E80 and E60) were well spread across the negative quadrant far from the other extracts, which were located in the positive quadrant.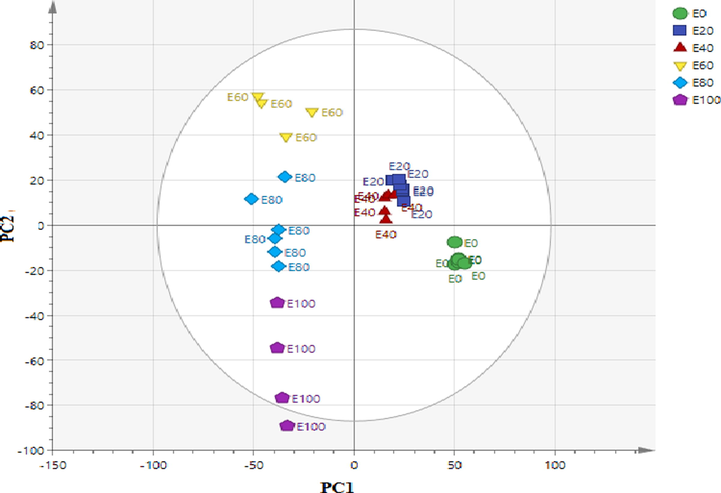
The orthogonal partial least-squares (OPLS) plots (PC1 vs. PC2) of the discrimination of S. zalacca extracts with various ethanol ratios (E0, E20, E40, E60, E80. E100) The numbers refer to the ethanol/water ratio; 0% (E0); 20% (E20); 40% (E40); 60%; (E60) 80% (E80) and 100% (E100).
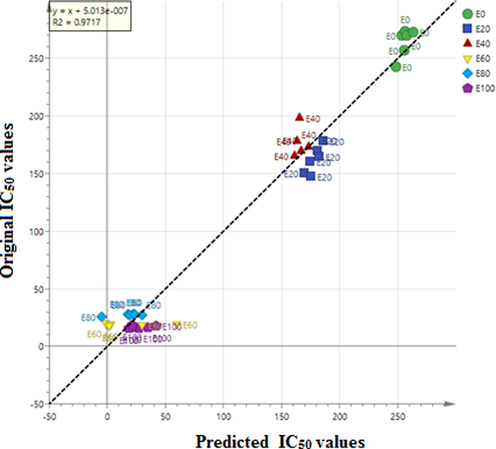
Fig. 2 represents the loading scatter plot of the different extracts of the S. zalacca fruit based on the negative ionization mode of the LC-MS. The samples with lowest IC50 values had the highest activity. Thus, the metabolites measured to be positively correlated with the α-glucosidase inhibiting activity were those labelled far from the IC50 value. The contribution of metabolites to α-glucosidase inhibitory activity from this fruit has not yet been reported. The identified compounds were (SZ1) 5,7-dimethoxy-2-phenyl-3-prop-1-en-2-yl-1,2,3,4-tetrahydronaphthalen-1-ol, (SZ2) 5-phenoxytetrazol-1-yl-2,3,5,6-hexahydrofurofuran-3-ethylurea, (SZ3) 3-acetylphenoxy-N-[(2)-1-amino-4-methyl-1-oxopentan-2-yl]-4,5-dihydroxycyclohexene-1-carboxamide, (SZ4) Ethyl 4-[5-methyl-2-oxo-1′,2′,5′,6′,7′,7′a-hexahydro-1H-spiro[indole-3,3′-pyrrolizine]-2′-ylamido]benzoate. Moreover, these compounds were abundant in the active extracts and they were considered as chemical markers. For model validation, the observed versus predicted plot, and the regression equation were used to check the OPLS model. The R2 value obtained was 0.9243. The model is valid and R2 was great with value of 0.9717 (Fig. 3).![The loading scatter of OPLS of the extracts of S. zalacca fruit. SZ1, 5,7-dimethoxy-2-phenyl-3-prop-1-en-2-yl-1,2,3,4-tetrahydronaphthalen-1-ol; SZ2, 5-phenoxytetrazol-1-yl)-2,3,5,6-hexahydrofurofuran-3-ethylurea; SZ3, 3-acetylphenoxy)-N-[(2)-1-amino-4-methyl-1-oxopentan-2-yl]-4,5-dihydroxycyclohexene-1-carboxamide; SZ4, Ethyl 4-[5-methyl-2-oxo-1′,2′,5′,6′,7′,7′a-hexahydro-1H-spiro[indole-3,3′-pyrrolizine]-2′-ylamido] benzoate.](/content/184/2021/14/4/img/10.1016_j.arabjc.2021.103038-fig2.png)
The loading scatter of OPLS of the extracts of S. zalacca fruit. SZ1, 5,7-dimethoxy-2-phenyl-3-prop-1-en-2-yl-1,2,3,4-tetrahydronaphthalen-1-ol; SZ2, 5-phenoxytetrazol-1-yl)-2,3,5,6-hexahydrofurofuran-3-ethylurea; SZ3, 3-acetylphenoxy)-N-[(2)-1-amino-4-methyl-1-oxopentan-2-yl]-4,5-dihydroxycyclohexene-1-carboxamide; SZ4, Ethyl 4-[5-methyl-2-oxo-1′,2′,5′,6′,7′,7′a-hexahydro-1H-spiro[indole-3,3′-pyrrolizine]-2′-ylamido] benzoate.
The regression plot of OPLS of S. zalacca extracts with various ethanol ratios (E0, E20, E40, E60, E80. E100) The numbers refer to the ethanol/water ratio; 0% (E0); 20% (E20); 40% (E40); 60%; (E60) 80% (E80) and 100% (E100).
3.5 Structure elucidation of bioactive compounds using fragmentation pathway
Elucidation of chemical structure of each parent ion was achieved by using MS-MS fragmentations. Confirmation of the metabolite identified was achieved through direct comparison with the databases, such as ACD Lab, Inc. (Toronto, Canada), previously published reports and the fragmentation pattern of the ions. Table 2 shows the summary of the fragmentation. The compounds identified were: (SZ1) 5,7-dimethoxy-2-phenyl-3-prop-1-en-2-yl-1,2,3,4-tetrahydronaphthalen-1-ol, (SZ2) 5-phenoxytetrazol-1-yl-2,3,5,6-hexahydrofurofuran-3-ethylurea, (SZ3) 3-acetylphenoxy-N-[(2)-1-amino-4-methyl-1-oxopentan-2-yl]-4,5-dihydroxycyclohexene-1-carboxamide, (SZ4) Ethyl 4-[5-methyl-2-oxo-1′,2′,5′,6′,7′,7′a-hexahydro-1H-spiro[indole-3,3′-pyrrolizine]-2′-ylamido]benzoate (Fig. 4).
M−H
MS/MS fragments ions
Tentative metabolites
SZ1
323.12
[M−C2H4O]¯ at m/z 279, [M−C2H4O2]¯ at m/z 263, [M−C6H8O2]¯ at m/z 211, [M−C8H6O]¯ at m/z 205, [C10H10O2]¯ at m/z 161, [M−C10H12O3]¯ at m/z 143 and [M−C13H16O]¯ at m/z 135
5,7-dimethoxy-2-phenyl-3-prop-1-en-2-yl-1,2,3,4-tetrahydronaphthalen-1-ol
SZ2
359.14
[M−C2H6N]¯ at m/z 315, [M−C6H4]¯ at m/z 283, [M−C8H8]¯ at m/z 255, [M−C9H10N2O]¯ at m/z 197, [M−C3H8N2O]¯ at m/z 271, [M−C9H12N2O2]¯ at m/z 179, [M−C10H8N4O2]¯ at m/z 143, [M−C11H10N4O3]¯ at m/z 113, [M−C12H10N4O3]¯ at m/z 101, [M−C12H10N6O2]¯ at m/z 89, [M−C15H18N2O3]¯ at m/z 85 and [M−C13H12N4O4]¯ at m/z 71
5-phenoxytetrazol-1-yl)-2,3,5,6-hexahydrofurofuran-3-ethylurea
SZ3
403.14
[M−H3N]¯ at m/z 386, [M−C3H7]¯ at m/z 343, [M- H2O]¯ at m/z 385, [M−C3H6]¯ at m/z 341, [M−C8H8O2]¯ at m/z 276, [M−C3H8]¯ at m/z 223, [M−C9H14N2O2]¯ at m/z 221, [M−O]¯ at m/z 205, [M−CH2]¯ at m/z 389, [M−C12H20N2O4]¯ at m/z 133,
3-acetylphenoxy)-N-[(2)-1-amino-4-methyl-1-oxopentan-2-yl]-4,5-dihydroxycyclohexene-1-carboxamide
SZ4
432.14
[M−H]¯ at m/z 431, [M−C7H6]¯ at m/z 342
[M−C3H5O2]¯ at m/z 359, [M−CH4]¯ at m/z 343, [M−C7H6]¯ at m/z 342, [M−C18H21N3O4]¯ at m/z 89
Ethyl 4-[5-methyl-2-oxo-1′,2′,5′,6′,7′,7′a-hexahydro-1H-spiro[indole-3,3′-pyrrolizine]-2′-ylamido] benzoate
![Chemical structures of bioactive compounds identified using MS/MS. SZ1, 5,7-dimethoxy-2-phenyl-3-prop-1-en-2-yl-1,2,3,4-tetrahydronaphthalen-1-ol; SZ2, 5-phenoxytetrazol-1-yl)-2,3,5,6-hexahydrofurofuran-3-ethylurea; SZ3, 3-acetylphenoxy)-N-[(2)-1-amino-4-methyl-1-oxopentan-2-yl]-4,5-dihydroxycyclohexene-1-carboxamide; SZ4, Ethyl 4-[5-methyl-2-oxo-1′,2′,5′,6′,7′,7′a-hexahydro-1H-spiro[indole-3,3′-pyrrolizine]-2′-ylamido] benzoate.](/content/184/2021/14/4/img/10.1016_j.arabjc.2021.103038-fig4.png)
Chemical structures of bioactive compounds identified using MS/MS. SZ1, 5,7-dimethoxy-2-phenyl-3-prop-1-en-2-yl-1,2,3,4-tetrahydronaphthalen-1-ol; SZ2, 5-phenoxytetrazol-1-yl)-2,3,5,6-hexahydrofurofuran-3-ethylurea; SZ3, 3-acetylphenoxy)-N-[(2)-1-amino-4-methyl-1-oxopentan-2-yl]-4,5-dihydroxycyclohexene-1-carboxamide; SZ4, Ethyl 4-[5-methyl-2-oxo-1′,2′,5′,6′,7′,7′a-hexahydro-1H-spiro[indole-3,3′-pyrrolizine]-2′-ylamido] benzoate.
Compound (SZ1) carexane I is a tricyclic compound bearing two methoxy groups on the ring A and 2-propenyl group on the saturated ring. In carexane I, the negative ionization mode (ESI) revealed that it was protonated at the methoxy group, with an m/z of 323. The removal of acetaldehyde (C2H4O) from this ion resulted in the formation of ions with m/z of 279. The loss of C2H4O2 from the parent ion resulted in the formation of the ion with an m/z of 263. In another pathway, the parent ion lost C6H8O2 to form the fragment with an m/z of 211. The removal of C8H6O from this parent ion resulted in the formation of ions with m/z of 205. A further fragmentation of the parent ion with a loss of C10H10O2 resulted with an m/z of 161 subsequently loss of C10H12O3 from the parent ion formed the ion with an m/z of 143. Finally, loss of C13H16O from parent ion resulted into a fragment with m/z of 135.
Compound (SZ2) is a substituted derivative of hexahydro furofuran with a substitution of 5-phenoxy-1,2,3,4-tetrazol-1-yl and 3-ethylurea groups. The negative ionization mode (ESI) formed the parent ion [M−H-] with an m/z of 359. Removal of ethyl amine (C2H6N) fragment from the parent ion resulted into an ion at m/z of 315. Loss of phenyl (-C6H4) from the parent ion yielded an ion at m/z 283 which on further fragmentation by losing an ethyl (C2H4) group produced an ion with an m/z of 255 which on rearrangement cyclized with furan ring with an m/z of 255. The subsequent loss of ethyl urea (C3H8N2O) and phenyl ring (C6H4) from parent ion peak resulted into a fragment with m/z of 197. Loss of ethyl urea (C3H8N2O) from the parent ion resulted into a fragment at m/z 271 which was further fragmented with a loss of phenoxy ring (C6H4O) and yielded a fragment with m/z of 179. Deprotonation of parent ion at furan ring resulted into an open the ring which was further rearranged to three membered ring with a loss of (C10H8N4O2) resulted into a fragment with m/z 143. Rearrangement of parent ion and loss of (C11H10N4O3) resulted into fragment with a four membered ring with m/z of 113 which further rearranged with m/z of 113. Deprotonation of parent ion and with several rearrangement resulted into a fragment with m/z of 101 which on further loss of (C12H10N5O2) yielded into a fragment with m/z of 89. Lastly, loss of (C15H18N2O) resulted into a hydroxy-tetrazolyl moiety with m/z of 85 which further rearranged to four membered cyclic ring with m/z of 71.
Compound (SZ3) was tentatively identified as (3-acetylphenoxy)-4,5-dihydroxycyclohexenyl-formamido-4-methylpentanamide, during negative ionization mode (ESI) formed the parent ion [M−H-] with an m/z of 403. Loss of ammonia (NH3) from the parent ion resulted into a fragment with m/z of 386 and subsequently loss of propane moiety (C3H7) yielded a fragment with m/z of 343. Deprotonation of parent ion on amine and subsequently loss of water (H2O) resulted into a fragment with m/z of 385 which on further loss of (C3H8) yielded a moiety with m/z of 341. Removal of acetyl-phenoxy group (C8H8O2) from parent ion resulted into a fragment with m/z of 267 which on further loss of (C3H8) yielded into a fragment with m/z of 223. Removal of C9H14N2O2 from parent ion resulted into a fragment with m/z of 221 and subsequently loss of oxygen yielded a fragment with m/z of 205. In the last loss of methylene CH2 from the parent ion resulted into a fragment with m/z of 389, several rearrangement and loss of C12H20N2O4 moiety yielded a fragment with m/z of 133.
Compound (SZ4) Ethyl 4--5-methyl-2-oxo-1′,2′,5′,6′,7′-hexahydro-1H-spiro[indole-3,3′-pyrrolizine]-2′-ylamido] benzoate, during negative ionization mode the Protonation at propionate group resulted in a parent ion with m/z of 432 [M−H-] with a loss of propionate group (C3H5O2) yielded a fragment with m/z of 359 subsequently rearrangement of fragment and loss of methane CH4 formed the fragment with m/z of 343. Removal of benzyl (C7H6) radical from parent ion resulted a fragment with m/z of 342. Parent ion was further deprotonated at methyl position in a negative ion mode with m/z of 431 while loss of benzyl (C6H7) resulted a fragment at m/z of 341 subsequently loss of (C18H21N3O4) resulted in a fragment with m/z of 89.
3.6 Docking of metabolites identified through MS/MS
All the identified metabolites responsible for the α-glucosidase inhibition were docked to the Saccharomyces cerevisiae isomaltase (SCI) crystal structure (PDB ID: 3A4A). The conformations showing the lowest binding energy for the compounds along with the interacting residues are summarized in Table 3.
Compound control
Binding energy (kcal/mol)
H-bond interacting residues
Other interacting residues
α-D-glucose (control ligand)
−6.02
ARG442, ASH69, HIE112, ASH215, GLH 277, ARG213, ASP352, HIE315
TYR72
Quercetin (positive control)
−8.24
LYS156, ASN415, GLU411, THR310, LEU313, PRO312
ARG315, PHE314
SZ1
−7.59
THR274, SER298, ILE272
VAL266, ILE262, ARG263
SZ2
−8.45
SER240, GLN239, SER241, LYS156, ASP242, GLN279, ASN415
TYR158, HIE280 ARG315
SZ3
−7.69
GLY309
PRO312, ASP307, VAL308, ALA329
SZ4
−9.67
HIE280, ARG315, ARG442
LYS156, ASP242, PHE159, PHE178, GLU411
The binding energy of the compounds with the interacting residues are shown in Table 3. Conducted docking simulation was validated by the control ligand. Meanwhile, quercetin used as positive control was analyzed in comparison to the compounds. Two of the identified compounds demonstrated a potentially lower binding energy from the docking results when compared to quercetin used as positive control, while the measured energy level for SZ2 and SZ4 were comparable to the control ligand. This shows the binding affinity of the metabolites to the protein chains compound SZ1 was observed to interact with THR274, SER298 and ILE272 through both H-bonding and Van der Waals interactions through hydrophobic contact with VAL266, ILE262 and ARG263 with a binding energy of −7.59 kcal/mol. Compound SZ2 displayed a binding affinity of −8.45 kcal/mol for the H- bonding interaction with SER240, GLN239, SER241, LYS156, ASP242 and GLN279, ASN415. The hydrophobic van der Waals interactions was noticed with TYR158, HIE280 and ARG315. Compound SZ3 also displayed a higher binding energy of −7.69 kcal/mol, involving interaction of GLY309 with the nitrogen attached to the tetrazine cycle through H-bonding: PRO312, ASP307, VAL308 and ALA329 residues through hydrophobic contact. Compound SZ 3 showed lower binding energy than the positive control despite only one residue interaction by a H-bond to its hydroxyl group.
Moreover, compound SZ4 showed a binding energy of −9.67 kcal/mol in which HIE280, ARG315 and ARG442 had interaction with a hydroxyl group through H-bonding; LYS156, ASP242, PHE159, PHE178 and GLU411 residues interacted via hydrophobic contact. All the above-mentioned four compounds predominantly displayed a hydrophobic nature through interacting with protein hydrophobic residues (Fig. 5). Fig. 6 illustrates the superimposed 3D diagram, representing the virtual binding site of the molecules in the enzymatic protein which exists predominantly in domain A which has the catalytic region. It is important to note that the main residues residing at the entrance of the active site pocket was involved in the hydrophobic interaction of all compounds. Overall, the interaction encompasses H-bonding with hydrophobic interactions (Van der Waals and π interactions) related to the nature of the compounds and interacting residues with the atoms. It was also observed that the binding site for SZ2, SZ3 and SZ4 were close to the active site pocket (Fig. 6), while SZ1 was outside of the pocket, indicating the presence of allosteric binding sites that may possibly alter the enzyme activity (Fig. 7).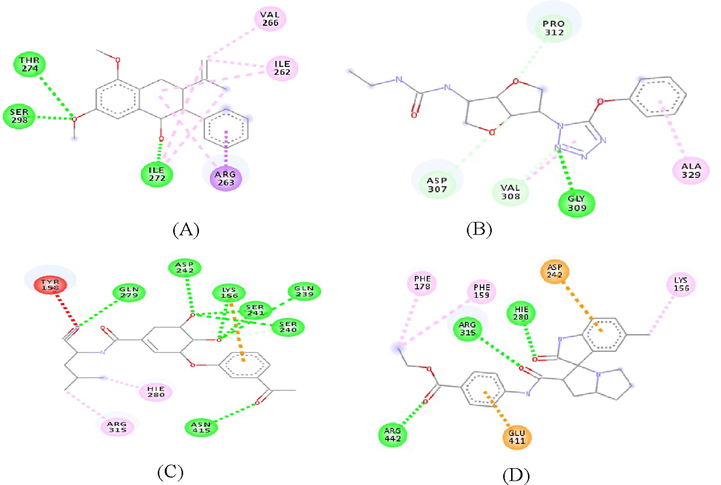
The 2D diagram of the interaction between the protein residues and the compounds A-SZ1, B-SZ2, C-SZ3 and D- SZ4. ARG, arginine; ASP, aspartate; LYS, lysine; ASN, asparagine; GLU, glutamate; THR, threonine; LEU, leucine; PRO, proline; PHE, phenylalanine; CYS, cysteine; PRO, proline, TYR, tyrosine; VAL, valine; ILE, isoleucine; ALA, alanine, GLN, glutamine.
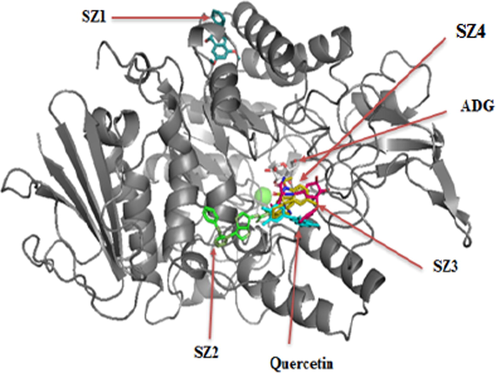
Superimposition of the identified compounds, quercetin and ADG in the binding site of enzyme.
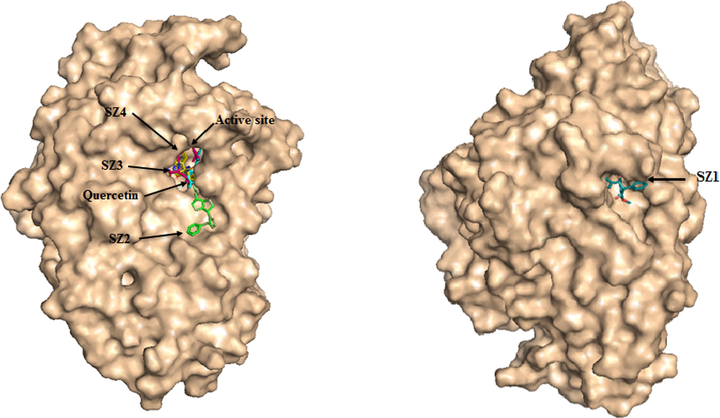
Predicted binding mode of SZ2, SZ3, SZ4 and SZ1 with α-glucosidase on molecular surface.
4 Discussion
The inhibitors of α-glucosidase help in slowing down the liberation of glucose from the disaccharides and oligosaccharides of carbohydrates to delay the absorption of glucose and reduce the postprandial glycemia in order to control hyperglycemia. Metabolomics is a qualitative and quantitative analysis of all metabolites present in an organism when subjected to different factors (Abdul Hamid et al., 2017; Mediani et al., 2015, 2012). Many advanced analytical tools are used in metabolomics to obtain high throughput analysis of both targeted and untargeted metabolites. The LC-MS is an efficient and suitable technique for rapid identification of the different metabolites and the abundance of primary metabolites. In recent times, LC-MS combined with MVDA had been employed for profiling and characterization of various plants (Javadi et al., 2015, 2014; Lawal et al., 2015; Mediani et al., 2012).
Compound (SZ1) Carexanes I is a new compound isolated for the first time from Carex distachya Desf. It contains a rare tricyclic skeleton which arises from a cyclization of prenyl stilbenoid precursors. It has been reported to exhibit strong antioxidant activity similar to ascorbic acid (Buommino et al., 2017). Moreover, Buommino et al. (2017) (Lawal et al., 2015) reported that carexanes could possibly be a candidate molecule for combatting the harmful effect of HspB protein and reduces the inflammatory process induced by H. pylori infection. Compounds SZ1-3 belong to the alkaloid, secondary metabolites in the fruits of S. zalacca. Alkaloids are nitrogen-containing molecules mostly derived from amino acids. Many alkaloids produced by plants are of high pharmaceutical value and have been used for the treatment of various diseases including diabetes (Choudhary et al., 2011; Zhen et al., 2017). However, no scientific study has ever been carried out for their α-glucosidase inhibition potential. In this regard, molecular docking approach could help to discover their true pharmacological potentials. Molecular docking is used for rapid screening of large number of compounds. Docking involves computation of ligand–protein interactions for molecular recognition and also for fast screening of databases for accurate prediction of the formation of protein structures and protein–ligand complexes for principal structure-based drug design (SBDD) (Lestari et al., 2017).
S. cerevisiae isomaltase structure consist of 589 amino acids which are folded into three domains: A, B and C. Jointly, in domain A the residues from 1 to 113 and 190–512 are found. While those from 114 to 189 and 513–589 are included in domain B and domain C, respectively. Domain A is regarded as catalytic domain comprising the catalytic residues such as ASP215, GLU277, and ASP352 located at the C-terminal. Apart from the catalytic residues, ASP62, TYR72, and ARG442 are also situated close to the active site. Therefore, they are involved in the catalytic reaction. All residues having interaction with ADG contribute to the catalytic reaction and its binding energy. As indicated in Table 3, ADG showed interaction with ASH215 (protonated ASP215), a conserved residue acting as the catalytic nucleophile. ADG also formed H-bond with the GLH277 (also protonated GLU277) residue acting as the general acid-base catalytic residue. Furthermore, ADG displayed interaction with ASP352, responsible for the stabilization of the substrate during the catalytic reaction, so to reinforce the acid-base hydrolysis reaction (Lawal et al., 2015). Virtually, isomaltase active site was occupied by five water molecules (which will bind to some of the residues to aid the catalytic action) influencing the enzyme’s activity. Precisely, the arrangement of the water molecules will be in such a way that the chain is close to the bottom of the active site pocket to form H-bonds directly with ASP69, ARG446, and ASP409. These water molecules also form H-bond with the N atom in VAL410 and GLU408 and carbonyl oxygen atom in the GLU408 residue. Formation of H-bond by water molecules also involves the GLU277, ARG213, and ASP352 residues. The binding site surroundings of water also has some hydrophobic amino acids such as, PHE303, TYR387, TRP58, TYR347, PHE301, and TYR389. The presence of these hydrophobic residues is due to the environment's hydrophobicity surrounding certain molecules of water that could increase their mobility. The actual role of these water molecules is to serve as a reservoir for the subsequent catalytic reaction to provide water and to work as a water drain at the active site to boost the analog binding of the substrate. Thus, despite the catalytic residues, the enzymatic activity also includes many other residues which interact with inhibitors thereby causing non-competitive inhibition. It is in fact obvious that the entrance of the active site pocket of isomaltase is shallow and primarily restricted by HIS280, TYR158, and loop 310–31 (Yamamoto et al., 2010).
From the docking results, it is was observed that SZ3 and SZ4 were likely to interact via hydrophobic contacts with the enzymatic protein residues therefore showing their hydrophobicity. Nevertheless, SZ3 and SZ4 showed better binding affinity with the residues involved, which indicates their positive potential toward the observed bioactivity. These compounds also displayed comparably binding energy level than quercetin used as positive control. The overall interactions involved predominantly, the residues residing in both domains A and B.
Compound SZ1 interactions typically involved residues at domain A but not with the catalytic residues. This may suggest that there was an indirect involvement of the compounds causing the inhibition of the enzymatic activity and also a non-competitive inhibition mode through an allosteric site interaction. All the remaining compounds displayed at least one interaction with the residues residing at the entrance of the active site pocket in which ASP242 was observed to show interaction with compounds 2 and 4, and ASP307 with compound 4. Zheng et al. (2017) reported that increasing the number of aromatic rings and addition of hydrogen-bond acceptor substituents at the 3-position were identified to be important to enhance the bioactivities of xanthones. Furthermore, these compounds also interact with residues in domain A through hydrophobic interaction close to the active site region suggesting that the compounds were acting in a non-competitive inhibition manner which result in an inhibitory action.
For this study, the in-silico docking simulation had convincingly provided supportive information on the possible interaction between identified inhibitors and the enzyme and hence enabling the prediction of the mode of inhibition and activity of the compounds. However, the enzyme-inhibitor complex can also be easily visualized using this technique and more investigations are required to evaluate the bioactivity of the identified compounds. This may be of advantage to determine their potential strength in the observed bioactivity and confirm their actual mechanism of actions. All the compounds identified were likely to interact with the residues of enzymatic protein through hydrophobic and H-bond contact. However, SZ1 showed an outstanding binding affinity with the bound residues. This demonstrated their potential toward the observed bioactivity.
5 Conclusion
The present study reports, for the first time, a detailed investigation on the flesh of S. zalacca fruits involving LC-QTOF-MS-based metabolomics. Findings presented herein revealed that S. zalacca extracts resulted from various ratio of ethanol and water demonstrated different effects in scavenging DPPH radicals, ferric reducing antioxidant power and inhibiting the a-glucosidase enzyme. The E60 extract showed potent α-glucosidase inhibition and antioxidant (FRAP)with IC50 values of 15.94 µg/mL and 78.13 μg AAE/g respectively. The constituents in the active extract were characterized using MS/MS method. A total 4 compounds reported for the first time in this fruit were identified carexane I, 5-phenoxytetrazol-1-yl)-2,3,5,6-hexahydrofurofuran-3-ethylurea, 3-acetylphenoxy)-N-[(2)-1-amino-4-methyl-1-oxopentan-2-yl]-4,5-dihydroxycyclohexene-1-carboxamide and Ethyl 4-[5-methyl-2-oxo-1′,2′,5′,6′,7′,7′a-hexahydro-1H-spiro[indole-3,3′-pyrrolizine]-2′-ylamido] benzoate. The molecular interactions of the inhibitors identified with the protein were predominantly hydrogen bonding involving residues namely THR274, SER298, ILE272, SER240, GLN239, SER241, LYS156, ASP242, GLN279, ASN415, HIE280, ARG315, ARG442, and GLY309 residues with hydrophobic interaction. In conclusion, this study provides evidence that S. zalacca fruits possesses antioxidant and α-glucosidase inhibition activities and may be an asset to the development of food industry and medicinal preparation.
Acknowledgments
The author would like to acknowledge the support of Kulliyyah of Pharmacy and grant (RMCG20-028-0028) provided by Research Management Centre, International Islamic University Malaysia and Atta-ur-Rahman Institute for Natural Product Discovery, Universiti Teknologi MARA for their technical supports and dedication.
Declaration of Competing Interest
The authors declare that they have no known competing financial interests or personal relationships that could have appeared to influence the work reported in this paper.
References
- Characterization of metabolites in different kiwifruit varieties by NMR and fluorescence spectroscopy. J. Pharm. Biomed. Anal.. 2017;138:80-91.
- [CrossRef] [Google Scholar]
- Aralas, S., Mohamed, M., Fadzelly Abu Bakar, M., 2009. Antioxidant properties of selected salak (Salacca zalacca) varieties in Sabah, Malaysia. Nutr. Food Sci., vol. 39, 243–250. https://doi.org/10.1108/00346650910957492.
- Evaluation of the antioxidant properties of carexanes in AGS cells transfected with the Helicobacter pylori’s protein HspB. Microb. Pathog.. 2017;108:71-77.
- [CrossRef] [Google Scholar]
- Choudhary, M.I., Adhikari, A., Rasheed, S., Marasini, B.P., Hussain, N., Kaleem, W.A., Atta-Ur-Rahman, 2011. Cyclopeptide alkaloids of Ziziphus oxyphylla Edgw as novel inhibitors of α-glucosidase enzyme and protein glycation. Phytochem. Lett., vol. 4, 404–406. https://doi.org/10.1016/j.phytol.2011.08.006.
- Inhibition of glycohydrolase enzymes by aqueous extracts of Chinese medicinal herbs in a microplate format. Biochem. Mol. Biol. Int.. 1997;42:1163-1196.
- [Google Scholar]
- Multi-and megavariate data analysis: part I: basic principles and applications ((2nd ed.) ed.). Sweden: Umetrics Academy (Appendix I); 2006.
- Antidiabetic effects of natural plant extracts via inhibition of carbohydrate hydrolysis enzymes with emphasis on pancreatic alpha amylase. Exp. Opin. Therapeut. Targets. 2012;16:269-297.
- [Google Scholar]
- Antioxidant capacity and total phenolic content of Malaysian underutilized fruits. J. Food Compos. Anal.. 2009;22:388-393.
- [CrossRef] [Google Scholar]
- GC-MS-based metabolite profiling of Cosmos caudatus leaves possessing alpha-glucosidase inhibitory activity. J. Food Sci.. 2014;79:1130-1136.
- [CrossRef] [Google Scholar]
- Effect of storage time on metabolite profile and alpha-glucosidase inhibitory activity of Cosmos caudatus leaves - GCMS based metabolomics approach. J. Food Drug Anal.. 2015;23:433-441.
- [CrossRef] [Google Scholar]
- Identification of bioactive candidate compounds responsible for oxidative challenge from hydro-ethanolic extract of Moringa oleifera leaves. J. Food Sci.. 2013;78
- [CrossRef] [Google Scholar]
- Metabolite profiling of Ipomoea aquatica at different growth stages in correlation to the antioxidant and α-glucosidase inhibitory activities elucidated by 1H NMR-based metabolomics. Sci. Hortic.. 2015;192:400-408.
- [CrossRef] [Google Scholar]
- Bioactive properties of Snake fruit (Salacca edulis Reinw) and Mangosteen (Garcinia mangostana) and their influence on plasma lipid profile and antioxidant activity in rats fed cholesterol. Eur. Food Res. Technol.. 2006;223:697-703.
- [CrossRef] [Google Scholar]
- Docking sulochrin and its derivative as α-glucosidase inhibitors oef Saccharomyces cerevisia. Indonesian J. Chem.. 2017;17:144.
- [Google Scholar]
- Flavonoid compositions and antioxidant activity of calamondin extracts prepared using different solvents. J. Food Drug Anal.. 2014;22:290-295.
- [CrossRef] [Google Scholar]
- 1H-NMR-based metabolomics approach to understanding the drying effects on the phytochemicals in Cosmos caudatus. Food Res. Int.. 2012;49:763-770.
- [CrossRef] [Google Scholar]
- Phytochemical and biological features of Phyllanthus niruri and Phyllanthus urinaria harvested at different growth stages revealed by 1H NMR-based metabolomics. Ind. Crops Prod.. 2015;77:602-613.
- [CrossRef] [Google Scholar]
- Chemical composition, antioxidant capacity, and mineral extractability of Sudanese date palm (Phoenix dactylifera L.) fruits. Food Sci. Nutr.. 2014;2:478-489.
- [CrossRef] [Google Scholar]
- Voglibose, an alpha-glucosidase inhibitor, to increase active glucagon-like peptide-1 levels. Mol. Cell. Pharm.. 2009;1:188-192.
- [Google Scholar]
- The investigation of antioxidant and antidiabetic activities of Christia vespertilionis leaves extracts. S. Afr. J. Bot.. 2020;133:227-235.
- [CrossRef] [Google Scholar]
- Patel, P., Macerollo, A., 2010. Diabetes mellitus: diagnosis and screening 81, 863–870.
- GC-MS analysis of metabolites from soxhlet extraction, ultrasound-assisted extraction and supercritical fluid extraction of Salacca zalacca flesh and its alpha-glucosidase inhibitory activity. Natural Product Research. 2020;2020:1341-1344.
- [CrossRef] [Google Scholar]
- Modulation of metabolic alterations of obese diabetic rats upon treatment with Salacca zalacca fruits extract using 1H NMR-based metabolomics. Food Res. Int. 2020;137
- [CrossRef] [Google Scholar]
- Salacca zalacca: A short review of the palm botany, pharmacological uses and phytochemistry. Asian Pacific J. Trop. Med.. 2018;11:645-652.
- [CrossRef] [Google Scholar]
- Saleh, M.S.M., Siddiqui, M.J., So’ad, S.Z.M., Roheem, F.O., Saidi-Besbes, S., Khatib, A., 2018b. Correlation of FT-IR fingerprint and α-glucosidase inhibitory activity of salak (Salacca zalacca) fruit extracts utilizing orthogonal partial least square. molecules 23, 1–10. https://doi.org/10.3390/molecules23061434.
- Inhibitory effects of medicinal mushrooms on α-amylase and α-glucosidase – enzymes related to hyperglycemia. Food Funct.. 2013;4:644-649.
- [CrossRef] [Google Scholar]
- Effect of refining processes on antioxidant capacity, total contents of phenolics and carotenoids in palm oils. Food Chem.. 2011;129:1187-1192.
- [CrossRef] [Google Scholar]
- Type 2 diabetes mellitus in Malaysia: Current trends and risk factors. Eur. J. Clin. Nutr.. 2017;71:844-849.
- [CrossRef] [Google Scholar]
- Crystal structures of isomaltase from Saccharomyces cerevisiae and in complex with its competitive inhibitor maltose. FEBS J.. 2010;277:4205-4214.
- [CrossRef] [Google Scholar]
- Purification and characterization of membrane-bound polyphenoloxidase (mPPO) from Snake fruit [Salacca zalacca (Gaertn.) Voss] Food Chem.. 2013;136:407-414.
- [CrossRef] [Google Scholar]
- Synthesis of novel flavonoid alkaloids as α-glucosidase inhibitors. Bioorg. Med. Chem.. 2017;25:5355-5364.
- [CrossRef] [Google Scholar]
- Docking-assisted 3D-QSAR studies on xanthones as α-glucosidase inhibitors. J. Mol. Model.. 2017;23:1-12.
- [CrossRef] [Google Scholar]


