

Translate this page into:
Metabolomics comparison of chemical components and metabolic regulations in different parts of Eucommia ulmoides Oliv
⁎Corresponding author. Xpfdc153@163.com (Peifeng Xue)
-
Received: ,
Accepted: ,
This article was originally published by Elsevier and was migrated to Scientific Scholar after the change of Publisher.
Abstract
Abstract
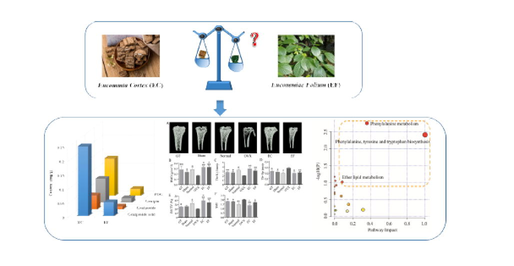
Eucommia ulmoides Oliv. (EU) is an herb with variety of pharmacological activities. As the demand for EU as a medical source increases, its limited availability is becoming an urgent problem. The bark of EU—Eucommia cortex (EC)—was the main medicinal part of EU, whose yield has been too low to meet market requirements. The EU leaves—Eucommiae folium (EF)—obtained easily from the trees, traditionally considered less valuable than the EU bark. This study compared chemical components and metabolic regulations in different parts of EU using metabolomics to explore the potential for alternative medical sources of EU. The results demonstrated that the composition of EC differs slightly from the composition of EF, and there are some differences in the content of individual ingredients between EC and EF. Combined pharmacodynamic/metabolomics analysis showed that both EC and EF could improve the bone metabolism markers and trabecular microarchitecture of ovariectomized rats mainly by intervening in amino acid metabolism. Our data suggest that EF is a potential alternative medicinal option when EU resources are scarce, and this study provides a mechanistic framework for the benefits of EF in osteoporosis disease.
Keywords
Chemical components
Metabolic regulations
Eucommia cortex
Eucommiae folium
Metabolomics comparison

- EU
-
Eucommia ulmoides Oliv
- EC
-
Eucommia cortex
- EF
-
Eucommiae folium
- ALP
-
Alkaline phosphatase
- HPLC
-
High performance liquid chromatography
- HPLC-Q-Exactive/MS
-
High-performance liquid chromatography-quadropole-Exactive-mass spectroscopy
- GT
-
Gushukang-treated group
- OVX
-
Ovariectomized group
- BMD
-
Bone mineral density
- Tb × Sp
-
Trabecular separation
- Tb × N
-
Trabecular number
- BV/TV
-
Percent bone volume
- SMI
-
Structure model index
- QC
-
Quality control
- VIP
-
Variable importance in the projection
- OPLS–discriminant analysis
-
Orthogonal projections to latent structures
- DA
-
discriminant analysis
- HMDB
-
Human Metabolome Database
- RSDs
-
Relative standard deviations
- MS/MS
-
Tandem mass spectroscopy
- 5-HT
-
Serotonin
- lyso-PAF
-
Lyso-platelet-activating factor
Abbreviations
1 Introduction
Eucommia ulmoides Oliv. (EU), also called Du-Zhong, is one of the earliest and most important crude herbs; it is exploited by both pharmaceutical and food industries in China (He et al., 2014; Yan et al., 2018; Committee, 2020). Eucommia cortex (EC), the bark of EU, is considered the main medicinal part of this plant, and it has been consumed for its pharmacological value in clinical treatment. According to ancient records (Greenway et al., 2011; Niu et al., 2016; Shi et al., 2019), EC was commonly used to improve the function of the liver and kidneys, prevent miscarriages, lower blood pressure, reinforce the muscles and bones, and increase longevity. However, EC must be obtained after trees have grown for 15 to 20 years (Liu et al., 2020a). Picking EC requires a high level of costs and man power, but the yield of EC has been too low to meet market requirements. As the demand for EU increases, the need to search alternative sources of its medicinal benefits also increases. An exploration of alternative medicinal sources is crucial to navigate the shortage of EC.
EU is the plant of a single family, single genus, and single species, so discovering new sources in the same species is an impossibility (Du and Du, 2020). The development of new sources of EU can only start with its own biological organs, such as Eucommiae folium (EF) and Eucommiae flosmale. Although EF is leafs of EU and has beneficial effects on blood pressure, glucose levels, and lipid levels (Lee et al., 2018; Lee et al., 2019; Guo F. F. et al., 2020), whether EF can be used instead of EC as a product to treat osteoporosis remains unclear. Little attention have been devoted to comparing the biological differences in anti-osteoporosis activity between EC and EF, and little research have been conducted to explore the possible mechanism of EC and EF actions on inhibitory activity in osteoporosis (Guo et al., 2020a, 2020b). Recent reports (Gao et al. 2013; Yang et al., 2005; Song et al. 2017) suggest that EC is mainly consumed in the treatment of osteoporosis including primary osteoporosis and postmenopausal osteoporosis. Jin and her colleagues (Jin et al. 2021) have previously shown that EC (108 times, 43.90 %), Herba Epimedii (102 times, 41.46 %), and Radix Rehmanniae Preparata (98 times, 39.84 %) were the top three herbs with the highest frequency in traditional Chinese medicine compound patent for the treatment of osteoporosis based on data mining in recent ten years. EC is also one of the first category drugs in the prevention and treatment of postmenopausal osteoporosis according to Qin’s research (Qin et al. 2018). According to this statistics, almost sixty percent of the prescriptions for treating osteoporosis in Chinese medicine contain EC, suggesting that EC is an indispensable herbal material in the treatment of osteoporosis. Therefore, it is important to study whether EF could be the potential for alternative medical sources of EC in terms of osteoporosis.
Chemical ingredients are the material basis of herbs and reflect their affinity for pharmacology (Li et al., 2017; Li et al., 2020; Wu et al., 2020). Some researchers have evaluated the chemical compounds in EF and EC to determine whether EF could be used as a substitute for EC (Liu et al., 2020b). This method, however, omitted the connection between the components and the physiological effects from different parts of EU. A single physiological efficacy measurement used to assess the equivalence of different parts of EU did not reflect the multi-target comprehensive effects obtained with Chinese herbs. Metabolomics technology is a method based on a high-resolution, high-throughput detection platform to comprehensively analyze the chemical composition of samples and to explore the changes of the metabolite content in biological samples for understanding physiological mechanisms (Johnson et al., 2016). Researchers have previously shown that metabolomics can intuitively reflect the differences in herbal materials and evaluate their quality (Wang et al., 2015). To evaluate whether EF can be used instead of EC in anti-osteoporosis products, we proposed a method to compare the chemical and biological differences between EC and EF. The major procedures of this method include the following steps: (1) validation of the chemical differences between EC and EF; (2) comparison of the anti-osteoporosis–related biological activity of EC and EF to test the hypothesis; and (3) exploration of the alterations in endogenous metabolites and metabolic pathways affected by EC and EF using metabolomics to comprehensively analyze the equivalence of EC and EF. The combination of these findings may provide some helpful and comprehensive evidence about whether EF could be a complementary or alternative material to EC with regard to anti-osteoporosis effects.
2 Materials and methods
2.1 Chemicals and reagents
EC and EF were purchased from Bozhou Pharmaceutical Company, ltd. (Anhui, China) and were morphologically authenticated by Professor Xue. The voucher specimens were also deposited in the herbarium of the Inner Mongolia Medical University (#20190822 and #20190823). Chloral hydrate (CCl3CH(OH)2,), Gushukang granules, and saline (NaCl) were obtained from Ze Sheng Biotechnology Company (Hohhot, China). Methanol (CH3OH) and formic acid (HCOOH) (MS grade) was purchased from Fisher Scientific Corporation (Loughborough, UK). Ultra-high-purity water (18.2 MΩ) was acquired from an ALH-600-U purification system (Chongqing, China). Enzyme-linked immunosorbent assay kits for osteocalcin, serum phosphorus, and alkaline phosphatase (ALP) were obtained from Hua Lian Biotechnology Institute (Wuhan, China).
2.2 Plant extraction preparation and determination before animal experiments
The final preparation of EC and EF extracts was carried out as described in our previous paper (Guo et al., 2020a). EC and EF were crushed to fine powder (over 40 mesh screens), and 200 g of the powder was reflux-extracted twice with 1.88 L of 64 % methanol for 2 h. After filtration, the filtrate was collected and concentrated. Methanol was removed from the desorption solution by rotary evaporation at 40℃followed by freeze-drying at −80℃. The extraction yields of EC and EF were 18.0 % and 33 %, respectively. The dried powders were stored in a refrigerator at − 20℃ and dissolved in an appropriate amount of distilled water or saline before HPLC-Q-Exactive/MS analysis or animal experiment. Thus, distilled water and saline were selected as solvent control in HPLC-Q-Exactive/MS analysis and animal experiment, respectively.
The fingerprintings of EC and EF in different batches were achieved by high performance liquid chromatography (HPLC) (Supplementary Fig. S1), and several ingredients of EC and EF extracts were identified by high-performance liquid chromatography-quadropole-Exactive-mass spectroscopy (HPLC-Q-Exactive/MS) (Thermo Fisher Scientific Inc., MA, USA). In order to confirm the structure of these compounds more accurately, ten components including chlorogenic acid were verified by comparing the retention time and molecular features with standard substances. The main components in the EC and EF extract samples are listed in Supplementary Table S1. The contents of main components in EC and EF extracts sample are shown in Supplementary Table S2.
2.3 Animal experiments
Twelve-week-old Wister rats, 190–220 g in weight, were purchased from the animal experiment center of the Inner Mongolia Medical University. All rats were kept in a clean area for 1 week to adapt to the environment. Subsequently, they were equally randomly assigned to six groups (six rats per group): a normal group (normal), an ovariectomized group (OVX), a sham group (sham), a Gushukang-treated group (GT), an EC-treated group (EC), and EF-treated group (EF). All rats except those in the normal group and the sham group underwent bilateral ovariectomy. Bilateral laparotomy was carried out in the sham group. Seven days after surgery, all rats were subjected to keratinization experiments involving the vaginal epithelium to evaluate whether the models were successfully established. The animal study was reviewed and approved by the Animal Ethics Committee of Inner Mongolia Medical University (Reference: SCXK2015-0001).
After the OVX model was successful built, all rats were gavaged with treatment once a day: the normal, OVX, and sham group rats were given 2 mL of 0.9 % saline daily; the GT group rats were given Gushukang granules (105.1 mg/kg/d, which was the clinical equivalent dose) as an positive control. The EC group was given 0.36 g/kg/d of EC extract (equivalent to 2.0 g/kg/d of raw medicine), and the EF group was given 3.3 g/kg/d of EF extract (equivalent to 10.0 g/kg/d of raw medicine). After 8 weeks of treatment administration, all rats were fasted 12 h, and then anesthetized by intraperitoneal injection of 10 % chloral hydrate, and blood samples were obtained. The serum was separated by centrifugation at 3,500 rpm for 10 min at 4 °C, and supernatants were stored at − 80 °C. The left tibia was also removed from each animal, and these samples were fixed in formalin to await analysis.
2.4 Analysis of bone mineral density and trabecular microarchitecture
X-ray microtomography was used to analyze bone mineral density (BMD) and trabecular microarchitecture. All tibias were fixed with 70 % ethanol and subjected to X-ray microtomography with an isotropic voxel size of 10 μm. Tomographic images were acquired at an integration time of 250 msec with 500 projections during the full 360° rotation. Three-dimensional reconstructions were generated with the following parameters: smoothing was set to 3; ring artifacts reduction was set to 5; and beam hardening correction was set to 30 %. BMD, trabecular separation (Tb × Sp), trabecular number (Tb × N), percent bone volume (BV/TV), and structure model index (SMI) were all determined by analyzing a specific region of interest that was chosen by setting the same coordinates in the tibia growth plate for each sample.
2.5 Preparation of serum samples
The serum samples were removed from a refrigerator set at − 80 °C and thawed to 4 °C. A 200-µL quantity of serum was spiked into methanol at a volume ratio of 1:3. The mixture was vortex for 3 min, stood for 10 min, and was centrifuged at 4 °C and 13,000 rpm for 10 min to remove protein. The supernatant was transferred to a new centrifuge tube and dried using a vacuum centrifugal concentrator (CVE-3000; EYELA, Tokyo, Japan). Subsequently, the residue was reconstituted in 100 μL of methanol and centrifuged at 13,000 rpm for 10 min at 4 °C before HPLC-Q-Exactive/MS analysis.
The quality control (QC) sample was obtained by mixing equal volumes (10 μL) of each test serum sample, and it was prepared by the same method described above to remove the protein. One QC sample was injected into a HPLC-Q-Exactive/MS system after 10 test samples.
2.6 Metabolomics analysis based on HPLC-Q-Exactive/MS
HPLC-Q-Exactive/MS was used to analysis metabolomics. Analytes extracted from serum samples were separated on a HSS T3 column (Waters Acquity UPLC HSS T3 column; 2.1 × 50 mm, 1.8 μm) at a column temperature of 35 °C. A gradient elution program at the flow rate of 0.4 mL/min was established as follows: 5 % A up to 15 % A (0–1.7 min); 15 % A up to 17 % A (1.7–3.0 min); 17 % A (3.0–3.3 min); 17 % A up to 25 % A (3.3–8.0 min); 25 % A up to 30 % A (8.0–9.7 min); 30 % A up to 35 %A (10.6–14.1 min); 55 % A maintained at 14.1–14.6 min; 55 % A up to 100 % A (14.6–15.1 min); 100 % A maintained at 15.1–17.0 min; 100 % A down to 5 % A (17.0–18.1 min); and maintained at 5 %A to 20 min. The mobile phases were composed of methanol (A) and 1 % formic acid water (B).
Optimized parameters for the Q-Exactive/MS were as follows: Spray voltage was set to 4 kV for the positive ion mode and 3.2 kV for the negative ion mode. The sheath gas flow rate was 40 L/min for the positive ion mode and 35 L/min for the negative ion mode. The auxiliary gas flow was 2 L/min for both ion mode. The auxiliary gas temperature was set 350℃ and the capillary temperature was 300 V for both ion modes. Data were collected in full scan/dd ms2mode, and the mass range was 100–1,100 m/z.
2.7 Metabolomics data processing
Total ion chromatograms were pre-processed with Compound Discover software (version 3.0, Thermo Fisher Scientific Inc.). After peak alignment, peak filter, peak extraction, and automatic integration, an Excel table including accurate mass data, retention time, peak area, ChemSpider ( https://www.chemspider.com ) prediction compound results, and mzCloud ( https://www.mzcloud.org/) prediction compound results were formulated. The raw data were listed in Supplemental Data Set_5 (acquisition data in positive mode) and Supplemental Data Set_6 (acquisition data in negative mode). These datasets were analyzed with pattern-recognition methods using the software package simca-p (version 14.1, Umetrics, Umea, Sweden). The response variables were scaled and centered to Pareto variance to normalize the skewed distributions. Moreover, features with>50 % of values missing were removed. To eliminate the effect of intersubject variability and to identify endogenous metabolites that contributed significantly to the classification, linear combinations of X variables orthogonal to the Y vector were removed by orthogonal projections to latent structures (OPLS)–discriminant analysis (DA). Cross-validation was used to estimate the robustness and predict abilities of established model, which was validated in more detail by 200 permutation tests. The metabolites with variable importance in the projection (VIP) scores > 1.0 in the OPLS-DA and a P value < 0.05 by Student’s t test were examined and selected for discrimination power according to multiple statistical criteria. Identification of metabolites was achieved by comparing molecular features (accurate mass and MS/MS spectra) with metabolomics libraries, such as the Human Metabolome Database (HMDB) (https://www.hmdb.ca/) and mzCloud, or with the standard substances.
2.8 Statistical analysis
Data relating to osteocalcin, serum phosphorus, ALP, BMD,Tb × Sp, Tb × N, BV/TV, and SMI were described as the means ± standard deviations (SDs). The comparisons between six groups were made using one-way ANOVA. Mann-Whitney test was used to determine the significance of differences between two groups (Vetter and Mascha, 2018), which was performed with IBM SPSS 22.0 software (Chicago, USA), and a P value < 0.05 was regarded as statistically significant.
3 Results
3.1 Composition differs slightly between EC and EF
Analysis of the main components types of EC and EF were conducted to test the hypothesis of alternative herbal sources. The chemical profiling of EC and EF were performed with HPLC-Q-Exactive MS using a total of 27 compounds characterized from EC extracts and 24 compounds detected from EF (Supplementary Table S1), 10 of which were unambiguously identified using authentic standards. The fingerprints of EC and EF samples were obtained and reported in our previous study. In that study, the common peaks in 23 batches of EC and EF samples were defined by the Similarity Evaluation System software (version 2004A; China) and included chlorogenic acid, geniposidic acid, genipioside, genipin, and pinoresinol diglucoside. The concentrations of geniposidic acid, geniposide, genipin, and pinoresinol diglucoside in EC were approximately-five times those in EF. The anti-osteoporosis activities of ten main components contain both in the EC and EF were also tested according to previous report (Zheng, et al. 2019). As shown in Fig. S2-S3, the formation of osteoclasts were inhibited following the treatment of chlorogenic acid, PDG, geniposide, deacetylasperulosidic acid, geniposidic acid, eucommiol and cryptochlorogenic acid. The number of osteoclasts and TRAP positive multinuclear cells were also decreased after these compounds treatment. Considering that the component determines the effect (You et al., 2018.), a dose of EF that is five times the dose of EC would eliminate any difference in efficacy resulting from ingredient contents.
3.2 EC and EF have the same influences on serum markers of ovariectomized rats
To evaluate if EF could be an alternative to EC, we surgically ovariectomized 12-week-old rats, a method that represents the most commonly used model for osteoporosis (Chevalier et al., 2020), and we fed them intragastrically with EC and EF extracts. Ovariectomy led to elevated expressions of osteocalcin, serum phosphorus, and ALP (Fig. 1A-1C) compared with the control group. Conversely, GT decreased the levels of osteocalcin, serum phosphorus, and ALP compared with the OVX group (Fig. 1A-1C). GT, as a traditional Chinese medicine (Wang et al., 2020) for osteoporosis, was positive control drug used to evaluate the efficacy of EC and EF in osteoporosis. Considerable differences were detected in the content of osteocalcin, serum phosphorus, and ALP between the GT group and the OVX group. EC and EF extracts also prevented changes to the levels of osteocalcin, serum phosphorus, and ALP caused by ovariectomy (Fig. 1A-1C). No differences were found in these serum index expressions between the EC and EF group, which suggests good substitutability between EC and EF exist with regard to regulation of these serum markers.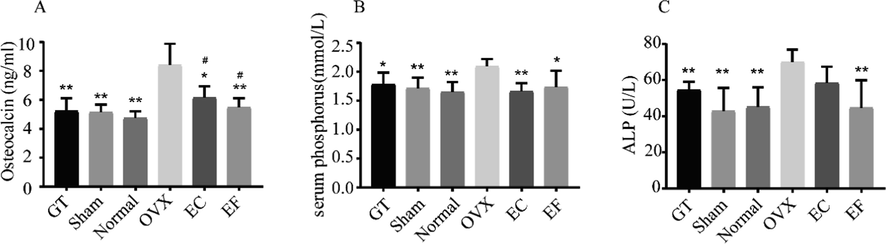
Effects of Eucommia cortex (EC) and Eucommia folium (EF) on biochemical markers levels of bone metabolism in ovariectomized (OVX) rats: (A) osteocalcin; (B) serum phosphorus; (C) ALP. Values are expressed as the mean ± standard deviation (SD); n = 6. *p < 0.05, **p < 0.01 compared with the OVX group. #p < 0.05, ##p < 0.01 compared with the sham group.
3.3 EC and EF have the same therapeutic effects on trabecular microarchitecture of ovariectomized rats
Estrogen depletion leads to a decrease in BMD and alternation in the trabecular microarchitecture, which can increase the incidence of fracture (Kreipke et al., 2016). We evaluated the effects of estrogen deficiency on rats, using female OVX rats. This surgery caused a small, thin, and sparse trabecular region in the tibia of OVX rats (Fig. 2A)—a result that was consistent with a previous report (Kinney et al., 1995). Conversely, in the tibia of sham and normal rats, the trabecular regions were neatly and densely arranged (Fig. 2A). Ovariectomy led to a decrease in BMD, Tb × N, and BV/TV and an increase in Tb × Sp and SMI (Fig. 2B-2F). EC and EF treatment prevented the trabecular region loss caused by ovariectomy (Fig. 2A), as assessed by computed tomography. This finding was consistent with the elevation of BMD, Tb × N, and BV/TV (Fig. 2B, 2D, 2E) in the EC- and EF-treated OVX rats compared with the OVX controls. Ovariectomy-induced increases in the Tb × Sp and SMI of tibias was also prevented in the EC- and EF-treated OVX rats (Fig. 2C, 2F). Amelioration of BMD, Tb × N, BV/TV, Tb × Sp, and SMI changes in EC-treated OVX rats was similar to changes seen in EF-treated OVX rats, indicating the same therapeutic effect on trabecular microarchitecture.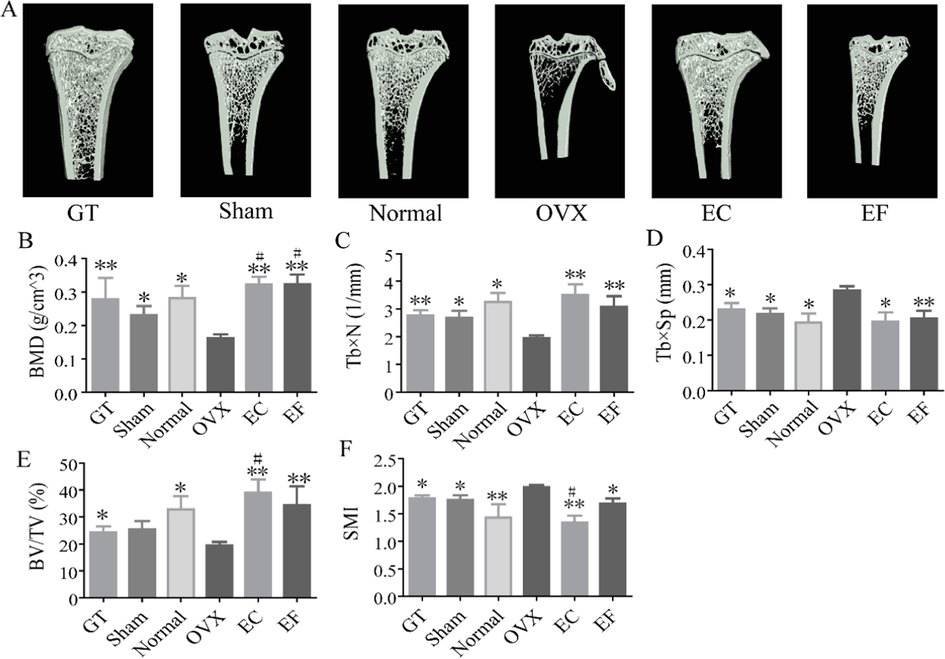
The region of interest (ROI) image and bone parameters analysis in tibia in different rats: (A) ROI image of sham, normal, ovariectomized (OVX), Gushukang-treated (GT), Eucommia cortex–treated (EC), and Eucommia folium–treated (EF) groups. (B) Comparison of bone mineral density (BMD) in six groups. (C) Comparison of trabecular number (Tb × N) in six groups. (D) Comparison of trabecular separation (Tb × Sp) in six groups. (E) Comparison of percent bone volume (BV/TV) in six groups. (F) Comparison of structure model index (SMI) in six groups. Values were expressed as the mean ± standard deviation (SD); n = 6. *p < 0.05, **p < 0.01 compared with the OVX group. # p < 0.05, ##p < 0.01 compared with the sham group.
3.4 Key endogenous components of EC and EF have gradual and similar changes in metabolomics studies
3.4.1 Metabolic profile data have satisfactory robustness and predictabilities as evaluated by OPLS-DA
QC samples were tested to evaluate the method stability and precision. Features in this analysis included the peak area relative standard deviations (RSDs) and the retention time RSDs. RSD values of pooled QC samples were < 15 %, indicating that the instrument and the analytical method were considered reproducible and stable.
The OPLS-DA recognition method was constructed to discriminate the potential biomarkers in this experiment, and it showed a good distinction between the OVX and sham groups (Supplementary Fig.S4). Visually, the significant differences between the sham and OVX groups in the OPLS-DA score plot (Supplementary Fig. S4A and Fig. S4B) were indicative of the different endogenous metabolites in these two groups. The robustness and predictabilities of established model were estimated after cross-validation and 200 permutation tests. R2Y and Q2 values of the OPLS-DA model in the positive and negative modes were > 0.7 (Supplementary Table S3), which is indicative of good OPLS-DA model prediction and fitness.
3.4.2 Tryptophan and 52 other compounds were identified as potential differential metabolites in ovariectomized rats
The score plot (Fig. S4A and Fig. S4B) and the S-plot of OPLS-DA (Fig.S4C and Fig. S4D) were drawn to unveil the metabolic biomarkers of OVX rats. VIP values > 1 and t values < 0.05, 465 variables were considered as the potential biomarkers. Identification of these biomarkers was essential to explore in detail the metabolic regulations that EC and EF caused in the OVX rats. After comparing the mass information of an unknown compound with a known compound present in the databases (mzCloud, HMDB, and ChemSpider), the compound with a matching accurate mass and similarity of tandem mass spectroscopy (MS/MS) spectra was putatively annotated. In order to conform the structure of these endogenous metabolites more accurately, eight components including tryptophan were verified by comparison the retention time and molecular features with standard substances. Taking the overlap metabolites of each pair into consideration, a total of 52 predicted biomarkers were identified (as summarized in Table 1); these biomarkers were differentially abundant in the serum of OVX rats compared with the sham group and included trans-3-indoleacrylic acid, tryptophan, norleucine, phenylalanine, creatine, platelet-activating factor, cholic acid, deoxycholic acid, choline alfoscerate, and more.
NO
Biomarkers
Formula
Adduct
Accurate Mass (m/z)
Errora
VIP
RT (min)
Log2 Fold Change:
Sham vs OVX
EC vs OVX
EF vs OVX
predicted
measured
(ppm)
(OVX)/(Sham)
1
trans-3-Indoleacrylic acid
C11H9NO2
[M + H] +
188.0706
188.0704
−1.06
10.68
5.12
0.01
↑
↑
↑
2
dl-Tryptophan*
C11H12N2O2
[M + H] +
205.0971
205.0976
2.44
10.68
5.08
0.01
↑
↑
↑
3
l-Norleucine*
C6H13NO2
[M + H] +
132.1018
132.1019
0.76
6.99
2.22
1.57
↓
↓
↓
4
l-Phenylalanine*
C9H11NO2
[M + H] +
166.0862
166.0859
−1.81
6.11
3.24
55.31
↓
↓
↑
5
Creatine
C4H9N3O2
[M + H] +
132.0767
132.0765
−1.51
4.02
1.60
0.65
↑
↑
↑
6
Platelet-activating factor
C26H54NO7P
[M + H] +
523.3632
523.3632
0.00
3.21
19.73
4.96
↓
↓
↓
7
Cholic acid
C24H40O5
[M + H] -
409.2949
409.2986
9.04
2.83
17.93
0.66
↓
↓
↓
8
Deoxycholic acid
C24H40O4
[M + H] -
393.2999
393.2997
−0.51
2.76
17.87
2.70
↓
↓
↓
9
Choline Alfoscerate
C8H20NO6P
[M + H] +
258.1101
258.1105
1.55
2.73
1.47
2.46
↓
↑
↑
10
Valine*
C5H11NO2
[M + H] +
118.0862
118.0862
0.00
2.51
1.98
8.34
↓
↓
↓
11
dl-Carnitine
C7H15NO3
[M + H] +
162.1124
162.1122
−1.23
2.50
1.62
1.07
↓
↓
↓
12
Betaine*
C5H11NO2
[M + H] +
118.0862
118.0862
0.00
2.46
1.51
0.87
↑
↑
↑
13
Pipecolic acid*
C6H11NO2
[M + H] +
130.0863
130.0862
−0.77
2.46
1.62
1.01
↓
↓
↓
14
2-Hydroxycinnamic acid
C9H8O3
[M + H] +
165.0541
165.0546
3.03
2.43
1.89
1.02
↓
↓
↓
15
Indole
C8H7N
[M + H] +
118.0651
118.0656
4.23
2.41
4.81
8.47
↓
↓
↓
16
l-Tyrosine
C9H11NO3
[M + H] +
182.0812
182.0822
5.49
2.37
1.88
0.99
↑
↓
↓
17
Nicotinamide
C6H6N2O
[M + H] +
123.0553
123.0549
−3.25
2.29
1.78
0.46
↑
↓
↓
18
Orotic acid
C5H4N2O4
[M + H] -
157.0244
157.0239
−3.18
2.28
0.52
1.11
↓
↓
↓
19
Isoleucine*
C6H13NO2
[M + H] +
132.1019
132.1018
−0.76
2.10
1.95
0.26
↑
↑
↓
20
10-GINGEROL
C21H34O4
[M + H] -
351.2530
351.2499
−8.83
2.09
17.47
1.50
↓
↓
↓
21
Acetyl-l-carnitine
C9H17NO4
[M + H] +
204.1230
204.1218
−5.88
2.07
1.65
0.42
↑
↓
↓
22
N-Isovalerylglycine
C7H13NO3
[M + H] -
160.0968
160.0963
−3.12
2.02
4.95
1.47
↓
↓
↓
23
Hippuric acid
C9H9NO3
[M + H] -
180.0655
180.0658
1.67
1.90
3.63
0.09
↑
↑
↓
24
Phenobarbital
C12H12N2O3
[M + H] +
233.0921
233.0928
3.00
1.85
11.95
281.19
↓
↓
↓
25
Arachidonic acid
C20H32O2
[M + H] -
305.2475
305.2477
0.66
1.83
18.74
1.05
↓
↑
↑
26
Monobutyl phthalate
C12H14O4
[M + H] +
223.0965
223.0955
−4.48
1.80
18.13
0.44
↑
↓
↓
27
3-Hydroxybutyric acid
C4H8O3
[M + H] +
105.0546
105.0551
4.76
1.73
0.82
0.52
↑
↓
↓
28
Glycoursodeoxycholic acid
C26H43NO5
[M + H] +
450.3214
450.3219
1.11
1.67
17.92
0.04
↑
↓
↓
29
Citric acid
C6H8O7
[M + H] +
193.0343
193.0348
2.59
1.62
1.90
0.42
↑
↓
↓
30
Uric acid
C5H4N4O3
[M + H] -
169.0356
169.0349
−4.14
1.59
0.54
0.78
↑
↑
↑
31
Azelaic acid
C9H16O4
[M + H] -
189.1121
189.1120
−0.53
1.58
13.50
1.83
↓
↑
↑
32
6-Methylquinoline
C10H9N
[M + H] +
144.0807
144.0804
−2.08
1.45
4.82
4.80
↓
↓
↓
33
D-(-)-Glutamine
C5H10N2O3
[M + H] +
147.0764
147.0752
−8.16
1.44
1.62
0.80
↑
↓
↓
34
dl-Arginine
C6H14N4O2
[M + H] +
175.1190
175.1186
−2.28
1.41
1.60
1.57
↓
↓
↓
35
Chlorogenic acid
C16H18O9
[M + H] -
355.1024
355.1021
−0.84
1.40
4.62
2.53
↓
↓
↓
36
Docosahexaenoic acid
C22H32O2
[M + H] -
329.2475
329.2466
−2.73
1.34
18.73
0.92
↑
↑
↑
37
Oleic acid
C18H34O2
[M + H] -
283.2631
283.2609
−7.77
1.33
18.97
0.86
↑
↑
↑
38
N-Formylmethionine
C6H11NO3S
[M + H] -
178.0532
178.0533
0.56
1.28
1.72
0.79
↑
↓
↓
39
l-Pyroglutamic acid
C5H7NO3
[M + H] +
130.0499
130.0490
−6.92
1.25
1.77
1.02
↓
↓
↓
40
Cuminaldehyde
C10H12O
[M + H] +
149.0960
149.0957
−2.01
1.23
18.72
0.67
↑
↓
↓
41
Propionylcarnitine
C10H19NO4
[M + H] +
218.1387
218.1388
0.46
1.21
1.78
0.21
↑
↓
↓
42
16-Hydroxyhexadecanoic acid
C16H32O3
[M + H] -
273.2424
273.2429
1.83
1.20
18.57
3.56
↓
↑
↓
43
l-Proline*
C5H9NO2
[M + H] +
116.0706
116.0707
0.86
1.17
1.80
0.77
↑
↓
↓
44
N-Phenylacetylglutamine
C13H16N2O4
[M + H] -
265.1183
265.1186
1.13
1.15
4.14
1.43
↓
↑
↓
45
Apigenin
C15H10O5
[M + H] -
271.0601
271.0608
2.58
1.14
16.69
2.34
↓
↓
↑
46
Mepivacaine
C15H22N2O
[M + H] +
247.1805
247.1809
1.62
1.13
1.48
1.14
↓
↓
↓
47
Linoleic acid
C18H32O2
[M + H] -
281.2475
281.2475
0.00
1.13
18.76
0.77
↑
↓
↑
48
Glycocholic acid
C26H43NO6
[M + H] -
466.3163
466.3159
−0.86
1.08
17.71
2.00
↓
↓
↓
49
Phenobarbital
C12H12N2O3
[M + H] +
233.0920
233.0899
−9.01
1.07
10.99
0.01
↑
↓
↓
50
16(R)-HETE
C20H32O3
[M + H] +
321.2424
321.2396
−8.72
1.04
19.24
0.50
↑
↑
↑
51
Diethyl phosphate
C4H11O4P
[M + H] +
155.0468
155.0474
3.87
1.02
19.02
0.33
↑
↓
↓
52
Benzoic acid
C7H6O2
[M + H] +
123.0440
123.0441
0.81
1.00
2.14
1.20
↓
↓
↓
3.4.3 Metabolic regulations of EC and EF trended the same in tryptophan and 46 other metabolites
As shown in Table 1, the metabolic regulations of EC and EF were same in tryptophan and in 46 other metabolites. A heatmap was constructed after identification of the differential metabolites (Fig. 3) to visualize the main changes of metabolites in different groups; color differences were used to exhibit the metabolite alterations occurring in different groups. For example, the level of platelet-activating factor in OVX group was much higher than that of the sham group, so the color of platelet-activating factor in the OVX group on the heat map is red. Conversely, the color of platelet-activating factor in the EC and EF groups is blue, because the intensity of platelet-activating factor was down regulated in the EC and EF groups. The comparison of the top 10 VIP values for differential metabolites between the OVX group and the sham group are shown in Fig. 4; among 10 predicted metabolites, seven metabolites were regulated to a normal state in the serum of EC- and EF-treated rats. Deeper analysis of the differentially expressed metabolites suggested that nine of the top 10 differential markers in the EC and EF groups were not different, which may be compelling evidence for the similarity of the metabolite alterations by EC and EF on OVX models.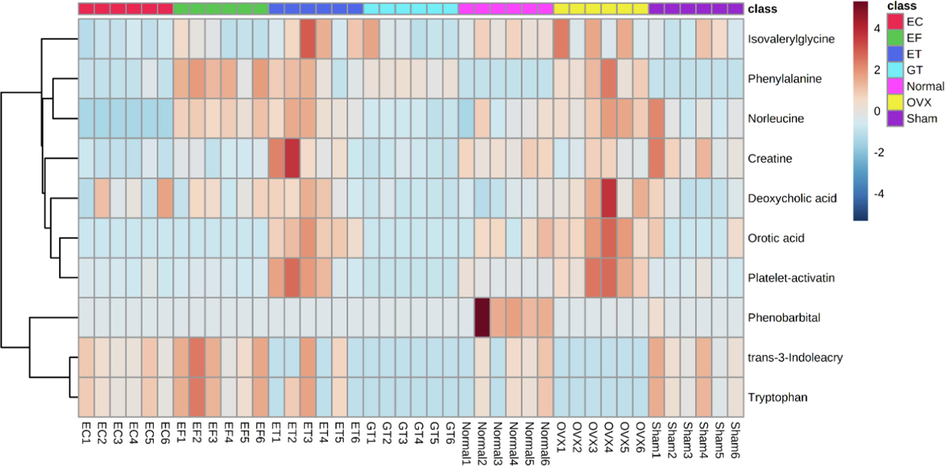
Heatmap based on the relative levels of top ten variable importance in the projection (VIP) value differential metabolites in different groups. Color key indicates metabolite expression: red: upregulated, blue: downregulated.
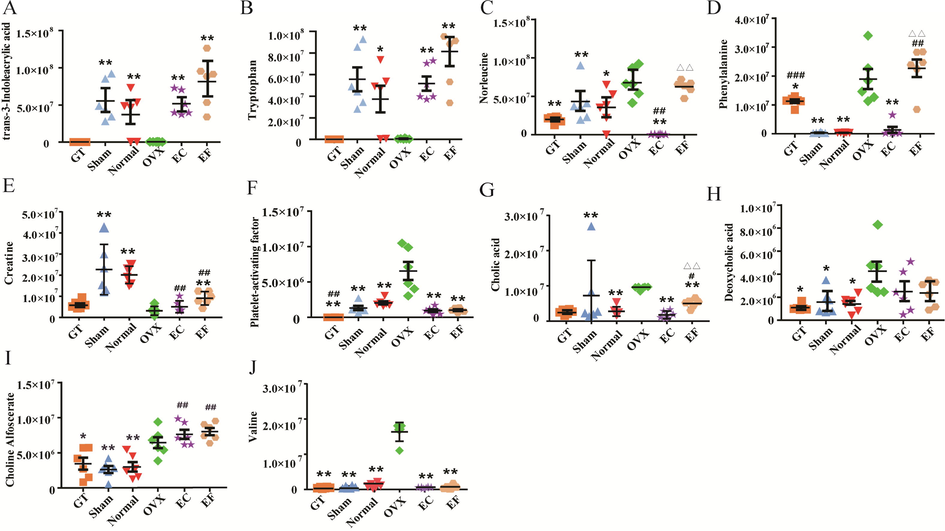
Comparison of the top ten variable importance in the projection (VIP) value differential metabolites in six groups. Values areexpressed as the mean ± standard deviation(SD); n = 6. *p < 0.05, **p < 0.01 compared with the ovariectomized (OVX) group. #p < 0.05, ##p < 0.01 compared with the sham group. Δp < 0.05, ΔΔp < 0.01 compared with the Eucommia cortex(EC) group.
The differences between the EC and EF of l-Norleucine and l-Phenylalanine may be related to the difference ingredients contained in the two parts. According to the results of this experiment, EF contains rutin, while EC does not. As previous reported (Lee et al., 2020; Xiao et al., 2019), rutin could prevent the ovariectomy-induced osteoporosis in rats, and inhibit osteoporosis. Amino acid metabolism (including l-Norleucine and l-Phenylalanine) plays an important role in the pathogenesis of osteoporosis (Ohata et al., 1970). Therefore, the presence of rutin has a certain regulatory effect on amino acid content, which in turn causes differences in amino acid content after administration of EC and EF.
3.5 Main anti-osteoporotic metabolic pathway affected similarly by EC and EF
According to the methods mentioned above, the differential metabolites between the EC and OVX groups and those between the EF and OVX groups were screened out and identified. The score plots and S-plot of the OPLS-DA model were shown in Supplementary Material Fig. S5 and Fig. S6. Functional analysis showed that the differential metabolites between the EC and OVX groups were primarily involved in phenylalanine metabolism; phenylalanine, tyrosine, and tryptophan biosynthesis and more. However, the most significantly different pathways between the EF and OVX groups were phenylalanine metabolism; phenylalanine, tyrosine, and tryptophan biosynthesis. Detailed results of the pathway analysis are listed in Supplemental Data Set_7 and Supplemental Data Set_8, and a summary is shown in Fig. 5. The pathway with − log (P) values > 2 and a path impact threshold > 0.2 was identified as the main metabolic pathway. This pathway was affected by EC and EF and involved phenylalanine metabolism; phenylalanine, tyrosine, and tryptophan biosynthesis; ether lipid metabolism. And the main regulated pathways affected by the two groups are basically the same. These main regulated pathways may be the main contributors to the anti-osteoporosis effect of EC and EF. We speculate that the mechanisms of EC and EF in the treatment of osteoporosis may be similar.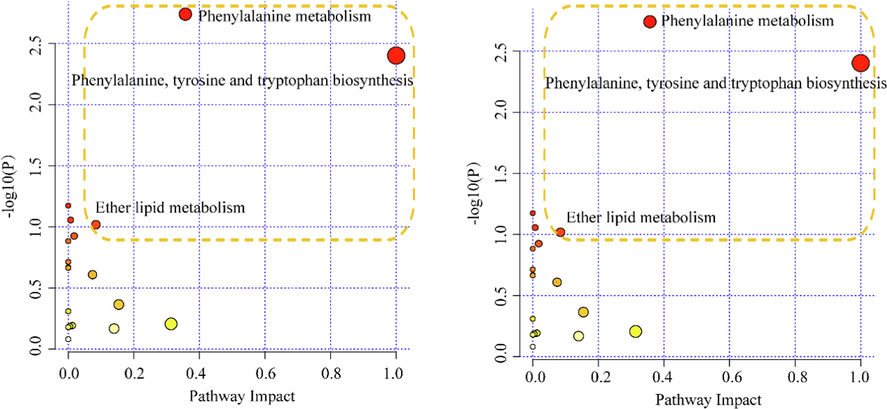
Signaling pathway analysis based on the potential biomarkers of Eucommia cortex (EC) (A) and Eucommia folium (EF) (B) in the treatment of osteoporosis. The size and color of each circle are based on the pathway impact value and the p value, respectively.
4 Discussion
Multiple studies (Huang et al., 2018; Xing et al., 2020) have demonstrated that the biological and pharmacological functions of herbs are mainly related to their chemical constitution. We compared the chemical compounds among different parts of EU using HPLC-Q-Exactive MS. The results demonstrated that the two components of EU were very similar in their major chemical constituents. Iridoids, flavonoids, and lignins were identified in both EC and EF. These same identified chemical constituents in different parts of EU are associated with anti-osteoporotic activities (Qi et al., 2003). Geniposide alleviates osteogenic differentiation in MC3T3-E1 cells by regulating the ERK pathway (Xie et al., 2019); chlorogenic acid resists dexamethasone-induced apoptosis in osteoblastic cells by activating p21 (Waf1/Cip1) to promote the Nrf2/HO-1 anti-oxidative pathway (Han et al., 2019). In addition, chlorogenic acid alleviates thiram-induced tibial dyschondroplasia and modulates the function of RANKL/OPG signals (Mo et al., 2019; Zhang et al., 2019). The anti-osteoporosis activity of ten main components contain both in the EC and EF were also tested according to previous report (Zheng et al., 2019). The number of osteoclasts and TRAP positive multinuclear cells were decreased after these compounds treatment, which was consistent with previous reports (Lee et al., 2014; Kwak et al., 2013; Lee et al., 2017). These findings suggest that EC and EF might have similar anti-osteoporotic functions and that EF is a possible alternative to EC.
Osteocalcin, serum phosphorus, and ALP are essential for bone metabolism responses and cascade. Phosphorus in particular has been indicted in the genesis of osteoporosis (Bellavia et al., 2016). During osteoporosis, elevated phosphorus levels enhance osteoclastic resorption, impair osteoblast function, and limit mineralization at new bone-forming sites (Heaney, 2004). Excessive osteocalcin, phosphorus, and ALP in the adult years also alter certain aspects of the operation of the calcium economy (Boyacioglu et al., 2018). Some articles (Takahashi et al., 1997; Atalay et al., 2012; Lumachi et al., 2009.) prove that OCT, ALP and P are related to bone turnover during menopause, and these index were chosen as indicators to evaluate the ovariectomy-induced osteoporosis efficacy. The inhibition of these serum markers is critical to control osteoporosis. Our study suggests that the levels of osteocalcin, serum phosphorus, and ALP present after ovariectomy were decreased by administration of GT. This phenomenon also occurred with exposure to different parts of EU: EC and EF exhibited the same attenuation of osteocalcin, serum phosphorus, and ALP levels.
Trabecular bone was selected because it has a greater surface-to-volume ratio and is more metabolically active than cortical bone according to previous reports (Ott. 2018). Only amarginal and nonsignificant difference existed between the different treatment groups with respect to several trabecular morphological parameters. This finding implies that EC and EF exerted the same effect as the positive control drugson OVX rats. The marked improvement of the biomechanical resistance in EF group was consistent with that in EC group. According to previous studies, the presence of chlorogenic acid, pinoresinol di-O-β-d-glucopyranoside, geniposidic acid, and geniposide could be responsible for improving the trabecular microarchitecture (An et al., 2016; Min et al., 2018).
In this study, metabolomics technology and multivariate data processing were used to identify potential biomarkers of osteoporosis and then characterize the influences of EC and EF on the metabolic pathway and metabolic network. The analysis results showed that 53 potential biomarkers had notable contributions to the occurrence and development of osteoporosis, 28 of which were regulated to a normal state by EC and EF. Seven of the top ten VIP value differential metabolites between the OVX and the sham groups were altered to normal levels by EC and EF. These metabolites—trans-3-indoleacrylic acid, tryptophan, and platelet-activating factor—areassociated with the occurrence and development of osteoporosis. Tryptophan is a precursor of serotonin (5-HT) (Yousefzadeh et al., 2020), and peripheral 5-HT has shown tremendous potency in improving osteoporosis and affecting bone metabolism. According to a previous study (Nebigil et al., 2000), the combination of 5-HT and the 5-HT2B receptor could stimulate the release of inositol triphosphate, the elevation of intracellular calcium ions, and the inhibition of osteoclasts. Thus, raising the level of serum tryptophan may lead to an upregulation of peripheral 5-HT, which is beneficial for bone health. trans-3-indoleacrylic acid, a tryptophan metabolite, is another important metabolite that participates in the 5-HT pathway (Greenberg and Ketcham, 1978). Elevated trans-3-indoleacrylic acid levels are another sign of upregulation of peripheral 5-HT.
The level of platelet-activating factor is much higher in osteoclasts than in osteoblasts, which suggests that platelet-activating factor is more sensitive to osteoclasts. Ovariectomy could lead to the elevation of tumor necrosis factor α and interleukin 1, which can activate lyso-platelet-activating factor (lyso-PAF) acetyl transferase and increase the production of platelet-activating factor in osteoclasts (Lordan et al., 2019).In agreement with the Lordan, the concentration of platelet-activating factor in our study was higher in the OVX than the sham group. The alteration of platelet-activating factor in the EC and EF groups implied that the parts of EU may have activity against osteoporosis by down regulating the platelet-activating factor level to inhibit the activity and function of osteoclasts.
Correlation with metabolic pathways of callback markers showed that EC and EF play mainly the same role in treating osteoporosis through amino acid metabolism, including phenylalanine metabolism; phenylalanine, tyrosine, and tryptophan biosynthesis. Amino acids are essential for osteoblast proliferation or collagen synthesis (Chevalley et al., 1998), so ameliorating deficiencies in amino acid levels could be beneficial for bone health.
5 Conclusion
This study comprehensively evaluated the similarities and differences between EC and EF with regard to chemical constitution and bioactivity using a combined pharmacodynamic/metabolomics analysis. The results demonstrated that the two tissues of EU have very similar major chemical constituents and that these similar compounds are associated with anti-osteoporotic activities. In addition, EC and EF altered these bone metabolism markers and bone microstructure indicators as much as the positive control drug did, mainly by intervening with amino acid metabolism. Together, the results show that EF and EC have similar anti-osteoporotic effects. Our study compared chemical components and metabolic regulations in different parts of EU using metabolomics to explore the potential for alternative medical sources of EU, which could not only comprehensively analyze the chemical composition of samples, but also could explore the changes of the metabolite content in biological samples for understanding physiological mechanisms. Our findings suggest that the EU leaves—traditionally considered less valuable than the EU bark—possess bioactive ingredients and display bioactivity similar to that of the bark. These findings provide evidence that EF could be complementary to EC and an alternative to EC as a treatment for osteoporosis.
Author contributions
Xin Dong: conceptualization, methodology, software, investigation, writing—review and editing, funding acquisition. Jie Liu: conceptualization, investigation, data curation. Shu Guo: investigation, data curation. Fan Yang: investigation. Ren Bu: resources. Jingkun Lu: resources. PeifengXue: supervision, project administration, funding acquisition.
Funding
This work was financially supported by the National Natural Science Foundation of China (Grant No 81860756), the National Natural Science Foundation of China (grant number 81960758), and the Inner Mongolia Autonomous Region Higher Education Science Research Project (grant number NJZY19099).
Acknowledgments
The authors thank all individuals and companies that have contributed to this research. We also thank the Human Metabolome Database for collating and receiving metabolite data and MetaboAnalyst for statistical processing support on the data. We thank Charlesworth Author Services Team for providing language help.
References
- Pharmacokinetics and tissue distribution of five active ingredients of Eucommiae cortex in normal and ovariectomized mice by UHPLC-MS/MS. Xenobiotica.. 2016;46:793-804.
- [CrossRef] [Google Scholar]
- Diagnostic utility of osteocalcin, undercarboxylated osteocalcin, and alkaline phosphatase for osteoporosis in premenopausal and postmenopausal women. Ann. Lab. Med.. 2012;1:23-30.
- [CrossRef] [Google Scholar]
- Vitamin D level between calcium-phosphorus homeostasis and immune system: new perspective in osteoporosis. Curr. Osteoporos. Rep.. 2016;13:1-2.
- [CrossRef] [Google Scholar]
- Boron intake, osteocalcin polymorphism and serum level in postmenopausal osteoporosis. J. Trace. Elem. Med. Biol.. 2018;48:52-56.
- [CrossRef] [Google Scholar]
- Warmth prevents bone loss through the gut microbiota. Cell Metab.. 2020;32(575–590):e577
- [CrossRef] [Google Scholar]
- Arginine increases insulin-like growth factor-I production and collagen synthesis in osteoblast-like cells. Bone.. 1998;23:103-109.
- [CrossRef] [Google Scholar]
- Pharmacopoeia of People' s Republic of China. Beijing: Chemical Industry Press; 2020.
- The foundation, problems and countermeasures for the favorable development of China's eucommia industry. Economic Forest Res.. 2020;038:1-10. [in Chinese]
- [CrossRef] [Google Scholar]
- Study of osteoporosis treatment principles used historically by ancient physicians in Chinese Medicine. Chin. J. Integr. Med.. 2013;19:862-868.
- [CrossRef] [Google Scholar]
- Determination of urinary indolic metabolites. J. Pharm. Sci.. 1978;67:478-480.
- [CrossRef] [Google Scholar]
- A clinical trial testing the safety and efficacy of a standardized Eucommia ulmoides Oliver bark extract to treat hypertension. Altern. Med. Rev.. 2011;16:338-347.
- [CrossRef] [Google Scholar]
- Evaluation of the possibility of Eucommia ulmoides leaf replacing Eucommia ulmoides bark by fingerprint and quantitative analysis of multi-components method. J. Chin. Med. Mater.. 2020;43:896-902.
- [CrossRef] [Google Scholar]
- Possible pharmaceutical effect and active components in different parts of Eucommia ulmoides based on network pharmacology. Zhongguo Zhong Yao Za Zhi.. 2020;45:1800-1807. [in Chinese]
- [CrossRef] [Google Scholar]
- Chlorogenic acid promotes the Nrf2/HO-1 anti-oxidative pathway by activating p21(Waf1/Cip1) to resist dexamethasone-induced apoptosis in osteoblastic cells. Free Radic. Biol. Med.. 2019;137:1-12.
- [CrossRef] [Google Scholar]
- Eucommia ulmoides Oliv.: ethnopharmacology, phytochemistry and pharmacology of an important traditional Chinese medicine. J. Ethnopharmacol.. 2014;151:78-92.
- [CrossRef] [Google Scholar]
- Phosphorus nutrition and the treatment of osteoporosis. Mayo. Clin. Proc.. 2004;79:91-97.
- [CrossRef] [Google Scholar]
- The Yin-Yang property of Chinese Medicinal Herbs relates to chemical composition but not anti-oxidative activity: an illustration using spleen-meridian herbs. Front. Pharmacol.. 2018;9:1304.
- [CrossRef] [Google Scholar]
- Jin, G., Feng, Z. H., Li, X. X., et al. 2021. Study on medication regularities of traditional Chinese medicine compound in the tre atment of primary osteoporosis based on national patent. Chin. J. Osteoporos. 27, 1343-1347. [in Chinese] doi:10.3969/j.issn.1006-7108.2021.09.019.
- Metabolomics: beyond biomarkers and towards mechanisms. Nat. Rev. Mol. Cell Biol.. 2016;17:451-459.
- [CrossRef] [Google Scholar]
- In vivo, three-dimensional microscopy of trabecular bone. J. Bone Miner. Res.. 1995;10:264-270.
- [CrossRef] [Google Scholar]
- The roles of architecture and estrogen depletion in microdamage risk in trabecular bone. J. Biomech.. 2016;49:3223-3229.
- [CrossRef] [Google Scholar]
- Chlorogenic acid inhibits osteoclast differentiation and bone resorption by down-regulation of receptor activator of nuclear factor kappa-B ligand-induced nuclear factor of activated T cells c1 expression. Biol. Pharm. Bull.. 2013;36:1779-1786.
- [CrossRef] [Google Scholar]
- Rutin improves bone histomorphometric values by reduction of osteoclastic activity in osteoporosis mouse model induced by bilateral ovariectomy. J. Korean Neurosurg. Soc.. 2020;63:433-443.
- [CrossRef] [Google Scholar]
- Genipin inhibits RANKL-induced osteoclast differentiation through proteasome-mediated degradation of c-Fos protein and suppression of NF-κB activation. J. Pharmacol. Sci.. 2014;124:344-353.
- [CrossRef] [Google Scholar]
- Anti-Osteoclastic activity of artemisia capillaris Thunb. Extract depends upon attenuation of osteoclast differentiation and bone resorption-associated acidification due to Chlorogenic acid, hyperoside, and scoparone. Int. J. Mol. Sci.. 2017;18:322.
- [CrossRef] [Google Scholar]
- Eucommia ulmoides leaf (EUL) extract enhances NO production in ox-LDL-treated human endothelial cells. Biomed. Pharmacother.. 2018;97:1164-1172.
- [CrossRef] [Google Scholar]
- Eucommia ulmoides leaf extract ameliorates steatosis induced by high-fat diet in rats by increasing lysosomal function. Nutrients.. 2019;11:426.
- [CrossRef] [Google Scholar]
- Comparison of chemical constitution and bioactivity among different parts of Lonicera japonica Thunb. J. Sci. Food Agric.. 2020;100:614-622.
- [CrossRef] [Google Scholar]
- Toward a scientific understanding of the effectiveness, material basis and prescription compatibility of a Chinese herbal formula Dan-hong injection. Sci. Rep.. 2017;7:46266.
- [CrossRef] [Google Scholar]
- Research advances in chemical constituents and pharmacological activities of different parts of Eucommia ulmoides. Zhongguo Zhong Yao Za Zhi.. 2020;45:497-512. [in Chinese]
- [CrossRef] [Google Scholar]
- Estimation of potential suitable distribution area and the ecological characteristics of Eucommia ulmoides Oliv.in China. Acta. Ecologica. Sinica.. 2020;40:5674-5684. [in Chinese]
- [CrossRef] [Google Scholar]
- Forty years since the structural elucidation of platelet-activating factor (PAF): historical, current, and future research perspectives. Molecules.. 2019;24:4414.
- [CrossRef] [Google Scholar]
- Changes of bone formation markers osteocalcin and bone-specific alkaline phosphatase in postmenopausal women with osteoporosis. Ann. N. Y. Acad. Sci.. 2009;1173(Suppl 1):60-63.
- [CrossRef] [Google Scholar]
- Min, J., Yuan, Z., Zhang, Q., et al. 2018. Analysis of anti-osteoporosis function of chlorogenic acid by gene microarray profiling in ovariectomy rat model. Biosci. Rep. 38, BSR20180775. doi: 10.1042/BSR20180775.
- Beneficial effects of Cuscuta chinensis extract on glucocorticoid-induced osteoporosis through modulation of RANKL/OPG signals. Braz. J. Med. Biol. Res.. 2019;52:e8754
- [CrossRef] [Google Scholar]
- 5-hydroxytryptamine 2B receptor regulates cell-cycle progression: cross-talk with tyrosine kinase pathways. Proc. Natl. Acad. Sci. U. S. A.. 2000;97:2591-2596.
- [CrossRef] [Google Scholar]
- Eucommia bark (Du-Zhong) improves diabetic nephropathy without altering blood glucose in type 1-like diabetic rats. Drug Des. Devel. Ther.. 2016;10:971-978.
- [CrossRef] [Google Scholar]
- Amino acid metabolism in osteoporosis. J. Am. Geriatr. Soc.. 1970;4:295-302.
- [CrossRef] [Google Scholar]
- Cortical or trabecular bone: what's the difference? Am. J. Nephrol.. 2018;6:373-375.
- [CrossRef] [Google Scholar]
- Qi, X. Y., Chen, W. J., Zhang, S. H. 2003. Studies on distribution and accumulative dynamic variation of bioactive components in Eucommia ulmoides. Chin. Tradi. Herb. Drugs. 34, 1129-1129. [in Chinese] doi: CNKI:SUN:ZCYO.0.2003-12-033.
- Qin, Z., Ren, Y. L,, Shi, X. Y.. 2018. Medication rules research in postmenmopausal osteoporosis. Lishizhen Medicine and Material Medica Research. 29, 2531-2534. [in Chinese] doi: 10.3969 / j.issn.1008- 0805.2018.10.082.
- Online extraction-HPLC-FRAP system for direct identification of antioxidants from solid Du-zhong brick tea. Food Chem.. 2019;288:215-220.
- [CrossRef] [Google Scholar]
- Analysis of the rule of prescription of osteoporosis based on TCM inheritance auxiliary platform system. Chin. J. Osteoporos.. 2017;23:519-523. [in Chinese]
- [CrossRef] [Google Scholar]
- Comparison of bone and total alkaline phosphatase activity on bone turnover during menopause and in patients with established osteoporosis. Clin. Endocrinol. (Oxf). 1997;2:177-183.
- [CrossRef] [Google Scholar]
- Unadjusted bivariate two-group comparisons: when simpler is better. Anesth. Analg.. 2018;1:338-342.
- [CrossRef] [Google Scholar]
- Effects of Gushukang for postmenopausal osteoporosis: A protocol for systematic review and meta-analysis. Medicine (Baltimore). 2020;99:e20908
- [CrossRef] [Google Scholar]
- The progress of metabolomics study in traditional chinese medicine research. Am. J. Chin. Med.. 2015;43:1281-1310.
- [CrossRef] [Google Scholar]
- Comparison of two Polygonum chinense varieties used in Chinese cool tea in terms of chemical profiles and antioxidant/anti-inflammatory activities. Food Chem.. 2020;310:125840
- [CrossRef] [Google Scholar]
- Rutin suppresses FNDC1 expression in bone marrow mesenchymal stem cells to inhibit postmenopausal osteoporosis. Am. J. Transl. Res.. 2019;10:6680-6690.
- [Google Scholar]
- Geniposide alleviates glucocorticoid-induced inhibition of osteogenic differentiation in MC3T3-E1 cells by ERK pathway. Front. Pharmacol.. 2019;10:411.
- [CrossRef] [Google Scholar]
- Inhibition of rheumatoid arthritis using bark, leaf, and male flower extracts of Eucommia ulmoides. Evid. Based Complement Alternat. Med.. 2020;2020:3260278.
- [CrossRef] [Google Scholar]
- Comparison of multiple bioactive constituents in different parts of Eucommia ulmoides based on UFLC-QTRAP-MS/MS combined with PCA. Molecules.. 2018;23:643.
- [CrossRef] [Google Scholar]
- Yang, F., Xu, M. R., Yang, M. F., et al. 2005. Patterns of the use of traditional Chinese medicines in the treatment of osteoporosis. Chin. J. Clin. Rehabilita. 9,203-205. doi:CNKI:SUN:XDKF.0.2005-31-088.
- Development of bioassay method in quality control of traditional Chinese medicine. China J. Chin. Met. Med.. 2018;43:452. [in Chinese]
- [CrossRef] [Google Scholar]
- Tryptophan improves memory independent of its role as a serotonin precursor: potential involvement of microtubule proteins. J. Mol. Neurosci.. 2020;70:559-567.
- [CrossRef] [Google Scholar]
- Chlorogenic acid alleviates thiram-induced tibial dyschondroplasia by modulating caspases, BECN1 expression and ECM degradation. Int. J. Mol. Sci.. 2019;20:3160.
- [CrossRef] [Google Scholar]
- Dual targeting of SREBP2 and ERRα by carnosic acid suppresses RANKL-mediated osteoclastogenesis and prevents ovariectomy-induced bone loss. Cell Death. Differ.. 2019;27:2048-2065.
- [CrossRef] [Google Scholar]
Appendix A
Supplementary data
Supplementary data to this article can be found online at https://doi.org/10.1016/j.arabjc.2022.104304.
Appendix A
Supplementary data
The following are the Supplementary data to this article:Supplementary data 1
Supplementary data 1


