

Translate this page into:
Microwave –assisted pyrolysis aspen wood for production of valuable products under different temperatures
⁎Corresponding authors at: College of Chemistry and Chemical Engineering, Henan Polytechnic University, Jiaozuo 454003, China. chengsong@hpu.edu.cn (Song Cheng)
-
Received: ,
Accepted: ,
This article was originally published by Elsevier and was migrated to Scientific Scholar after the change of Publisher.
Peer review under responsibility of King Saud University.
Abstract
The valuable pyrolysis products are prepared by pyrolysis of aspen wood using microwave heating at different pyrolysis temperature. High pyrolysis temperature restrains the production of the biochar, and contributes to the generation of the bio-gas. However, pyrolysis temperature has little influenced on the yield of bio-oil. Bio-oil mainly has the phenols, hydrocarbons, ketones, aldehydes and furans compound. The phenols compound of bio-oil generated from 500 ℃ is 54%. Pyrolysis temperature influences the composition and heating value of bio-gas, and the heating value of bio-gas produced at 700 °C is 13.41 MJ/Nm3. Biochar could be used to adsorb Ag+ from wastewater, which generates value-added A/char after adsorption. Ag+ adsorption and reduction process are systematically evaluated and analyzed. The generated Ag/char is employed as the catalyst for rhodamine B degradation. Besides, Ag/char has promising application potential in energy storage.
Keywords
Aspen wood
Microwave heating
Pyrolysis product
Rhodamine B
Energy storage

1 Introduction
How to reduce the greenhouse gas emissions generation from fossil fuels such as coal and oil consumption is the major challenge of the world. The reduction the greenhouse gas emissions can avoid causing a series of ecological and environmental problems (Yang et al., 2021; Qin et al., 2023a). However, the industry production such as power and chemical products needs the fossil fuels, which can provide the chemical raw material and energy (Al-Enizi et al., 2020). Therefore, it is urgent to search for the non-fossil fuels to meet the requirement of the industry production and avoid the environmental pollution. Biomass has advantages of lost cost, easily available and carbon neutrality, which can be used the renewable carbonaceous resources for industry production (Cherubini and Ulgiati, 2010). In addition, biomass can be employed as the feedstock to produce sustainable fuels, and chemicals (Ubaidullah et al., 2021). Pyrolysis is one of the promising biomass conversion method; which can be used to prepared the fuels and chemical products (Al-Enizi et al., 2020). What's more; pyrolysis is more favorable for large-scale applications (Foong et al., 2020).
Microwave heat is the promising heating method, which has benefits of selective and non-contact heating, and energy saving (Tang et al., 2020; Cao et al., 2020). Microwave heat can be employed in biomass pyrolysis due to fact that it can process a variety of biomass (Chen et al., 2016). Microwave heat is conductive to production of high-quality liquid and gas fuel in the biomass pyrolysis process (Qin et al., 2023b). Besides, biomass with high moisture can contribute to improving its microwave adsorption capacity, which realizes the rapid heating of biomass during pyrolysis process (Cheng et al., 2017; Cheng et al., 2021). Microwave heat is proved at both pilot scale and industrial scale for processing various biomass (Abdelsayed et al., 2018). Hot spots are generated in the microwave heat process. The yield and qualities of the products are significantly influenced by hot spots during pyrolysis process (Zhang et al., 2017). The empty oil palm can produce bio-oil with 74% of phenolic compounds by pyrolysis using microwave heat (Prashanth et al., 2020). Gautam et al. (2019) pointed out that bio-oil produced from macroalgae has little oxygen containing compound when microwave heat processes the macroalgae (Gautam et al., 2019). Parvez et al. (2019) reported that microwave heat produces a lot of H2, which is 15% more than conventional heat (Parvez et al., 2019). So; microwave heat has promising application potential in biomass pyrolysis.
The physicochemical properties and yield of the pyrolysis products are significantly influenced by the pyrolysis conditions such as pyrolysis temperature, pyrolysis time and particle size of feedstock (Yek et al., 2021). Pyrolysis temperature is an important pyrolysis index among pyrolysis parameters (Yek et al., 2021). The large yield of the bio-char is produced at low pyrolysis temperature (≤400 °C). Moderate pyrolysis temperature (400–600 °C) is beneficial for the production of bio-oil (Wang et al., 2022; Nishu and Liu, 2022). Besides, desire pyrolysis temperature produces large energy–density of bio-oil and bio-gas, which could be used as the bioenergy (Aysu and Durak, 2015).
Aspen wood, called as the poplar, is acted as feedstock to prepare valuable products by microwave –assisted pyrolysis. Ag+ is one of the harmful metal ions, which must be removed form wastewater. Biochar is an important pyrolysis product, which can be used in the wastewater treatment and energy storage (Table S1). Physicochemical property and yield of the pyrolysis products at 400–800 °C are investigated, and then the prepared biochar is used for Ag+ removal. However, the biochar forms the Ag@Biochar (A/char) after Ag+ adsorption. A/char can be used in rhodamine B degradation from wastewater and energy storage. The main tasks of this work are: (1) to investigate the physicochemical property and yield of the pyrolysis products at 400–800 °C; (2) to investigate the formation process of the A/char; (3) to analyze rhodamine B removal and energy storage potential using A/char.
2 Experimental and method
2.1 Materials
Aspen wood (AW) is collected from Jiangsu province, China. Rhodamine B and silver nitrate and are purchased from the Sinopharm Chemical Reagent Co. Ltd., China. Moisture, ash, volatile matter and fixed carbon of AW are 10.37 wt%, 1.42 wt%, 74.30 wt% and 13.91 wt%, respectively. The C, H, N and O element of the AW are 42.14 %, 6.21%, 10.86 % and 50.79 %, respectively. The biochemical composition of AW is cellulose of 39.00%, hemicellulose of 36.40%, lignin of 19.30 % and other of 5.30%.
2.2 Pyrolysis method
Multimode microwave furnace is employed in pyrolysis experiment system with the output power of 0–3 KW and the microwave frequency of 2.45 GHz. Pyrolysis temperature is 400–800 °C with the pyrolysis time of 30 min in the pyrolysis experiment process. Pyrolysis gas is taken out using nitrogen. The glass condensers are used to condense to obtain bio-oil and bio-gas. The liquid is bio-oil, which is collected from glass condensers. Bio-gas is non-condensing components of pyrolysis gas. The bio-gas is pre-dry using the drying tube before analysis. Biochar is pyrolysis residue of the biomass in microwave furnace.
2.3 Characterization
Gas chromatography (GC-Trace1310) is used to analyze the bio-gas. GC–MS is employed to detect the chemical composition of bio-oil. Pore structure of biochar is analyzed using Autosorb instrument (Hou et al., 2022). Scanning electronmicroscopy is employed to analyze the surface microstructures. Ramascope spectroscopy is used to analyze the biochar. X-ray diffraction (XRD) analysis is used to test biochar (Cheng et al., 2023). X-ray photoelectron spectroscopy (XPS) is employed to detect the surface chemical properties of biochar. The chemical property of biochar is detected by the Fourier transform infrared spectroscopy.
3 Results and discussions
3.1 Heating curves of AW
The AW heating curves at 1000–2000 W are shown in Fig. 1a. As Fig. 1a shown, the heating curves of AW at 100–2000 W have similar trend. However, it has different heating rates. The AW heating rate of 1000 W is low compared to that of the 1500 W and 2000 W. It can be explained that it produces little microwave energy at 1000 W. Therefore, it need long time to obtain the microwave energy to reach 800 °C. Fig. 1a indicates that heating time of AW is 16 min to reach 800 °C at 1000 W. However, AW takes 7 min to reach 800 °C at 2000 W. It can obtain the conclusion that large microwave power contributes to AW heating and reduces heating time. The heating curve of AW at 1500 W is used to analyze the heating process of the AW. As Fig. 1a shown, AW has slowly heating rate before 200 °C due to fact that AW has poor dielectric property. The hemicellulose and cellulose of AW slowly decompose and the preliminary biochar skeleton is subsequently formed as heating time increases. The hemicellulose and cellulose of the AW are rapidly decomposed or depolymerized, which produces low molecular weight volatiles. Besides, lignin begins to decompose after 400 °C. Biochar is generally formed as pyrolysis temperature increases, which has good dielectric properties. Therefore, the heating rate of AW rapidly increases in later heating period. AW has large heating rate at 1500 W. So, pyrolysis experiment is conducted in 1500 W. Fig. 1b shows the dielectric property of AW. The dielectric constant of AW is slow increase at 400–800 °C (Fig. 1b). Besides, the dielectric loss of AW is also general increase before 600 °C. Dielectric property of AW is in good agreement with heating curves analysis.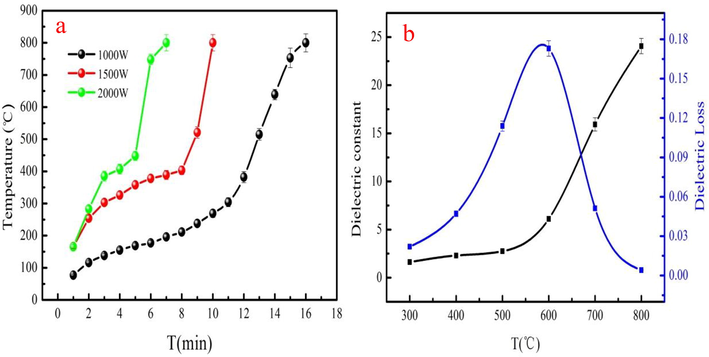
The dielectric property (a) and heating curves (b) of AW.
3.2 Influence of pyrolysis temperature
Fig.S2 shows the pyrolysis products distribution at 400–800 °C. As Fig.S2 shown, the low pyrolysis temperature contributes to the generation of bio-oil. This phenomenon can be explained that the generated microwave energy is used for AW pyrolysis, and the produced volatile component generates the bio-oil (Wang et al., 2016). The yield of the bio-oil decreases from 24.87% to 18.40% at 500–800 °C. Wang et al. (2016) pointed out that the gaseous product is quickly generated, while bio-oil is restrained at high pyrolysis temperature (Zhang et al., 2010). As Fig.S2 shown, bio-gas yield is general increase at 400–800 °C. It can be explained that high pyrolysis temperature is conducive to the production of the bio-gas. While the yield of the biochar is decrease at 400–800 °C. The minimum yield of the biochar is 21.20%. The reason might be that high pyrolysis temperature converts portion of biochar into bio-gas. Therefore, 500 °C is the desire pyrolysis temperature because of large yield of the bio-oil.
3.3 Pyrolysis products investigation
3.3.1 Bio-oil investigation
Table 1 presents the bio-oil composition. As Table 1 shown, the composition of the bio-oil is diverse. However, the bio-oil contains hydrocarbons, ketones, aldehydes, phenols and furans. Therefore, bio-oil is classified into above five groups. As Fig. S3 shown, pyrolysis temperature affects main components content of bio-oil. Bio-oil has large content of the phenolic compound compared to other compounds. It can be explained by the secondary transformation, which promotes to generate the phenolic compound. Besides, interaction of moisture/steam with formed aromatics also contributes to generating phenolic compound (Mukarakate et al., 2015). The generated phenolic compound can be used as the precursor to produce the chemical and pharmaceutical with large economic benefits.
Item
Components
400 °C
500 °C
600 °C
700 °C
800 °C
Relative content (%)
1
Cyclohexan-1,4,5-triol-3-one-1-carboxylic acid
0.56
0.75
0.83
1.00
0.34
2
Dihydroxyacetone
–
0.43
0.28
0.83
–
3
2-Methoxytetrahydrofuran
3.07
3.64
3.96
3.7
1.01
4
Cyclobutene, 2-propenylidene-
0.91
0.74
0.63
1.84
2.25
5
Ethane, 1,1,1-trimethoxy-
–
–
–
5.02
3.99
6
Butanoic acid
0.21
1.57
0.84
0.51
0.96
7
Cyclopentanone
2.83
1.42
0.51
–
–
8
2-Propanone, 1,1-dimethoxy-
–
0.34
0.5
2.2
5.46
9
Ethane, 1,1,2-trimethoxy-
–
–
2.25
3.43
–
10
Furfural
9.47
8.28
5.25
2.97
8.46
11
(Z)-3-Pentenoic acid, methyl ester
–
–
–
1.09
1.54
12
1,1,3-Trimethoxy propane
1.55
–
–
–
–
13
Ethylbenzene
2.76
3.79
2.29
–
–
14
p-Xylene
5.18
5.80
4.36
0.46
15.68
15
Furan, tetrahydro-2,5-dimethoxy-
14.55
11.85
17.03
10.07
5.95
16
Benzene, 1,3-dimethyl
2.08
2.58
1.95
15.22
7.51
17
1-(Furan-2-yl)-4-methylpentan-1-one
0.72
–
–
–
–
18
F3(2H)-Furanone, dihydro-5-isopropyl-
–
–
–
0.41
0.64
19
6-Hydroxy-2,6-dihydropyran-3-one
–
–
0.36
0.72
0.23
20
enzene, 1,1′-dodecylidenebis[4-methyl-
0.23
0.52
–
–
–
21
1,7-Heptanediol
0.54
–
–
–
–
22
Furan, tetrahydro-2,5-dimethoxy-
3.07
5.02
8.79
–
–
23
Ethanone, 1-(2-furanyl)-
0.92
0.8
1.23
–
1.28
24
2H-Pyran, 3,4-dihydro)
–
–
–
–
0.55
25
Benzenepropanoic acid, à,á-dimethyl-
–
–
–
–
0.75
26
2-Oxepanone, 7-methyl-
0.14
0.35
1.41
–
–
27
Glycolaldehyde dimethyl acetal
–
–
0.88
0.47
0.29
28
Phenol
42.71
47.66
36.95
6.09
–
29
Benzofuran
–
–
0.58
0.81
–
30
2-methyl- Phenol
3.95
2.18
1.87
0.90
–
31
p-Cresol
1.54
1.35
–
–
–
32
2-methoxy-Phenol
4.35
2.42
2.89
–
–
However, bio-oil still has poor performance such as low pH and high O content. Therefore, pre-processing of bio-oil is necessary after pyrolysis. The thermal steam filtration and catalytic modification are the common pre-processing method to improve its physicochemical properties (Han et al., 2019).
3.3.2 Bio-gas investigation
Kabir et al. (2018) pointed out that the involved generation reactions of bio-gas are complex (Kabir et al., 2018). The main reactions of the bio-gas generation are depolymerization, fragmentation and secondary reactions (KristinaMaliutina and JianglongYu, 2017). Fig. S4a presents the component of the bio-gas at 400–800 °C. The bio-gas produced at low temperature has large content of CO2. However, CO2 content gradually decreases with increasing in temperature. CO2 content reaches the minimum value at 800 °C, indicating that generation reactions of CO2 are hindered at high temperature. The CO content decreases before 500 ℃ and subsequently increases at 500–800 °C due to fact that cellulose and hemicellulose easily lose decarboxylation and then convert into CO. H2 content gradually increases as pyrolysis temperature increases. The H2 content reaches the maximum value of 41.07% at 800 °C, indicating that high pyrolysis temperature contributes to H2 production. CH4 content is increase at 400–700 °C, which is increase from 4.76 % to 13.07 %. However, CH4 content decreases at 700–800 °C. The pyrolysis temperature significantly influences the component of the bio-gas (Zhang et al., 2018; Foong et al., 2020). Bio-gas heating value generally increases at 400–800 °C (Fig. S4b). As Fig. S4b shown, the maximum heating value of bio-gas is 13.42 MJ/Nm3. However, the bio-gas heating value is low compared to the marsh gas and natural gas, which limits it large scale application (Zhang et al., 2018). Conversion H2 /CO into CH4 and reduction CO2 content can increase the heating value of the bio-gas.
3.3.3 Biochar investigation
Biochar produced from different temperature has abundant pore structure. The range of specific surface area of biochar produced at 400–800 °C is 86.59–293.84 m2/g. Bio-char produced from 700 °C has large surface area. It can be explained that high pyrolysis temperature is conductive to forming pores. However, if the pyrolysis temperature is too high, the generated pore will be ruined. It is the reason why the surface area of biochar produced at 800 °C decreases. The above analysis demonstrates that pore structure of biochar is also influenced by pyrolysis temperature. Fig.S5 shows the SEM images of biochar prepared from 400 to 800 °C. Fig.S5 indicates that the biochar prepared from 400 to 500℃ has underdeveloped pores or little pore. However, a huge number of pores are appeared as pyrolysis temperature increases. It can be explained that high pyrolysis temperature contributes to the formation of pore. The SEM analysis is in good agreement with pore structure analysis.
Raman spectrum of biochar is shown in Fig.S6. As Fig.S6 shown, biochar has two peaks at around 1350 and 1600 cm−1, which are named as D peak and G peak. D peak means the defection of crystalline structure. While, G peak is used to describe the graphitic structure. Graphitization degree of biochar is investigated by ID/IG value. As Fig.S7 shown, the ID/IG value increases as pyrolysis temperature increases.
3.4 Application of biochar
3.4.1 Ag+ adsorption of biochar
The scholars reported that biochar has abundant chemical functional groups, which can be used in wastewater treatment (Alshawi et al., 2022; Mohammed et al., 2022; Cheng et al., 2022). Biochar prepared from 700 °C is used for Ag+ adsorption because of large BET surface area for evaluation its adsorption performance. The detailed information of adsorption process is in the Supplementary materials. Ag+ adsorption capacity of the biochar is tested using adsorption experiment. The residual concentration is detected by atomic absorption spectrum after adsorption equilibrium. The amount of the adsorbed Ag+ on biochar is 65.14 mg/g based on adsorption experiment.
3.4.2 Ag+ adsorption and reduction process
SEM-EDS images of biochar after Ag+ adsorption are presented in Fig. 2. Fig. 2a-b indicates that the surface of biochar has many white particles. The white granular is silver element according to EDS analysis (Fig. 2c-d). XRD is employed to further analyze the particle matter. As Fig. 2e shown, the surface of the original biochar has the SiO2 and CaCO3. However, the silver crystal exists on biochar after Ag+ adsorption. The existence of metallic silver demonstrates that Ag+ is converted into the metallic silver by reduction after adsorption. The value-added A/char is generated on biochar after Ag+ adsorption based on XRD/SEM-EDS analysis.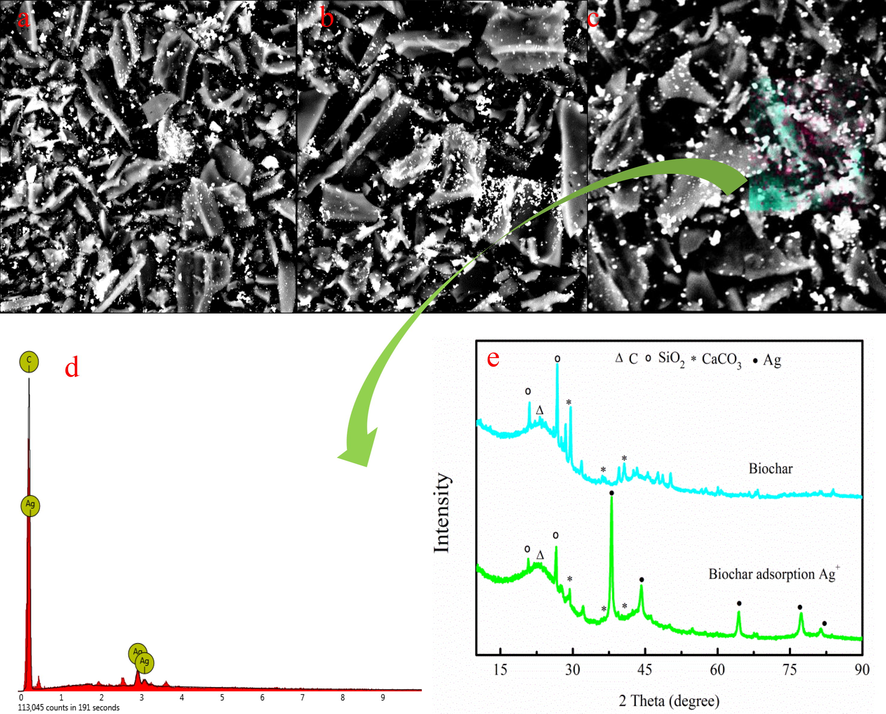
SEM-EDS images of biochar after adsorption of Ag+ (a-d), XRD spectra of biochar before and after Ag+ adsorption (e).
XPS spectrum is employed to investigate Ag+ adsorption and reduction process. As Fig. 3 a shown, biochar appears Ag element. The Ag3d3/2 and Ag3d5/2 are appeared in Ag spectra, indicating that silver has two different status on biochar, corresponding to the form of metallic silver (Ag3d5/2) and Ag+ (Ag3d3/2), respectively. Binding energy distance of two different states of Ag is 6.0 eV. The peak area of Ag3d5/2 is large compared to Ag3d3/2 (Li et al., 2019). This result proves that Ag ions are converted into silver by reduction. As Fig. 3c-d shown, C1s spectra of biochar contain C—C, C—O, and C⚌O groups. However, binding energies and peak areas of above groups have changed after Ag+ adsorption. C—O and C⚌O peak area decrease by 7.67% and 4.14% after Ag+ adsorption, respectively. XPS analysis indicates that hydroxyl and carboxylic groups of biochar involves in Ag+ adsorption. O1s peaks of biochar before and after adsorption are also employed to further investigate Ag+ adsorption process (Fig. 3e-f). C⚌O and C—O peak area decrease by 8.31 % and 6.28 % after Ag+ adsorption, respectively. O1s peak analysis is in good agreement with C1s peak analysis. The metal-O group peak area increases by 14.32%, demonstrating that biochar appears Ag element. The binding energy of the metal-O group is 530.81 eV before adsorption. However, it is shifted to 531.05 eV. It can be explained that the donation of lone electron pair is generally low\ compared to electron density around oxygen atom (Zhang et al., 2019). Therefore; the binding energy of O1s increases. Fig. 4a indicates that the-OH group is appeared near 3440 cm−1. The —COOH group is found biochar at around 1640 cm−1. Besides, the C—O peak is found at the peak near of the 1130 cm−1. The peak intensity and location of —OH and —COOH groups are changed after Ag+ adsorption based on FTIR spectra analysis.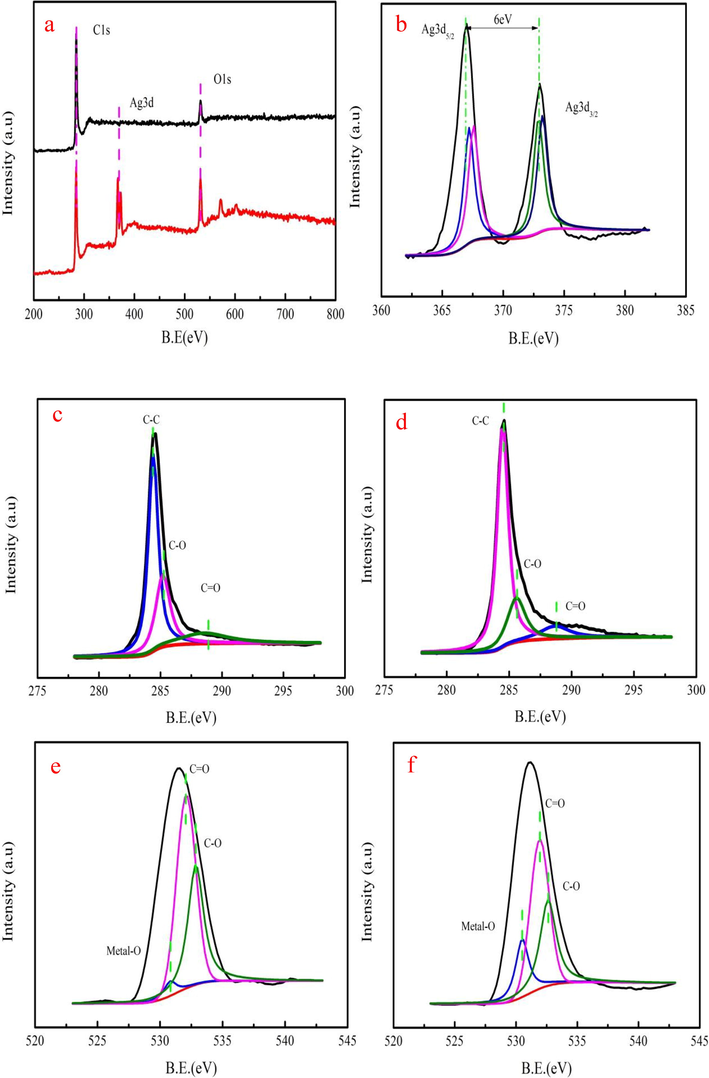
The wide scan XPS spectrum biochar before and after (a), Ag 3d spectra of (b), C1s spectra of (c-d) and O1s spectra of before and after adsorption (e-f).

FTIR spectra of original biochar before and after Ag+ adsorption (a), adsorption and reduction process of Ag+ (b).
Ag+ reduction process can be described that carboxyl and hydroxyl groups reduce Ag+ into the metastable Ag clusters on biochar because of lower surface energy (Abbas et al., 2020). The generated Ag clusters are thermodynamically far more favored than smaller entities. The metastable silver clusters generally agglomerate and subsequently form A/char during growth period (Zhao et al., 2018). The above analysis results demonstrate that Ag+ ions are converted into Ag nanoparticles on biochar after adsorption. Fig. 4b presents the Ag+ adsorption and reduction process. The application of A/char in dye removal and energy storage is also investigated.
3.4.3 Rhodamine B degradation performance of A/char
Rhodamine B is employed to investigate the degradation performance of the A/char in condition of NaBH4. 50 mL rhodamine B solution at 20–40 mg/L is mixed with the 0.02 g A/char. The detailed information is in the supporting material. The rhodamine B degradation removal (η) of A/char and biochar with or without NaBH4 is presented in Fig. 5a-b. The η is general increase as degradation time increases at 20–40 mg/L (Fig. 5a). The maximum η of A/char is 81.75% at rhodamine B concentration of the 20 mg/L. Biochar and A/char have little rhodamine B removal without NaBH4 (Fig. 5b). However, the η of A/char is large compared to biochar with NaBH4 (Fig. 5b). As Fig. 5b shown, the η of A/char without NaBH4 is lower than that of the A/char adding NaBH4. Besides, when the rhodamine B solution only adds the NaBH4, the η of the rhodamine B is low. These results prove that synergy between A/char and NaBH4 achieves the high rhodamine B removal. The main peak intensity of the rhodamine B gradually decreases with increasing in catalytic time (Fig. 5c). This phenomenon proves that rhodamine B molecular structure is ruined (Cheng et al., 2022). This result demonstrates that A/char has good rhodamine B catalytic performance.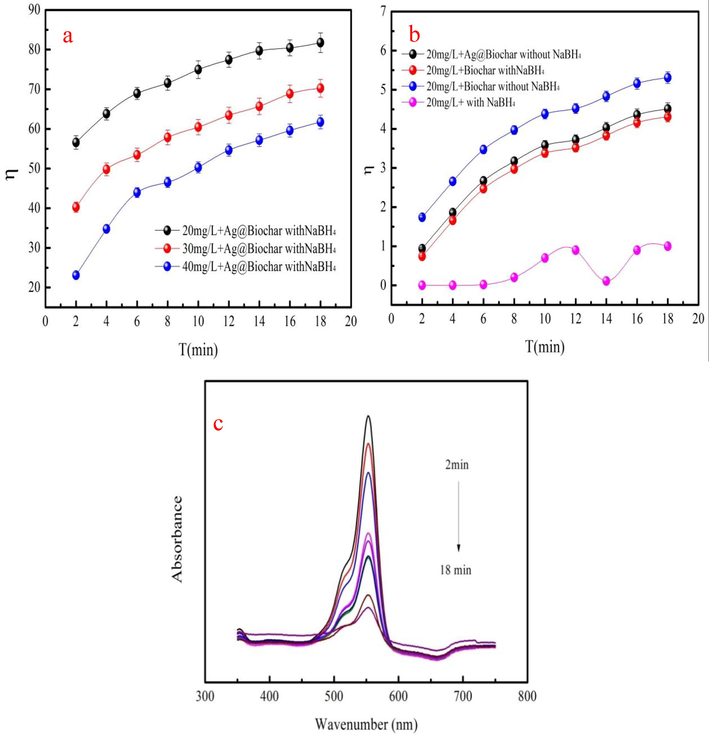
The degradation removal of rhodamine B using Ag/char with NaBH4 (a), degradation removal of rhodamine B using biochar and A/char with or without NaBH4 (b) and UV–visible absorption spectra of rhodamine B of A/char at 20 mg/L (c).
3.4.4 Energy storage of A/char
The energy storage potential of the A/char at 50–2000 mA g−1 is presented in Fig. 6. The ratio of initial charge and discharge is 53.84% based on Fig. 6. Besides, the specific energy storage capacities are 350, 270, 220, 168, 140, 91 and 320 mAh g−1 at 50–2000 mA g−1, respectively. Remarkably, the specific capacity is comparable to the first charge reversible capacity with the capacity retention of 91.43% when current density returns to 50 mA g−1. This result indicates that A/char has good reversibility. As Fig. 6 shown, A/char specific capacity is large at 50 mA g−1 with 350 mAh g−1. It can be explained that Ag in A/char plays an important role in energy storage. Besides, A/char has layered structure created more free space and holes for volume changes, which is conductive to the transport of lithium ions due to large surface area.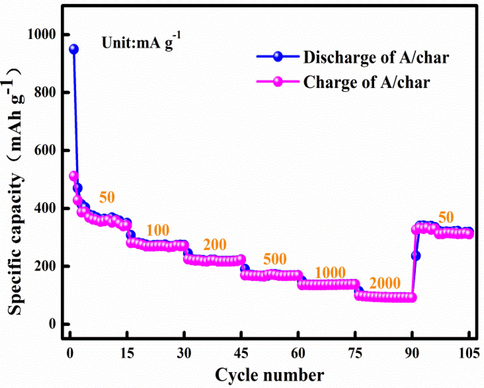
Rate performance of A/char for the lithium ion batteries at different current densities.
4 Conclusions
Physicochemical properties of pyrolysis products are analyzed at 400–800 °C. High pyrolysis temperature contributes to the production of bio-gas and restrains the generation of biochar. However, bio-oil yield is little influenced by the pyrolysis temperature. Pyrolysis temperature influences the composition and heating value of bio-gas. The maximum heating value of bio-gas is 13.41 MJ/Nm3, which can provide energy for industrial production. Biochar is employed as the adsorbent for Ag+ removal, which forms A/char by reduction with the adsorption amount of the 65.14 mg/g at the concentration of 250 mg/L. The formed A/char is acted as the catalyst for rhodamine B degradation with the removal of the 81.75% at the 20 mg/L. The formed A/char is used in energy storage with the 350 mAh g−1 at 50 mA g−1. Besides, the reduction process of the A/char is analyzed.
Acknowledgments
The authors would like to express their gratitude to the Specialized Research Fund for the Natural Science Foundation of Henan Province (232300420298), the Fundamental Research Funds for the Universities of Henan Province (NSFRF220417) for financial support.
Declaration of Competing Interest
The authors declare that they have no known competing financial interests or personal relationships that could have appeared to influence the work reported in this paper.
References
- Biochar-induced immobilization and transformation of silver-nanoparticles affect growth, intracellular-radicles generation and nutrients assimilation by reducing oxidative stress in maize. J. Hazard. Mater.. 2020;390:121976
- [Google Scholar]
- Microwave-assisted pyrolysis of Mississippi coal: a comparative study with conventional pyrolysis. Fuel. 2018;217:656-667.
- [Google Scholar]
- Utilization of waste polyethylene terephthalate bottles to develop metal-organic frameworks for energy applications: a clean and feasible approach. J. Clean. Prod.. 2020;248:119251
- [Google Scholar]
- Synthesis of NiOx@NPC composite for high-performance supercapacitor via waste PET plastic-derived Ni-MOF. Compos. Part B- Eng.. 2020;183:107655
- [Google Scholar]
- Voltammetric determination of Hg2+, Zn2+, and Pb2+ ions using a PEDOT/NTA-modified electrode. ACS Omega. 2022;7(23):20405-20419.
- [Google Scholar]
- Catalytic pyrolysis of liquorice (Glycyrrhiza glabra L.) in a fixed-bed reactor: Effects of pyrolysis parameters on product yields and character. J. Anal. Appl. Pyrolysis. 2015;111:156-172.
- [Google Scholar]
- Microwave-assisted depolymerization of various types of waste lignin over two-dimensional CuO/BCN catalysts. Green Chem.. 2020;22(3):725-736.
- [Google Scholar]
- Utilization of municipal solid and liquid wastes for bioenergy and bioproducts production. Bioresour. Technol.. 2016;215:163-172.
- [Google Scholar]
- Adsorption behavior of methylene blue onto waste-derived adsorbent and exhaust gases recycling. Rsc Adv.. 2017;7:27331-27341.
- [Google Scholar]
- Efficient and selective removal of Pb(II) from aqueous solution by modification crofton weed: experiment and density functional theory calculation. J. Clean. Prod.. 2021;280:124407
- [Google Scholar]
- Facile one-pot green synthesis of magnetic separation photocatalyst-adsorbent and its application. J. Water Process. Eng.. 2022;47:102802
- [Google Scholar]
- Preparation of valuable pyrolysis products from poplar waste under different temperatures by pyrolysis: evaluation of pyrolysis products. Bioresour. Technol.. 2022;364:128011
- [Google Scholar]
- Efficient removal of heavy metals from aqueous solutions by Mg/Fe bimetallic oxide-modified biochar: experiments and DFT investigations. J. Clean. Prod.. 2023;403:136821
- [Google Scholar]
- Crop residues as raw materials for biorefinery systems – A LCA case study. Appl. Energy. 2010;87:47-57.
- [Google Scholar]
- Valorization of biomass waste to engineered activated biochar by microwave pyrolysis: progress, challenges, and future directions. Chem. Eng. J.. 2020;389:124401
- [Google Scholar]
- Microwave-assisted pyrolysis and analytical fast pyrolysis of macroalgae: product analysis and effect of heating mechanism. Sustain. Energy Fuels. 2019;3(11):3009-3020.
- [Google Scholar]
- Physical and emulsifying properties of OSA-corn dextrin with various manufacturing methods. Food Hydrocolloid.. 2019;89:563-569.
- [Google Scholar]
- Aluminothermic reduction synthesis of Si/C composite nanosheets from waste vermiculite as high-performance anode materials for lithium-ion batteries. J. Alloy. Compd.. 2022;922:166134
- [Google Scholar]
- Pyrolysis of oil palm mesocarp fiber catalyzed with steel slag-derived zeolite for bio-oil production. Bioresour. Technol.. 2018;249:42-48.
- [Google Scholar]
- Comparative study on flash pyrolysis characteristics of microalgal and lignocellulosic biomass in entrained-flow reactor. Energy Convers. Manage.. 2017;151:426-438.
- [Google Scholar]
- Preparation of silver-nanoparticle-loaded magnetic biochar/poly (dopamine) composite as catalyst for reduction of organic dyes. J. Colloid Interface Sci.. 2019;555:460-469.
- [Google Scholar]
- Use of a Schiff base-modified conducting polymer electrode for electrochemical assay of Cd(II) and Pb(II) ions by square wave voltammetry. Chem. Pap.. 2022;76(2):715-729.
- [Google Scholar]
- Catalytic fast pyrolysis of biomass: the reactions of water and aromatic intermediates produces phenols. Green Chem.. 2015;17:4217-4227.
- [Google Scholar]
- Catalytic pyrolysis of lignin over ZSM-5, alkali, and metal modified ZSM-5 at different temperatures to produce hydrocarbons. J. Energy Inst.. 2022;101:111-121.
- [Google Scholar]
- Conventional and microwave-assisted pyrolysis of gumwood: a comparison study using thermodynamic evaluation and hydrogen production. Fuel Processing Technol.. 2019;184:1-11.
- [Google Scholar]
- Analytical and microwave pyrolysis of empty oil palm fruit bunch: kinetics and product characterization. Bioresour. Technol.. 2020;310:123394
- [Google Scholar]
- Preparation of pyrolysis products by catalytic pyrolysis of poplar: Application of biochar in antibiotic wastewater treatment and energy storage. Chemosphere. 2023;338:139519
- [Google Scholar]
- Preparation of double functional carbon-based ZnO derived from rape straw for dye wastewater treatment. J. Water Process. Eng.. 2023;52:103588
- [Google Scholar]
- Microwave-assisted production of CO2-activated biochar from sugarcane bagasse for electrochemical desalination. J. Hazard. Mater.. 2020;383:121192
- [Google Scholar]
- Fabrication of highly porous N-doped mesoporous carbon using waste polyethylene terephthalate bottle-based MOF-5 for high performance supercapacitor. J. Energy Storage. 2021;33:102125
- [Google Scholar]
- Hydrocarbon fuel production from soapstock through fast microwave-assisted pyrolysis using microwave absorbent. J. Anal. Appl. Pyrol.. 2016;119:251-258.
- [Google Scholar]
- Catalytic pyrolysis of lignocellulosic biomass for bio-oil production: a review. Chemosphere. 2022;297:134181
- [Google Scholar]
- Gasification of refuse-derived fuel from municipal solid waste for energy production: a review. Environ. Chem. Lett.. 2021;19:2127-2140.
- [Google Scholar]
- Microwave co-torrefaction of waste oil and biomass pellets for simultaneous recovery of waste and co-firing fuel. Renew. Sust. Energ. Rev.. 2021;152:111699
- [Google Scholar]
- Progress in the torrefaction technology for upgrading oil palm wastes to energy-dense biochar: a review. Renew. Sust. Energ. Rev.. 2021;151:111645
- [Google Scholar]
- Application of biomass pyrolytic polygeneration by a moving bed: characteristics of products and energy efficiency analysis. Bioresour. Technol.. 2018;254:130-138.
- [Google Scholar]
- Effects of feedstock characteristics on microwave-assisted pyrolysis - A review. Bioresour. Technol.. 2017;230:143-151.
- [Google Scholar]
- Magnetic apple pomace biochar: Simple preparation, characterization, and application for enriching Ag(I) in effluents. Sci. Total Environ.. 2019;668:115-123.
- [Google Scholar]
- Catalytic conversion of microwave-assisted pyrolysis vapors. Energy Sources Part A. 2010;32:1756-1762.
- [Google Scholar]
- Facile low-temperature one-step synthesis of pomelo peel biochar under air atmosphere and its adsorption behaviors for Ag(I) and Pb(II) Sci. Total Environ.. 2018;640:73-79.
- [Google Scholar]
Appendix A
Supplementary material
Supplementary data to this article can be found online at https://doi.org/10.1016/j.arabjc.2023.105187.
Appendix A
Supplementary material
The following are the Supplementary data to this article:Supplementary data 1
Supplementary data 1


