Translate this page into:
Mineralogical and geochemical characteristics of barium slag and ecological risks associated with heavy metals
⁎Corresponding author at: College of Resources and Environmental Engineering, Guizhou University, Guiyang, Guizhou 550025, China. jxcao@gzu.edu.cn (Jianxin Cao)
-
Received: ,
Accepted: ,
This article was originally published by Elsevier and was migrated to Scientific Scholar after the change of Publisher.
Abstract
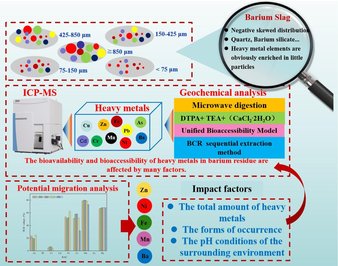
Abstract
The chemical composition, mineral composition and morphological characteristics of barium slag were investigated. The geochemical leaching toxicity, bioavailability, bioaccessibility and migration behaviour of heavy metals in barium slag were examined. The potential ecological risks associated with the release of heavy metals from barium slag driven by its geochemical behaviour were evaluated.
Abstract
Barium slag (BS) is a typical chemical hazardous waste, and its ecological risks cannot be ignored. Herein, the chemical composition, mineral composition and morphological characteristics of BS were investigated. In addition, the geochemical behaviour was investigated in terms of heavy-metal-leaching toxicity as well as the bioavailability, bioaccessibility and migration of these metals. The ecological risks associated with the release of heavy metals from BS driven by its geochemical behaviour were also evaluated. The BS displayed irregular particle morphologies and distinct surface structures, with heavy metal ions predominantly present in the smaller-sized BS particles. Zn, Ni, Mn and Ba exhibited a stronger potential for migration in plants than other heavy metals. This migration potential was influenced by their total amount and occurrence form as well as the pH conditions of the surrounding environment. The findings indicated that crops should not be planted around BS yards. The bioaccessible risks associated with heavy metals in BS were low. Mn, Ba, Fe and Ni primarily existed in the form of a weak-acid soluble fraction, thereby posing a high migration risk. Thus, attention should be paid to the ecological risks that may arise from Mn, Ba, Fe and Ni during storage.
Keywords
Barium slag
Heavy metals
Ecological risk
Geochemical assessment
1 Introduction
Barium slag (BS) is the residue generated after barite undergoes carbothermal reduction for barium sulphide leaching (Guo et al., 2022; Kefeni and Mamba, 2021). China is the largest producer of BS in the world. Its annual production capacity of barium salt is >1.5 million tonnes, and each tonne of barium salt produces ∼0.8–1.0 tonnes of BS. BS is primarily disposed in landfills, and the accumulated stockpile has reached tens of millions of tonnes (Gu et al., 2019; Guo et al., 2020; Guo et al., 2022; He et al., 2022; Huang et al., 2022). With the demand of high-quality barite ore in petrochemical industry, it faces the gradual depletion; in addition, barium salt production using low-grade barite ores generates considerable BS, which has also become a prevalent issue in the industry. Guizhou is an important region for the barium salt industry in China, and the karst landform area unique to the Guizhou region is characterised by karst development and severe leakage. The ecological pollution risks involved during BS storage are significant, severely restricting the healthy development of the barium chemical industry, and have become a growing concern. In addition to the main elements, e.g. Ba, S, Si, Al and Fe, heavy-metal elements, including Sr, Cu, Zn, Ni and Cr, are associated with barite ore and raw (combustion) materials. These heavy metals partly remain in the BS during the production process. Current research has revealed that BS contains quartz, BaSiO3, BaSO4, BaAl2Si2O8, hematite and other mineral phases (Gu et al., 2023; He et al., 2022). The pH of BS is ∼12, and the concentration of barium ion in the leaching solution reaches 1000 mg/L, which is much higher than the limit of 100 mg/L defined in the ‘Identification Standard for Toxicity Identification of Hazardous Waste Leaching’ (GB5085.3-2007) (EPAC, 2007a). In addition, according to the management classification of hazardous waste in China, BS is included in the ‘National Catalogue of Hazardous Waste’ (Huang et al., 2022).
The combined effects of weathering, surface erosion, microbial activity and atmospheric precipitation leaching can transfer and release barium and other heavy metals from the stored BS into the environment surrounding the slag yard, causing wide ecological pollution to farmland crops, aquatic ecology and even groundwater systems (Liu et al., 2018; Mikoda et al., 2019; Xu et al., 2021). BS storage occupies valuable land resources, and the involved ecological pollution risks cannot be ignored (Vaidya et al., 2010). In the past decades, several studies on the composition and mineral phases of BS have been conducted (Gu et al., 2023; Yang et al., 2021); however, to comprehensively evaluate the ecological risks associated with harmful heavy metals in BS, it is necessary to study the occurrence state and distribution of these metals within BS as well as their migration and transformation behaviours during storage. Existing research primarily focused on the detrimental effect of barium ion during the storage of BS, while investigations regarding other heavy metal ions in BS were left unexplored (Guo et al., 2001; Necula et al., 2023; Wang et al., 2016). The physical characteristics and geochemical instability of BS are related to the leaching of heavy-metal ions, which can have considerable adverse effects on plants, animals and humans (Argane et al., 2016; Lindroos et al., 2019).
Therefore, this research systematically investigated the typical components, occurrence and distribution of heavy metals in BS and analysed the chemical composition, mineralogical characteristics and morphological characteristics of BS with different grain sizes. In addition, the research comprehensively evaluated the potential release of heavy metals from BS driven by geochemical behaviour and assessed the ecological risks associated with harmful heavy metals. The aim was to (1) explore how the mineralogical and morphological characteristics of BS affect the geochemical behaviour of heavy metals, (2) provide theoretical data support to effectively manage and control ecological risks that may be caused by BS and (3) offer scientific guidance for its comprehensive resource utilisation and harmless treatment.
2 Materials and methods
2.1 Sample collection and pre-treatment
Herein, BS was collected from a barium salt enterprise in Guizhou Province, China. The sampling was conducted in accordance with the system sampling method recommended by “Technical Specification for Sampling and Sample Preparation of Industrial Solid Waste” (HJ/T 20-1998). After drying at 40 ℃ for 48 h, the BS was classified into five grain grades through nested screening (20, 40, 100 and 200 mesh): ≥850 (BS1), 425–850 (BS2), 150–425 (BS3), 75–150 (BS4) and <75 (BS5) μm. The BS of each grain grade was then ground and sieved through a 200-mesh screen, and the physicochemical properties, mineralogy properties, heavy-metal-leaching toxicity, bioavailability, bioaccessibility and migration of the BS were tested.
2.2 Methods
2.2.1 Chemical composition and mineralogical characteristics analysis
The particle size distribution of the BS of different particle grades was analysed using a Mastersizer 2000 (Malvern Panalytical) laser particle size analyser. The primary chemical components were analysed using Thermo Scientific ARL Perform X-ray fluorescence spectrometry (XRF, melt sheet method, 50 kV, 50 mA), and the mineral composition was analysed using Bruker D8 advance X-ray diffraction (XRD, Cu target, 40 kV, 40 mA, scanning rate: 10°/min). In addition, the micromorphology and microelement distribution were analysed using a German ZEISS Gemini 300 (0.02–30 kV, 10×, 1,000,000×) scanning electron microscope and a Smart Ed spectrometer.
2.2.2 Geochemical analysis
Heavy-metal content
Referring to ‘Determination of Metal Elements in Solid Waste by Inductively Coupled Plasma Mass Spectrometry’ (HJ 766-2015) (MEPC, 2015), the pre-treated BS samples of each grade were weighed at 0.2 g (accurate to 0.0001 g). Here, the microwave digestion method was employed, and the samples were dissolved using hydrochloric acid (1.19 g/mL), nitric acid (1.42 g/mL), hydrofluoric acid (1.49 g/mL) and hydrogen peroxide (30 %). After removing the excess acid from the digestion solution, it was dissolved with deionised water and then filtered. The filtrate was then diluted to a volume of 50 mL, and the supernatant was analysed using inductively coupled plasma mass spectrometry (ICP-MS) on a Prekin EImer ICP-MS NexlON 1000G instrument. The concentrations of heavy-metal ions (ions of Cu, Zn, Pb, Cr, Cd, Ni, Fe, Mn, As and Ba) in the solution were measured and used to calculate the heavy-metal content of the BS as follows:
Identification of leaching toxicity
The BS leaching solution was prepared according to ‘Solid Waste leaching Toxicity Leaching Method of sulphuric acid and nitric acid Method’ (HJ/T299-2007) (EPAC, 2007b), and BS leaching toxicity was identified according to ‘Hazardous Waste Identification Standard Leaching Toxicity Identification’ (GB5085.3-2007) (EPAC, 2007a). Here, 10.0 g of pre-treated BS samples of each grade were placed into an extraction bottle, and the leaching solution with pH = 3.20 ± 0.05 was added at a liquid–solid ratio of 10:1 (mL/g). The leaching solution was then oscillated at 30 ± 2 r/min under 23 °C ± 2°C for 18 ± 2h and then filtered through a 0.45-μm filter membrane. The concentrations of heavy-metal ions (ions of Cu, Zn, Pb, Cr, Cd, Ni, As and Ba) in the filtrate were determined through ICP-MS.
Bioavailable test and calculation
The concentrations of bioavailable heavy metals in the BS were determined. Using a mixed solution of 0.005 mol/L DTPA + 0.1 mol/L TEA + 0.01 mol/L CaCl2·2H2O as the extraction solution, the solution pH was controlled at 7.3, and 2.0 g pre-treated samples of each BS grade was mixed with the extraction solution at a liquid–solid ratio of 10:1 (mL/g). After oscillating the mixture at 200 r/min under 25 °C + 2°C for 2 h on an oscillating device, the supernatant was filtered using a 0.45-μm filter membrane (He et al., 2020; Kaniki and Tumba, 2019; Lewis et al., 2021; Lindsay and Norvell, 1978), and the concentrations of heavy-metal ions (ions of Cu, Zn, Pb, Cr, Cd, Ni, Fe, Mn, As and Ba) in the filtrate were determined through ICP-MS. This represented the concentration of bioavailable heavy metals (denoted as Cbioavailable).
The bioavailable fraction of heavy metals (BAM1) was calculated as follows:
Bioaccessible test and calculation
With reference to the unified bioaccessibility model (Wragg et al., 2011), the gastrointestinal digestion characteristics of Chinese people, the concentration of heavy metals in the BS dissolved in the gastrointestinal system was measured by simulating gastric and intestinal juices as the extraction solution. This represented the bioaccessible concentration of heavy metals (denoted as Cbioaccessible).
The simulated gastric and intestinal juices were prepared as follows. To prepare the simulated gastric juice, 16.3 mL 37 % hydrochloric acid was mixed with 800 mL deionised water and then 10.0 g pepsin was added to the mixture. The volume was fixed to 1 L. The simulated intestinal liquid was prepared by mixing 6.8 g KH2PO4 with 10.0 g pancreatic enzyme, adjusting the pH to 6.8 ± 0.05, diluting with deionised water and setting the volume to 1 L (Lei et al., 2020; Li et al., 2017; Rui et al., 2019).
The tests for the gastric-phase (GP) concentration of the bioaccessible heavy metals were performed as follows: 10.0 g of pre-treated BS samples of each grade were mixed with 225 mL of the simulated gastric juice in a 1-L HDPE extraction bottle, and the pH was adjusted to 1.1 ± 0.05 with a 37 % HCl or 1-mol/L NaOH solution. The samples were then oscillated at 30 r/min under 25 °C on an oscillating device for 1 h. After centrifugation at 4000 r/min for 20 min, the concentrations of heavy-metal ions (ions of Cu, Zn, Pb, Cr, Cd, Ni, Fe, Mn, As and Ba) in the supernatant were measured using ICP-MS. This represented the GP bioaccessible concentration of heavy metals (Lei et al., 2020; Rui et al., 2019).
The gastrointestinal-phase (GIP) bioaccessible concentration of heavy metals was determined as follows: 600 mL of the simulated intestinal fluid was added to the GP fluid and the pH was adjusted to 6.3 ± 0.05. Samples were taken at 0.5, 1, 2, 4, 6, 8, 10 and 12 h at 30 ± 2 r/min under 25 °C. After centrifuging at 4000 r/min for 20 min, the concentrations of heavy-metal ions (ions of Cu, Zn, Pb, Cr, Cd, Ni, Fe, Mn, As and Ba) in the supernatant were measured through ICP-MS. This represented the GIP bioaccessible concentration of heavy metals (Lei et al., 2020; Rui et al., 2019).
The bioaccessible fraction of heavy metals (BAM2) was calculated as follows:
Test of heavy-metal form
The content of four geochemical fractions of heavy metals (ions of Cu, Zn, Pb, Cr, Cd, Ni, Fe, Mn, As and Ba) in the BS samples of each grain grade was determined through BCR sequential extraction (Li and Yuejie, 2020; Liu et al., 2018; Rauret et al., 1999; Zhang et al., 2008), which includes weak-acid soluble fraction (B1), reducible fraction (B2), oxidisable fraction (B3) and residual fraction (B4). BCR sequential extraction procedure is shown in Table 1.
Step
Sediment phase
Extractant
Shaking time and temperature
B1
Weak-acid soluble fraction
40 ml of 0.11 mol/L CH3COOH
16 h at room temperature at 25 ± 5℃ and speed 30 ± 10 r/min. The extract was separated from the solid phase by centrifugation at 3000 r/min for 20 min.
B2
Reducible fraction
40 ml of 0.5 mol/L HONH2.HCl (pH 1.5)
16 h at room temperature 22 ± 5℃ and speed 30 ± 10 r/min. The extract was separated from the solid phase by centrifugation at 3000 r/min for 20 min.
B3
Oxidizable fraction
10 ml of 8.8 mol/L H2O2 (two times), cool and add 50 mL of 1 mol/L NH4OAc (pH 2)
1 h at room temperature 1 h at 85℃ 1 h at 85℃ 16 h at room temperature 22 ± 5℃ and speed 30 ± 10 r/min. The extract was separated from the solid phase by centrifugation at 3000 r/min for 20 min.
B4
Residual fraction
10 mL of aqua regia
Digesting in a mixture aqua regia
2.3 Ecological risk
2.3.1 Bioaccessibility assessment
Bioaccessibility was graded into the following four classes according to the BAM2 value (Xu et al., 2021): low (1–15 %; LR), moderate (15–30 %; MR), high (30–50 %; HR) and very high (>50 %; VHR) risks.
2.3.2 Risk assessment code
The migration risk was evaluated using a risk assessment code (RAC), which is calculated as follows (Chen et al., 2023; Du et al., 2020):
2.4 Data statistics and analysis
The heavy metals in the BS were tested thrice, and the results were expressed as the mean ± standard deviation (SD) of each test. Here, the relative SD of the three analyses was controlled within 10 %. In addition, IBM SPSS 26.0 was used to conduct one-way analysis of variance at a significance level of p < 0.05 for the metal data included in this study. A Tukey-Kramer significant difference test was conducted to determine the differences in heavy-metal leaching, bioavailability and bioaccessibility among the five grades of BS.
2.5 Quality assurance and quality control
The experimental containers were soaked in 10 % (V/V) HNO3 and then washed and dried prior to use. The recovery of heavy metals in the soil standard (GBW07451) ranged from 87.82 % to 116.25 %. In addition, the ratio of the heavy-metal content of each grain grade to the sum of the heavy-metal content extracted using the BCR morphology sequence was calculated, and the recovery rate ranged from 78.78 % to 128.83 %.
3 Results and discussion
3.1 Composition and mineralogical characteristics of BS
3.1.1 Composition and particle size distribution of BS
The mass fraction of each BS grade after screening is presented in Table S1, and the particle size distribution curve of each BS grade is shown in Fig. 1.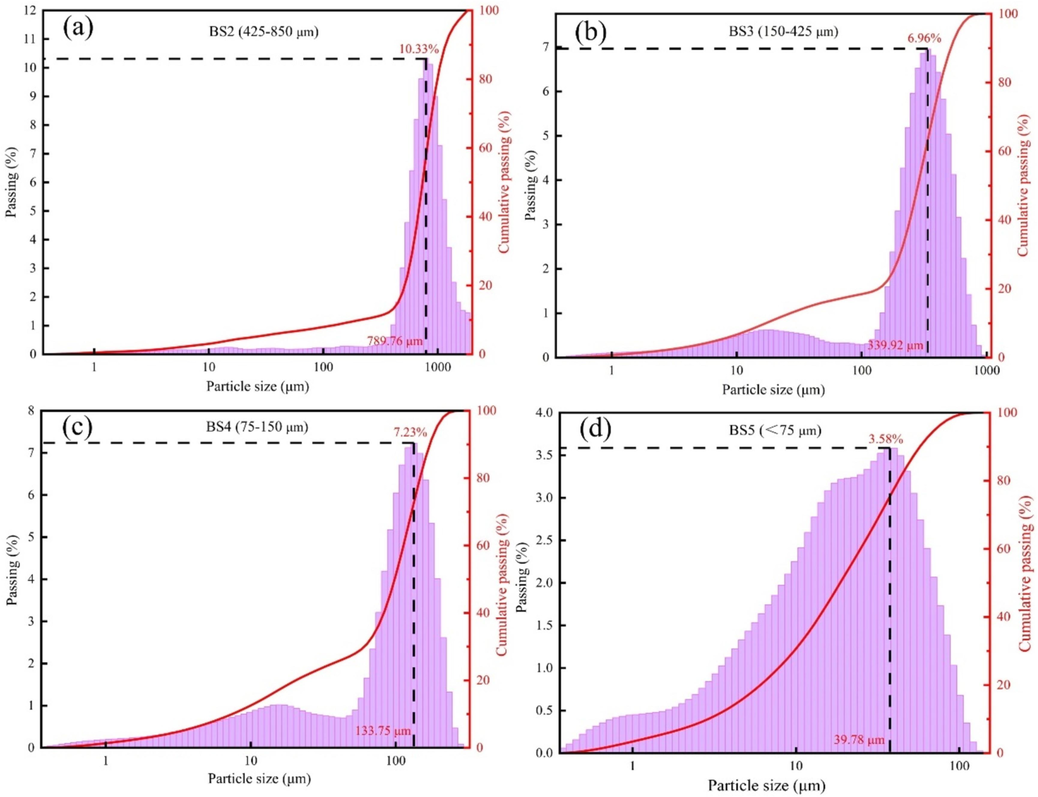
Particle size distribution of the BS.
The mass proportion of BS1 was 52.55 %. The difference in the mass proportion of BS composition among BS2, BS3 and BS5 was not significant, with values of 13.52 %, 13.10 % and 11.50 %, respectively. The mass proportion of BS4 was only 9.33 %.
The particle size distribution curves of the BS of different particle grades exhibited different shapes, and the overall distribution was negatively skewed. The particle size of BS2 (Fig. 1(a)) exhibited a unimodal distribution, with a median particle size (MPS) of 810.40 μm and a maximum frequency diameter (MFD) of 789.76 μm (accounting for 10.33 %, which was greater than the mass diameter proportions of other BS samples). The particle sizes of BS3 and BS4 (Fig. 1(b) and (c), respectively) exhibited bimodal distributions, with MPS values of 309.30 and 108.10 μm, respectively, and MFD values of 339.92 and 133.75 μm, respectively, corresponding to 6.96 % and 7.23 %, respectively. BS5 (Fig. 1(d)) exhibited a three-peak distribution, and the peak height gradually decreased with decreasing particle size. Here, the peak height of the fine grain decreased most obviously, with an MPS of 20.47 μm and MFD of 39.78 μm, and the proportion of MFD was 3.58 %. Moreover, Fig. 1 also showed that the screened BS had a nominal particle size range, whereas its actual particle size distribution deviated from this range. This discrepancy may be attributed to the sifting perforation of a minute quantity of BS particles.
In summary, the proportion of larger particles (≥850 μm) and smaller particles (<850 μm) in BS was close. The particle size distribution of BS with smaller particles displayed a negative skewness, while the shape of its distribution curve varied greatly. This particle size distribution model revealed the heterogeneity of thermodynamic and kinetic behavior during the carbothermal reduction and leaching process of barite, as well as indicated poor granularity sorting in BS.
3.1.2 Chemical composition analysis
The chemical compositions of the BS samples of different particle grades are shown in Table 2, and the overall proportion of the chemical components in the BS of different particle grades is shown in Table S2. ‘–’ Not detected.
Chemical compositions
≥850 μm (BS1)
425–850 μm (BS2)
150–425 μm (BS3)
75–150 μm (BS4)
<75 μm (BS5)
Average content
wt%
SD
wt%
SD
wt%
SD
wt%
SD
wt%
SD
wt%
SiO2
33.9
2.40 × 10⁻¹
33.0
2.40 × 10⁻¹
31.1
2.30 × 10⁻¹
23.0
2.10 × 10⁻¹
17.6
1.90 × 10⁻¹
30.5
BaO
32.2
2.30 × 10⁻¹
32.7
2.30 × 10⁻¹
34.2
2.40 × 10⁻¹
41.3
2.50 × 10⁻¹
44.1
2.50 × 10⁻¹
34.7
SO3
9.51
1.50 × 10⁻¹
9.93
1.50 × 10⁻¹
10.6
1.50 × 10⁻¹
15.1
1.80 × 10⁻¹
15.5
1.80 × 10⁻¹
10.9
CaO
5.42
1.10 × 10⁻¹
5.25
1.10 × 10⁻¹
4.61
1.00 × 10⁻¹
4.30
1.00 × 10⁻¹
5.41
1.10 × 10⁻¹
5.19
Al2O3
4.53
1.00 × 10⁻¹
4.77
1.10 × 10⁻¹
5.18
1.10 × 10⁻¹
4.42
1.00 × 10⁻¹
3.43
9.00 × 10⁻²
4.51
Fe2O3
3.14
9.00 × 10⁻²
2.65
8.00 × 10⁻²
2.78
8.00 × 10⁻²
3.31
9.00 × 10⁻²
4.96
1.10 × 10⁻¹
3.25
MgO
1.10
5.00 × 10⁻²
1.09
5.00 × 10⁻²
1.18
5.00 × 10⁻²
1.24
6.00 × 10⁻²
9.90 × 10⁻¹
4.90 × 10⁻²
1.11
Na2O
1.03
9.00 × 10⁻²
1.44
7.00 × 10⁻²
1.76
7.00 × 10⁻²
1.73
7.00 × 10⁻²
1.68
7.00 × 10⁻²
1.32
K2O
1.16
5.00 × 10⁻²
1.18
5.00 × 10⁻²
1.04
5.00 × 10⁻²
8.50 × 10⁻¹
4.30 × 10⁻²
8.70 × 10⁻¹
4.30 × 10⁻²
1.09
TiO2
3.56 × 10⁻¹
1.80 × 10⁻²
3.80 × 10⁻¹
1.90 × 10⁻²
4.30 × 10⁻¹
2.10 × 10⁻²
3.50 × 10⁻¹
1.80 × 10⁻²
3.20 × 10⁻¹
1.60 × 10⁻²
1.36
P2O5
3.06 × 10⁻¹
1.50 × 10⁻²
2.70 × 10⁻¹
1.30 × 10⁻²
2.20 × 10⁻¹
1.10 × 10⁻²
1.60 × 10⁻¹
9.50 × 10⁻³
1.80 × 10⁻¹
9.00 × 10⁻³
2.60 × 10⁻¹
SrO
1.37 × 10⁻¹
6.90 × 10⁻³
1.30 × 10⁻¹
6.60 × 10⁻³
1.80 × 10⁻¹
6.80 × 10⁻³
1.40 × 10⁻¹
7.10 × 10⁻³
1.70 × 10⁻¹
8.30 × 10⁻³
1.40 × 10⁻¹
V2O5
5.50 × 10⁻²
9.40 × 10⁻³
5.40 × 10⁻²
9.60 × 10⁻³
3.60 × 10⁻²
9.80 × 10⁻³
4.00 × 10⁻²
1.10 × 10⁻²
5.90 × 10⁻²
1.20 × 10⁻²
5.00 × 10⁻²
Cr2O3
9.20 × 10⁻²
4.00 × 10⁻³
1.00 × 10⁻²
4.00 × 10⁻³
–
–
–
–
–
–
−
ZnO
2.40 × 10⁻²
3.60 × 10⁻³
2.00 × 10⁻²
3.60 × 10⁻³
2.30 × 10⁻²
3.40 × 10⁻³
2.80 × 10⁻²
3.60 × 10⁻³
3.70 × 10⁻²
3.70 × 10⁻³
3.00 × 10⁻²
MnO
2.80 × 10⁻²
3.60 × 10⁻³
3.10 × 10⁻²
3.60 × 10⁻³
2.90 × 10⁻²
3.80 × 10⁻³
2.60 × 10⁻²
3.80 × 10⁻³
3.20 × 10⁻²
4.10 × 10⁻³
–
ZrO2
1.60 × 10⁻²
6.90 × 10⁻³
2.30 × 10⁻²
6.60 × 10⁻³
2.00 × 10⁻²
6.60 × 10⁻³
2.10 × 10⁻²
6.70 × 10⁻³
–
–
–
CuO
9.70 × 10⁻³
3.70 × 10⁻³
–
–
–
–
9.50 × 10⁻³
3.80 × 10⁻³
9.70 × 10⁻³
4.00 × 10⁻³
–
MoO3
3.70 × 10⁻²
8.50 × 10⁻³
3.20 × 10⁻²
8.40 × 10⁻³
5.00 × 10⁻²
–
–
–
–
–
–
PtO2
3.10 × 10⁻²
7.20 × 10⁻³
–
–
–
7.10 × 10⁻³
1.90 × 10⁻²
7.00 × 10⁻³
–
–
–
Tb4O7
1.80 × 10⁻²
7.50 × 10⁻³
–
–
–
–
–
–
–
–
NiO
–
–
7.70 × 10⁻³
3.30 × 10⁻³
–
–
–
–
–
–
–
The chemical composition of BS was primarily SiO2, BaO and SO3, accounting for a total of 76.15 %, followed by CaO, Al2O3 and Fe2O3, accounting for 5.19 %, 4.51 % and 3.25 %, respectively. In addition, K2O, MgO, Na2O, TiO2, V2O5, MnO, ZnO, CuO, Cr2O3 and NiO were detected. The chemical composition of the BS samples of different particle grades was the same but at varying proportions. Here, three general cases were identified. First, the proportion of the chemical composition increased with decreasing particle size, e.g. BaO, SO3, Fe2O3, MnO and ZnO. Second, the proportion of the chemical components decreased with decreasing particle size, e.g. SiO2, Al2O3, TiO2, K2O and P2O5. Finally, the proportion of the chemical composition remained relatively constant, e.g. CaO, MgO and Na2O.
Table 2 also shows that the proportion of heavy-metal oxides, e.g. BaO, Fe2O3, MnO and ZnO, in the BS of each grain grade increased with the decreasing grain grade. Cr2O3 was detected in BS1 and BS2; CuO was detected in BS1, BS4 and BS5 (content changes negligibly) and NiO was only detected in BS2. However, CdO, PbO and As2O3 were not detected in the BS of any grade.
The mass proportion of BS1 in the BS was 52.55 % (Table S1); the overall mass proportions of each chemical component in BS1 were >40 %. This finding indicated that the main occurrence of each chemical component was in the BS with a particle size of 850 μm and greater. The proportions of BaO, Fe2O3, ZnO and MnO in BS1 were 48.69 %, 50.74 %, 50.41 % and 51.07 % respectively, and the smallest proportions of BaO, Fe2O3, ZnO and MnO were found in BS4, i.e. only 11.09 %, 9.49 %, 10.27 % and 8.42 %, respectively.
In summary, the chemical composition of BS with different particle sizes was essentially identical, with SiO2, BaO, and SO3 being the predominant chemical components. The content of SiO2 decreased as particle size decreased while the content of BaO and SO3 increased. Additionally, larger particles had a higher proportion of SiO2 and a relatively small amount of Al2O3, TiO2, and P2O5 compared to smaller particles. CaO, Fe2O3, MgO, Na2O, K2O and other metal oxides with minor content showed a random distribution within each particle size range. A significant positive correlation was observed between BaO and SO3, suggesting a shared source for the two elements. Moreover, their concentrations increased with the increase of BS particle size.
3.1.3 Mineral composition analysis
The spectrogram of MBS (ungraded BS) shown in Fig. 2 demonstrates that the BS primarily contained quartz phase (SiO2) and barium-containing mineral phases in the form of BaSiO3, BaSO4, BaAl2Si2O8, BaS2O3H2O, etc. The elements in barite ore (e.g. Si, Al and Fe) primarily occurred in quartz, clay, sericite, and hematite that coexisted or were associated with them. These elements in the associated minerals formed barium-containing mineral phases, e.g. BaSiO3, BaAl2O4 and BaAl2Si2O8, in carbothermal reduction (Zhang et al., 2019). However, the low content of the heavy metals and the iron-containing phase were not detected in the XRD test of the BS.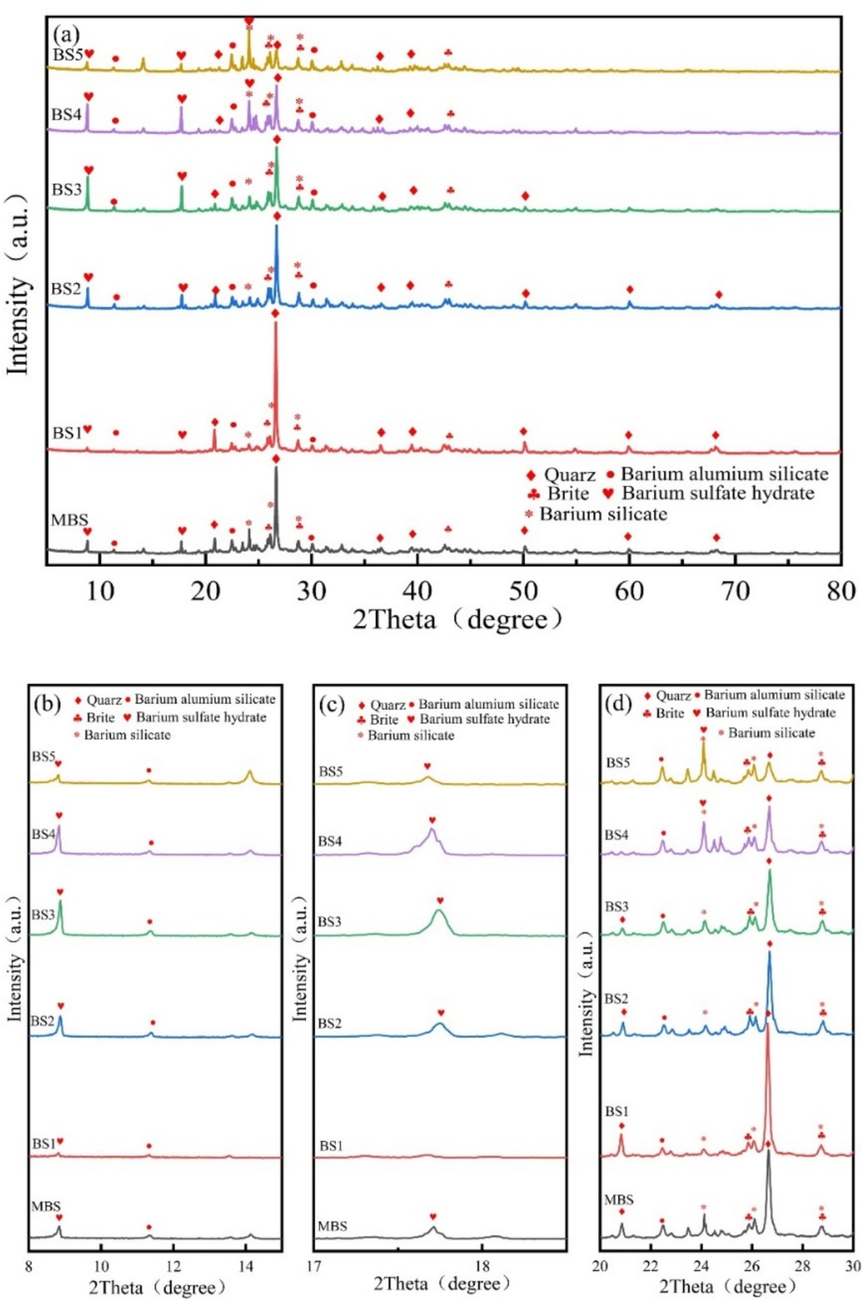
XRD contrast patterns of BS with different particle sizes. (a) XRD pattern of MBS and graded BS. (b)–(d) Amplification of the XRD patterns in 2θ.
Combined with the chemical composition test results for the BS (Table 2) and the XRD pattern analysis (Fig. 2), the XRD patterns of the BS at each particle size exhibited relative shifts in the characteristic diffraction peaks of SiO2 (BS1: 26.62°, BS2: 26.69°, BS3: 26.71°, BS4: 26.69° and BS5: 26.69°). The phenomenon of weakening (2θ = 20.84° and 26.66°) or even disappearance (2θ = 20.84°) of diffraction peaks was observed, and the smaller the particle size, the more pronounced this weakening and disappearance. The shift in the characteristic peak may have been caused by the displacement crystal transformation of the quartz phase in carbothermal reduction (Zhang et al., 2019), and the weakening and disappearance of the diffraction peak may have been caused by the solid-phase reaction between SiO2 and Ba, Al and Fe in the barite ore to form barium-containing silicate or silico-aluminate minerals. Smaller mineral particles exhibited higher surface activity, which facilitated solid-phase reactions; thus, smaller particle sizes led to more clear weakening and disappearance of the diffraction peaks.
As shown in Fig. 2, the characteristic peaks corresponding to the barium-containing mineral phases, e.g. BaSiO3, BaAl2Si2O8 and BaS2O3H2O, became stronger with increased peak sites as the grain size decreased, indicating that the reduction in the mineral particle size promoted formation of the barium-containing phases and contributed to the formation of other phases, thereby complicating the phase composition of the BS. Notably, no characteristic diffraction peaks corresponding to compound phases containing other heavy metals (Mn, Zn, Cu, Cr, Ni and As) or the water-soluble BaS compounds were observed in the XRD pattern. This could be due to the low content or poor crystallisation performance related to these minerals or they may have been encapsulated within other mineral phases.
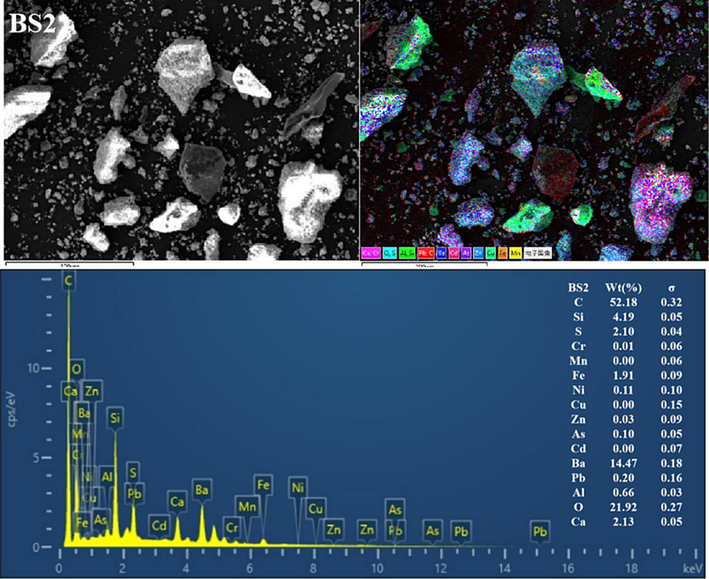
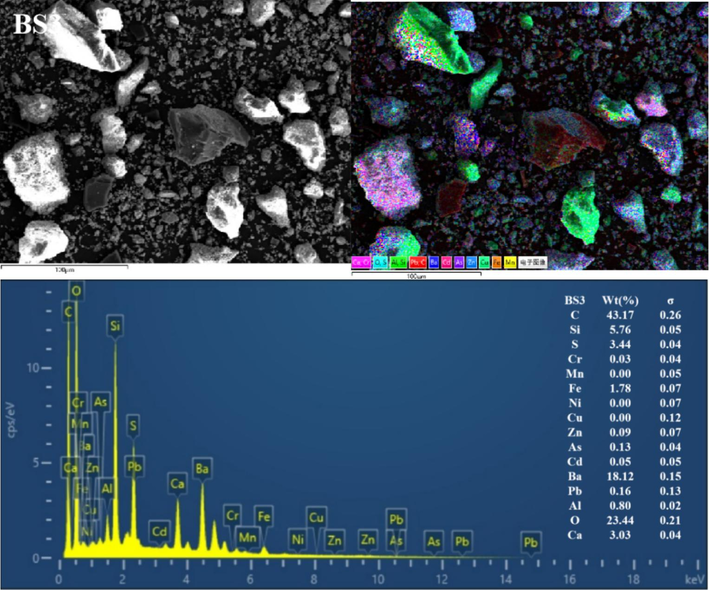
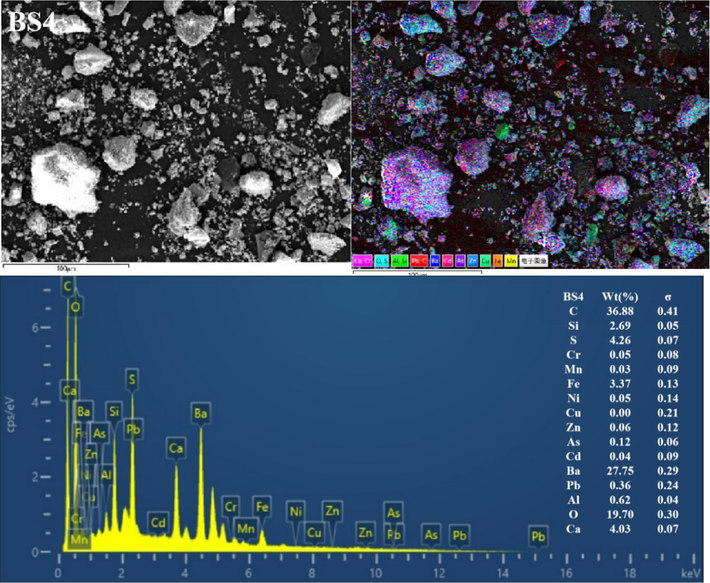
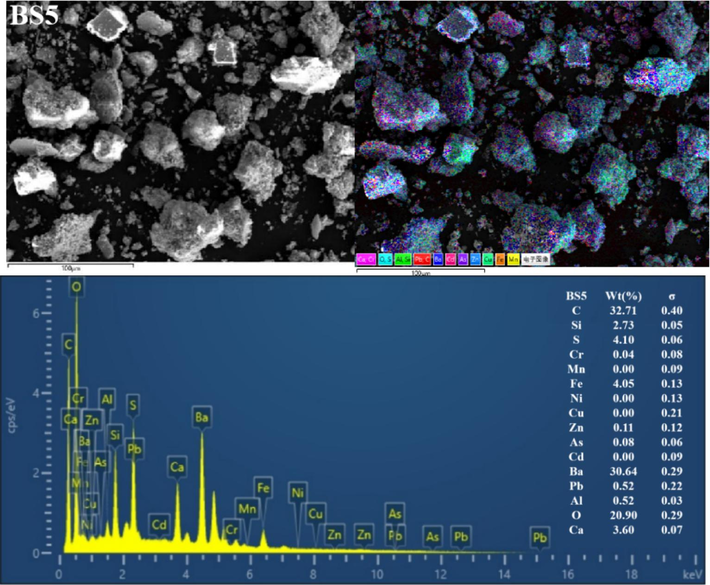
3.1.4 Morphological structure and element distribution analysis
The BSs of different particle sizes were further characterised using SEM-EDS (Fig. 3 and Figs S1–S5). Clearly, the mineral morphological and structural characteristics of the BS of different grain grades considerably differed. The particles exhibited irregular shapes and diverse surface structures. Coarse particles with distinct outlines were observed in the BS1 and BS2 grade samples, and fine particles were dispersed and attached to the surface. With increasing particle size, the fine particles gradually increased, more fine particles or particle aggregates adhered to the surface of the larger particles (and even formed a fine particle attachment layer) and the particle boundary gradually blurred. In addition, the BS particles in the BS4 and BS5 samples exhibited more irregular fine particle aggregates, and the distribution of the small and medium particle aggregates in BS5 was more uniform. Furthermore, the EDS all-element scan revealed that various elements in the BS of each particle grade were mixed with each other, indicating a complex particle composition. In addition, with decreasing particle size, the mixing phenomenon became more pronounced and the particle composition increased.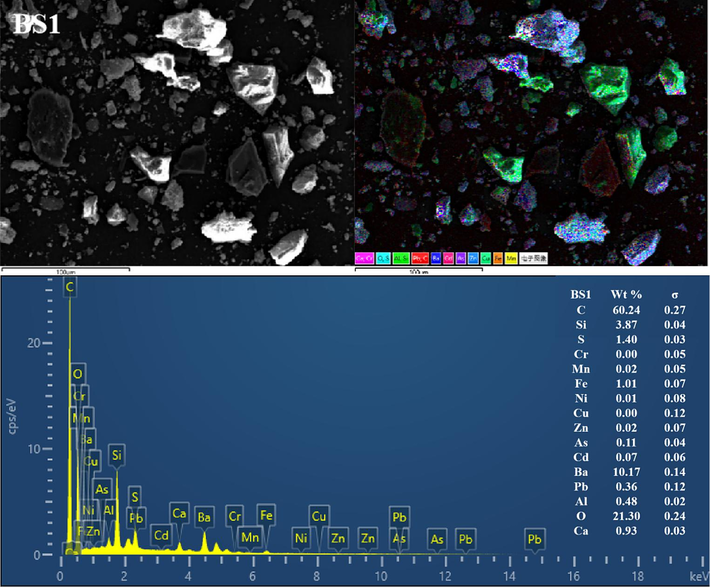
Representative SEM-EDS images (C, O, Al, Si, S, Ca, Cr, Mn, Fe, Ni, Cu, Zn, As, Cd, Ba and Pb) of the BSs.
Representative SEM-EDS images (C, O, Al, Si, S, Ca, Cr, Mn, Fe, Ni, Cu, Zn, As, Cd, Ba and Pb) of the BSs.
Representative SEM-EDS images (C, O, Al, Si, S, Ca, Cr, Mn, Fe, Ni, Cu, Zn, As, Cd, Ba and Pb) of the BSs.
Representative SEM-EDS images (C, O, Al, Si, S, Ca, Cr, Mn, Fe, Ni, Cu, Zn, As, Cd, Ba and Pb) of the BSs.
Representative SEM-EDS images (C, O, Al, Si, S, Ca, Cr, Mn, Fe, Ni, Cu, Zn, As, Cd, Ba and Pb) of the BSs.
EDS analysis showed significant variations in the contents of various elements in the BS. For example, the levels of C, Si, Ba and O were notably high, followed by those of S, Ca and Fe. In contrast, the levels of Al, Pb, Cd, As, Zn, Cu, Ni, Mn and Cr were lower (or undetected). In addition, clear correlations were observed in EDS single-element scanning between the following elements: Si and O; Ba and S; Ba S and O; Ca, S and O; Fe and O and Al, Si and O. Based on the XRD diffraction pattern in Fig. 2 and the XRF analysis data given in Table 2, the slag was inferred to contain quartz, aluminosilicate, hematite, sericite, BaSO4 and BaS.
The high C content was possibly caused by incomplete combustion of coal fuel during carbothermal reduction (Yang et al., 2021). The presence of BaS may be attributed to incomplete leaching in the water or reverse reaction in hydrolysis, resulting in amorphous precipitation. In addition, BaSO4 originated from unreacted barite residues (Agarwal, 2019; Zhang et al., 2019). The C and Si contents reduced with a decrease in BS size, dropping from 60.24 % and 3.87 % in BS1 to 32.71 % and 2.73 % in BS5, respectively. Conversely, the Ba, S, Fe and Ca contents gradually increased with decreasing particle size, dropping from 10.17 %, 1.4 %, 1.01 % and 0.93 % in BS1 to 30.64 %, 4.10 %, 4.05 % and 3.60 % in BS5, respectively. In addition, the O content remained constant at approximately 20 % in all analysed samples. A correlation analysis between Ba and S was conducted using EDS single-element scan data. According to this analysis, the BaS content increased with decreasing particle size.
In summary, the main minerals phases in BS were silicon oxide and barium sulfate, characterized by large particle sizes, well-defined outlines, and clear boundaries. Additionally, its surface was coated with irregular flocculent particles primarily composed of BaS, aluminosilicate, sericite, hematite, and various barium salt phases.
3.2 Total heavy-metal concentrations in BS
The heavy-metal content in each grain grade of the BS is shown in Table 3, and the overall proportion of heavy metals in the BS of different grain grades is shown in Table S3.
Heavy metal
≥850 μm (BS1)
425–850 μm (BS2)
150–425 μm (BS3)
75–150 μm (BS4)
<75 μm (BS5)
Average content
Mean
SD
Mean
SD
Mean
SD
Mean
SD
Mean
SD
Cu (mg/kg)
60.3
1.63
50.9
7.00 × 10⁻¹
54.6
2.20 × 10⁻¹
68.3
5.80 × 10⁻¹
93.1
6.65
62.8
Zn (mg/kg)
359
7.74
328
2.90
362
2.69
414
2.40
516
51.6
378
Pb (mg/kg)
10.1
2.50 × 10⁻¹
9.26
6.30 × 10⁻¹
5.62
9.00 × 10⁻²
6.52
1.20 × 10⁻¹
8.64
1.30 × 10⁻¹
8.90
Cr (mg/kg)
58.6
7.40 × 10⁻¹
53.5
5.30 × 10⁻¹
55.4
4.00 × 10⁻¹
57.7
4.10 × 10⁻¹
78.9
3.85
59.7
Cd (mg/kg)
3.32
6.00 × 10⁻²
3.01
4.00 × 10⁻¹
3.01
1.00 × 10⁻²
3.42
4.00 × 10⁻²
4.22
4.00 × 10⁻¹
3.35
Ni (mg/kg)
37.3
8.40 × 10⁻¹
33.5
4.00 × 10⁻¹
36.1
2.00 × 10⁻¹
41.5
2.40 × 10⁻¹
16.3
1.57
34.6
Fe (%)
2.15
1.00 × 10⁻¹
1.80
1.00 × 10⁻²
1.87
7.00 × 10⁻²
2.29
1.00 × 10⁻²
3.32
1.10 × 10⁻¹
2.21
Mn (mg/kg)
242
0.36
234
8.90 × 10⁻¹
229
6.54
238
3.90 × 10⁻¹
283
7.18
244
As (mg/kg)
24.8
0.05
21.1
1.80 × 10⁻¹
20.5
1.10 × 10⁻¹
26.7
1.30 × 10⁻¹
36.7
3.40 × 10⁻¹
25.3
Ba (%)
18.0
5.00 × 10⁻²
17.72
8.00 × 10⁻²
24.6
7.00 × 10⁻²
27.5
1.00 × 10⁻²
27.9
9.00 × 10⁻²
20.9
The contents of various heavy metals in the BS of different grain sizes considerably varied. For example, the Ba and Fe contents fluctuated in ranges of 18.02–27.93 % and 1.80–3.32 %, respectively, which were significantly higher than those of other heavy metals. In addition, the Zn and Mn contents fluctuated in ranges of 359.00–516.25 and 229.08–282.94 mg/kg, respectively. The Cu, Cr, Ni, As and Pb contents fluctuated in ranges of 50.93–93.06, 53.50–78.93, 16.33–41.48, 20.51–36.71 and 5.62–10.11 mg/kg, respectively. Notably, the Cd content did not exceed 5 mg/kg. Except for Pb, the distribution of heavy metals in the BS demonstrated a uniform pattern of obvious enrichment in the fine fraction and a random distribution in the other grades. The heavy-metal content was considerably higher in the BS with a particle size of <75 μm than in the other four fractions due to their larger surface area, increased number of surface-active sites and more abundant pore structure, which facilitated heavy--metal ion adsorption. During the carbothermal reduction process, low melting point metal compounds in barite ore first melted to form a liquid phase. This liquid phase served as a reaction medium for the continuation of the carbothermal reduction reaction in barite ore, thereby facilitating the reduction reaction. Additionally, the clinker generated through carbon thermal reaction underwent water quenching, resulting in vitrification and fine crystallization of the product to yield small-grained BS. Consequently, heavy metals predominantly resided within small-grained particles (Fazle Bari et al., 2020; Tang et al., 2021; Xu et al., 2021; Zhang et al., 2019; Zhu et al., 2020).
The mass proportion of BS1 in the BS was 52.55 % (Table S1), and the mass proportions of heavy metals in BS1 was 45.39–56.64 %, indicating that all heavy metals primarily existed in the BS with a particle size of 850 μm and above.
The content of heavy metals, e.g. Cd, As, and Zn, in the BS exceeded the screening value of soil pollution for various agricultural lands defined in the ‘Soil Environmental Quality Standard for Agricultural Land Soil Pollution Control Standard’ (GB15618-2018) (MEEC, 2018). In addition, Cd surpassed the soil risk control value for neutral and acidic agricultural lands stipulated in the standard, and Ba, Cu, Zn, Cd and As exceeded the background values of Guizhou soil (EPAC, 1990).
3.3 Geochemical evaluation
3.3.1 Leaching toxicity test results
The leaching toxicity test results of barium residue for each grade are presented in Table 4. Cd, Pb and Cu were undetected in the leaching solution of the BS with different grain sizes. The concentration of Cr in the leaching solution of BS1 was 3.76 μg/L; however, no Cr was detected in the other fractions. The concentrations of As in BS4 and BS5 were 1.22 and 1.89 μg/L, respectively; however, As was not detected in the other fractions. Zn and Ni were detected in the leaching solution of the BS with mean values of 227.4 and 5.198 μg/L, respectively. Notably, the most significant leaching toxic substance in the BS samples was Ba, and the extracted Ba contained both water-soluble barium sulphide and acid-soluble barium salts. The concentration range of Ba in the leaching solution for each particle grade was 590–699 mg/L, which exceeded the limit of 100 mg/L mentioned in the ‘Hazardous Waste Identification Standard for Leaching Toxicity Identification’ (HJ5085.3-2007). Thus, the BS was classified as hazardous waste. In addition, there was no significant difference in the concentration of barium ions in the leaching solution among different grain grades. Therefore, the risk properties of BS were concluded to remain unchanged with varying grain size. The leaching concentration of other heavy metals in each particle grade did not exceed the specifications in HJ5085.3-2007, and this concentration did not significantly vary with the different particle grades. In addition, there was little correlation between the concentration of the leaching solution and the particle grade of BS.
Number
Cu (μg/L)
Zn (μg/L)
Pb (μg/L)
Cr (μg/L)
Cd (μg/L)
Ni (μg/L)
As (μg/L)
Ba (mg/L)
BS1
<2.50
314
<4.20
3.76
<1.20
6.83
<1.00
690
BS2
<2.50
165
<4.20
<2.00
<1.20
5.24
<1.00
590
BS3
<2.50
222
<4.20
<2.00
<1.20
6.29
<1.00
643
BS4
<2.50
282
<4.20
<2.00
<1.20
3.77
1.22
699
BS5
<2.50
154
<4.20
<2.00
<1.20
3.86
1.89
600
Mean
–
227
–
–
–
5.20
–
644
3.3.2 Bioavailability analysis
The analysis results for heavy-metal bioavailability in the BS of each grain grade are presented in Fig. 4.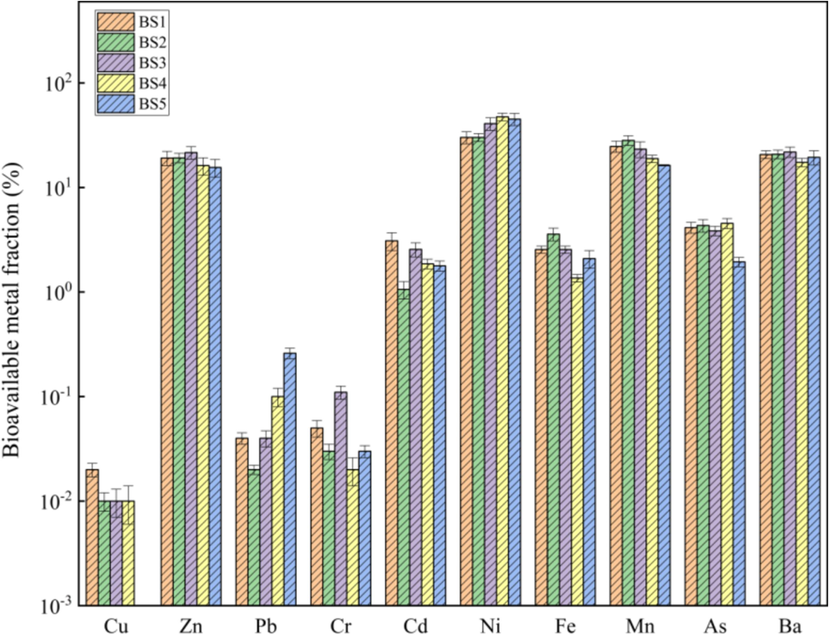
Bioavailable fractions of heavy metals in BS.
There were no significant differences in the bioavailability of the same heavy metals among the different grain grades. The bioavailability of Cu, Pb and Cr was relatively low (0–0.02 %, 0.02–0.26 % and 0.02–0.11 %, respectively), while that of Cd (1.06–3.09 %), Fe (1.36–3.58 %) and As (1.94–4.54 %) was slightly higher. Zn, Ni, Mn and Ba showed the highest bioavailability, reaching 15.56–21.58 %, 30.11–47.42 %, 16.31–28.20 % and 19.44–21.82 %, respectively. The potential migration abilities of Zn, Ni, Mn and Ba in BS in plants were clearly stronger than those of other heavy metals, indicating that Zn, Ni, Mn and Ba had strong enrichment ability in plants and could be absorbed by plants in large quantities. Thus, crops should not be planted around BS landfills. However, considering the high bioavailability of heavy metals, e.g. Zn, Ni, Mn and Ba, in BS for plants, phytoremediation can be considered a remediation and treatment technology for BS storage yards to reduce the environmental risks caused by the migration and diffusion of heavy metals, such as Zn, Ni, Mn and Ba, into the environment surrounding BS landfills(Carvalho et al., 2019; Han et al., 2020; Lu et al., 2019; Ribeiro et al., 2018; Viana et al., 2021a; Viana et al., 2021b).
The average Ba content in BS reached 20.86 %, which far exceeded the contents of Zn, Ni, Mn and other heavy metals. However, there was no significant difference in the bioavailability between Ba and these three heavy metals. It was indicated that the content characteristics of heavy metal bioavailability components in BS were not only closely related to their total amount, but also affected by the physical and chemical properties of the environment. BS occurred in various forms, and the dissolution and migration properties of different barium-containing compounds were related to the acidity or alkalinity of the solution system. Under the tested pH value of the extraction solution tested for bioavailability (∼7.3), it was nearly impossible for both acid-soluble and -insoluble barium compounds to dissolve and migrate. Thus, the bioavailability of Ba in the BS did not differ significantly from that of Zn, Ni and Mn. The bioavailability of heavy metals in BS was related to its total amount and was affected by its form of occurrence. Notably, the pH conditions of the surrounding environment may change the solubility and migration of Ba in BS, which must be considered.
3.3.3 Bioaccessibility analysis
The bioaccessibility of heavy metals in the BS obtained through PBET in vitro simulation experiments is shown in Figs. 5 and 6.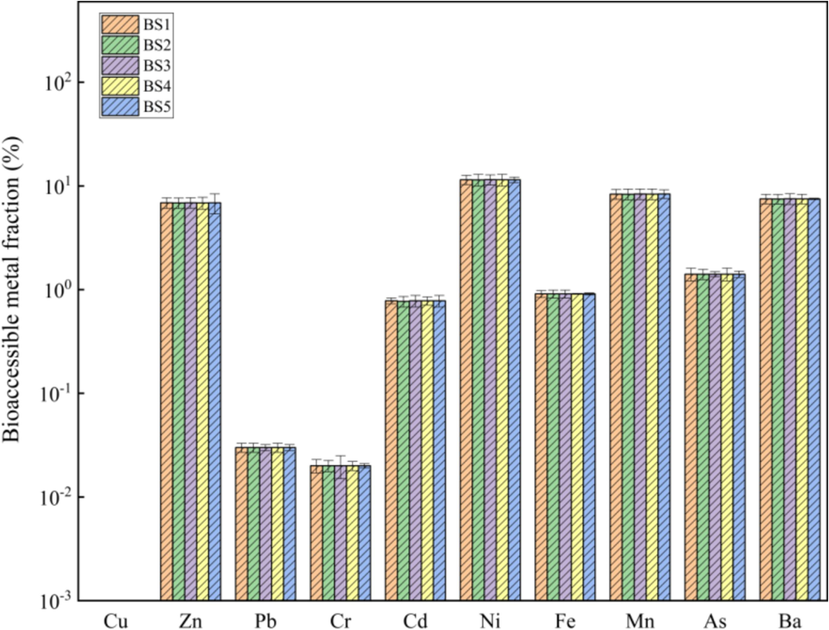
Bioaccessible fractions of heavy metals in the gastric phase.
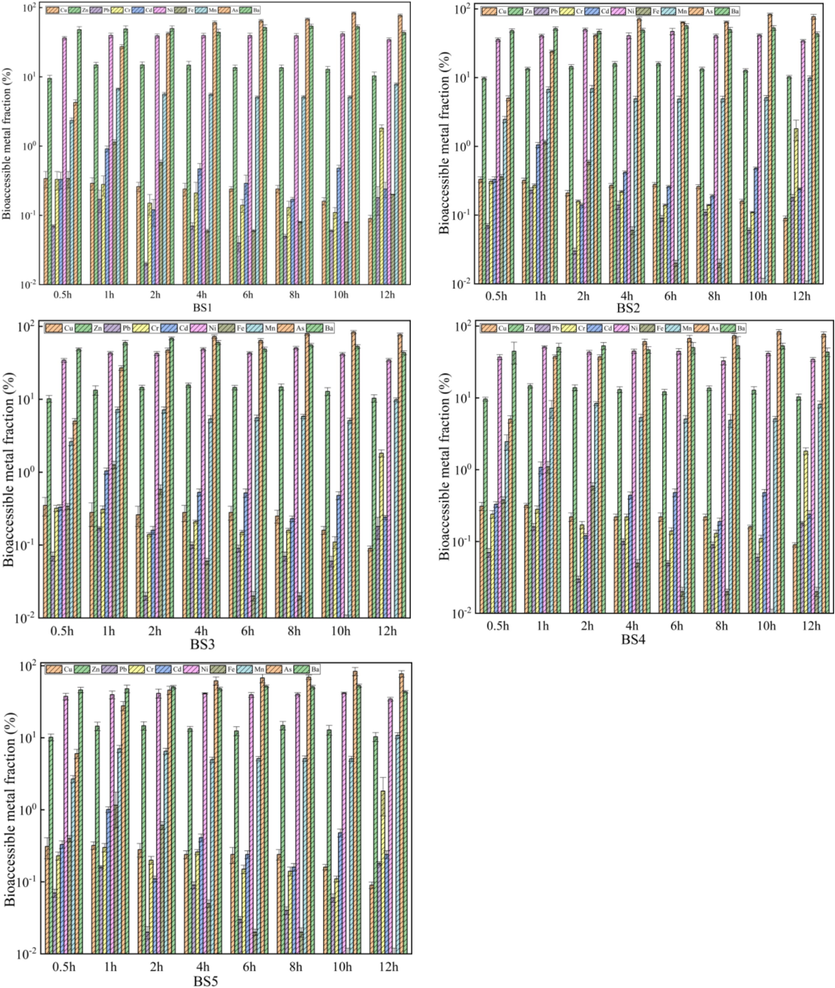
Bioaccessible fractions of heavy metals in the gastrointestinal phase.
There was no significant difference in the bioaccessibility of the same heavy metal in the GP among the BSs of different grain grades. The bioaccessibility of Zn, Ni, Mn and Ba was 6.86–6.89 %, 11.45–11.50 %, 8.33–8.37 % and 7.49–7.52 %, respectively. In addition, the bioaccessibility of Cd, Fe and As was approximately constant in BSs of different grain grades at approximately 0.77 %, 1.36 % and 1.41 %, respectively. The bioaccessibilities of Pb and Cr were <0.05 %, and Cu was essentially insoluble in the GP. The mean bioaccessibility of heavy metals in the GP of BS was in the order of Ni > Mn > Ba > Zn > As > Fe > Cd > Pb > Cr > Cu. Clearly, different heavy metals, such as Ni, Mn, Ba and Zn, were relatively easily absorbed by the human body through the stomach, and the possibility of Pb, Cr and Cu being absorbed was very low. The protease in the gastric digestive environment was concluded to have a significant impact on the solubility of heavy metals. Here, the heavy metals formed metalloproteins with proteins, which helped the metal ions maintain their solubility. In addition, the acidic environment of the gastric fluid was conducive to improving the activity of protease, thereby promoting the formation and aggregation of GP metalloproteins to a certain extent as well as enhancing their dissolution and diffusion in the GP digestive fluid. No significant difference was observed in the bioaccessibility of metals in the GP among the five BS grades. The BAM2 value for all heavy metals in the GP was <15 %. Based on the risk classification evaluation of the BAM2 value, it was identified that the GP bioaccessibility of heavy metals in the BS posed low risk.
Fig. 6 showed that the GIP bioaccessibility of the same heavy metal in the BS at the GIP stage substantially changed over time. Herein, the gastrointestinal bioaccessibility of As was the most prominent, being higher than that of other heavy metals, and increase became more clear over time. Additionally, Zn, Ni, Mn, and Ba were also easily absorbed by the human GIP, and their GIP bioaccessibility was generally high and sustained over time with order of As > Ba > Ni > Zn > Mn. The bioaccessibility of Pb, Cr, and Cd exhibited a continuous increase over time, while that of Cu and Fe gradually declined until Fe reached zero. This might be due to the increase in pH from 1.1 to 7.3 during digestion in the stomach and small intestine, thereby resulting in the precipitation of Fe, Cu, and other heavy metals dissolved in the gastric juice in the small intestine and being re-deposited. Simultaneously, the pH environment of the intestinal fluid was not conducive to the formation of metalloproteinases. The metals adsorbed on the surface of pepsin only based on their charge were easily hydrolysed and precipitated after entering the intestinal phase, which reduced the GIP bioaccessibility.
These results revealed that in the GP and GIP stages, the bioaccessibility of Ni, Mn, Ba and Zn in the BS was relatively high; however, despite its high total content, the bioaccessibility of Fe was relatively low and even decreased to zero with the decreasing particle size. In addition, the bioaccessibility of As, with a low total content, continued to increase from the GP to the intestinal phase. The proportion of heavy metals in the BS that could be absorbed after entering the human digestive system varied, suggesting that multiple factors contribute to difference in the bioaccessibility of heavy metals in barium residue. Notably, the bioaccessibility of heavy metals in the BS was <100 %, indicating incomplete absorption during digestion and potentially overestimating negative health risks when assessing population health based on the full values of heavy metals(Xu et al., 2021).
3.3.4 Potential migration analysis
The heavy-metal pollution of BS was related to the total amount of heavy metals and was affected by the activity, solubility and curing degree of each element. The occurrence forms of heavy metals in the BS for each grain grade obtained using the BCR sequential extraction method are presented in Fig. 7. Mn, Ba, Fe and Ni primarily occurred in the form of a weak-acid soluble fraction in the BS with average proportions of 78.08 %, 64.75 %, 50.13 % and 43.78 %, respectively, followed by the reducible form with average proportions of 13.26 %, 23.53 %, 29.14 % and 24.24 %, respectively. The average occurrence proportions of the oxidisable forms of Mn, Ba, Fe and Ni were 3.45 %, 3.31 %, 12.25 % and 12.14 %, respectively, and those of the residual forms were 5.21 %, 5.41 %, 8.47 % and 19.84 %, respectively. These results indicated that heavy metals such as Mn, Ba, Fe and Ni in BS were extremely easy to release and could migrate and pollute the surrounding ecological environment under weak acid conditions. In addition, Cu and Cr primarily occurred in residual form, with average proportions of 53.40 % and 52.34 %, respectively. The average proportions of the oxidisable forms of Cu and Cr were 39.84 % and 18.65 %, respectively, and those of the reducible forms of Cu and Cr were 6.75 % and 24.83 %, respectively. Notably, 0 % and 4.17 % of Cu and Cr occurred in the weak-acid soluble form, indicating that Cu and Cr in BS primarily exist as insoluble salts that are difficult to release and migrate, thereby making them relatively stable in the natural environment with negligible pollution risk to the surrounding environment. In addition, Zn, Pb, Cd and As primarily occurred in the reducible form with average proportions of 61.95 %, 58.19 %, 75.16 % and 45.86 %, respectively, as well as in the oxidisable form with average proportions of 8.38 %, 10.37 %, 10.33 % and 36.56 %, respectively. The average proportions of the residual form of Zn, Pb, Cd and As were 12.30 %, 31.34 %, 14.51 % and 17.57 %, respectively, and those of the weak-acid soluble form of Zn, Pb, Cd and As were 17.38 %, 0.02 %, 0 % and 0 %, respectively. These findings indicated that Zn, Pb, Cd and As in BS were released, transported and inter-transformed through precipitation or chelation with organic matter in reducible or oxidisable environment, which posed pollution risks.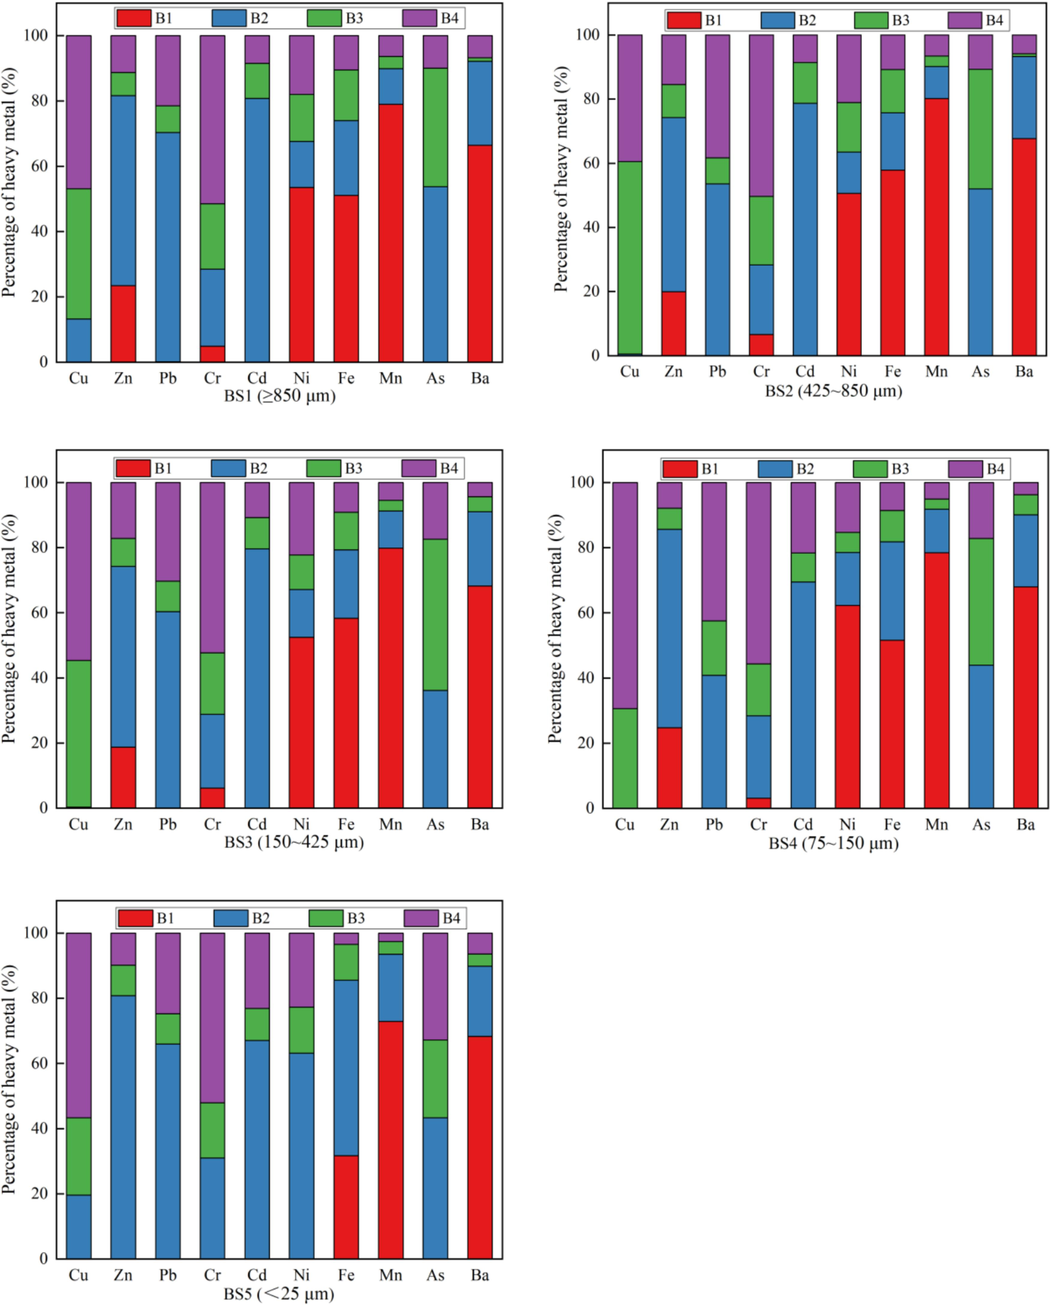
Chemical fraction distribution of heavy metals in BS.
The RAC value of heavy metals in the BS is presented in Fig. 8. The risks associated with heavy metals such as Zn, Ni, Fe, Mn and Ba were high. The RAC values of Mn and Ba in each grade BS were >50 %, which represented a very high ecological risk. In addition, Ni and Fe were classified as very high ecological risks in BS1, BS2, BS3 and BS4 but were classified as no ecological risks and high ecological risks in BS5, respectively. Cr posed a low ecological risk in BS1, BS2, BS3 and BS4; however, Cr was found to pose no ecological risk in BS5. Cu, Cd and As had no ecological risk in the BS and did not pose migration risk; thus, attention should be paid to the ecological risks that may arise from the migration of Mn, Ba, Ni and Fe in BS during storage.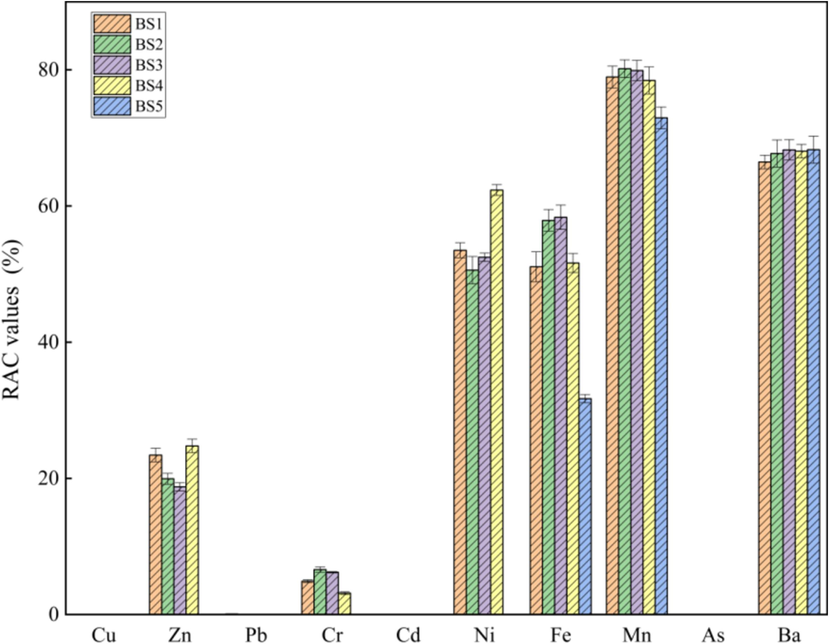
Calculated RAC values of the studied heavy metals in BS.
3.4 Comprehensive analysis of the existing forms and environmental risks of heavy metals in BS
The experimental process, analysis methods and results in this paper are summarized in Fig. 9 and further elucidate the characteristics of heavy metal leaching from BS and its environmental impact.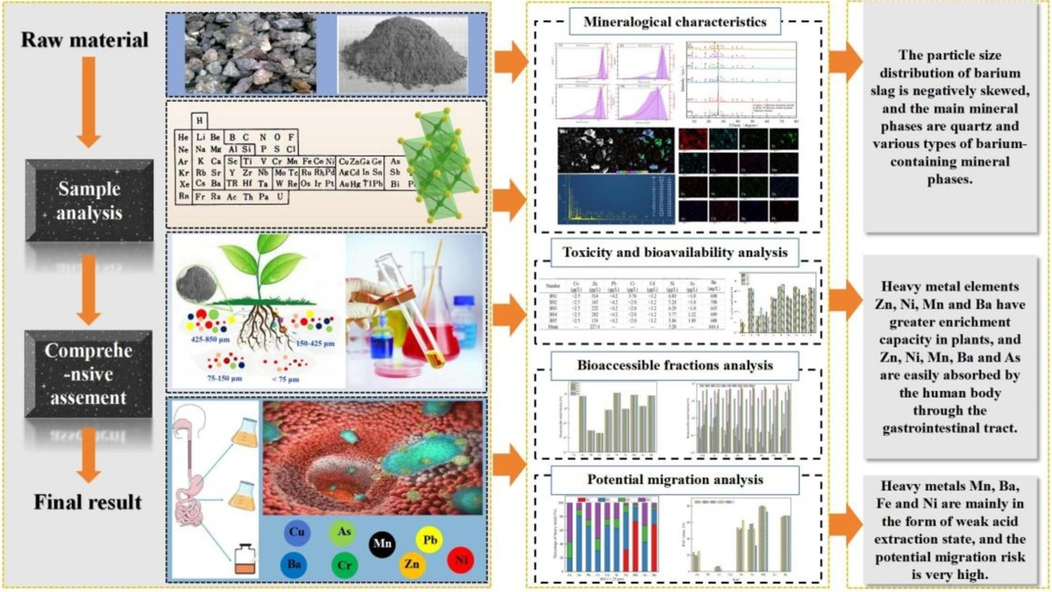
Comprehensive analysis chart of the existing forms and environmental risks of heavy metals in BS.
According to the mineralogical and geochemical characteristics shown in the figure, quartz and barium-containing mineral phases were identified as the primary constituents of BS. Heavy metal elements were predominantly found in BS particles with a size smaller than 75 μm. Among them, the concentrations of Cu, Zn, Cd, and As were detected at levels exceeding the background value of Guizhou soil, while the concentrations of Cd, As, and Zn surpassed the soil pollution control index value for various agricultural lands and Cd exceeded the soil risk control value.
The geochemical evaluation results of BS, as depicted in the figure, clearly indicated that Ba was the most significant leaching toxic substance, whose concentration in the leaching solution of all particle sizes exceeded the standard significantly, classifying it as hazardous waste. There was no significant difference in bioavailability and bioaccessibility of the same heavy metals in BS. Their bioavailability was less than 100 %, and the order of bioavailability was As > Ba > Ni > Zn > Mn. Among them, Ni, Mn, Ba, and Zn were relatively easily absorbed by the human body through gastrointestinal tract exposure, with an evident increase over time. The presence of Ba, and Zn, Ni, and Mn in BS was primarily observed in the forms of weak acid extraction. In acidic or weakly acidic environments, their potential migration to plants was significantly stronger compared to other heavy metals. The ease of release and migration poses a potential risk for polluting the surrounding ecological environments, thus indicating a high potential environmental hazard. Therefore, planting crops around a BS yard was not advisable. However, phytoremediation could be considered as a remediation and treatment technology for such yards to mitigate environmental risks associated with migration and diffusion of heavy metals like Zn, Ni, Mn, and Ba into surrounding ecosystems.
4 Conclusion
The proportion of BS with a particle size >850 μm exceeded 50 %, while the remaining particles exhibited a negatively skewed distribution. The morphology of BS was irregular, and its surface structures were highly diverse, resulting in limited sorting ability. The primary mineral phases present in BS included silica phase SiO2 and various barium-containing minerals such as BaSiO3, BaSO4, BaAl2Si2O8, BaS2O3H2O, BaSO4, and BaS. Among them, water-soluble BaS was predominantly found in the fine particle size fraction of BS.
The heavy metal elements Ba, Fe, Zn, Mn, Cu, Cr, Ni, As, Pb and Cd were predominantly concentrated in BS with a particle size less than 75 μm. The toxic leaching test of BS revealed Cr, As, Zn, Ni, and Ba were present in the leaching solution, and Ba was identified as the most significant leaching toxic substance. Mn, Ba, Fe, and Ni in BS were primarily in the form of weak acid extraction, posing a significant potential risk for migration. Therefore, it was essential to pay more attention to the ecological and environmental risks associated with these four elements during the storage process of BS.
The disparity in bioavailability and bioaccessibility of heavy metals among BS samples with varying particle sizes was not significant. Although the concentration of Zn, Ni, and Mn in BS was relatively low, they were easily enriched in plants and their accumulation were comparable to that of high concentrations of Ba. Therefore, it was not advisable to cultivate crops near the BS dump. The bioavailability of heavy metals in BS was found to be less than 100 %. Among these metals, As, Ni, Mn, Ba and Zn were observed to have relatively high absorption rates through the gastrointestinal tract in the human body. Furthermore, there was a noticeable increase in their absorption with prolonged exposure time. The order of bioavailability was determined as follows: As > Ba > Ni > Zn > Mn.
CRediT authorship contribution statement
Chengbing Fu: Writing – original draft, Visualization, Methodology, Investigation, Funding acquisition, Formal analysis. Yu Zhang: Writing – review & editing, Supervision, Methodology, Funding acquisition, Data curation. Juan Tian: Validation, Investigation, Funding acquisition. Wenxing Chen: Software, Investigation, Data curation. Hongyan Pan: Resources, Methodology, Funding acquisition. Jianxin Cao: Writing – review & editing, Resources, Project administration, Methodology, Conceptualization.
Acknowledgements
This work was supported by the Special Funds for Innovation Construction of Scientific Research Institutions of Guizhou (No. [2022]002), the Tongren City Science and Technology Plan Project (No. [2021]12), the Natural Science Foundation of China (No. 22366009) and the Guizhou Province Outstanding Young Scientific and Technological Talents Program (No. YQK2023007).
Declaration of competing interest
The authors declare that they have no known competing financial interests or personal relationships that could have appeared to influence the work reported in this paper.
References
- Waste management of residual black ash in barium industries. Mater. Today Proc.. 2019;18:4810-4815.
- [CrossRef] [Google Scholar]
- Geochemical behavior and environmental risks related to the use of abandoned base-metal tailings as construction material in the upper-Moulouya district, Morocco. Environ. Sci. Pollut. Res.. 2016;23:598-611.
- [CrossRef] [Google Scholar]
- Phytoremediation of barium-affected flooded soils using single and intercropping cultivation of aquatic macrophytes. Chemosphere. 2019;214:10-16.
- [CrossRef] [Google Scholar]
- Existent forms and ecological risk assessment of uranium and heavy metals in soil at a uranium mining area in northern Guangdong, China. J. Radioanal. Nucl. Chem.. 2023;332:1805-1814.
- [CrossRef] [Google Scholar]
- The leaching mechanism of heavy metals (Ni, Cd, As) in a gasification slag during acidification. Waste Manag.. 2020;114:17-24.
- [CrossRef] [Google Scholar]
- EPAC, 1990. Background values of soil elements in China Background (Beijing, China).
- EPAC, 2007a. Identification standards for hazardous waste-Identification for extraction toxity (GB 5085.3-2007) (Beijing, China).
- EPAC, 2007b. Solid waste-Extraction procedure for leaching toxicity-Sulphuric acid nitric acid method (HJ-T299-2007) (Beijing, China).
- Geochemical fractionation and mineralogy of metal(loid)s in abandoned mine soils: Insights into arsenic behaviour and implications to remediation. J. Hazard. Mater.. 2020;399:123029.
- [CrossRef] [Google Scholar]
- Non-hazardous Treatment for Barium Slag Using Phosphogypsum. Waste Biomass Valoriz.. 2019;10:3157-3161.
- [CrossRef] [Google Scholar]
- Review on treatment and utilization of barium slag in China. J. Environ. Manage.. 2023;325:116461
- [CrossRef] [Google Scholar]
- Increasing phosphate sorption on barium slag by adding phosphogypsum for non-hazardous treatment. J. Environ. Manage.. 2020;270:110823
- [CrossRef] [Google Scholar]
- Dissolution behavior of DTPA-promoted barium slag and synthesis of submicron BaSO4 particles. J. Clean. Prod.. 2022;362:132482
- [CrossRef] [Google Scholar]
- Leaching law of barium ion in wastage containing barium. Environ. Pollut. Cont.. 2001;23(98–100):104.
- [CrossRef] [Google Scholar]
- Mushroom residue modification enhances phytoremediation potential of Paulownia fortunei to lead-zinc slag. Chemosphere. 2020;253:126774
- [CrossRef] [Google Scholar]
- Potentially toxic metals and the risk to children's health in a coal mining city: an investigation of soil and dust levels, bioaccessibility and blood lead levels. Environ. Int.. 2020;141:105788
- [CrossRef] [Google Scholar]
- Synergistic use of electrolytic manganese residue and barium slag to prepare belite- sulphoaluminate cement study. Constr. Build. Mater.. 2022;326:126672
- [CrossRef] [Google Scholar]
- Using hazardous barium slag as a novel admixture for alkali activated slag cement. Cem. Concr. Compos.. 2022;125:104332
- [CrossRef] [Google Scholar]
- Management of mineral processing tailings and metallurgical slags of the Congolese copperbelt: environmental stakes and perspectives. J. Clean. Prod.. 2019;210:1406-1413.
- [CrossRef] [Google Scholar]
- Charcoal ash leachate and its sparingly soluble residue for acid mine drainage treatment: waste for pollution remediation and dual resource recovery. J. Clean. Prod.. 2021;320:128717
- [CrossRef] [Google Scholar]
- Lei, G., Dan, H., Maosheng, Z., Lin, J., Chao, P., 2020. Bioaccessibility of lead in soil based on chinese gastrointestinal digestion. Res. Environ. Sci. 33, 2430-2436 (In Chinese). 10.13198/j.issn.1001-6929.2020.03.12.
- Plant metal concentrations in Theobroma cacao as affected by soil metal availability in different soil types. Chemosphere. 2021;262:127749
- [CrossRef] [Google Scholar]
- Li, L., Yuejie, W., 2020. Risk assessment methods based on metal speciation analysis and its application in waste catalyst. Safety Health Environ. 20, 33-39(In Chinese). 10.3969/j.issn.1672-7932.2020.09.008.
- Li, X., Anxiang, L., Jihua, W., Yang, L., 2017. Research methods and applications of bioaccessibility and bioavailability of heavy metals in. Asian J. Ecotoxicol. 12, 89-97 (In Chinese). 10.7524/AJE.1673-5897.20160707001.
- Leaching of heavy metals and barium from forest roads reinforced with fly ash. Silva Fenn.. 2019;53
- [CrossRef] [Google Scholar]
- Development of a DTPA soil test for zinc, iron, manganese, and copper1. Soil Sci. Soc. Am.. 1978;42:421-428.
- [Google Scholar]
- Acidic leaching of potentially toxic metals cadmium, cobalt, chromium, copper, nickel, lead, and zinc from two Zn smelting slag materials incubated in an acidic soil. Environ. Pollut.. 2018;238:359-368.
- [CrossRef] [Google Scholar]
- Assessment of the Tessier and BCR sequential extraction procedures for elemental partitioning of Ca, Fe, Mn, Al, and Ti and their application to surface sediments from Chinese continental shelf. Acta Oceanol. Sin.. 2018;37:22-28.
- [CrossRef] [Google Scholar]
- Barium concentration, phytoavailability, and risk assessment in soil-rice systems from an active barium mining region. Appl. Geochem.. 2019;106:142-148.
- [CrossRef] [Google Scholar]
- MEEC, 2018. Environmental Quality Standard for Soils (GB15618-2018) (Beijing, China).
- MEPC, 2015. Soldi Waste-Determination of metals-Inductively coupled plasma mass spectrometry (HJ 766-2015) (Beijing, China).
- Bacterial leaching of critical metal values from Polish copper metallurgical slags using Acidithiobacillus thiooxidans. J. Environ. Manage.. 2019;236:436-445.
- [CrossRef] [Google Scholar]
- Heavy metals and arsenic in an abandoned barite mining area: ecological risk assessment using biomarkers. Environ. Forens.. 2023;24:164-175.
- [CrossRef] [Google Scholar]
- Improvement of the BCR three step sequential extraction procedure prior to the certification of new sediment and soil reference materials. J. Environ. Monit.. 1999;1:57-61.
- [CrossRef] [Google Scholar]
- Selection of plants for phytoremediation of barium-polluted flooded soils. Chemosphere. 2018;206:522-530.
- [CrossRef] [Google Scholar]
- Rui, Z., Chao, P., Mao-sheng, Z., Lin, J., Dan, H., Dan, Z., 2019. Study on arsenic bioaccessibility in soil based on Chinese gastrointestinal digestion. China Environ. Sci. 39, 235–242 (In Chinese). doi:10.3969/j.issn.1000-6923.2019.01.027.
- Residual and ecological risk assessment of heavy metals in fly ash from co-combustion of excess sludge and coal. Sci. Rep.. 2021;11:2499.
- [CrossRef] [Google Scholar]
- Validation of an in situ solidification/stabilization technique for hazardous barium and cyanide waste for safe disposal into a secured landfill. J. Environ. Manage.. 2010;91:1821-1830.
- [CrossRef] [Google Scholar]
- In situ barium phytoremediation in flooded soil using Typha domingensis under different planting densities. Ecotoxicol. Environ. Saf.. 2021;210:111890
- [CrossRef] [Google Scholar]
- Effect of planting density of the macrophyte consortium of Typha domingensis and Eleocharis acutangula on phytoremediation of barium from a flooded contaminated soil. Chemosphere. 2021;262:127869
- [CrossRef] [Google Scholar]
- Research on pollution characteristics and resource utilization risk of barium slag. J. Environ. Eng. Technol.. 2016;6:170-174.
- [CrossRef] [Google Scholar]
- An inter-laboratory trial of the unified BARGE bioaccessibility method for arsenic, cadmium and lead in soil. Sci. Total Environ.. 2011;409:4016.
- [CrossRef] [Google Scholar]
- Current knowledge from heavy metal pollution in Chinese smelter contaminated soils, health risk implications and associated remediation progress in recent decades: a critical review. J. Clean. Prod.. 2021;286:124989
- [CrossRef] [Google Scholar]
- The potential environmental risk implications of heavy metals based on their geochemical and mineralogical characteristics in the size-segregated zinc smelting slags. J. Clean. Prod.. 2021;315:128199
- [CrossRef] [Google Scholar]
- Froth flotation separation of carbon from barium slag: recycling of carbon and minimize the slag. Waste Manag.. 2021;120:108-113.
- [CrossRef] [Google Scholar]
- Comparison of the fixation of heavy metals in raw material, clinker and mortar using a BCR sequential extraction procedure and NEN7341 test. Cem. Concr. Res.. 2008;38:675-680.
- [CrossRef] [Google Scholar]
- Thermodynamic and kinetics study of carbothermal reduction of barite. J. Chem. Eng. Jpn.. 2019;52:478-483.
- [CrossRef] [Google Scholar]
- Distribution characteristics and comparison of chemical stabilization ways of heavy metals from MSW incineration fly ashes. Waste Manag.. 2020;113:488-496.
- [CrossRef] [Google Scholar]
Appendix A
Supplementary data
Supplementary data to this article can be found online at https://doi.org/10.1016/j.arabjc.2024.106074.
Appendix A
Supplementary data
The following are the Supplementary data to this article:Supplementary Data 1
Supplementary Data 1


