

Translate this page into:
Modified physical properties of Ni doped ZnO NPs as potential photocatalyst and antibacterial agents
⁎Corresponding author at: Institute of Chemistry, university of Sagodha, Sargodha 40100, Pakistan. abubakar.siddique@uos.edu.pk (Abu Bakar Siddique) abubakar054@gmail.com (Abu Bakar Siddique)
-
Received: ,
Accepted: ,
This article was originally published by Elsevier and was migrated to Scientific Scholar after the change of Publisher.
Peer review under responsibility of King Saud University.
Abstract
Hazardous organic dyes, present in the effluents of industries, are continuously polluting the environment. Photodegradation of these dyes on catalyst surface under sunlight irradiation is economic, safe and suitable strategy to protect environment. Hence, the synthesis and applications of Zn1-xNixO (x = 0.00, 0.02, 0.04, 0.06) NPs are reported here. Effect of pH and dopant concentration was studied to modify the electrical, magnetic, antibacterial and photocatalytic properties of Ni doped ZnO NPs. The samples were characterized by Scanning electron microscopy (SEM), Powder X-ray diffraction (XRD), UV–Visible spectroscopy (UV–Vis.), Energy-dispersive X-ray spectroscopy (EDS) and Fourier-transform infrared spectroscopy (FTIR) to determine the morphology, crystallite structure, optical properties, elemental composition and functional group detection, respectively. LCR meter and VSM were used to evaluate the dielectric properties and magnetic properties of Ni doped ZnO NPs, respectively. XRD pattern confirmed the presence of hexagonal wurtzite geometry of ZnO NPs. The structural and morphological analysis showed the increase in crystallinity with little effect on shape of doped NPs by increasing the dopant concentration and slight increase of pH. It was observed that the Ni doped ZnO NPs possess good photocatalytic potential by 94% degradation of 20 ppm solution of methyl orange dye (MO) in just 80 min under sunlight. Moreover, the enhancement in antibacterial potential was also observed with increase in dopant concentration and decrease in crystallite size of doped ZnO NPs. Smaller size NPs were found more effective against gram negative bacterial strains.
Keywords
Photodegradation
Dielectric properties
ZnO NPs
Antibacterial activity

1 Introduction
Water is an essential need of life on earth. It is being continuously polluted due to anthropogenic sources. Among the most devastating human activities, effluents of industries are major contributors of aquatic and air pollution. Textile dyes are substantially polluting the fresh water reservoirs in terms of their effect on biochemical and chemical oxygen demand (BOD and COD) value of water (Ma et al., 2023, Vikal et al., 2023). These dyes can cause mutations in the genome of aquatic organisms, inhibit photosynthesis and may become part of food chain. Being highly toxic and carcinogenic, there must be an effective strategy to remove or lower the concentration of these hazardous dyes in water reservoirs (Lellis et al., 2019, Nguyen et al., 2020). Among hazardous dyes, MO is believed to be highly toxic in terms of its effects on plant growth and gastrointestinal deceases in human being. It may also cause genetic mutations, hypersensitivity, allergy and intestinal cancer. Therefore, its removal must be ensured before mixing the effluents with fresh water (Kishor et al., 2021).
Numerous strategies have been reported to curtain the side effects of hazardous dyes such as adsorption (Zhong et al., 2023), reverse osmosis (Nataraj et al., 2009), thermal degradation (Habib et al., 2022) and ion-exchange chromatography (Joseph et al., 2020). All these procedures have some limitations i.e., cost, slow, less robust and thermal pollution. Apart from these traditional methods, photodegradation of dyes under sunlight irradiation has emerged as promising strategy (Luu et al., 2023).
Among nano catalysts, Zinc oxide NPs (ZnO NPs) is a novel n-type semiconductor material having a large exciton binding energy of 60 meV, a vast band gap of 3.3 eV, high electron mobility, and high melting point (Lal et al., 2022). Moreover, these properties can be further improved by the introduction of transition metal dopants which alters the band gap and substantially modify the electrical and magnetic properties (Jabbar et al., 2022). Photocatalytic efficiency of nano catalysts can be enhanced many times by mixing of appropriate dopant, its concentration and controlling the reaction pH (Badawi et al., 2022, Zaman et al., 2023). Moreover, modified ZnO NPs can also be utilized as dilute magnetic semiconductors (DMSs) which are emerging materials having diverse applications in fields of optoelectronics, biological imaging and ferromagnetism (Gopalakrishnan et al., 2022). Recently, doped ZnO nanomaterials have emerged as good catalysts. One of the dopants which can be used to alter the properties is Ni2+. The catalytic properties of Ni doped ZnO nanoparticles can be improved by optimizing the synthesis method and the doping concentration (Dhiman et al., 2023). Among the dopants, Ni2+ is favorable to incorporate into the ZnO lattice due to its same valence state (+2) and similar ionic radii (Ni2+, 0.69 oA; Zn2+, 0.74 oA) (Naskar et al., 2020). Therefore, current work has been designed to prepare Ni doped ZnO NPs to evaluate the efficacy for various applications.
Multidrug-resistant (MDR) bacteria are posing major threat to survival of healthy life on earth. It has been predicted that bacteria will cause around 10 million deaths by 2050 due to resistance developed against various antibiotics. Therefore, this issue needs to be immediate attention (Naskar et al., 2020). Several strategies have been developed to combat this issue, like combination of antibiotics, bacterial antibodies and nanoparticles (Siddique et al., 2022, Zaman et al., 2023). Among NPs, ZnO nanostructures are one of the five zinc compounds approved by the U.S. Food and Drug Administration (21CFR182.8991) as a safe antibacterial agent (Naskar et al., 2016). Selective antibacterial agents and minimal toxic to normal cells, ZnO based NPs are considered to be a suitable substitute of antibiotics to control the growth of resistant microbes (Sirelkhatim et al., 2015). These NPs are can easily cross the membrane barriers of bacteria and hinder the growth either by inactivating the proteins or producing the reactive oxygen species in the cell (Raha and Ahmaruzzaman 2022). Moreover, these NPs can also cause death of several bacterial strains due to their possible interaction with genetic material inside the cell (Alshameri and Owais 2022, Vikal et al., 2023, zaman et al., 2022). The activity of ZnO NPs is majorly dependent on the size of particles, capping agent and dopant. It has been observed that the doping of Ni increases the efficacy of these antibacterial agents but little attention has been given previously to study the effect of doping on antibacterial activities (Saleem et al., 2022, Naskar et al., 2020). Therefore, currently synthesized Ni doped ZnO NPs have been evaluated for bactericidal activity for further insight of action of these antibacterial agents.
Herein, synthesis of pH and dopant concentration modified Ni doped ZnO NPs is being reported. Several modified samples were synthesized by varying the dopant concentration and pH of medium. After successful characterization, these samples were evaluated for their electric, magnetic, photocatalytic, and antibacterial properties.
2 Experimental
2.1 Method and materials
Analytical grade chemicals such as Zn(NO3)2·6H2O, NaOH, NiCl2·6H2O, and ethanol were purchased from Sigma Aldrich and were used without any further purification. The XRD spectra of the samples were recorded by XRD (JDX-3532, JEOL, Japan) using Cu-Kα (wavelength 1.5418 Å) to analyze the reflection planes and crystal structure of NPs. Spectrophotometer (Shimadzu UV 240, Japan) was used for UV–Visible spectra. SEM (JSM5910, JEOL, Japan) was used to study the morphology of NPs. An LCR meter and Keithley I-V measurements were used to measure dielectric and electrical (AC and DC) properties (model 2100). VSM is used to analyze the magnetic properties of a specimen.
2.2 Synthesis of Zn1-x Nix O
Zn1-xNixO (x = 0.00, 0.02, 0.04, 0.06) were fabricated using sol–gel method. Briefly, 0.3 M solution of Zn(NO3)2·6H2O was prepared in distilled water and its pH was adjusted to 9 by addition of aqueous NaOH solution. NiCl2·6H2O solution of appropriate concentration was added dropwise to above solution for 10 min. Later, this solution was stirred at ambient conditions for 2 h followed by the sonication of mixture for 1 h. After filtration and oven drying, all samples were annealed at 400 °C for 150 min. After cooling, these samples were stored in air tight bottles. Same procedure was followed for preparation of samples at pH 11 and 13 and Zn1-xNixO (x = 0.04) by keeping the other parameters constant.
2.3 Photocatalytic studies
Photocatalytic activity of the synthesized samples was analyzed by photodegradation of hazardous MO dye in aqueous solution following the reported method (Zaman et al., 2023). Briefly, 20 ppm solution of MO dye was prepared and 300 mg of each Zn1-xNixO sample was added in 20 mL of different fractions of MO solutions. These suspensions were kept in dark for 30 min for adsorption–desorption equilibrium of dye on NPs. Then, the suspensions were kept in sunlight for different time intervals ranging from 0 to 80 min. UV/Vis. spectrum for each sample was recorded at λmax of 463 nm after regular intervals. The absorbance of light for each sample was decreased continuously which denoted the decomposition rate of MO dye. The decomposition efficiency was calculated by using the equation (1).
Where Co, C, Ao and A represented the initial concentration of dye, the concentration at a time ‘t’, the initial absorbance of dye and the absorbance of light at a time ‘t’, respectively.
2.4 Antibacterial studies by disc diffusion assay
The antibacterial potential of the Zn1-xNixO samples was evaluated following the disc diffusion method as reported in the literature (Zamana et al., 2022). Samples were tested against four bacterial strains, two gram-positive (S. aureus and B. subtilis) and two gram-negative (E. coli and P. multocida). Briefly, bacterial strains stored in nutritional agar medium were kept alive at 4 ⁰C for 24 h. The turbidity of this medium was adjusted to McFarland 0.5% BaSO4 turbidity standard [108 colony forming unit (CFU) per mL] density by addition of saline (0.9% NaCl). Nutrient gar (20 g/L) was autoclaved at 45 ⁰C and pH 7. After cooling this agar, 1 mL of already made inoculum (108 CFU per mL) was added in it. 25 mL of each seeded agar was placed in petri dish plate and left to set. The Sterile paper discs loaded with samples in DMSO were placed in petri dishes having bacterial strains maintained at 37 ⁰C and pH 7.0. DMSO was used as negative control while a broad spectrum commercially available drug, i.e., rifampicin was used as positive control. Each medium was kept at a constant temperature of 37 ⁰C for 24 h. After this time, the zone of inhibition of each sample was measured in millimeters.
2.5 Statistical analysis
Triplicate analysis was carried out for each bioactivity test in current research work. The results were analyzed statistically by ANOVA. Statistical significance was accepted at a level of p < 0.05. All the results were reported as Mean ± SD.
3 Results and discussion
3.1 XRD analysis
Fig. 1(a) & (b) represents the XRD pattern of Ni doped ZnO NPs, prepared by varying dopant concentration and pH of solution. For pure ZnO NPs, the diffraction peaks at angles (2θ) of 31.729°, 34.372°, 36.204°, 47.495°, 56.548°, 62.821°, 67.929° and 69.048° corresponded to planes (1 0 0), (0 0 2), (1 0 1), (1 0 2), (1 1 0), (1 0 3), (1 1 2) and (2 0 1) respectively, were obtained, while slight shift in peaks strength was observed with increasing dopant concentration and pH values. The hexagonal wurtzite structure was suggested for all samples by pattern of diffraction peaks, with space group P63mc and matched with standard ICSD data having the reference code: 01–080-0074 (Bhuiyan and Rahman 2014). The larger peaks observed at 36.204° showed the high crystallization of samples. No secondary phase peaks due to nickel or its oxides were observed in the XRD pattern which showed there was no segregation of phases. It represented that the dopant Ni ions entered the ZnO lattice and occupied the Zn+2 lattice positions without altering the hexagonal wurtzite structure due to the same valence and ionic radii. Ni doping is also preferred due to its compatibility with the host material and almost similar sizes (Ma et al., 2020). The Debye-Scherrer’s equation was used to determine the crystallite size as represented in equation (2).
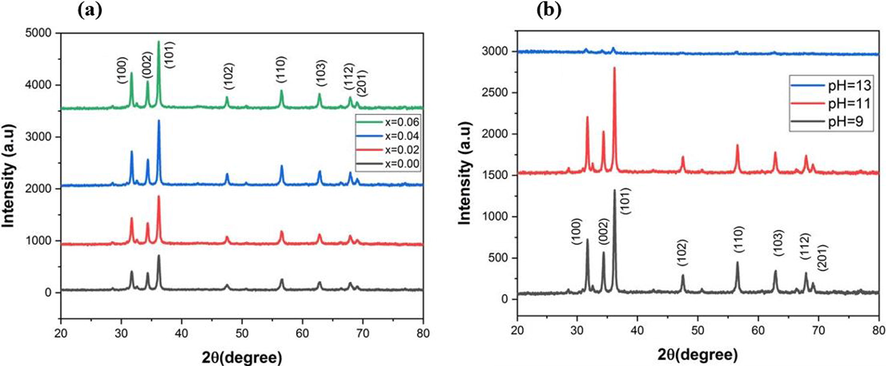
The XRD pattern of Ni doped ZnO NPs at varying (a) dopant concentration (b) pH.
Where, “β” represent the full width at half maxima, “D” is the crystalline size, “λ” is X-ray wavelength of Cu-Kα line (1.5406 Å).
The diffraction peaks of samples containing nickel are substantially sharper than pure ZnO NPs which showed that the dopant concentration and pH encouraged the crystallite formation. The crystallite diameters were calculated in the range of 20–26 nm at varying dopant concentration and 25.3–27 nm at varying pH. A slight broadening of peak was observed at pH 13, which showed the poor crystallinity in strongly alkaline environment. An increase in crystallite size and cell volume but decrease in dislocation density and lattice parameters was observed with increase in dopant concentration and pH as shown in Table 1 and 2. Ni+2 ion with a slightly smaller ionic radius (0.70 Å) was substituted at a Zn+2 (0.74 Å) site inside the ZnO lattice, which caused the change in lattice characteristics (Zhao et al., 2011, Srinet et al., 2013, Fabbiyola et al., 2017, Elkamel et al., 2018, Ali et al., 2020, Norouzzadeh et al., 2020). The crystallite size decreases, the dislocation density tends to increase, and vice versa as the dopant and pH increases. When the crystallite size is small, there is less space for dislocations to accommodate the lattice strain, leading to a higher dislocation density. Conversely, larger crystallite sizes provide more space for dislocations to relax, resulting in a lower dislocation density. The dislocation density and micro-strain are closely related. An increase in dislocation density can contribute to an increase in micro-strain (Zeid et al., 2019).
NPs
a (Å)
c (Å)
c/a
D (nm)
x10-3 (nm)-2
x10-3 (unitless)
X = 0.00
3.254
5.214
1.602
20.90
2.289
1.65
X = 0.02
3.254
5.214
1.602
22.28
2.015
1.55
X = 0.04
3.253
5.212
1.602
25.34
1.552
1.36
X = 0.06
3.257
5.216
1.601
26.72
1.400
1.29
NPs
a (Å)
c (Å)
c/a
D (nm)
x10-3 (nm)-2
x10-3 (unitless)
pH = 9
3.253
5.212
1.602
25.34
1.557
1.36
pH = 11
3.254
5.213
1.602
27.84
1.289
1.24
pH = 13
3.282
5.244
1.598
10.23
9.538
1.15
3.2 SEM and EDS analysis
The morphology and elemental composition of Ni doped ZnO NPs was studied by SEM and EDS analysis, respectively. SEM analysis showed the spherical nature of NPs with average diameter 20 to 26 nm as shown in Fig. 2a-h. Agglomeration of particles was observed with increase of dopant concentration (Fig. 2a-e) while irregular trend was observed by varying pH (Fig. 2f-h). By increasing the pH from 9 to 11, the agglomeration was reduced but at strong alkaline pH 13, a slight increase in agglomeration was observed. The EDS spectra of ZnO and doped ZnO NPs is shown in Fig. 2i and 2j. The ZnO spectra have only ‘Zn’ and ‘O’ peaks while, ‘Ni’ peak was also observed in doped ZnO NPs, which proved the purity and addition of Ni2+ ions in ZnO lattices.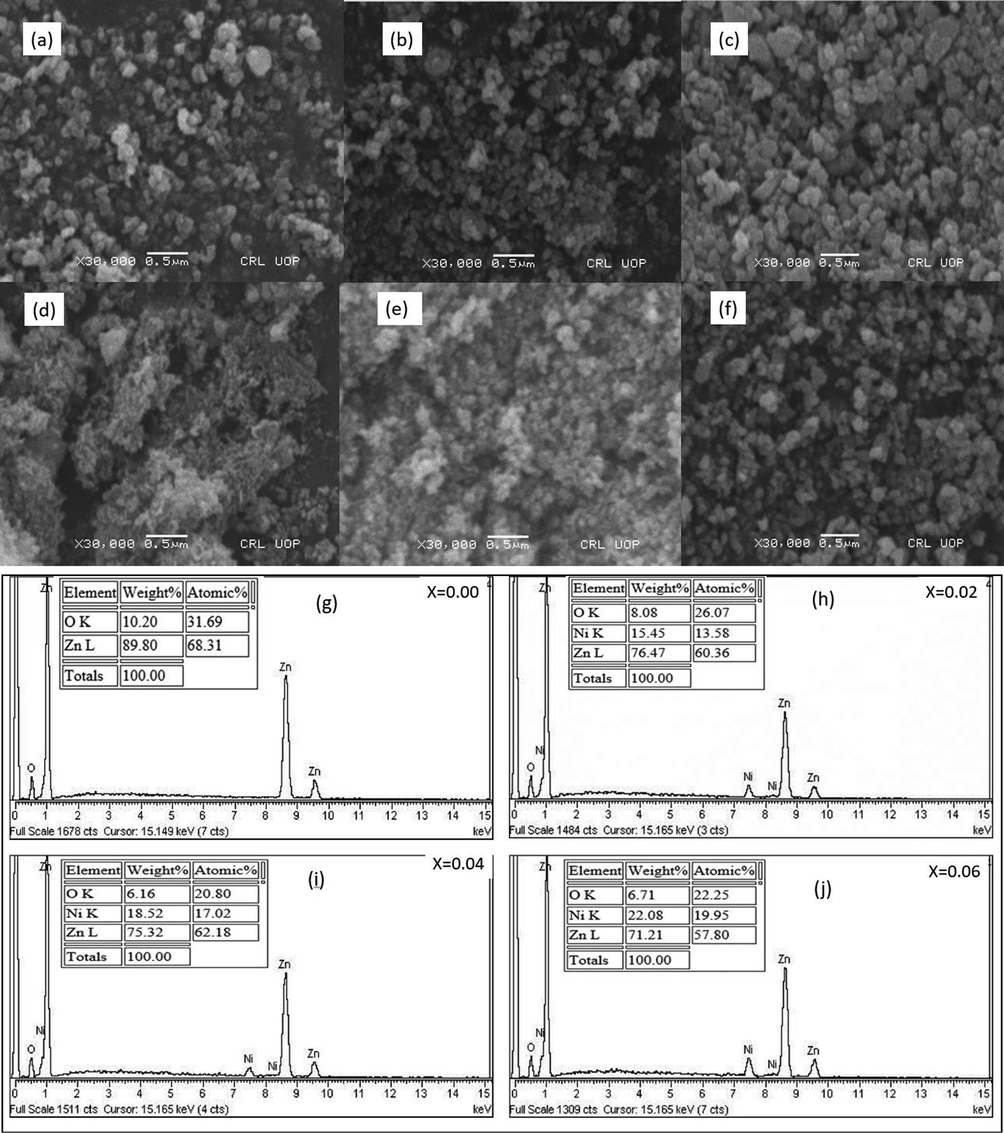
SEM and EDX results of Zn1-xNixO NPs (a) x = 0.00 at pH = 9 (b) x = 0.02 at pH = 9 (c) x = 0.04 at pH = 9 (d) x = 0.06 at pH = 9 (e) x = 0.04 at pH = 11 (f) x = 0.04 at pH = 13 (g) x = 0.00 at pH = 9 (h) x = 0.02 at pH = 9 (i) x = 0.04 at pH = 09 (j) x = 0.06 at pH = 09.
3.3 UV–Visible and FTIR analysis
Formation of NPs was confirmed by the appearance of characteristic absorption peaks in the UV–Vis. spectra of samples as shown in Fig. S1a and S1b. Energy band gap (Eg) of each sample was determined using equation (3) to understand the effect of doping and pH on absorption spectra of samples.
Where, “h” is the Planks constant, “c” is the speed of light and “λ” is the wavelength of absorption. It was observed that the energy band gap was decreased when dopant concentration was increased up to x = 0.04. Further increase in dopant concentration caused the increase in Eg. At higher dopant concentrations, the introduction of Ni ions can lead to the creation of defect states within the material's band structure. These defect states can act as trap levels, causing an increase in the energy band gap. This phenomenon has been observed in various studies. For example, in Ni-doped ZnO nanorods, the band gap energy was found to increase with increasing Ni dopant concentration. Moreover, at higher dopant concentrations, there is a higher probability of dopant clustering, where multiple dopant ions come together to form clusters or aggregates. These clusters can introduce additional energy levels within the band structure, leading to an increase in the energy band gap. Beyond a certain dopant concentration, the host material may reach a saturation point where it can no longer effectively incorporate additional dopant ions. This can result in the formation of secondary phases or the segregation of dopant ions, which can alter the band structure and lead to an increase in the energy band gap (Singh et al., 2018, Yang et al., 2023). Similarly, by increase of pH up to 11, the value of Eg was decreased to minimum value of 2.95 eV. At further increase of pH, the Eg value was again increased due to smaller crystalline size. The values of Eg were calculated by Tauc’s relation (Fig. 3) and mentioned in Table 3.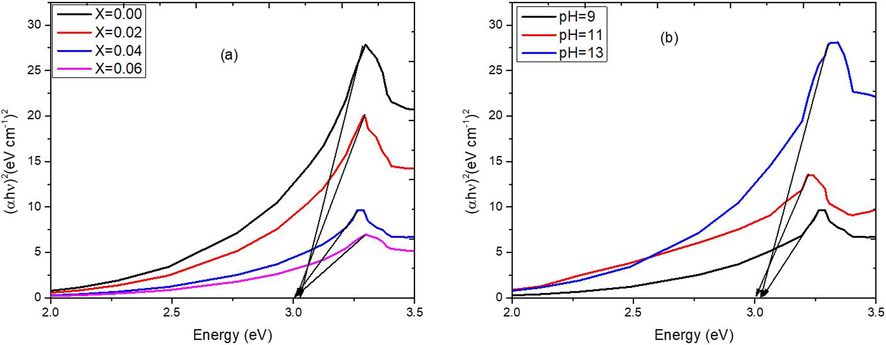
Tauc plot of Zn1-xNixO NPs at varying (a) concentration (b) pH.
Samples
X = 0.00
X = 0.02
X = 0.04
X = 0.06
X = 0.04
pH = 9
pH = 11
pH = 13
λ (nm)
376
377
380
376
380
376
Eg (eV)
3.03
3.01
3.00
3.03
3.00
3.03
Functional group analysis and nature of bonding in samples were analyzed by the FTIR analysis. Peaks in the range of 450–507 cm−1 were assigned to the stretching vibrations of Zn-O bond as shown in the Fig. 4a and 4b. A slight blue shift in the vibrational frequencies of Zn-O bond was observed when Zn2+ were replaced by the Ni2+ ions in the lattice of ZnO. Sharp peaks in the range of 2345–2355 cm -1 were assigned to the stretching vibrations of CO2. A broad peak around 3500 cm−1 was assigned to stretching vibration of O–H group.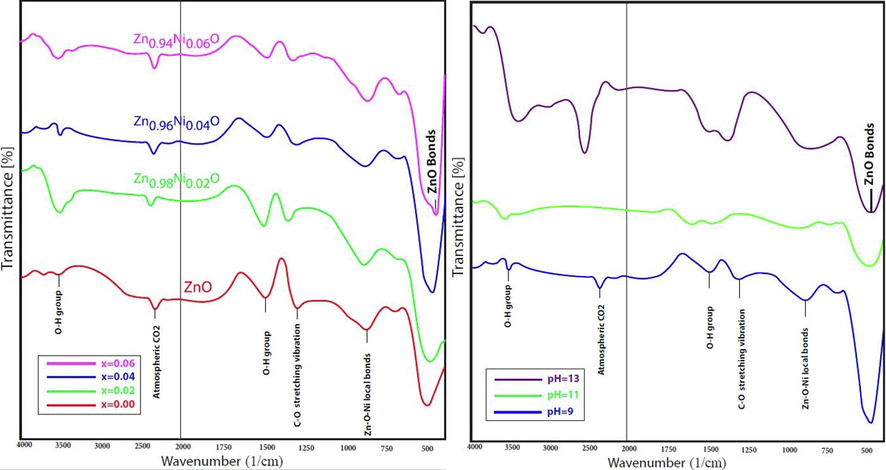
FTIR spectra of Ni doped ZnO NPs synthesized at varying (a) concentration (b) pH.
3.4 Dielectric parameters
3.4.1 Dielectric permittivity and dielectric loss
From the Fig. 5(a) it can be clearly seen that the dielectric characteristics were strongly dependent on doping. Firstly, the dielectric constant was low and then it was raised with dopant concentration. At X = 0.04, Ni doping caused a significant number of surface defects which resulted in generation of vacancies and porosities along the grain borders and trap states. The greater dielectric constant of doped ZnO samples was most likely due to the enhancement of charge carrier density due to Ni doping. Moreover, a variety of polarization types, including as ionic, interfacial, electronic, and dipolar polarization, may have contributed to the large value of the dielectric real part (ε′) at low frequencies. The combined contribution of several polarization types, such as ionic, electronic, interfacial, and dipolar polarization, caused the greater values of ε′ at lower frequencies (Ashokkumar and Muthukumaran 2015). While at x = 0.06, when crystallite size was maximum, the dielectric constant was decreased because it was inversely proportional to average crystallite.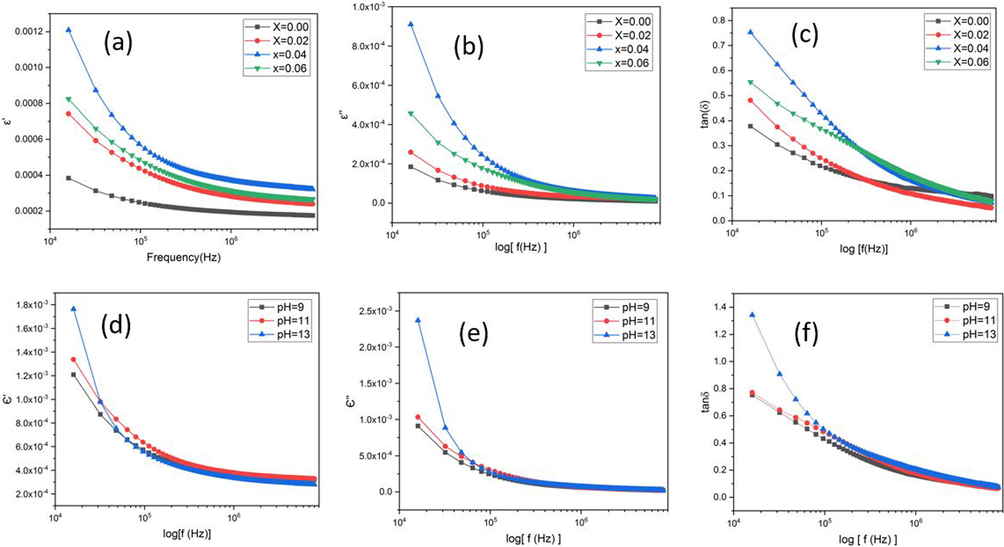
Frequencies dependent dielectric properties of Zn1-xNixO NPs (a) real (b) imaginary (c) lose factor, for variant concentration and (d) real (e) imaginary (f) lose factor, at different pH.
The effect of pH on dielectric constant is show in Fig. 5d. The results showed that, the dielectric constant value is maximum for pH 13 and minimum for pH 9, due to minimum crystallite size at pH 13. According to the dislocation density's findings, the ZnO lattice has a number of defects such vacancies and interstitials. The decrease in the imaginary component of the Low frequency dielectric constant (ε“) is show in Fig. 5b and 5e. Ion hopping, conduction losses from ion migration, and losses from ionic polarization are potential explanations of the fluctuations. Reduced involvement of polarization mechanism's number of dipoles at higher frequencies is the only source of dielectric loss caused by ion vibration and a slow response time of dipoles, which causes a lag in between an oscillating dipoles frequency and the frequency of an external electric field. Fig. 5c and 5f showed the dielectric loss rises as the concentration of Ni doping increases, up to x = 0.04 and then decreasing for x = 0.06, while it is highest for pH 13 and lowest for pH 9. For lower frequencies, the tanδ plot shows high values that gradually decreases to steady levels for higher frequencies (Belkhaoui et al., 2019). The elevated dielectric loss values seen in the low frequency range are related to crystal imperfections, impurities, and moisture in the produced samples. Based on domain wall resonance, it is possible to understand how frequency reduces dielectric loss. The strong resistance of the grain boundary requires more energy at lower frequencies, while at higher frequencies, the resistance decreases, and the energy required for the transportation of charge carriers decreases. The produced samples are a good material for nonlinear optical applications because they have low dielectric loss percentages at higher frequencies.
3.4.2 A.C conductivity (σac)
AC conductivity and impedance of Ni doped ZnO NPs synthesized at various doping and pH conditions is shown in Fig. 6. The doped ZnO NPs has the maximum AC conductivity at x = 0.04 due to increased crystallite size. Larger crystallite size suggested the less insulating grain boundaries, which obstruct the flow of electrons, greater surface contact between grains, which enhanced the electron flow. AC conductivity (Fig. 6a) declines with increasing Ni concentration at x = 0.06 due to presence of defect at the boundaries of grain (Ashokkumar and Muthukumaran 2015, Belkhaoui et al., 2019). Fig. 6d showed that the AC conductivity has same behavior at pH 9 to 11 and have low AC conductivity at pH 13. This was attributed to the decrease in crystallite size at corresponding pH. Fig. 6b demonstrated that when the Ni concentration was raised from x = 0.02 to 0.06, the real part of impedance (Z′) value dropped while with increase of pH, the Z′ value was increased (Varghese and Varghese 2015, Usha et al., 2017, Samanta et al., 2018).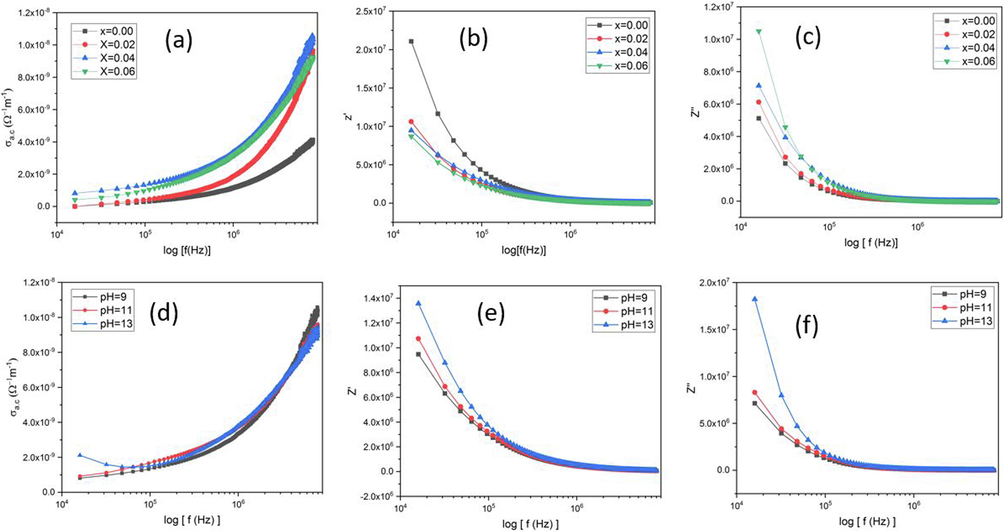
Frequency dependence AC properties of Zn1-xNixO (a) AC conductivity, (b) Impedance real part, (c) Impedance imaginary part, for variant concentration and (d) AC conductivity (e) Impedance real (f) impedance imaginary part, at different pH.
In Fig. 6e showed the increase of Z′ with increasing of pH because the AC conductivity has inverse relation with impedance. It's possible that Z′' is considerable frequency dependency in the lower regime is caused by the high resistivity that comes from the efficiency of resistive grain boundaries there. Nonetheless, all created samples display frequency independent behavior in the higher frequency domain. because all the prepared samples with the variation in dopant concentration and with the variation in pH value have a constant value of ac conductivity at the higher frequency region. Fig. 6c showed the increment in imaginary part of impedance (Z″) from x = 0.02 to x = 0.06 and Fig. 6f showed the Z″ as a function of frequency. The value of Z″ was increased with increased of pH, this was due to the fluctuations in capacitance of grain boundary. Moreover, Z′′ is inversely related with capacitance (Siddique et al., 2018).
3.5 VSM results
Hysteresis loops of magnetism illustrated that all the samples showed ferromagnetic activity with coercive fields ranging from 198 to 350 Oe as shown in Fig. 7a and 7b. Due to exchange coupling between localized “d” spins on Ni ions, which could be carried out by free delocalized carriers may have caused ferromagnetism in samples (Theyvaraju and Muthukumaran 2015). The magnetic d-d exchange interaction between the magnetic moments of Ni2+ leads to the ferromagnetic state. The variations in magnetization and coercive field were explained by the dispersion of Ni2+ ions within the ZnO NP structure. As a result, the shallow donor electron-mediated long-range Ni2+-Ni2+ ferromagnetic coupling may be the source of the sample's RT ferromagnetism. Hence, the ferromagnetism in samples might be attributed to the exchange interaction between localized d-spins on the Ni ions and free delocalized carriers (hole or electron from the valence band). Free carriers must exist in order to appear ferromagnetism in Ni-doped NP.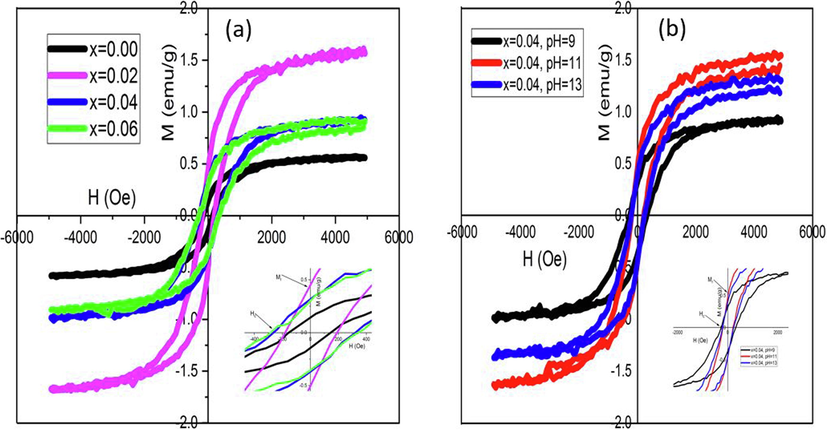
Magnetic hysteresis (M−H) loops of the Zn1-xNixO NPs for (a) concentration (b) pH.
The pH effect on M−H loop showed the increase of Mr and Ms with increase of pH from 9 to 11. At pH = 13, the Mr and Ms values were again decreased. The pH affects the surface defects in samples which influences both Mr and Hc intensively. These results are summarized in Table 4.
Samples
X = 0.02
X = 0.04
X = 0.06
X = 0.08
X = 0.04
pH = 9
pH = 11
pH = 13
Ms (emu/g)
1.5
0.8
1.4
0.76
1.55
1.3
Mr (emu/g)
0.45
0.3
0.44
0.29
0.49
0.39
Hc (Oe)
198
320
230
350
210
245
3.6 Photocatalytic activity of Zn1-xNixO NPs
NPs are believed to be good catalysts due to their large surface area and appropriate energy band gap. Metal based nano catalysts can be employed to degrade the hazardous organic dyes by the absorption of sunlight for photoexcitation of electrons from valence band to conduction band. Non-recombination of photoexcited electrons and holes ensures the higher catalytic efficiency of NPs. Therefore, photocatalytic degradation of MO dye was performed in presence of sunlight (Fig. 8).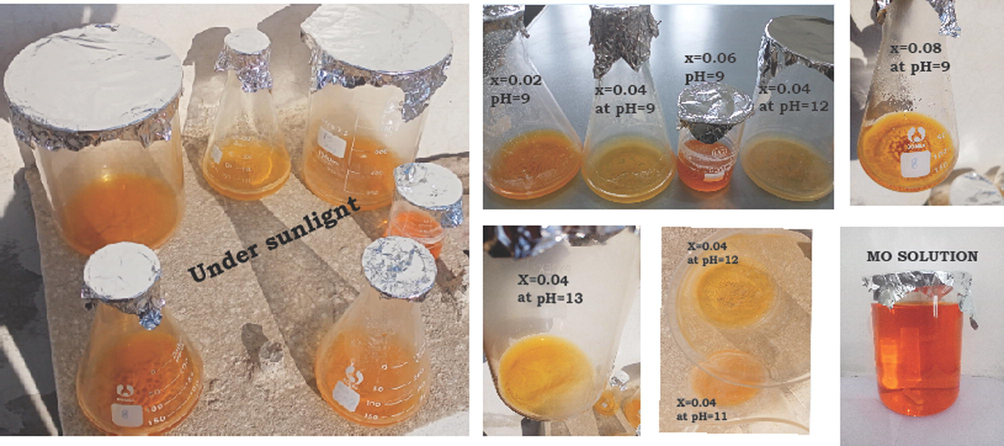
Photocatalytic degradation of samples under sunlight.
Maximum degradation (94%) of dye was achieved at x = 0.04 at pH 13 after 80 min (Fig. 9) when crystallite size was smallest. Value of Eg was largest at this crystallite size and avoided the recombination of photoelectrons and holes as compared to other samples. Higher catalytic activity of doped NPs can be attributed to higher surface area along with surface defects.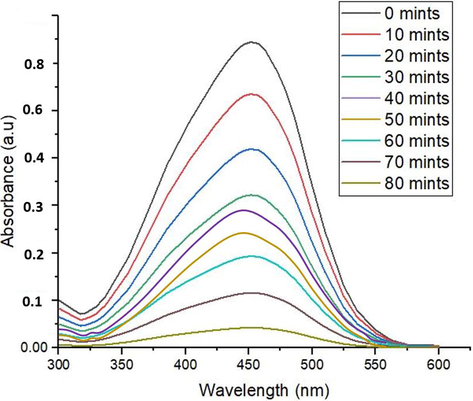
Photocatalytic degradation of MO dye under sunlight.
The reaction kinetics of photodegradation of MO dye followed the equation (4) which proved the pseudo-first-order kinetics of reaction.
Where Co, C and K represented the initial concentration (mol.L-1) of the dye solution at 0 min, concentration (mol.L-1) at different time intervals, and the pseudo-first-order constant, respectively. % Dye degradation under sunlight at various time intervals is shown in Fig. 10. High degradation efficiency of relatively cheap and non-hazardous NPs has proved the usefulness of these materials for purification of industrial effluents and water bodies from hazardous organic dyes.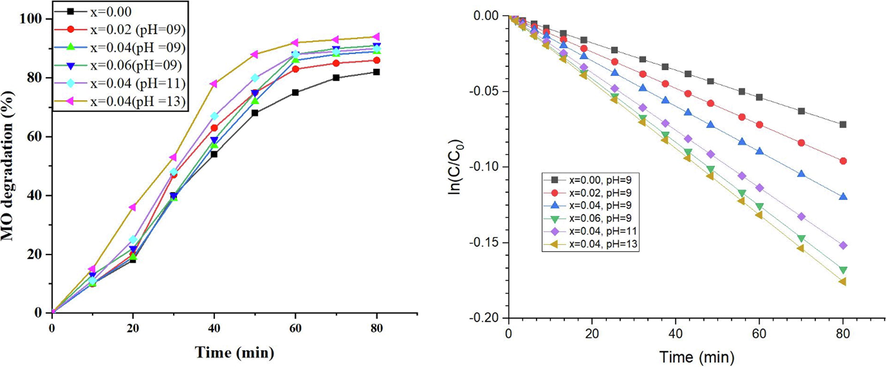
Photocatalytic degradation (%) of MO dye followed pseudo-first order kinetics.
Little attention has been paid previously for the photodegradation of MO dye using ZnO based nanomaterials. By analyzing the literature reported for the degradation of MO dye (Table 5), it can be declared that the currently synthesized material is much efficient as photocatalyst at ambient conditions. Some previously reported catalysts have shown more promising results but they need high energy source (UV lamp) or large time period. Hence, it has been anticipated that current nanomaterial may have commercial importance to degrade hazardous organic dyes in industrial effluents.
Proposed Mechanism
| Sr. No. | Material used | Maximum Degradation of MO dye (%) | Conditions | Reference |
|---|---|---|---|---|
| 1 | Cerium-Oxide-Nanoparticle-Decorated Zinc Oxide | 94.06 | 60 min under fluorescent lamp | Rodwihok et al., 2020. |
| 2 | Silver doped ZnO nanorods | 88 | 2 h of UV light treatment | Bhatti et al., 2019. |
| 3 | Al/ZnO Nanoparticles | 80% | 4 h under the Ultraviolet (UV) light irradiation | Peerakiatkhajohn et al., 2021. |
| 4 | TiO2/ZnO/GO | 44 | 120 min under Xe-lamp | Raliya et al., 2017. |
| 5 | ZnO | 100 | 80 min under UV light | Kaur et al., 2013. |
| 6 | Fe doped ZnO | 92.1 | 90 min in sun light | Algarni et al., 2022. |
| 7 | Ag-ZnO | 96 | 80 min in sunlight | Chauhan et al., 2020. |
| 8 | Zno-CuO nanocomposite | 92.18 | 120 min under UV lamp | Gerawork et al., 2020. |
| 9 | ZnO-Sn(10%)/GO | 96.2 | 120 min under visible light | Oyewo et al., 2022 |
| 10 | Zn1-xNixO (x = 0.04 at pH 13) | 94 | 80 min in sunlight | Current work |
Following mechanism was proposed for the photodegradation of MO dye on catalyst surface in line with the literature reported (Batra et al., 2022, Zaman et al., 2023).
-
Photoexcitation
In first step, photoexcitation of electron occurs from valence band to conduction band in presence of sunlight. As a result, electron-hole pair is generated, indicated by Equation (5).
-
Ionization of water
In second step, hydroxyl radicals are produced by the reaction of holes and water molecules as shown in Equation (6). These radicals are strong oxidizing agents and can react with any organic pollutants non-selectively to produce other reactive species and can decompose the molecules. Hydroxyl radicals may also kill the bacteria by rupturing their cell barriers.
-
Oxygen ionosorption
In 3rd step, binding of electron occurs with the dissolved oxygen molecules to produce anionic superoxide radical as shown in Equation (7). This radical is strong oxidizing agent which may cause further oxidation of pollutant species. Formation of this radical by accepting the electron also prevents the recombination of electron-hole pairs.
-
Protonation of superoxide
Superoxide radical reacts with hydrogen ions to produce multiple oxidizing species by chain reactions as represented in Equation 8–13. All these species can break down the organic structures present/adsorbed on the surface of NPs.
3.7 Antibacterial evaluation of Zn1-xNixO NPs
Antibacterial evaluation of pure and doped ZnO NPs revealed the more noxious nature of doped NPs (Table 6). It may be due to strong binding affinity of Ni2+ ions with enzymes or genetic material of bacteria. Moreover, it was also observed that the NPs were more active towards gram negative strains of bacteria and activity goes on increasing with decrease of particle size. More activity of doped NPs toward gram negative strains was attributed to the relatively thin cell wall of these bacteria which can be crossed easily by smaller NPs. On crossing the cell barriers, these NPs can easily bind with enzymes and inhibit their growth.
Zone of inhibition (mm)
Sample
Gram Negative Bacteria
Gram Positive Bacteria
E. coli
P. multocida
S. aureus
B. subtilis
X = 0.00
pH = 9
12 ± 0.4
13 ± 0.3
11 ± 0.4
11 ± 0.3
X = 0.02
15 ± 0.6
14 ± 0.1
12 ± 0.5
12 ± 0.5
X = 0.04
16 ± 0.1
14 ± 0.2
14 ± 0.2
12 ± 0.4
X = 0.06
15 ± 0.2
13 ± 0.1
13 ± 0.4
12 ± 0.2
X = 0.04
pH = 11
16 ± 0.1
15 ± 0.2
15 ± 0.6
14 ± 0.4
pH = 13
19 ± 0.4
17 ± 0.4
16 ± 0.6
15 ± 0.2
DMSO (Negative control)
pH = 7
1 ± 0.4
1 ± 0.4
1 ± 0.2
1 ± 0.3
Rifampicin (Positive control)
pH = 7
25 ± 0.5
23 ± 0.2
23 ± 0.5
22 ± 0.3
It has been reported in the literature that the main reason of the bacterial cell death is the generation of reactive oxygen species (ROS) inside the cell by the action of NPs. ROS directly interact with the DNA and proteins to hinder their function and causing death. The generation of ROS is greatly enhanced with the decrease of crystallite size of NPs and increase of surface area (Naskar et al., 2020). Therefore, the activity of smaller size Ni doped ZnO NPs (x = 0.04% at pH = 13) was observed highest than other samples but less than the standard drug. It was anticipated that the activity of doped ZnO NPs can be further enhanced by the selective capping of biologically active groups. The comparative graph of samples and controls is shown in Fig. 11.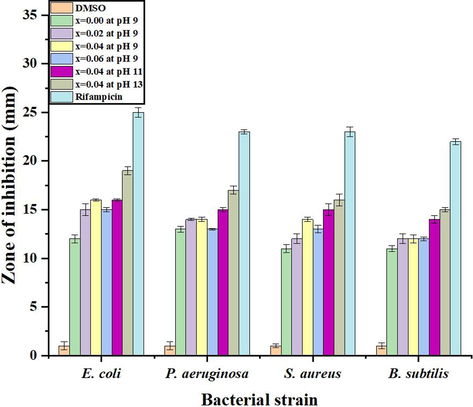
Comparative antibacterial activities of samples.
4 Conclusion
Ni doped ZnO NPs (Zn1-xNixO) were synthesized by sol–gel method at varying reaction parameters i.e., dopant concentration and pH value. All the doped NPs exhibited hexagonal crystal structure by substitution of Zn+2 with Ni2+ at lattice sites. SEM analysis confirmed the spherical shape of NPs while EDX analysis revealed the purity of samples. Eg of samples was found in range of 3.00–3.03 eV calculated by Tauc’s plot. Improved electrical properties (dielectric properties and AC conductivities) were observed by NPs having smaller crystallite size (x = 0.04 and pH = 13) while magnetic properties were optimized at x = 0.02 at pH 9 and x = 0.04 at pH 11. Enhancement in photocatalytic potential was achieved with increase of energy band gap of NPs. Maximum photodegradation (94%) of methyl orange was observed at x = 0.04 and pH 13. Moreover, smaller size NPs showed higher antibacterial activity against gram negative bacterial strains as compared to gram positive bacterial strains.
CRediT authorship contribution statement
Yasir Zaman: Conceptualization, Data curation, Writing – original draft. Muhammad Zahid Ishaque: . Khadija Waris: Data curation. Muhammad Shahzad: Data curation, Methodology, Software. Abu Bakar Siddique: Data curation, Writing – original draft. Muhammad Imran Arshad: Conceptualization, Data curation, Writing – original draft. Hira Zaman: Conceptualization, Writing – review & editing. Hayssam M. Ali: Methodology, Resources, Software, Conceptualization. Fariha Kanwal: Conceptualization, Writing – review & editing. Muhammad Aslam: Conceptualization, Writing – review & editing. Muhammad Mustaqeem: Methodology, Conceptualization.
Acknowledgment
Authors would like to extend their sincere appreciation to the Researchers Supporting Project number (RSP2023R123), King Saud University, Riyadh, Saudi Arabia.
Declaration of Competing Interest
The authors declare that they have no known competing financial interests or personal relationships that could have appeared to influence the work reported in this paper.
References
- Photodegradation of methyl orange under solar irradiation on Fe-doped ZnO nanoparticles synthesized using wild olive leaf extract. Green Process. Synth.. 2022;11(1):895-906.
- [Google Scholar]
- Preparation of Co and Ni doped ZnO nanoparticles served as encouraging nano-catalytic application. Mater. Res. Express. 2020;6:1250d5.
- [CrossRef] [Google Scholar]
- Antibacterial and cytotoxic potency of the plant-mediated synthesis of metallic nanoparticles Ag NPs and ZnO NPs: A review. Open Nano 2022:100077.
- [CrossRef] [Google Scholar]
- Effect of Ni doping on electrical, photoluminescence and magnetic behavior of Cu doped ZnO nanoparticles. J. Lumin.. 2015;162:97-103.
- [CrossRef] [Google Scholar]
- A comparative study of the structural and optical properties of transition metals (M= Fe Co, Mn, Ni) doped ZnO films deposited by spray-pyrolysis technique for optoelectronic applications. Opt. Mater.. 2022;124:112055
- [CrossRef] [Google Scholar]
- Efficient dye degradation strategies using green synthesized ZnO-based nanoplatforms: A review. Appl. Surf. Sci. Adv.. 2022;11:100314.).
- [Google Scholar]
- Investigations on structural, optical and dielectric properties of Mn doped ZnO nanoparticles synthesized by co-precipitation method. Mater. Res. Bull.. 2019;111:70-79.
- [CrossRef] [Google Scholar]
- Efficient photo catalysts based on silver doped ZnO nanorods for the photo degradation of methyl orange. Ceram. Int.. 2019;45(17):23289-23297.
- [Google Scholar]
- Synthesis and characterization of Ni doped ZnO nanoparticles. Int. J. Eng. Manuf.. 2014;4:10-17.
- [CrossRef] [Google Scholar]
- Photocatalytic dye degradation and antimicrobial activities of Pure and Ag-doped ZnO using Cannabis sativa leaf extract. Sci. Rep.. 2020;10(1):7881.
- [Google Scholar]
- Rare earth doped ZnO nanoparticles as spintronics and photo catalyst for degradation of pollutants. Molecules. 2023;28(6):2838.
- [Google Scholar]
- High responsivity and 1/f noise of an ultraviolet photodetector based on Ni doped ZnO nanoparticles. RSC Adv.. 2018;8:32333-32343.
- [CrossRef] [Google Scholar]
- Optical and magnetic properties of Ni-doped ZnO nanoparticles. J. Alloy. Compd.. 2017;694:522-531.
- [CrossRef] [Google Scholar]
- Photodegradation of methyl orange dye by using Zinc Oxide-Copper Oxide nanocomposite. Optik. 2020;216:164864
- [Google Scholar]
- Investigations of Mn introduced structural modifications on Ni-doped ZnO diluted magnetic semiconductors and improved magnetic and antibacterial properties. J. Mol. Struct.. 2022;1251:132060
- [CrossRef] [Google Scholar]
- A photocatalytic dye-degradation study on methylene blue by graphitic nitride based polyimides synthesized via a facile thermal-condensation approach. J. Environ. Chem. Eng.. 2022;10:107747
- [CrossRef] [Google Scholar]
- Diluted magnetic semiconductor properties in TM doped ZnO nanoparticles. RSC Adv.. 2022;12:13456-13463.
- [CrossRef] [Google Scholar]
- Ion-exchange mediated removal of cationic dye-stuffs from water using ammonium phosphomolybdate. Mater. Chem. Phys.. 2020;242:122488
- [CrossRef] [Google Scholar]
- Photocatalytic degradation of methyl orange using ZnO nanopowders synthesized via thermal decomposition of oxalate precursor method. Phys. B: Condens. Matter. 2013;416:33-38.
- [Google Scholar]
- Degradation mechanism and toxicity reduction of methyl orange dye by a newly isolated bacterium Pseudomonas aeruginosa MZ520730. J. Water Process Eng.. 2021;43:102300
- [Google Scholar]
- Antioxidant, antimicrobial, and photocatalytic activity of green synthesized ZnO-NPs from Myrica esculenta fruits extract. Inorg. Chem. Commun.. 2022;141:109518
- [CrossRef] [Google Scholar]
- Effects of textile dyes on health and the environment and bioremediation potential of living organisms. Biotechnol. Res. Innov.. 2019;3:275-290.
- [CrossRef] [Google Scholar]
- One-step hydrothermal preparation of Ta-doped ZnO nanorods for improving decolorization efficiency under visible light. RSC Adv.. 2023;13:5208-5218.
- [CrossRef] [Google Scholar]
- Structural, electrochemical and optical properties of Ni doped ZnO: Experimental and theoretical investigation. Optik. 2020;219:165204
- [CrossRef] [Google Scholar]
- Synthesis of magnetic Fe3O4-HKUST-1 nanocomposites for azo dye adsorption. Arab. J. Chem. 2023104767
- [CrossRef] [Google Scholar]
- Synthesis, characterization and antibacterial activity of Ag incorporated ZnO–graphene nanocomposites. RSC Adv.. 2016;6(91):88751-88761.
- [Google Scholar]
- Antibacterial potential of Ni-doped zinc oxide nanostructure: Comparatively more effective against Gram-negative bacteria including multi-drug resistant strains. RSC Adv.. 2020;10(3):1232-1242.
- [Google Scholar]
- Nanofiltration and reverse osmosis thin film composite membrane module for the removal of dye and salts from the simulated mixtures. Desalination. 2009;249:12-17.
- [CrossRef] [Google Scholar]
- Photocatalytic remediation of persistent organic pollutants (POPs): a review. Arab. J. Chem.. 2020;13:8309-8337.
- [CrossRef] [Google Scholar]
- Comparative study on dielectric and structural properties of undoped, Mn-doped, and Ni-doped ZnO nanoparticles by impedance spectroscopy analysis. J. Mater. Sci. Mater. Electron.. 2020;31:7335-7347.
- [CrossRef] [Google Scholar]
- Enhanced photocatalytic degradation of methyl orange using Sn-ZnO/GO nanocomposite. J. Photochem. Photobiol.. 2022;11:100131
- [Google Scholar]
- Efficient and rapid photocatalytic degradation of methyl orange dye using Al/ZnO nanoparticles. Nanomaterials. 2021;11(4):1059.
- [Google Scholar]
- ZnO nanostructured materials and their potential applications: progress, challenges and perspectives. Nanoscale Adv.. 2022;4:1868-1925.
- [CrossRef] [Google Scholar]
- Photocatalytic degradation of methyl orange dye by pristine titanium dioxide, zinc oxide, and graphene oxide nanostructures and their composites under visible light irradiation. Appl. Nanosci.. 2017;7:253-259.
- [Google Scholar]
- Cerium-oxide-nanoparticle-decorated zinc oxide with enhanced photocatalytic degradation of methyl orange. Appl. Sci.. 2020;10(5):1697.
- [Google Scholar]
- Modification in structural, optical, morphological, and electrical properties of zinc oxide (ZnO) nanoparticles (NPs) by metal (Ni, Co) dopants for electronic device applications. Arab. J. Chem.. 2022;15(1):103518
- [Google Scholar]
- Magnetic and electric properties of Ni-doped ZnO nanoparticles exhibit diluted magnetic semiconductor in nature. J. Alloy. Compd.. 2018;730:399-407.
- [CrossRef] [Google Scholar]
- Synthesis, antimicrobial potential and computational studies of crystalline 4-bromo-2-(1, 4, 5-triphenyl-1 H-imidazole-2-yl) phenol and its metal complexes. CrstEngComm. 2022;24:8237-8247.
- [CrossRef] [Google Scholar]
- Enhanced electrical and thermal properties of pure and Ni substituted ZnO Nanoparticles. Nano-Struct. Nano-Obj.. 2018;16:156-166.
- [CrossRef] [Google Scholar]
- Structural, optical and electrical properties of Ni doped ZnO nanostructures synthesized by solution combustion method. J. Mater. Sci. Mater. Electron.. 2018;29:1327-1332.
- [CrossRef] [Google Scholar]
- Review on zinc oxide nanoparticles: antibacterial activity and toxicity mechanism. Nano-Micro Lett.. 2015;7:219-242.
- [Google Scholar]
- Effects of Ni doping on structural, optical and dielectric properties of ZnO. Ceram. Int.. 2013;39:7557-7561.
- [CrossRef] [Google Scholar]
- Preparation, structural, photoluminescence and magnetic studies of Cu doped ZnO nanoparticles co-doped with Ni by sol–gel method. Phys. E: Low-Dimensional Syst. Nanostruct.. 2015;74:93-100.
- [CrossRef] [Google Scholar]
- A study of frequency dependent electrical and dielectric properties of NiO nanoparticles. Phys. B: Condens. Matter. 2017;504:63-68.
- [CrossRef] [Google Scholar]
- Graphene/CuS/ZnO hybrid nanocomposites for high performance photocatalytic applications. Mater. Chem. Phys.. 2015;167:258-264.
- [CrossRef] [Google Scholar]
- Surface functionalized silver-doped ZnO nanocatalyst: a sustainable cooperative catalytic, photocatalytic and antibacterial platform for waste treatment. Nanoscale Adv.. 2023;5:805-819.
- [CrossRef] [Google Scholar]
- Effects of Fe and Ni doping on the electronic structure and optical properties of Cu2ZnSnS4. Crystals. 2023;13(7):1082.
- [CrossRef] [Google Scholar]
- Physical properties of multifunctional TM-doped ZnO nanorods and their photocatalytic and anti-bacterial activities. Environ. Sci. Pollut. Res. 2023:1-15.
- [CrossRef] [Google Scholar]
- Tamed synthesis of AgNPs for photodegradation and anti-bacterial activity: Effect of size and morphology. Inorg. Chem. Commun. 2023110523
- [CrossRef] [Google Scholar]
- Antibacterial potential of silver nanoparticles synthesized using tri-sodium citrate via controlled exploitation of temperature. Digest J. Nanomater. Biostruct.. 2022;17:979-987.
- [CrossRef] [Google Scholar]
- The effect of CdO content on the crystal structure, surface morphology, optical properties and photocatalytic efficiency of p-NiO/n-CdO nanocomposite. Results Phys.. 2019;12:562-570.
- [CrossRef] [Google Scholar]
- Structure and photocatalytic activity of Ni-doped ZnO nanorods. Mater. Res. Bull.. 2011;46:1207-1210.
- [CrossRef] [Google Scholar]
- A novel tetrafluoroterephthalonitrile-crosslinked quercetin/chitosan adsorbent and its adsorption properties for dyes. J. Mol. Struct. 2023135150
- [CrossRef] [Google Scholar]
Appendix A
Supplementary material
Supplementary data to this article can be found online at https://doi.org/10.1016/j.arabjc.2023.105230.
Appendix A
Supplementary material
The following are the Supplementary data to this article:Supplementary data 1
Supplementary data 1


