

Translate this page into:
Modified QuEChERS method for phenolic compounds determination in mustard greens (Brassica juncea) using UHPLC-MS/MS
⁎Corresponding author at: Department of Chemistry, State University of Maringá, Av. Colombo, 5790, Maringá, PR CEP 87020-900, Brazil. lianemaldaner@gmail.com (Liane Maldaner)
-
Received: ,
Accepted: ,
This article was originally published by Elsevier and was migrated to Scientific Scholar after the change of Publisher.
Peer review under responsibility of King Saud University.
Abstract
A modified QuEChERS method (Quick, Easy, Cheap, Effective, Rugged, and Safe) for the determination of fifteen phenolic compounds in mustard greens (Brassica juncea) using ultra-high-performance liquid chromatography coupled to tandem mass spectrometry (UHPLC-MS/MS) analysis was developed. The QuEChERS partitioning step and dispersive solid phase extraction (d-SPE) clean-up sorbents were investigated, aimed at phenolic compound extraction and pigment removal, respectively. QuEChERS acetate version combined with 25 mg of diatomaceous earth (DE) and 5.0 mg of graphitized carbon black (GCB) provided the best conditions for sample preparation of the target compounds. Under the optimized conditions, all phenolic compounds showed good linearity (r ≥ 0.99) over the concentration range of 0.1 to 8000 μg kg−1, and the quantification limits were in the range of 0.06–230 μg kg−1. The spectrophotometric analysis showed that the clean-up step promoted a significant removal of chlorophyll, which is the major pigment present in the sample. Furthermore, antioxidant activity analysis was also carried out after the clean-up step and, together with chromatographic data, showed that no significant retention of the phenolic compounds occurs in the clean-up step. Two mustard greens varieties – Southern Giant Curled (SGC) and Florida Broadleaf (FB) - were analyzed with the proposed method. Seven phenolic compounds (4-hydroxybenzoic, p-coumaric, ferulic and sinapic acids, naringenin, apigenin and kaempferol) were found in both varieties, the greatest abundance being for sinapic acid (1261.5 ± 23 μg kg−1 in SGC and 1235.5 ± 26 μg kg−1 in FB) and ferulic acid (2861 ± 24 μg kg−1 in SGC and 3204.5 ± 45 μg kg−1 in FB).
Keywords
QuEChERS
Antioxidants
Mustard greens
Clean-up
Sorbents
d-SPE

- QuEChERS
-
Acronym of Quick, Easy, Cheap, Effective, Rugged, and Safe
- UHPLC-MS/MS
-
ultra-high-performance liquid chromatography coupled to tandem mass spectrometry
- d-SPE
-
dispersive solid phase extraction
- DE
-
diatomaceous earth
- GCB
-
graphitized carbon black
- SGC
-
Southern Giant Curled
- FB
-
Florida Broadleaf
- PSA
-
primary and secondary amine
- LC-MS/MS
-
liquid chromatography coupled to tandem mass spectrometry
- UV–Vis
-
Ultraviolet–visible
- DPPH
-
2,2-diphenyl-1-picryl-hydrazyl-hydrate free radical method
- ORAC
-
Oxygen Radical Absorbance Capacity
- C18
-
Octadecylsilane
- PTFE
-
Polytetrafluoroethylene
- AAPH
-
2,2′-azo-bis(2-amidinopropane) dihydrochloride
- SRM
-
selected reaction monitoring
- SD
-
standard deviation
- TE
-
trolox equivalent
- FW
-
fresh weight
- LOD
-
limit of detection
- LOQ
-
limit of quantification
- HPLC-DAD
-
high performance liquid chromatography with diode array detection
- 4HB
-
4-Hydroxybenzoic acid
- NAR
-
Naringenin
- API
-
Apigenin
- KAE
-
Kaempferol
- PCU
-
p-Coumaric acid
- FER
-
Ferulic acid
- SNP
-
Sinapic acid
Abbreviations
1 Introduction
The determination of bioactive compounds in fruits and vegetables has been increasingly explored to provide information about biologically active compounds with potential health benefits, manufacturing of new functional foods in industry and nutritional recommendations for balanced diets (Abuajah et al., 2015). The phenolic compounds are the main class of bioactive compounds found in plant matrices, and are distributed throughout the plant parts including seeds, leaves, roots, flowers and fruits. This class of bioactive compounds comprises more than 8000 compounds, which are extensively studied due to their antioxidant potential in human health protection against oxidative damage (Arts and Hollman, 2005; Bravo, 1998; Vauzour et al., 2010). In addition to the antioxidant potential, the phenolic compounds have been evaluated about other important biologically activities, and a range of studies reported antibacterial, antimicrobial, antidiabetic, anticancer, anti-inflammatory and cardioprotective effects, immune system promoting and skin protective effect from ultraviolet (UV) radiation (Gonçalves and Romano, 2017; Kumar and Goel, 2019; Tungmunnithum et al., 2018).
A member of the Brassica genus, mustard greens (Brassica juncea) are still poorly consumed and studied, in contrast to their seeds and other leafy green Brassica crops, such as cabbage (Brassica oleracea var. capitata), collard (Brassica oleracea var. viridis) and kale (Brassica oleracea L. var. acephala). Mustard greens have a peppery taste and mustardy smell during cooking but are generally consumed in salad form. The cultivars Florida (Broad Leaf) and Southern (Giant Curled Leaf) are the most produced and consumed in United States and are also present in America continent (Rana and Haryana, 2016). Most of the leafy greens from the Brassica genus are associated with Brassica oleracea varieties, due to the diversity and the economic importance of these cultivars around the world. Several studies have been reported that these varieties have a rich composition of natural antioxidants, such as ascorbic acid, phenolic compounds, tocopherols and carotenoids (Frazie et al., 2017; Lee et al., 2018; Park et al., 2014).
Despite the range of relevant publications about phenolic composition in plant matrices, there are still few studies that emphasize the use of recent sample preparation techniques that aim to reduce toxic solvents, time and cost associated with satisfactory extraction of the compounds and removal of matrix interferences (Antolovich et al., 2000; Casado et al., 2018; Fontana and Bottini, 2014). In this sense, the QuEChERS method (Quick, Easy, Cheap, Effective, Rugged, and Safe) is a promising alternative aimed at these advantages for phenolic compound determination in plant matrices. Initially the QuEChERS method was developed for pesticide residue determination in food matrices. However, due to its versatility has been applied to the determination of other compounds and/or matrices, resulting in high recoveries and interference removal in examples such as mycotoxins in tomatoes (Berardis et al., 2018), parabens in drinking water (Marta-Sanchez et al., 2018), tocopherol and sitosterols in seeds and nuts (Delgado-Zamarreño et al., 2016), emerging contaminants in marine mussels (Groz et al., 2014), ethylene glycol ethers in cleaning products (Pastor-Belda et al., 2016), polycyclic aromatic hydrocarbons from soil (Liu et al., 2020), and, recently, phenolic compounds in fruits (Rodrigues et al., 2019; Rotta et al, 2019). In most cases, plant matrix extracts are composed of large amounts of sugars, lipids, fibers and pigments and so require a clean-up step before the liquid chromatography coupled to tandem mass spectrometry analysis (LC-MS/MS) (Martínez-Domínguez et al., 2014; Matamoros et al., 2012; Raina-Fulton, 2015). The clean-up step is essential to reduce interferent compounds, ensuring reliable identification and quantification data, and also to maintain the integrity of the chromatographic system (Goyal, 2007; Vékey, 2001). Leafy vegetables are rich in fibers and pigments (e.g., chlorophyll and carotenoids), and sorbents such as primary and secondary amine (PSA), graphitized carbon black (GCB) and diatomaceous earth (DE) have been reported for the clean-up step (Arias et al., 2014; Raks et al., 2018; Yu et al. 2017). PSA acts as an anionic exchange medium with chelating effect, and it is indicated to remove polar pigments, polar organic acids, some sugars and fatty acids. GCB presents a large planar surface area with polar groups that improve removal of pigments, such as chlorophyll and carotenoids. DE is an amorphous mineral, composed mainly of silicon dioxide, which is low cost and has large surface area. DE has also been applied in pigment removal (Cabrera et al. 2012; Trevisan et al., 2017).
This work investigates the determination of 4-hydroxybenzoic, p-coumaric, ferulic, sinapic, vanillic, caffeic, syringic and ellagic acids and naringenin, apigenin, kaempferol, epigallocatechin gallate, chrysin, quercetin and myricetin in two mustard green varieties (Southern Giant Curled and Florida Broadleaf). For sample preparation, the QuEChERS method was used, and different sorbents for the d-SPE clean-up step were evaluated. The clean-up step efficiency was determined by comparing the ultraviolet–visible (UV–Vis) spectrum scan and antioxidant activity (DPPH and ORAC) data to chromatographic data aimed at the removal of interfering compounds, especially pigments, without changing the phenolic compound composition.
2 Material and methods
2.1 Standards, solvents and reagents
Antioxidant standards of 4-hydroxybenzoic, p-coumaric, ferulic, sinapic, vanillic, caffeic, syringic and ellagic acids and naringenin, apigenin, kaempferol, epigallocatechin gallate, crisin, quercetin and myricetin were purchased from Sigma-Aldrich (Saint Louis, USA). All reference standards had purities greater than 95%. Stock standard solutions of all individual compounds (1 mg mL−1) were prepared in 100% methanol and stored at −18 °C in the dark. Working standard mixture solutions were prepared by appropriate dilution of the stock solutions in 100% methanol.
HPLC-grade methanol and acetonitrile were purchased from J.T. Baker (Edo. de Mexico, Mexico). Ultrapure water was obtained from a Milli-Q ultrapure water purification system (Millipore, USA). Formic acid and acetic acid, HPLC grade, were purchased from Sigma-Aldrich (Saint Louis, USA).
For QuEChERS extraction, anhydrous magnesium sulfate, sodium acetate, sodium chloride and sodium citrate tribasic dihydrate were obtained from J.T. Baker (Edo. de Mexico, Mexico), and sodium hydrogen citrate sesquihydrate was obtained from Alfa Aesar (Ward Hill, USA). The sorbents Bondesil PSA (primary secondary amine, 40 μm) and graphitized carbon black (GCB) were purchased from Agilent Technologies (Santa Clara, USA). Octadecylsilane (C18) was purchased from Supelco (Bellefonte, USA), and diatomaceous earth (DE) was purchased from Almad (Araçatuba, Brazil).
For antioxidant assays and total phenolic content, (±)-6-hydroxy-2,5,7,8-tetramethylchromane-2-carboxylic acid (Trolox), 2,2-diphenyl-1-picrylhydrazyl (DPPH•), 2,2′-Azobis(2-amidinopropane) dihydrochloride (AAPH) and Folin–Ciocalteu reagent were supplied by Sigma-Aldrich (Saint Louis, USA). Fluorescein was obtained from Fluka (Saint Louis, USA).
2.2 Sample preparation
The experimental procedures followed for the optimization of the extraction and clean-up steps for the determination of the phenolic compounds from mustard greens are described in detail in the following sections and presented in a summarized graph in Fig. 1.
Flowchart of the main steps followed for extraction and clean-up optimization for the determination of phenolic compounds from mustard greens.
2.2.1 Samples
A total of 10 kg of mustard greens (Southern Giant Curled and Florida Broadleaf varieties) were obtained from a local hydroponic producer in Maringá (23°24′S, 51°55′W), Paraná, Brazil. The leaves were selected manually and washed in tap water. Afterward, the leaves were chopped and crushed to form a paste in a blender, Walita RI2106, and stored in a freezer (−18 °C) in vacuum packages until analysis.
2.2.2 Optimization of the QuEChERS method
Firstly, the effectiveness of the extraction/partition steps on the extraction of the phenolic compounds from mustard greens was evaluated using the three versions of the QuEChERS method – original (Anastassiades et al. 2003), citrate (Anastassiades et al. 2007) and acetate (Lehotay et al., 2005). For this evaluation, 10 g of mustard greens paste was transferred to a 50 mL Falcon tube, and the addition of the solvent and salts was conducted as follows for each version of the QuEChERS method:
-
-
QuEChERS original: 10 mL of acetonitrile was added, and the tubes were shaken by vortex AP 56 (Phoenix, Brazil) for 1 min. Then, MgSO4 (4 g) and NaCl (1 g) were added.
-
-
QuEChERS citrate: 10 mL of acetonitrile was added, and the tubes were shaken by vortex for 1 min. Then, MgSO4 (4 g), sodium citrate tribasic dihydrate (1 g) and sodium hydrogen citrate sesquihydrate (0.5 g) were added.
-
-
QuEChERS acetate: 10 mL of 1% (v/v) acetic acid in acetonitrile was added, and the tubes were shaken by vortex for 1 min. Next, MgSO4 (4 g) and sodium acetate (1 g) were added.
After the salt addition, the tubes were shaken for 1 min and immediately centrifuged, Harrier 18/80R centrifuge (Sanyo MSE, UK), at 4529g for 10 min. The supernatants of each QuEChERS extraction version (1 mL) were collected and added to separate 15 mL Falcon tubes to proceed to the clean-up step.
In this first study, for all versions of the QuEChERS method, in the d-SPE clean-up step, 25 mg of PSA and 150 mg of MgSO4 were added. The tubes were shaken for 1 min by vortex and immediately centrifuged (4529g, 10 min). The supernatants were filtered through a polytetrafluoroethylene (PTFE) syringe filter (13 mm diameter and 0.22 μm pore) prior to the chromatographic analysis.
2.2.3 Clean-up step
Defined the better extraction/partitioning version of the QuEChERS methods, the d-SPE clean-up step was optimized. For this step, different amounts of sorbent, used individually or in combination, were evaluated, as shown in Table 1. In all clean-up steps, in addition to the sorbents, 150 mg of MgSO4 was also added. The extracts obtained after the clean-up tests were submitted to chromatographic analysis and to spectrophotometric and antioxidant activity analyses to evaluate the clean-up step efficiency.
Test
mg (Sorbent)
QuEChERS acetate
T1
25 PSA
T2
25 C18
T3
50 C18
T4
10 DE
T5
25 DE
T6
10 GCB
T7
25 DE + 2.5 GCB
T8
50 C18 + 2.5 GCB
T9
25 DE + 5.0 GCB
For the spectrophotometric analysis, the extracts were scanned in a wavelength range of 200 to 800 nm, using a UV–Vis Cary 60 (Agilent Technologies, USA). For this measurement, 100 μL of each d-SPE extract was diluted in 2 mL of acetonitrile and added into a quartz cuvette. Blank samples were recorded with pure acetonitrile.
Antioxidant activity was carried out by DPPH radical scavenging and oxygen radical absorbance capacity (ORAC) methods. DPPH radical scavenging was performed according to Ma et al. (2011), and the solution’s absorbance was measured at a wavelength of 517 nm in a Genesys 10S UV–Vis spectrophotometer (Thermo Fisher Scientific, USA). Trolox standards (ranging from 10 to 2000 μmol L−1) were used to prepare the analytical curve (y = −0.0003x + 0.7773, r2 = 0.992), and the results were expressed as micromoles of Trolox equivalents per gram of fresh weight of mustard greens (μmol TE g−1 FW). The ORAC method was performed according to Ou et al. (2001). A Victor™ X4 multimode plate reader (Perkin-Elmer, USA) with fluorescence filters for excitation (485 nm) and emission (535 nm) was used to monitor the protective effect of antioxidant compounds present in the extracts when fluorescein was degraded by the AAPH radical. Trolox standard solutions (0.5 to 10 μmol L−1) were used to prepare the analytical curve (y = 0.2785x + 3.464, r2 = 0.995), and the concentration calculations were based on the area under the fluorescence curve. The results were expressed as micromoles of Trolox equivalents per gram of fresh weight (μmol TE g−1 FW).
2.2.3.1 Final QuEChERS procedure
The final QuEChERS procedure chosen to be used for the extraction of the phenolic compounds from the mustard greens was as follows: the QuEChERS acetate version for the extraction and partition step and a combination of 25 mg of DE and 5.0 mg of GCB for the d-SPE clean-up step.
2.3 UHPLC-MS/MS conditions
Using a UPLC Acquity H-CLASS (Waters, Milford, MA, USA) coupled to a Xevo TQD triple-quadrupole mass spectrometer equipped with a Z spray™ source (Waters, Milford, MA, USA), 1.5 μL samples were injected and separated in a Waters 1.7 μm Acquity UPLC® BEH C18 column (50 mm × 2.1 mm i.d.) at a flow rate of 0.150 mL min−1. The column was kept at 30 ± 1 °C, and the mobile phase was (A) H2O (acidified with 0.1% formic acid) and (B) MeOH. Gradient elution was used, and the organic solvent (MeOH) percentage was changed linearly as follows: 0 min, 10% B; 0.01–4 min, 70% B; 4–8 min, 100% B; 9 min, 100% B; 9.5, 50% B; 10 min, 10% B; 15 min, 10% B.
For instrument control, data acquisition and processing, MassLynx and QuanLynx software version 4.1 (Waters) were used. The electrospray was operated in negative mode, using selected reaction monitoring (SRM), under the following conditions: capillary voltage, 3.0 kV; extractor voltage, 3.0 V; source temperature, 130 °C; and desolvation gas temperature, 550 °C. The cone gas and desolvation gas (both nitrogen) flow rates were set at 50 and 700 L h−1, respectively. Argon (99.9%) from White Martins (Rio de Janeiro, Brazil) was used as the collision gas at a constant pressure of 2.82 × 10⁻³ mbar. The precursor and product ions and the mass spectrometry parameters selected for the phenolic compounds are presented in supplementary material.
2.4 Statistical analysis
All experiments were performed in triplicate (n = 3) and the data are presented as the mean and standard deviation (SD). Tukey’s test (p < 0.05) analyses were executed in RStudiot® v.1.2.1335 software.
3 Results and discussion
3.1 QuEChERS method development
3.1.1 Extraction/partitioning steps
Firstly, the three versions of the QuEChERS method (original, acetate and citrate), which differ from each other by the extraction/partitioning steps, were evaluated for the extraction of the phenolic compounds from mustard greens samples. Fig. 2 shows the phenolic compounds extracted and their respectively amounts, using the three versions of the QuEChERS method. Of the fifteen phenolic compounds evaluated, seven were extracted, four of them being phenolic acids (4-hydroxybenzoic, p-coumaric, ferulic and sinapic acids) and three being flavonoids (naringenin, apigenin, kaempferol). This set of seven compounds was only extracted by the QuEChERS acetate method. Naringenin, apigenin and ferulic acid were also extracted by QuEChERS original and citrate versions and p-coumaric acid by QuEChERS citrate version, but in lower amounts than with the QuEChERS acetate version. The main modification in the extraction/partitioning steps between the QuEChERS original version and the QuEChERS acetate and citrate versions is the buffering salts, resulting in buffering solutions at pH 4.8 and 5.5, respectively. On the other hand, the pH of the QuEChERS original version depends on the acidic characteristics of the sample. The buffered QuEChERS versions were developed because some compounds presented stability and/or recovery problems according to the matrix pH (González-Curbelo et al., 2015). In the case of phenolic compounds, the acid medium can enhance the solubility of the compounds and promote the breaking of the bonds between the phenolic compounds and the matrix, resulting in higher extraction efficiency (Chirinos et al., 2007; Dai and Mumper, 2010; Khoddami et al., 2013).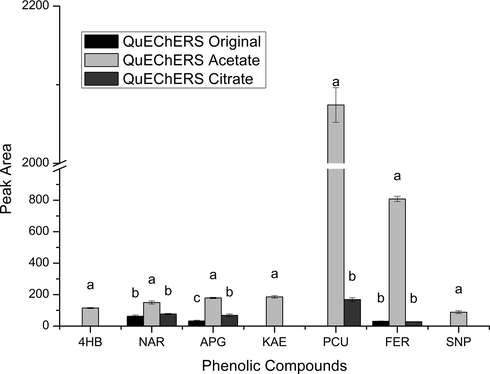
Evaluation of extraction/partitioning efficiency for original, acetate and citrate QuEChERS versions, keeping 25 mg of PSA in d-SPE step. Data given as the mean peak area ± the standard deviation (n = 3). The QuEChERS methods followed by the same letter do not differ statistically from each other by the Tukey’s test (p < 0.05). 4HB (4-hydroxybenzoic acid), NAR (naringenin), APG (apigenin), KAE (kaempferol), PCU (p-coumaric acid), FER (ferulic acid), SNP (sinapic acid).
In this study, the better extraction performance presented by the QuEChERS acetate version (pH 4.8) can be justified by the lower pH of the sample during the extraction process compared with the other QuEChERS extraction versions, QuEChERS original (∼pH 5.8) and QuEChERS citrate (pH 5.5). Phenolic compounds are weak acids, and therefore, lower pH favors their neutral form and also their solubility in the organic extraction solvent (Fontana and Bottini, 2014). Thus, the QuEChERS acetate version was used for the further evaluations of the clean-up step performance.
3.1.2 Clean-up step performance
The mustard greens are composed of approximately 90.7% water, 4.7% carbohydrate (3.2% being dietary fiber), 2.9% protein, 1.3% ash and 0.4% lipids (USDA, 2018). Also, mustard greens contain high amounts of pigments, 1.7 mg/g of fresh weight being chlorophyll and 0.19 mg/g of fresh weight being carotenoids (Ruhil et al., 2015). So, an effective sample clean-up step is required. The d-SPE was developed to be used as a clean-up step in combination with the QuEChERS extraction method. d-SPE is based on the dispersion of a solid sorbent into a sample extract aliquot, and after the dispersion process, the interfering compounds are retained with the sorbent, and the target compounds are separated from the extract bulk by a centrifugation or filtration process (Anastassiades et al., 2003). The sorbent effectiveness depends on the selective adsorption interaction of interferents with the sorbent, physicochemical nature of the sorbent/sorbate (pKa, functional groups, polarity, molecular weight, size) and the characteristics of the sample extract (pH, ionic strength) (Dabrowski et al., 2005; Haghseresht et al., 2002).
In this study, aimed at an effective clean-up of the mustard greens extracts, different sorbents and sorbent combinations (PSA, C18, DE and GCB) (Table 1) were tested in the d-SPE clean-up step, and the results are present in Fig. 3. Among all clean-up tests evaluated, the T6 test (10 mg of GCB) was the clean-up test that resulted in the lowest or among the lowest amounts extracted for all phenolic compounds. For the other clean-up tests evaluated, the behavior was different for each compound; however, some considerations can be made for some sets of compounds. All clean-up tests resulted in slight variations in the amounts extracted for naringenin and p-coumaric acid. On the other hand, significant variations of the extracted amounts can be observed for 4-hydroxybenzoic, ferulic and sinapic acids; apigenin and kaempferol. 4-Hydroxybenzoic acid, apigenin and kaempferol were extracted in higher amounts with T1, T2 and T3 tests. Meanwhile, for ferulic and sinapic acids, T7 and T9 were the clean-up tests that resulted in the highest extracted amounts.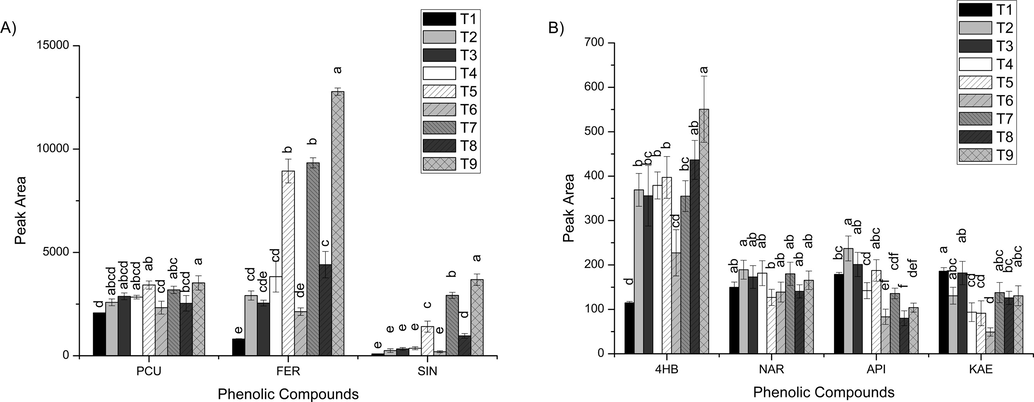
Evaluation of different sorbents used individually or in combination in the d-SPE clean-up step for the QuEChERS acetate method: (A) major and (B) minority phenolic compounds. Data given as the mean peak area ± the standard deviation (n = 3). The clean-up followed by the same letter did not differ statistically from each other by the Tukey’s test (p < 0.05). 4HB (4-hydroxybenzoic acid), NAR (naringenin), APG (apigenin), KAE (kaempferol), PCU (p-coumaric acid), FER (ferulic acid), SNP (sinapic acid).
Based on these findings and taking into account that the phenolic compounds found in higher amounts in the mustard greens samples presented a significant retention in T1 and T3 tests (a reduction of ≅ 69–97%), the best clean-up conditions for the target phenolic compounds would be T7 or T9 test. However, the chromatographic data alone does not provide information about the effectiveness of the sample clean-up.
To evaluate the clean-up efficiency of the d-SPE clean-up step on the sample pigment removal, the sample extracts obtained before and after the d-SPE clean-up step were analyzed by spectrophotometric analysis, and each extract was scanned in a wavelength range of 300–700 nm (Fig. 4). This analysis was carried out in order to observe the reduction of absorbance in the ranges 428–469 nm and 642–660 nm, which correspond to the maximum absorbances of chlorophyll a and b, respectively; chlorophyll is the major pigment present in the mustard greens extracts (Lichtenthaler and Buschmann, 2001). From the spectrophotometric analysis results, it can be observed that all clean-up tests evaluated were able to reduce the amount of chlorophyll; however, a significative reduction was obtained only for T6 and T9 tests. Considering the sample composition, in which the majority of interferents are pigments, the effectiveness of T6 and T9 tests in the clean-up step can be explained. Both sorbents used in these tests, GCB and DE, are indicated for pigment removal. By comparing the results of the spectrophotometric analysis with the chromatographic data for these tests, it is possible to observe that GCB was very efficient in chlorophyll removal; however, in large amounts it also presented a strong interaction with the phenolic compounds (T6). On the other hand, the combination of a smaller amount of GCB with DE (T9) promoted similar chlorophyll removal as T6 test but without significant retention of the phenolic compounds. In this case, 25 mg of DE with 5.0 mg of GCB was the clean-up condition selected to be used in association with the QuEChERS acetate version.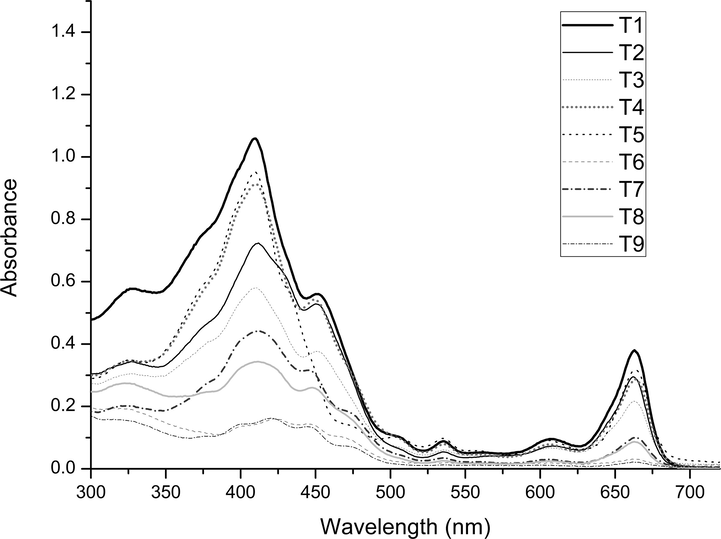
Spectrophotometric analysis of extracts obtained before and after each sorbent evaluated in the d-SPE clean-up for the QuEChERS acetate method.
A parallel study of antioxidant activity (DPPH and ORAC methods) was carried out to evaluate the antioxidant activity before and after the optimized clean-up step (Fig. 5). It can be observed that after the clean-up step, the antioxidant activity presented a slight reduction for both DPPH and ORAC values. These results are in accordance with the chromatographic data, which showed no significative retention of the phenolic compounds in the optimized clean-up step.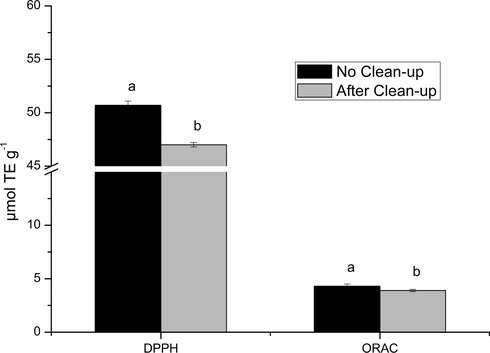
Comparison of the antioxidant activity measured by the DPPH and ORAC methods for mustard greens extracts obtained before and after the optimized clean-up step. Different letters in the same method represent statistical difference according to the Tukey test (p < 0.05).
3.2 UHPLC-MS/MS analysis
Fifteen phenolic compounds commonly found in vegetables from the Brassica genus were selected to be evaluated in two varieties of mustard greens. For this purpose, a UHPLC-MS/MS method was developed and its analytical performance, including analytical curve parameters, LOD and LOQ for all target phenolic compounds, summarized in Table 2. The LOD and LOQ were calculated as the quantity of analyte able to produce a chromatographic peak three and ten times, respectively, higher than the noise of the baseline in a chromatogram of a non-fortified sample, after estimating the endogenous amount. The LOD and LOQ values determined for the target compounds allowed the quantification of most of the phenolic compounds found in mustard greens samples. The quantification of the phenolic compounds found in mustard greens samples was carried out by the standard addition method. For this purpose, different analytical curves were obtained at five concentration levels ranging from 0.1 to 8000 μg kg−1. As shown in Table 2, the developed method presents good linearity for all the compounds, with good correlation coefficients, r ≥ 0.99. The chromatograms of the standards of the phenolic compounds are shown in supplementary material.
Phenolic Compounds
Concentration range (μg L−1)
Linear Regression y = ax + b
Linearity (r)
LOQa (μg L−1)
LODb (μg L−1)
4-Hydroxybenzoic acid
120–600
y = 4.7302 + 452.62
0.991
70
23
Naringenin
0.4–2
y = 98.071x + 65.958
0.992
0.06
0.02
Apigenin
0.1–0.8
y = 9986x + 25.494
0.995
0.06
0.02
Kaempferol
8.5–68
y = 2.793x + 43.353
0.995
5
1.6
p-Coumaric acid
57–690
y = 10.44x + 2796.5
0.995
20
6.7
Ferulic acid
400–8000
y = 2.6819x + 7242.9
0.998
230
76.6
Sinapic acid
240–4800
y = 1.4742x + 1935.6
0.999
180
60
Vanillic acid
15–75
y = 4.67x + 245.47
0.996
8
2.6
Caffeic acid
25–125
y = 3.86x + 10.433
0.990
16
5.3
Syringic acid
15–75
y = 0.7022x + 4.4167
0.994
8
2.6
Epigallocatechin gallate
15–75
y = 5.1867x + 8.1333
0.993
8
2.6
Chrysin
15–75
y = 6.01x – 16.875
0.995
10
2
Quercetin
15–75
y = 3.1833x + 10.625
0.993
8
1.5
Ellagic acid
50–250
y = 0.256x – 2.1
0.996
30
6
Myricetin
25–125
y = 6.746x − 22
0.990
16
2
Two mustard greens varieties, Southern Giant Curled and Florida Broadleaf, were analyzed by the developed method. The phenolic compounds and their respective amounts found in both varieties are presented in Table 3. For the fifteen phenolic compounds evaluated, seven were found in both varieties and six of them were quantified. In both varieties, the same phenolic compounds were found in quite similar amounts, with the greatest abundance as sinapic and ferulic acids. Data given as the mean concentration ± standard deviation (n = 3). The phenolic compound followed by the same letter did not differ statistically from each other by the Tukey’s test (p < 0.05). Lowercase and uppercase letters compare the phenolic compounds in the same mustard green variety and between the different mustard greens varieties, respectively.
Phenolic Compounds
Concentration (μg kg−1)
Southern Giant Curled
Florida Broadleaf
4-Hydroxybenzoic acid
115.5d,B ± 2
263.7c,A ± 26
Naringenin
0.64f,B ± 0.03
0.96f,A ± 0.07
Apigenin
<LOQ
<LOQ
Kaempferol
11.8e,B ± 0.3
13.5e,A ± 0.5
p-Coumaric acid
227.1c,A ± 8
116d,B ± 1.5
Ferulic acid
2861a,B ± 24
3204.5a,A ± 45
Sinapic acid
1261.5b,A ± 23
1235.5b,A ± 26
Few studies in the literature describe the determination of phenolic compounds in mustard greens; on the other hand, other leafy green Brassica crops have been more thoroughly studied. Three studies were found describing the phenolic composition in potherb mustard (Brassica juncea, Coss), Japanese mustard (Brassica rapa, var. japonica) and kimchi mustard (Brassica juncea). Fang et al. (2008) determined eight phenolic acids (gallic, protocatechuic, p-hydroxybenzoic, vanillic, caffeic, p-coumaric, ferulic and sinapic acids) in potherb mustard by high-performance liquid chromatography with diode-array detection (HPLC-DAD). Among them, sinapic (42.6 μg/g of dried weight), ferulic (20.7 μg/g of dried weight) and p-coumaric (13.4 μg/g of dried weight) acids were found in highest concentration levels. Khanam et al. (2012) determined the phenolic composition of some leafy vegetables by HPLC-DAD. The major phenolic compounds found in Japanese mustard were sinapic acid (39.22 μg/g of fresh frozen weight), hyperoside (38.72 μg/g of fresh frozen weight), salicylic acid (13.59 μg/g of fresh frozen weight), p-coumaric acid (12.07 μg/g of fresh frozen weight) and vanillic acid (8.28 μg/g of fresh frozen weight). Park et al. (2017) evaluated the phenolic compound changes in kimchi mustard leaf extracts over different fermentation periods. Chlorogenic, caffeic and ferulic acids, epicatechin, epigallocatechin gallate, rutin, epicatechin gallate, catechin gallate, naringin and quercetin were quantified in kimchi mustard leaf by HPLC-DAD, with caffeic acid, epicatechin gallate, naringenin and epicatechin being the compounds found in highest amounts. Comparing these results with the present study, it is possible to observe that the major compounds found in SGC and FB mustard greens varieties are also the compounds cited in the other varieties as the major compounds. Furthermore, the set of phenolic compounds found in the mustard greens varieties evaluated in this study were also found in the most-consumed leafy green Brassica crops, such as cabbage, broccoli, cauliflower, kale and turnip (Bieganska-Marecik et al., 2017; Mollica et al., 2018; Lee et al., 2018; Thiruvengadam et al., 2016; Upadhyay et al., 2015).
With respect to the biological activities, mustard greens were also less studied than the most-consumed leafy green Brassica crops cited above. However, some few studies reported antihyperglycemic, anticancer, antidiabetic and anti-atherosclerosis effects for different mustard greens varieties (Jo et al., 2018; Kim et al., 2003; Kwak et al., 2016; Park et al., 2008; Yokozawa et al., 2003).
In summary, this study suggests that mustard greens can be included in the group of leafy vegetables which are sources of antioxidant compounds, and that more studies about their other biological activities can reveal additional promising human health effects.
4 Conclusions
The QuEChERS method has been shown to be versatile for determination of phenolic compounds from mustard greens. The lower pH reached by the partitioning buffered salts in the acetate version of the QuEChERS method favored the phenolic compound extraction when compared with the other versions. For the d-SPE clean-up step, four sorbents (PSA, C18, DE and GCB) in different combinations were evaluated, 25 mg of DE and 5.0 mg of GCB being the condition in which pigment removal without significant retention of the phenolic compounds was observed. The effectiveness of the clean-up step for the extracts was evaluated by comparing spectrophotometric, antioxidant activity and chromatographic data obtained before and after the clean-up step. Under the optimized clean-up step conditions, the extracts showed a significant reduction in the absorbance in the wavelength range of chlorophyll without compromising the antioxidant activity and chromatographic data.
The phenolic composition of two varieties of mustard greens was investigated with the optimized QuEChERS-UHPLC-MS/MS method. The phenolic compounds found in both mustard greens varieties were similar to those in other mustard greens varieties reported in the literature, with sinapic and ferulic acids being the most abundant phenolic compounds.
Acknowledgements
The authors thank Conselho Nacional de Desenvolvimento Científico e Tecnológico (CNPq), Coordenação de Aperfeiçoamento de Pessoal de Nível Superior (CAPES) and Fundação Araucária de Apoio ao Desenvolvimento Científico e Tecnológico do Paraná for financial support.
References
- Functional components and medicinal properties of food: a review. J. Food Sci. Technol.. 2015;52(5):2522-2529.
- [CrossRef] [Google Scholar]
- Fast and easy multiresidue method employing acetonitrile extraction/partitioning and “Dispersive Solid-Phase Extraction” for the determination of pesticide residues in produce. J. AOAC Int.. 2003;86(2):412-430.
- [Google Scholar]
- Recent developments in QuEChERS methodology for pesticide multiresidue analysis. Pesticide Chem.: Crop Protect. Public Health Environ. Saf. 2007:439-458.
- [CrossRef] [Google Scholar]
- Sample preparation in the determination of phenolic compounds in fruits. Analyst 2000:989-1009.
- [CrossRef] [Google Scholar]
- Alternative sorbents for the dispersive solid-phase extraction step in quick, easy, cheap, effective, rugged and safe method for extraction of pesticides from rice paddy soils with determination by liquid chromatography tandem mass spectrometry. J. Chromatogr. A. 2014;1360:66-75.
- [CrossRef] [Google Scholar]
- Polyphenols and disease risk in epidemiologic studies. Am. J. Clin. Nutr.. 2005;81:317S-325S.
- [Google Scholar]
- Determination of four Alternaria alternata mycotoxins by QuEChERS approach coupled with liquid chromatography-tandem mass spectrometry in tomato-based and fruit-based products. Food. Res. Int.. 2018;106:677-685.
- [CrossRef] [Google Scholar]
- Characterization of phenolics, glucosinolates and antioxidant activity of beverages based on apple juice with addition of frozen and freeze-dried curly kale leaves (Brassica oleracea L. var. acephala L.) Food Chem.. 2017;230:271-280.
- [CrossRef] [Google Scholar]
- Polyphenols: chemistry, dietary sources, metabolism and nutritional significance. Nutr. Rev.. 1998;56:317-333.
- [Google Scholar]
- Extração em fase sólida dispersiva na determinação de resíduos e contaminantes em alimentos. Sci. Chromatogr.. 2012;4:227-240.
- [CrossRef] [Google Scholar]
- Two novel strategies in food sample preparation for the analysis of dietary polyphenols: Micro-extraction techniques and new silica-based sorbent materials. Trends Food Sci. Technol.. 2018;1–14
- [CrossRef] [Google Scholar]
- Optimization of extraction conditions of antioxidant phenolic compounds from mashua (Tropaeolum tuberosum Ruíz & Pavón) tubers. Sep. Purif. Technol.. 2007;55:217-225.
- [CrossRef] [Google Scholar]
- Adsorption of phenolic compounds by activated carbon — a critical review. Chemosphere. 2005;58:1049-1070.
- [CrossRef] [Google Scholar]
- Plant phenolics: extraction, analysis and their antioxidant and anticancer properties. Molecules. 2010;15:7313-7352.
- [CrossRef] [Google Scholar]
- Determination of tocopherols and sitosterols in seeds and nuts by QuEChERS-liquid chromatography. Food Chem.. 2016;192:825-830.
- [CrossRef] [Google Scholar]
- Changes of phenolic acids and antioxidant activities during potherb mustard (Brassica juncea, Coss.) pickling. Food Chem.. 2008;108:811-817.
- [CrossRef] [Google Scholar]
- High-throughput method based on quick, easy, cheap, effective, rugged and safe followed by liquid chromatography-multi-wavelength detection for the quantification of multiclass polyphenols in wines. J. Chromatogr. A.. 2014;1342:44-53.
- [CrossRef] [Google Scholar]
- Health-Promoting Phytochemicals from 11 mustard cultivars at baby leaf and mature stages. Molecules. 2017;1–13
- [CrossRef] [Google Scholar]
- Inhibitory properties of phenolic compounds against enzymes linked with human diseases. In: Soto-Hernández, M. Phenolic compounds, Biological Activity. 2017.
- [Google Scholar]
- Evolution and applications of the QuEChERS method. Trends Anal. Chem.. 2015;71:169-185.
- [CrossRef] [Google Scholar]
- Use of high performance liquid chromatography for soil and plant analysis. Commun. Soil Sci. Plant Anal.. 2007;33(15–18):2617-2641.
- [CrossRef] [Google Scholar]
- Detection of emerging contaminants (UV filters, UV stabilizers and musks) in marine mussels from Portuguese coast by QuEChERS extraction and GC-MS/MS. Sci. Total Environ.. 2014;493:162-169.
- [CrossRef] [Google Scholar]
- Effects of surface chemistry on aromatic compound adsorption from dilute aqueous solutions by activated carbon. J. Phys. Chem. B. 2002;106:10935-10943.
- [CrossRef] [Google Scholar]
- In vitro and in vivo anti-hyperglycemic effects of green and red mustard leaves (Brassica juncea var. integrifolia) J. Food. Biochem.. 2018;42:1-8.
- [CrossRef] [Google Scholar]
- In Vitro and in Vivo Antioxidant Effects of Mustard Leaf (Brassica juncea) Phytother. Res.. 2003;17:465-471.
- [CrossRef] [Google Scholar]
- Phenolic acids, flavonoids and total antioxidant capacity of selected leafy vegetables. J. Funct. Foods. 2012;4:979-987.
- [CrossRef] [Google Scholar]
- Techniques for analysis of plant phenolic compounds. Molecules. 2013;2328–2375
- [CrossRef] [Google Scholar]
- Phenolic acids: Natural versatile molecules with promising therapeutic applications. Biotechnol. Rep.. 2019;24:1-10.
- [CrossRef] [Google Scholar]
- Phenolic compound profiles and their seasonal variations in new red- phenotype head-forming Chinese cabbages. LWT – Food Sci. Technol.. 2018;90:433-439.
- [CrossRef] [Google Scholar]
- Use of buffering and other means to improve results of problematic pesticides in a fast and easy method for residue analysis of fruits and vegetables. J. AOAC Int.. 2005;88:615-629.
- [Google Scholar]
- Chlorophylls and carotenoids: Measurement and characterization by UV-VIS. Curr. Protoc. Food Anal. Chem. 2001:1-8.
- [Google Scholar]
- Hmim]PF6 enhanced the extraction of polycyclic aromatic hydrocarbons from soil with the QuEChERS method. Arab. J. Chem.. 2020;13:4102-4110.
- [CrossRef] [Google Scholar]
- Polyphenolic compounds and antioxidant properties in mango fruits. Sci. Hortic.. 2011;129:102-107.
- [Google Scholar]
- Trace analysis of parabens preservatives in drinking water treatment sludge, treated, and mineral water samples. Environ. Sci. Pollut. Res.. 2018;1–11
- [CrossRef] [Google Scholar]
- Analytical approaches for the determination of pesticide residues in nutraceutical products and related matrices by chromatographic techniques coupled to mass spectrometry. Talanta. 2014;118:277-291.
- [CrossRef] [Google Scholar]
- Analytical procedures for the determination of emerging organic contaminants in plant material: A review. Anal. Chim. Acta. 2012;722:8-20.
- [CrossRef] [Google Scholar]
- Polyphenolic composition, enzyme inhibitory effects ex-vivo and in-vivo studies on two Brassicaceae of north-central Italy. Biomed. Pharmacother.. 2018;107:129-138.
- [CrossRef] [Google Scholar]
- Development and validation of an improved oxygen radical absorbance capacity assay using fluorescein as the fluorescent probe. J. Agric. Food Chem.. 2001;49:4619-4626.
- [CrossRef] [Google Scholar]
- Protection of green leafy vegetable extracts against oxidation of human low density lipoprotein. Food Sci. Biotechnol.. 2008;17:151-155.
- [Google Scholar]
- Quantification of glucosinolates, anthocyanins, free amino acids, and vitamin C in inbred lines of cabbage (Brassica oleracea L.) Food Chem.. 2014;145:77-85.
- [CrossRef] [Google Scholar]
- Changes in the phenolic compounds and antioxidant activities of mustard leaf (Brassica juncea) kimchi extracts during different fermentation periods. Food Sci. Biotechnol.. 2017;26:105-112.
- [CrossRef] [Google Scholar]
- Gas chromatography with mass spectrometry for the quantification of ethylene glycol ethers in different household cleaning products. J. Sep. Sci.. 2016;39:2292-2299.
- [CrossRef] [Google Scholar]
- New trends in pesticide residue analysis in cereals, nutraceuticals, baby foods, and related processed consumer products. J. AOAC Int.. 2015;98:1163-1170.
- [CrossRef] [Google Scholar]
- Isolation, separation, and preconcentration of biologically active compounds from plant matrices by extraction techniques. Chromatographia. 2018;81:189-202.
- [CrossRef] [Google Scholar]
- Salad crops: Leaf-Type crops. In: Encyclopedia of Food and Health (first ed.). Elsevier Ltd.; 2016.
- [Google Scholar]
- Determination of phenolic compounds in red sweet pepper (Capsicum annuum L.) using a modified QuEChERS method and UHPLC-MS/MS analysis and its relation to antioxidant activity. J. Braz. Chem. Soc.. 2019;1–12
- [CrossRef] [Google Scholar]
- Determination of phenolic compounds and antioxidant activity in passion fruit pulp (Passiflora spp.) using modified QuEChERS method and UHPLC-MS/MS. LWT – Food Sci. Technol.. 2019;100:5-11.
- [CrossRef] [Google Scholar]
- Ruhil, K., Sheeba, Ahmad, A., Iqbal, M., Tripathy, B., 2015. Photosynthesis and growth responses of mustard (Brassica juncea L. cv Pusa Bold) plants to free air carbon dioxide enrichment (FACE). Protoplasma, 252, 935–946. https://doi.org/10.1007/s00709-014-0723-z.
- Effects of abscisic acid, jasmonic acid and salicylic acid on the content of phytochemicals and their gene expression profiles and biological activity in turnip (Brassica rapa ssp. rapa) Plant Growth Regul.. 2016;80:377-390.
- [CrossRef] [Google Scholar]
- Pesticide analysis in coffee leaves using a quick, easy, cheap, effective, rugged and safe approach and liquid chromatography tandem mass spectrometry: Optimization of the clean-up step. J. Chromatogr. A. 2017;1512:98-106.
- [CrossRef] [Google Scholar]
- Flavonoids and other phenolic compounds from medicinal plants for pharmaceutical and medical aspects: an overview. Medicines. 2018;5(93):1-16.
- [CrossRef] [Google Scholar]
- Antioxidant activity and polyphenol content of Brassica oleracea varieties. Int. J. Veg. Sci.. 2015;22:353-363.
- [CrossRef] [Google Scholar]
- US Department of Agriculture, Agricultural Research Service, Nutrient Data Laboratory. USDA National Nutrient Database for Standard Reference, Release 1. Version Current: April 2018. Internet: https://ndb.nal.usda.gov/ndb/foods/show/11270?n1=%7BQv%3D1%7D&fgcd=&man=&lfacet=&count=&max=25&sort=default&qlookup=mustard+greens&offset=&format=Abridged&new=&measureby=&ds=&Qv=1&qt=&qp=&qa=&qn=&q=&ing=.
- Polyphenols and human health: prevention of disease and mechanisms of action. Nutrients. 2010;2:1106-1131.
- [CrossRef] [Google Scholar]
- Mass spectrometry and mass-selective detection in chromatography. J. Chromatogr. A. 2001;921:227-236.
- [CrossRef] [Google Scholar]
- Protective effects of mustard leaf (Brassica juncea) against diabetic oxidative stress. J. Nutr. Sci. Vitaminol.. 2003;49:87-93.
- [CrossRef] [Google Scholar]
- Determination of multiple antibiotics in leafy vegetables using QuEChERS–UHPLC–MS/MS. J. Sep. Sci.. 2017;713–722
- [CrossRef] [Google Scholar]
Appendix A
Supplementary material
Supplementary data to this article can be found online at https://doi.org/10.1016/j.arabjc.2019.10.012.
Appendix A
Supplementary material
The following are the Supplementary data to this article: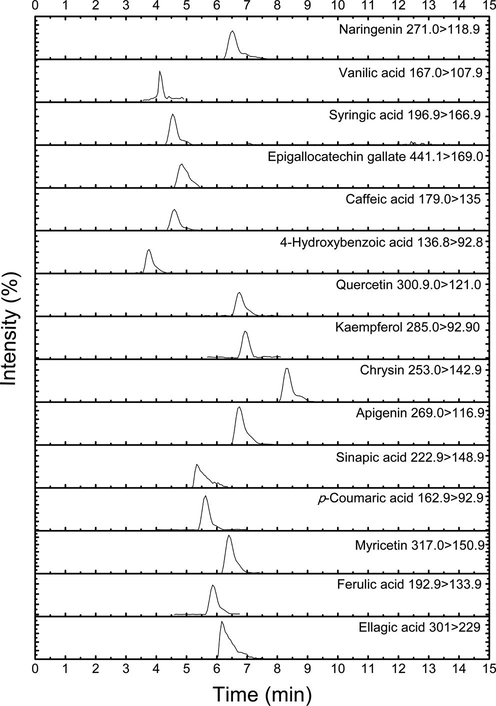
Supplementary data 1
Supplementary data 1


