

Translate this page into:
Molecular scale cure rate dependence of thermoset matrix polymers
⁎Corresponding authors at: School of Polymers and High Performance Materials, The University of Southern Mississippi, 118 College Drive #5050, Hattiesburg, MS 39406-0076, United States (J.S. Wiggins), Center for Advanced Materials, Qatar University, Doha, Qatar (M.K. Hassan). mohamed.hassan@qu.edu.qa (Mohammad K. Hassan), Jeffrey.Wiggins@usm.edu (Jeffrey S. Wiggins)
-
Received: ,
Accepted: ,
This article was originally published by Elsevier and was migrated to Scientific Scholar after the change of Publisher.
Peer review under responsibility of King Saud University.
Abstract
This manuscript demonstrates the molecular scale cure rate dependence of di-functional epoxide based thermoset polymers cured with amines. A series of cure heating ramp rates were used to determine the influence of ramp rate on the glass transition temperature (Tg) and sub-Tg transitions and the average free volume hole size in these systems. The networks were comprised of 3,3′-diaminodiphenyl sulfone (33DDS) and diglycidyl ether of bisphenol F (DGEBF) and were cured at ramp rates ranging from 0.5 to 20 °C/min. Differential scanning calorimetry (DSC) and NIR spectroscopy were used to explore the cure ramp rate dependence of the polymer network growth, whereas broadband dielectric spectroscopy (BDS) and free volume hole size measurements were used to interrogate networks’ molecular level structural variations upon curing at variable heating ramp rates. It was found that although the Tg of the polymer matrices was similar, the NIR and DSC measurements revealed a strong correlation for how these networks grow in relation to the cure heating ramp rate. The free volume analysis and BDS results for the cured samples suggest differences in the molecular architecture of the matrix polymers due to cure heating rate dependence.
Keywords
Thermoset
Cure heating ramp rate
Near infrared spectroscopy
Differential scanning calorimetry
Dielectric spectroscopy
Polymer network growth and architecture

1 Introduction
Due to a relatively low cost and high thermo-mechanical performance, carbon fiber reinforced polymer composites (CFRPs) typically utilize a thermoset epoxy/amine based polymer (Morgan, 2005). When aromatic amines are used to cross-link the epoxide component high thermal and mechanical performance is often observed (Palmese and McCullough, 1992; Kanchanomai et al., 2005). To realize the high thermo-mechanical performance of these polymers, curing temperatures above 150 °C are often used (Davies et al., 2007; Min et al., 1993; Vyazovkin and Sbirrazzuoli, 1996; Um et al., 2002). Furthermore, it is widely reported that the maximum curing temperature of the polymer will significantly impact these properties and is often chemistry specific (Jackson et al., 2011; Zhang et al., 2009; Barton et al., 1998; Guerrero et al., 1996). One of the most common and practical attempts to increase the production speed is to reduce the cycle time for each part, either by increasing the cure heating ramp rate, or allowing a controlled exotherm to cure the part well after removal from an oven.
Despite this drive to drastically increase the cure heating ramp rate, there is little to no published literature about the effect of the ramp rate on the polymer component of the composite. It is commonly believed that as long as an identical extent of cure (conversion) is reached, the polymers must be identical, regardless of heating rate. However, considering the complex kinetics of thermoset matrix polymers it becomes evident that an extent of conversion alone may not provide a clear understanding of the network development during polymer cure (Rosu et al., 2002).
To understand the complex relationships between the cure heating ramp rate, matrix polymer development, and final thermo-mechanical properties, this work will focus on the cure heating rate dependence of a model system for the study of aromatic epoxy/amine thermoset polymers. Differential scanning calorimetry has been used along with near infrared spectroscopy to gain insight into the development of thermoset polymer networks based on diglycidyl either of bisphenol F and 3,3′-diaminodiphenyl sulfone. Positron annihilation lifetime spectroscopy and broadband dielectric spectroscopy have been used to determine the molecular size scale impact of cure heating ramp rate on the polymers. As a result, we were able to relate the cure heating ramp rate to network architectural formation and report an impact on the molecular level from variations in cure heating ramp rate.
2 Materials and methods
2.1 Materials
The amine (curative) selected for this work was 3,3′-diaminodiphenyl sulfone (33DDS), and was obtained from Royce International. The molecular weight is 248.3 g/mol and the equivalent hydrogen weight (EHW) is 62.08 g/eq. Before use, it was dried overnight in a vacuum oven at 50 °C to remove any residual water present. The epoxide used in this work was the diglycidyl ether of bisphenol-F (DGEBF), obtained as EPON-862 from Hexion Specialty Chemicals. The average molecular weight was 338 g/mol, with an equivalent epoxide weight (EEW) of 169 g/eq. The DGEBF was used as received.
2.2 Thermoset matrix formulation
Matrix polymers were synthesized by adding epoxide (DGEBF) into an Erlenmeyer flask with a vacuum fitting and magnetic stir bar. The epoxide was then heated to 65 °C and vacuum of approximately 10−3 torr was applied to remove any air, water, or solvent impurity present in the epoxide. After degassing was complete, vacuum was removed, and amine was added to the reaction vessel. The amount of amine added varied by formulation; however, in all cases, the ratio of epoxide concentration to active amine hydrogen was maintained at 1:1. In a typical reaction of DGEBF epoxide and 33DDS amine, approximately 70 g epoxide and 26 g amine were used. After the amine was added, the system was vigorously stirred to mix the amine and epoxide components and vacuum was reapplied. After no residual gas evolved from the reaction flask, the temperature is raised from 65 °C to the dissolution temperature of the amine. Upon amine dissolution in the epoxide, the matrix polymer was cast into various geometries for curing. To cure, formulations were heated from 35 to 180 °C at variable ramp rates and held for three hours at 180 °C. Matrix polymers were prepared at the following heating ramp rates: 0.5, 1.0, 2.5, 5.0, 7.5, 10.0, 12.5, 15 and 20 °C/min.
2.3 Differential scanning calorimetry (DSC)
Matrix thermal properties were conducted on a DSC Q200 (TA Instruments). All experiments were calibrated to Indium and Sapphire temperature and enthalpy standards, respectively. Additionally, in all cases, nitrogen was used as the purge gas. Dynamic DSC experiments to determine the exotherm intensity of various cure ramp rates were conducted by placing approximately 30.0 mg of uncured polymer matrix within a hermetically sealed TZero® aluminum DSC pan from 35–180 °C at rates of 1.0, 5.0, 10.0, 15.0, and 20.0 °C/min. In some cases, dynamic and isothermal DSC experiments were conducted consecutively to determine the extent of residual cure and residual exotherm intensity. In these cases, the dynamic experiments were conducted as described above, and the samples were held at 180 °C for three hours to ensure complete cure. Heat/cool/heat (HCH) experiments were also conducted during the analysis to determine glass transition temperature and completeness of cure. The heating and cooling rates for the HCH-DSC experiments were held at 5.0 °C/min with a minimum and maximum temperature of 35 °C and 180 °C.
2.4 Near infrared spectroscopy (NIR)
Near infrared spectra in transmission mode were collected using a Nicolet 6700 FTIR (Thermo Scientific) with variable temperature cell in the range of 4000–8000 cm−1. A white light source with a potassium bromide beam splitter and DTGS potassium bromide detector were used. Samples were prepared by placing, dropwise, B-staged polymer between two glass slides that are separated by a 0.8 mm Teflon® spacer. The samples were then reacted while in a Simplex Scientific Heating Cell. While heating, 32 scans at a 4 cm−1 resolution were acquired every 5 min.
2.5 Broadband dielectric spectroscopy (BDS)
Dielectric spectra were collected isothermally using a Novocontrol GmbH Concept 80 Broadband Dielectric Spectrometer over the frequency range 0.1 Hz–3 MHz and temperature range of −80 to 300 °C. Temperature stability was controlled to within ±0.5 °C. Matrix polymer samples with approximate thickness of 200 μm were prepared by placing uncured polymer on an aluminum panel covered with a Teflon® sheet. An identical panel with Teflon® was placed over the sample. The polymers were cured as described previously. Samples films were kept in a humidity controlled chamber (Model 503-20, Electro-tech Systems, Inc.) with RH ≅ 2% at room temperature for at least one week before BDS experiments were performed to decrease the obscuring influence of water on the dielectric response (Mauritz, 1989). Sample discs of 2 cm diameter were covered with two very clean aluminum sheets on both sides and then sandwiched between two gold-coated copper electrodes of 2 cm diameter and transferred to the instrument for data collection. The sample loading process took less than 5 min.
2.6 Positron annihilation lifetime spectroscopy (PALS)
Average free volume hole size and the relative intensity of o-Ps were determined with positron annihilation lifetime spectroscopy (PALS) on a fast–fast coincidence system, based on a system described by Olson et al. (2003), with an average resolution FWHM of 290 ps. Sample disks were prepared as described in Section 2.2. A foil wrapped Na-22 source was sandwiched between two sample disks, wrapped in PTFE tape, and placed between two photomultiplier assemblies equipped with BF3 scintillation crystals, aligned coincident to the sample stack. Twelve spectra were collected for each sample at ambient conditions (23 °C, 45% RH) using a system based on an Ortec Positron Lifetime System (Advanced Measurement Technology, Oak Ridge, TN) over one hour to collect greater than 106 incidences. Coincidences were compiled using a multichannel analyzer. Spectra were analyzed for three lifetimes and intensities using PATFIT-88 software (Kirkegaard et al., 1981). Assuming spherical holes, the average radius of free volume elements was calculated using (Eldrup et al., 1981).
3 Results and discussion
3.1 Thermal network properties
The chemical reaction between an epoxide ring and either a primary or a secondary amine is fairly exothermic. Due to this exothermic nature, when exploring network development at various cure heating ramp rates, it is necessary to first study the evolved heat in the reaction. Since there is an activation energy associated with this reaction, a large evolution of heat could provide a pathway for reaction that is undesired and uncontrolled. These so-called “run-away” reactions could lead to polymer degradation. Secondly, since in asymmetric amines there is a difference in activation energies between primary and secondary amine reactions Jackson, 2011, by changing the ramp rate and the associated exotherm intensity, it might be possible to add enough thermal energy to overcome the higher secondary amine activation energy. This would lead to a competitive reaction between primary and secondary amines.
Fig. 1 shows the DSC thermograms of the reaction between 33DDS/DGEBF at ramp rates that vary from 1 to 15 °C/min. For this experiment, the amine was pre-dissolved in the epoxide monomer at 125 °C and quenched in liquid nitrogen. It is assumed that a negligible amount of reaction occurred before the DSC experiments were conducted. It was observed that only the slowest heating ramp rate of 1 °C/min exhibited an exothermic peak, indicating that a majority of the reaction occurred. The remaining ramp rates only showed an initial exotherm that did not reach a maximum during the heating process. This is expected due to the reduction in elapsed time between the slowest and fastest ramp rates. Due to the differences in primary and secondary amine reactivity and differences of each sample at different temperatures, it was believed that the formation of the network might be different as the ramp rates are increased.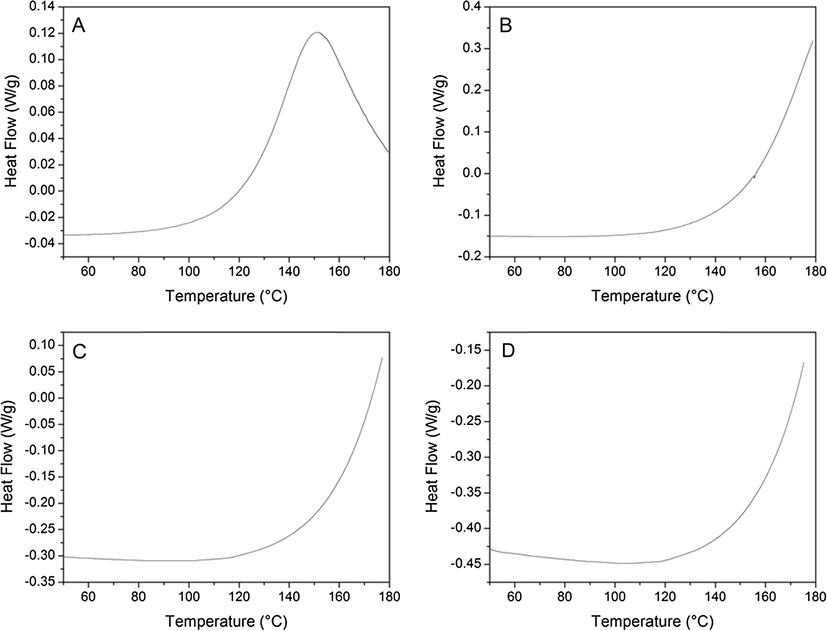
DSC thermograms of 33DDS/DGEBF matrix polymers during cure at heating ramp rates of (A) 1 °C/min, (B) 5 °C/min, (C) 10 °C/min, and (D) 15 °C/min. Positive heat flow indicates exotherm.
To further explore the extent of reaction that occurs during the heating ramp, a correlation between the exotherm intensity and the ramp rate was found. Fig. 2 shows a plot of the exotherm intensity as a function of ramp rate. Exotherm intensity was taken as the integral of the DSC exotherm peak from the onset of reaction to 180 °C. From this graph, it is observed that, at the higher ramp rates, there is little to no reaction occurring in the sample. Due to the differences in elapsed time between the heating rates, this also means that the slower heating rate samples had time for reaction to occur, and at lower temperatures, it is possible that this reaction was limited to only consumption of the primary amine.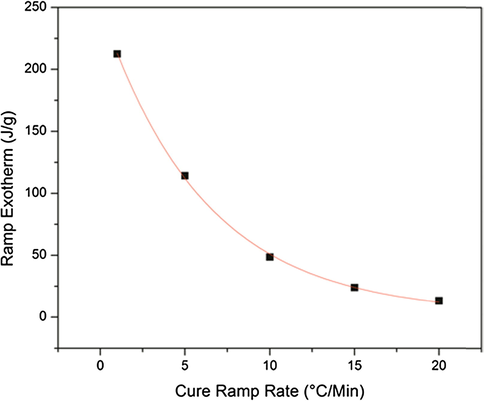
Heating ramp exotherm intensity as a function of cure heating ramp rate. Exponential fit with R2 = 0.9991.
In addition to the heating ramp DSC experiments, DSC heat and hold experiments were conducted. In these experiments, the samples were heated from 35 to 180 °C, similar to the previous samples. However, they were allowed to isotherm at 180 °C for a period of three hours. In this set of experiments, the residual exotherm after the heating ramp could also be determined. Fig. 3 is a plot of the hold exotherm intensity as a function of cure heating ramp rate. In this case, the fastest ramp rate shows the highest hold exotherm intensity. Because the thermal energy release is so high, enough heat would be present to overcome the activation energy for reaction and the exotherm energy should now drive the reaction. This could dramatically impact the network architecture of the resulting system due to the differences in activation energy between primary and secondary amines for the asymmetric amines Jackson, 2011. These differences in network connectivity would be most pronounced at the slowest ramp rates, because there should be some critical ramp rate and/or critical temperature where primary and secondary amine reactivity becomes competitive (either from the thermal energy of the oven or the reaction). Below this critical ramp rate/temperature, primary amine reaction would be favored. While this is not to say that no reaction of secondary amine would occur, it is the opinion of the authors that the difference is pronounced enough to make molecular level differences in the polymer network architecture, which will be focus of discussion in the subsequent sections of this manuscript.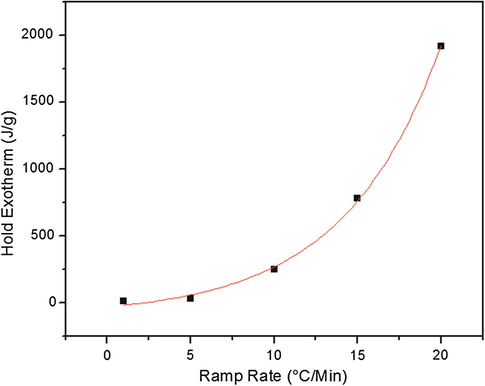
Hold exotherm intensity as a function of ramp rate. Temperature was held at 180 °C for three hours and complete reaction was observed in all cases. Exponential fit with R2 = 0.9982.
While all of the aforementioned data suggest that there could be differences in network growth and the resulting polymer network architecture, it is necessary to determine whether the apparent differences will result in macro-molecular differences for the polymer. Thermally, this is most easily observed by measurement of the glass transition temperature, Tg. To determine the glass transition temperature for these materials, a heat/cool/heat DSC experiment was conducted on the heat and hold samples. The Tg determined was an average between the first and second heating cycles. The observed glass transition temperatures are shown in Table 1 and there is no significant change with the cure heating ramp rate. Additionally, complete cure was verified by the change in the glass transition between the first and second heating cycles. No quantifiable change was observed between the heating cycles.
Ramp rate
Tg
°C/min
°C
1
148.82
5
148.49
10
148.39
15
148.26
20
148.67
3.2 NIR network growth
To further explore the nature of matrix network development, NIR was used to monitor conversion of primary, secondary, and tertiary amines, as well as epoxide concentration as a function of time/temperature. This technique has been proven invaluable as a way to determine both network growth and conversion (Min et al., 1993; Jackson et al., 2011; Frank et al., 2013). Fig. 4 shows plots of concentration of epoxide, primary, secondary, and tertiary amines as a function of time for a series of cure heating ramp rates. All of the plots are similar in behavior; however, as the heating ramp rate is increased, the reaction progresses much more quickly. Despite differences in the apparent kinetic rate of reaction, all systems appear to reach full conversion, within the detection limits of the instrumentation.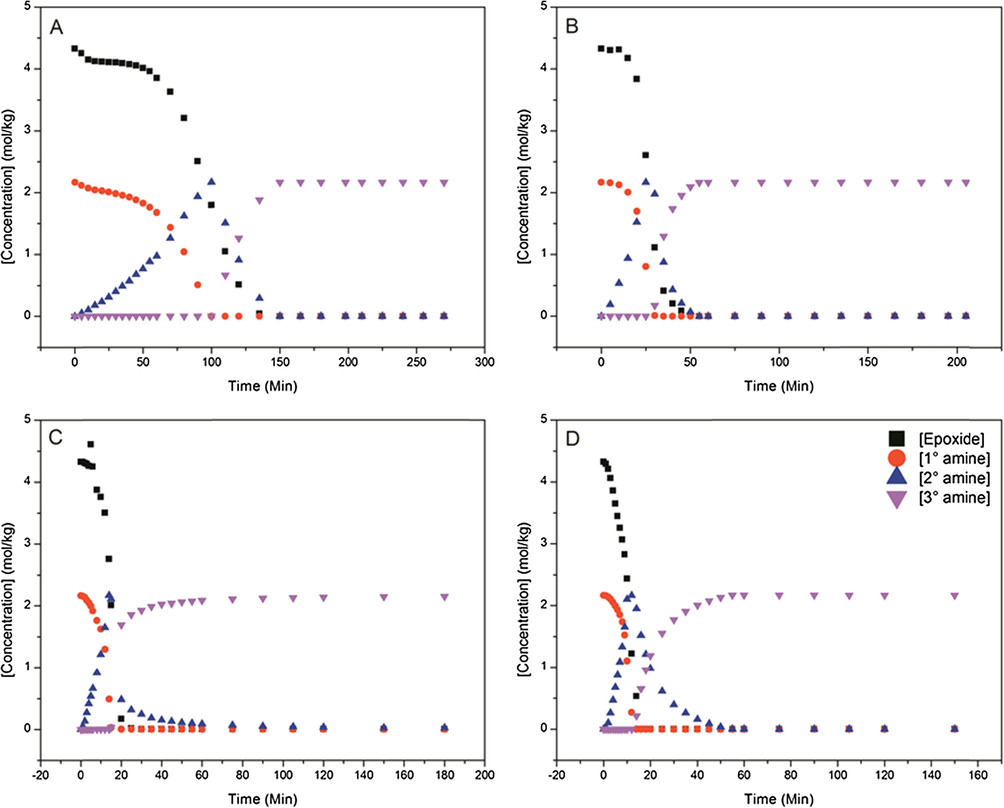
NIR plots of conversion versus time at heating ramp rates of (A) 1 °C/min, (B) 5 °C/min, (C) 10 °C/min, and (D) 15 °C/min.
Similar to previously observed experimentation (Davies et al., 2007), it appears that the primary amine is mainly consumed before secondary amine. This is inferred from the linear increase in secondary amine concentration over time. In all cases, when the primary amine is completely consumed, the secondary amine begins to be consumed. Even near complete consumption of the primary amine, the secondary amine concentration continues to increase in a linear fashion, despite the substantial increase in statistical likelihood of reaction between epoxide and secondary amine. This suggests that the relative reactivities between primary and secondary amines are not equal in this case, or that the reaction between primary and secondary amines has different energies of activation. Furthermore, this suggests that for the slower ramp rates, on average, a more linear network develops that then cross-links after primary amine conversion. At the faster ramp rates, it is most likely that the reaction between primary and secondary amines becomes competitive. This is illustrated in Figs. 5 and 6 and will be discussed in further detail below.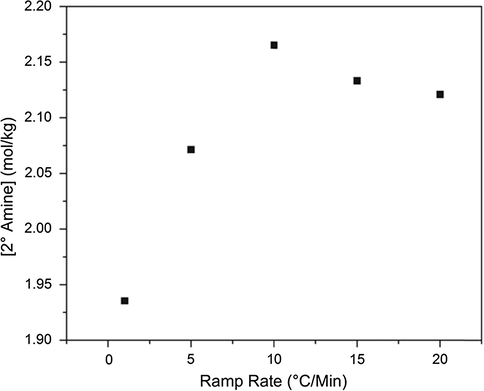
Secondary amine concentration at 75% primary amine conversion for a series of cure heating ramp rates.
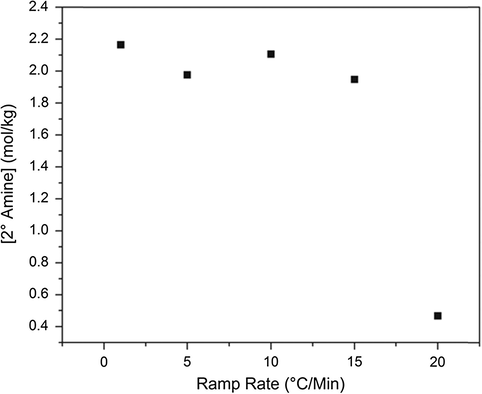
Secondary amine concentration at 95% primary amine conversion for a series of cure heating ramp rates.
It is believed that the differences in activation energy between the primary and secondary amine reactions with epoxide will cause differences in network growth. As previously suggested, this effect can be identified in Figs. 5 and 6. When monitoring the secondary amine conversion at 75% primary amine conversion, if the networks were growing in exactly the same manner, it would be expected that all networks would have the same concentration of secondary amine. However, this is not the case. Similarly, for secondary amine concentration at 95% conversion of primary amine, all systems would be expected to have the same concentration of secondary amine. While this expectation is more closely satisfied at complete primary amine conversion, there are still substantial differences in secondary amine concentrations. For this to be the case, the networks must be growing in a different manner. To attempt to validate the previous hypothesis of a more linear network growth in the slower ramp rate systems, the tertiary amine concentration must also be monitored. Shown in Fig. 7 is a plot of tertiary amine concentration at 75% secondary amine conversion. Holistically, a trend emerges. For the slowest ramp rate system, the most well defined pattern of network growth emerges. As expected at 75% secondary amine conversion, approximately 80% of the maximum possible tertiary amine is achieved. A one-to-one correlation would suggest that a perfectly linear system which then cross-links is generated. However, for the faster ramp rates, the concentration of tertiary amine decreases. As amine can only be primary, secondary, or tertiary, this implies that there must be more primary amine present in the system while secondary amines are reacting, indicating a more globular network growth. Despite apparent differences in network growth, from the DSC data, and also from the NIR plots shown in Fig. 4, it would seem that the networks achieve complete conversion and have the same glass transition temperature. Thus, if a cure rate dependence is observed for this matrix polymer, it must exist on a size scale smaller than either NIR or DSC can determine. As a result, dielectric spectroscopy and free volume hole size characterization were used to probe the network structural differences at the molecular level size scale.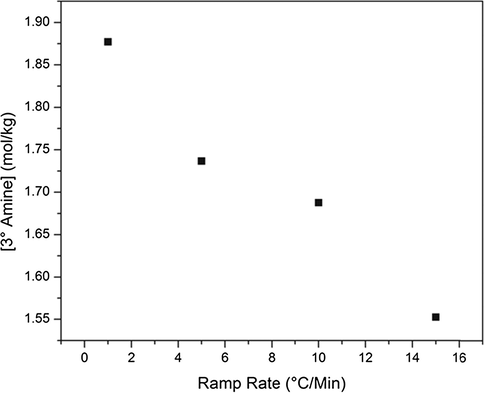
Tertiary amine concentration at 75% secondary amine conversion for a series of cure heating ramp rates.
3.3 Free volume analysis
To determine whether there are local differences in polymer network growth and final structure, the most effective way to observe any changes is by determination of the free volume average hole size, Vh. Inherently, there is always empty space (free volume) between atoms and this is observed using Positron Annihilation Lifetime Spectroscopy (PALS). In PALS a positron is generated which will interact with the matter around it. As a result of the lifetime of this interaction, the Vh can be calculated using a variety of models. The Vh for each cure heating ramp rate is shown in Fig. 8. While changes from approximately 65 to 50 Å3 may seem minimal, this can have a large effect on macro-scale properties such as solvent uptake (Jackson et al., 2011; Frank et al., 2013).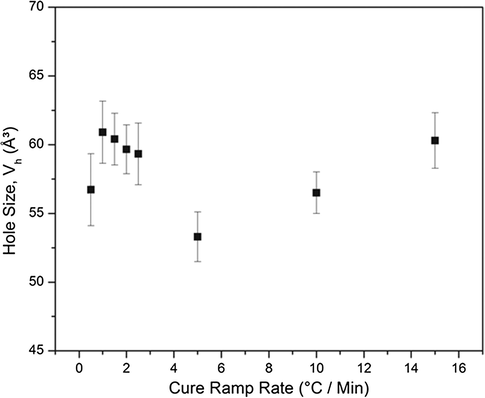
Free volume hole size (Vh) and its dependence on the cure heating ramp rate.
When looking at the network growth data in conjunction with the PALS analysis, specifically the NIR data, the differences in Vh can be explained. As discussed in the NIR section, at the slower ramp rates, there is most likely a major portion of the ramp rate where the activation energy for secondary amine conversion has not been overcome. The network in this case would, on average, grow in a more linear manner that would cross-link after the activation energy barrier was overcome at high temperatures. For the fast heating ramp rates, the primary and secondary amine reactions would, on average, occur simultaneously. If this occurs, then a more globular network growth would be observed, and a difference in free volume would be found over the slower ramp rates that would show a more linear type network growth. This phenomenon would account for the changes in Vh. Interestingly though, where the DSC data suggests that it is the exotherm of the reaction driving conversion at ramp rates above 10 °C/min, there is a difference between the Vh for the 10 and 15 °C/min samples. We attribute this to an increase in the number of nucleation sites for reaction at the very high ramp rates leading to an increased number of regions with increased free volume between them.
3.4 Broadband dielectric spectroscopic analysis
Based on the results from the NIR, free volume, and density results discussed earlier, there is considerable support for molecular level differences in polymer network architecture while maintaining similar long-range cross-link density. If this is truly the case, then the BDS technique should be able to observe differences in the molecular scale relaxations of the epoxy network prepared at different heating ramp rates.
The temperature response of the dielectric tan δ at fixed frequencies of 1.0 Hz and 1.0 kHz for networks prepared at different cure heating ramp rates is shown in Fig. 9. Three relaxation features are evident for all samples namely γ, β, and Tg, in the order of increasing temperature respectively. The weak β relaxation is not evident in Fig. 9B but can be clearly seen upon selecting the measurement frequency to be lower at 1 Hz, as seen in Fig. 9A. Decreasing the frequency by this much increases the time scale over which molecular motions can be sampled by a factor of 1000, and thus helps to capture this motion more effectively.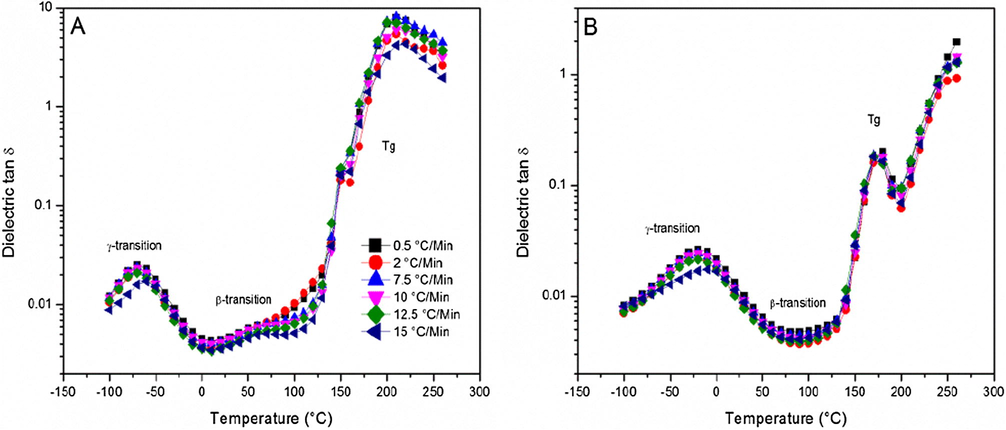
Dielectric tan δ as a function of temperature for a series of heating ramp rates measured at (A) 1.0 Hz and (B) 1.0 kHz.
Solid-state NMR experiments were conducted in our group at different temperatures on selectively deuterated moieties in epoxy polymer networks (Tucker, 2010; Tu et al., 2011) to assist in the assignment of the γ transition. The main result of this NMR study was the assignment of the γ transition to phenyl rings flipping in the DGEBA main chain, which implies adjacent flexible ether linkages. Oleinik reported that chain sections between cross-links are the only flexible elements of a glassy polymer (Oleinik, 1986). These flexible elements would facilitate the flipping of phenyl rings involved in the γ relaxation process. As previously reported, the β relaxation is assigned to local motions of dipoles namely the hydroxyl ether and secondary or tertiary amine groups that were created during cross-linking reactions (Shimbo et al., 1984; Ochi et al., 1986; Mangion and Johari, 1990). The glass transition related relaxation is associated with long-range chain segmental mobility, which in case of samples reported herein depends on the nature and density of cross-links.
In the following sections, the dielectric spectra will be fitted to the widely used Havriliak–Negami (H–N) equation Havriliak and Negami, 1966, 1967 in order to extract more in-depth information related to dynamics of the glass transition and the secondary γ relaxations of epoxy networks formed at variable cure heating ramp rates. The H–N equation states:
3.4.1 The γ relaxation process
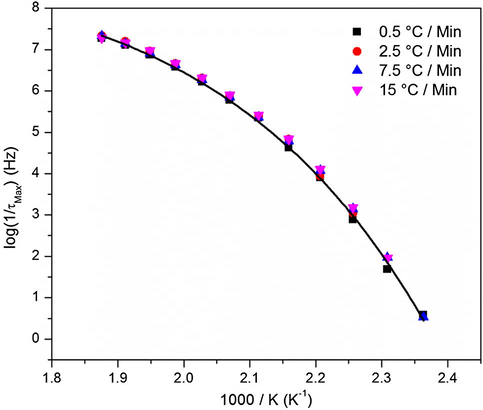
While the glass transition is of great importance in studying thermoset polymer networks, understanding the secondary transitions and their molecular motions are essential for evaluating the mechanical performance of these polymers. Fig. 10 shows the ɛ″ vs. f spectra of the 0.5 °C/min heating ramp rate cured sample and within the temperature range of the γ relaxation process. Peak maxima shown in Fig. 10 shift to higher frequencies as the temperature (T) increases in a typical way and the relaxation times (τmax) extracted from fitting these spectra to the H–N equation exhibit an Arrhenius behavior as depicted in Fig. 11.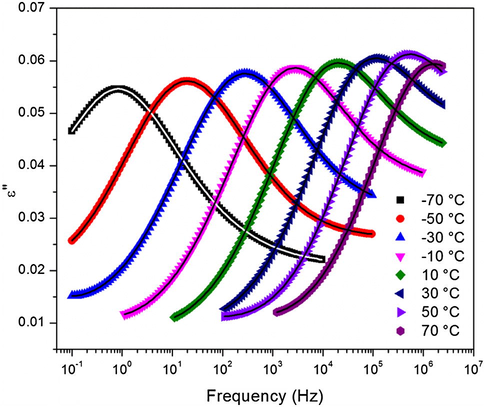
Dielectric loss at different temperatures showing the γ relaxation for the sample cured at a heating ramp rate of 0.5 °C/min.
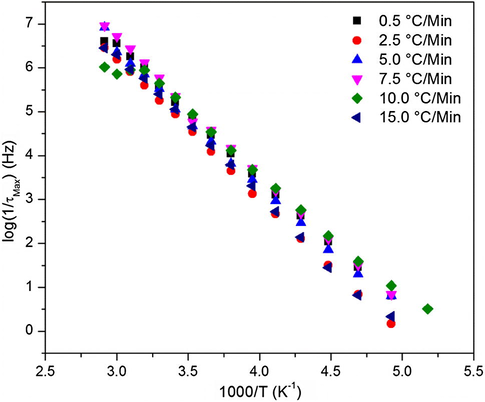
Arrhenius plot for the γ relaxation process exhibited by samples cured at variable heating ramp rates.
Values of the activation energies (Ea) for this motion were extracted using the Arrhenius equation and are tabulated in Table 2:
Ramp rate
Ea
Fit R2
°C/Min
kJ/mol
–
0.5
56.99
0.9988
2.5
60.51
0.9998
5
57.85
0.9961
7.5
58.67
0.9979
10
55.36
0.9977
15
60.93
0.9984
The activation energies shown in Table 2 for this molecular motion seem to be similar implies same local sub-Tg motions for the samples regardless of the cure ramp rate. This energy is in the typical range for secondary relaxations in the glassy state of common polymers.
While very little difference is observed in the activation energies of this process, small changes can be seen in the ɛ″ vs. f spectra at −60 °C, with respect to cure heating ramp rate as depicted in Fig. 12. The dashed line shows shifts in the relaxation peak maxima relative to that of the 0.5 °C/min sample and the solid lines are the H–N fits of the experimental data. There is clearly some peak maxima deviation from the 0.5 °C/min sample, especially for the 2.5, 5.0, and 15.0 °C/min samples but the exact trend cannot be explained. Interestingly the trend seems to coordinate with that found in the free volume hole size, Fig. 8. γ relaxation peak maxima shifts could have to do with the molecular architecture or organization of the molecules in space since the motions themselves must be the same. Despite this claim, at the time of this work, a specific method to test this hypothesis has not been devised.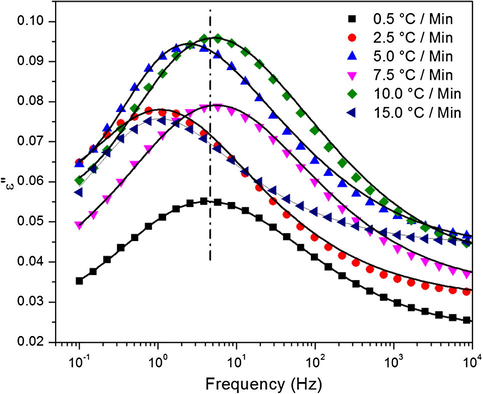
γ relaxation dielectric loss spectra at -60 °C for a series of cure heating ramp rates.
While this transition is slightly dependent on cure heating ramp rate, it is unsurprising that when attempting to observe a cure rate dependence correlation with mechanical properties it cannot be found. With the results for the γ relaxation no or very little difference in mechanical properties would be expected to be found, unless the sensitivity of the test was on par with that of broadband dielectric spectroscopy. This result could also explain why there has been much debate in the field of thermoset materials as to if there is or is not a cure rate dependence of these materials, and why it is so chemistry specific. If chemistry were to be found where the cure heating ramp rate would alter the transitions that occur during the operating/testing window, then a difference would be observed. If this were not the case, then some understated differences, such as free volume, might be observed even when large-scale differences were not. This would be especially relevant for epoxy/amine polymers that exhibit a glass transition temperature at or below room temperature.
3.4.2 The glass transition relaxation region
Shifts in macromolecular motions associated with the glass transition relaxation are displayed in Fig. 13. The signature of polymer Tg relaxations are crests on ɛ″ – f – T response surfaces. The Tg relaxation is associated with long-range chain segmental mobility and its ɛ″ vs. f peak maximum shifts to higher values with increasing temperature in the usual non-Arrhenius fashion. The linear curve segments at low f can be accounted for in terms of dc conduction that in the context of this experiment involves the sampling of charge hopping pathways that become progressively longer at increasingly lower f. In the low frequency region for T > Tg, all log ɛ″ vs. log f plots are linear such that the slopes are around −1.0, which is the signature of dc conduction.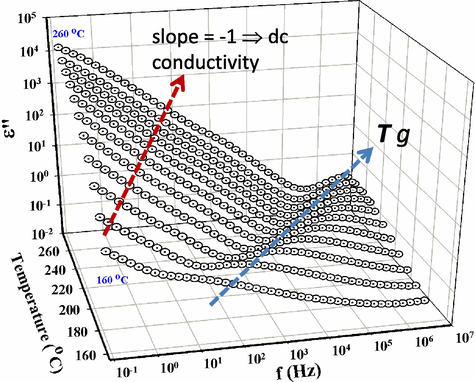
– f – T surfaces for the sample cured at a heating ramp rate of 0.5 °C/min showing the Tg relaxation. Curves are spaced at 10 °C increments from the onset of the Tg relaxation to 260 °C, as indicated. Colored arrows follow the crests of the Tg peak on the surfaces and the dc conductivity signature on the spectra.
The monotonic vertical elevation of these linear segments with increase in temperature can be accounted for in terms of increased dc conductivity according to the equation σdc = 2πɛ0 f ɛ″ that holds in the low f region. At a given f, greater ɛ″ values reflect greater σdc. This, presumably, is caused by increased chain segmental mobility in the rubbery state to which charge motions are coupled. The impurity ions become relatively mobile due to greater chain mobility activated at the onset of the glass transition.
The H–N equation was fitted to the spectra in Fig. 13 in the Tg relaxation region at different temperatures for all samples at different cure heating ramp rates. Then, the dc conductivity term was subtracted point-by-point for the purpose of uncovering loss peaks corresponding to these long-range macromolecular motions. The dc – subtracted loss spectra at 170 °C, shown in Fig. 14, does in fact render the peaks more distinct. The relaxation envelope for all samples revealed to be bimodal indicating the presence of another active process within the Tg region. We believe that this second relaxation, at low f, is due to the Maxwell–Wagner–Sillars (MWS) interfacial polarization process. This process is common viscous liquids and polymers containing some ionic impurities and also in multiphase systems having different dielectric constants and conductivities among their phases (Chen et al., 2011; Atorngitjawat and Runt, 2007; Weiss et al., 1867). The Tg relaxation peak maxima shift to higher frequencies indicating slightly faster chain motions, as the cure ramp rate was increased. This result would be supported by the free volume hole size (Vh) variations showed in Fig. 8.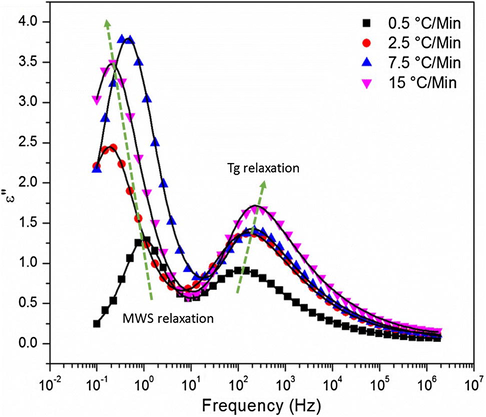
Dielectric loss versus frequency for DGEBF/33DDS at 170 °C for various cure rates. Lines represent the H–N equation fits to the spectra.
As the temperature was increased to 210 °C, Fig. 15, another peak emerges on the left at the very low f side of the spectra. We suggest that this third peak arises from the sample-electrode interfacial polarization relaxation (Chen et al., 2011; Atorngitjawat and Runt, 2007). This suggestion is reinforced by corresponding high ɛ′ values at low f as depicted in Fig. 16a and b for the samples cured at 0.5 and 10 °C/min, respectively. ɛ′ values monotonically shift upward with increase in temperature which can be elucidated in terms of charges in the near-electrode regions attaining more mobility causing greater positive–negative charge separation especially since segmental mobility for T > Tg can facilitate charge hopping (Zhang and Runt, 2004). The peak associated with this feature seems to be very broad and not well-resolved, at this temperature, for the samples cured at 7.5 and 15 °C/min. While this difference is not understood, it may be due to differences in the nature of crosslinking topology among the samples.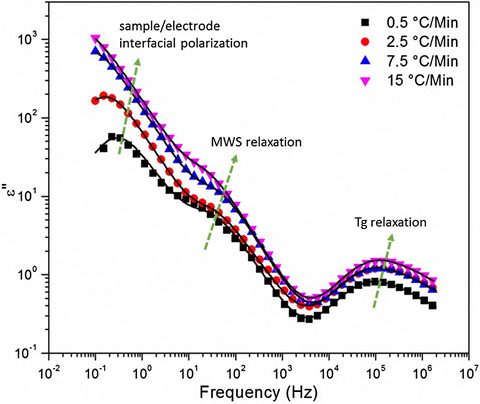
Dielectric loss versus frequency for DGEBF/33DDS at 210 °C for various cure rates. Lines represent the H–N equation fits to the spectra.
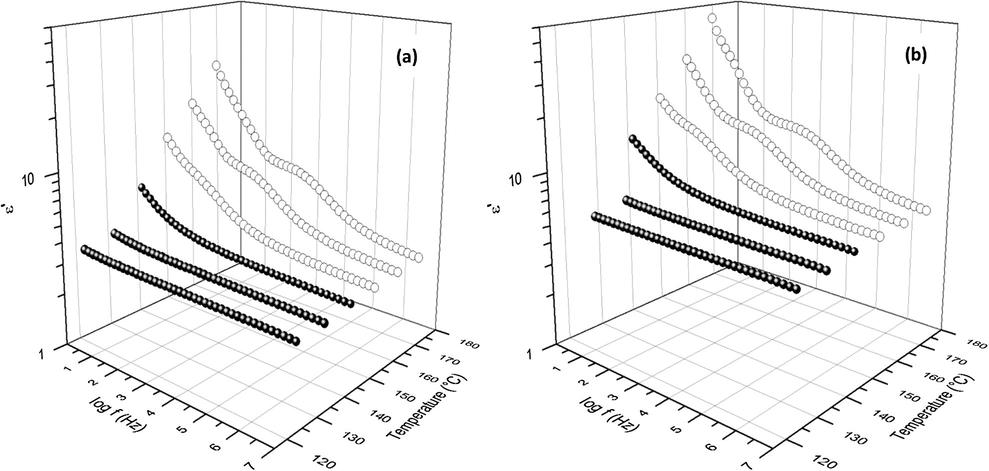
Plot of dielectric storage (
) versus frequency and temperature for the 0.5 °C/min (a) and 10.0 °C/min cure rate samples.
The following section presents a further investigation of the dynamics of the three relaxation processes elucidated within the Tg region. The characteristic relaxation times for each relaxation, τmax, calculated from the H–N equation fitting of the spectra were plotted against the reciprocal of temperature. The Vogel–Fulcher–Tammann–Hesse (VFTH) equation (Vogel, 1921; Fulcher, 1923; Tammann and Hesse, 1926) was fitted to τmax vs. T data for the Tg relaxation:
VFTH plots of the Tg for a series of cure heating ramp rates.
The Vogel temperatures calculated from the VFTH equation fits to the data in Fig. 17 were relatively similar for all samples, as shown in Table 3. This result is consistent with the DSC results presented earlier in Section 3.1, which also suggested similar glass transition temperatures regardless of the cure ramp rate. However, it seems that a very slight difference exists among the Tv values shown in Table 3. As commonly interpreted, higher Tv corresponds to more efficient chain packing, i.e., lower free volume, in a hypothetical equilibrium-like state arrived at by quasi-static cooling. Values of the free volume hole size, shown in Fig. 8 above, decreased reaching a minima for the 5 °C/min sample and then increased again with increasing the heating ramp rate. This behavior seems to be consistent with the increase in Tv values, Table 3, followed with a drop as the heating ramp rate was increased. Perhaps the most efficient chain packing was reached for the samples cured at heating ramp rates of 2.5 to 5 °C/min but this conclusion needs further experimental support.
Ramp rate
Tv
°C/Min
°C
0.5
146.88
2.5
148.84
7.5
145.84
15
143.19
Fig. 18 shows log10 τmax vs. T−1 plots for the MWS interfacial polarization process, which clearly exhibit an Arrhenius behavior for all samples. Values of the activation energies associated with this relaxation are given in Table for each cure heating ramp rate. Ea values given in Table 4 seems to be relatively high. This result is in agreement with the fact that the MWS polarization relaxation arises from a charge motion process thought to be coupled to the long-range segmental motions in many polymers systems (Chen et al., 2011; Atorngitjawat and Runt, 2007).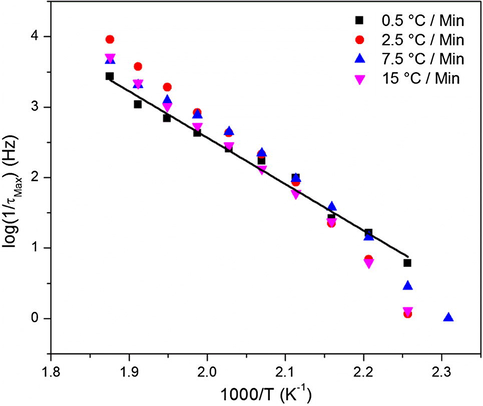
Arrhenius plots of the MWS relaxation peak for a series of cure heating ramp rates.
Ramp rate
Ea
Fit R2
°C/Min
kJ/mol
–
0.5
125.97
0.9854
2.5
185.25
0.9854
7.5
157.44
0.9822
15
169.72
0.9871
By using the H–N equation to fit to the data for the Tg region, the distribution of the relaxation times G(τ) was calculated as follows (Havriliak and Negami, 1967):
G(τ) plots at 170 °C are shown in Fig. 19. This figure illustrates well the molecular level differences that are present when curing at different ramp rates, and can be used to help understand the free volume data presented in Section 3.3. There is a slight shift in the G(τ) peak position for the Tg motion, at approximately 10−3 s, to lower relaxation times with increasing the cure ramp rate. The G(τ) peaks for the MWS relaxation do not show a certain trend but only show that there is no peak for the 0.5 °C/min sample. This data could suggest slight differences in the polymer network architecture for each of the cure heating ramp rates, at least on a short-range size scale. It is postulated that an increase in the network heterogeneity is expected with increasing heating ramp rate. Essentially, the networks grow so quickly that they are not able to re-organize into their most efficient state (lowest energy) before being locked in due to the speed of the reaction. This makes the local environments very different from one another at the faster heating ramp rates, again suggesting that short-range molecular events such as free volume or fluid sensitivity may be greatly impacted by the cure heating ramp rate. The overall results of the BDS measurements say that although the temperature of the molecular motion and the transition are the same, the local environments of the reacted monomers within the network are different, and as the ramp rate is increased, the motions become more varied. Ultimately, this difference could have an impact on the mechanical performance and free volume characteristics at elevated temperatures.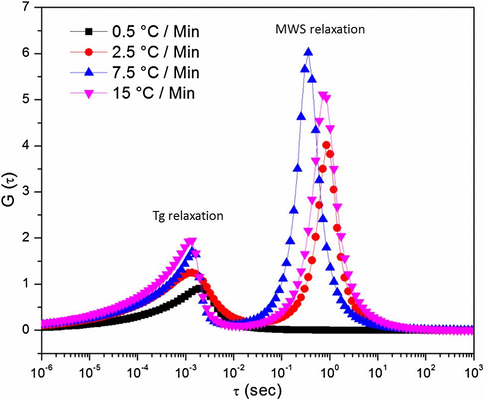
G(τ) plots at 170 °C for a series of cure heating ramp rates.
4 Conclusions
The objective of this work was to discuss the cure heating ramp rate dependence of thermosetting epoxy/amine polymers with high performance composite matrix applications. Before this work, little agreement can be found in the literature on a cure heating ramp rate dependence. We propose that a cure heating rate dependence on matrix polymer formation exists but limited literature agreement has been found for two reasons. First, the dependence is chemistry specific. Secondly, the dependence for the more traditional chemistries is on a size scale that relates only to molecular level events and cannot directly be observed on a macro-scale. To that end, we employed several thermal and spectroscopic techniques to explore cure rate dependence. The polymer matrix studied herein was based on DGEBF/33DDS and was formulated with cure heating ramp rates varying from 0.5 to 20 °C/min. The nature of matrix network development was explored via monitoring the conversion of primary, secondary, tertiary amines, and epoxide groups as a function of cure heating ramp rate, using the DSC and NIR spectroscopy techniques. Despite the differences in network growth revealed from the DSC and NIR data for variable heating ramp rate, it would seem that the networks in all cases achieved complete conversion and have the same glass transition temperature. Therefore, for the matrix polymer and chemistry investigated in this study, a cure rate dependence is thought to exist on a size scale smaller than either NIR or DSC can determine. Consequently, broadband dielectric spectroscopy and free volume hole size (Vh) characterization were used to probe the network structural differences at the molecular level size scale. The Vh decreased as the cure heating ramp rate was increased to reach a minimal value of 50 Å3 for the ramp rate of 5.0 °C/min and then rises again beyond this point. Although changes from approximately 65 to 50 Å3 may seem marginal, this can have a large effect on macro-scale properties such as solvent uptake. Interestingly, Values of the Vogel temperature (Tv) derived from the VFTH fits of the dielectric spectra seem to match the trend of the Vh as the cure heating ramp rate was increased. Tv values increased to a maxima for the 2.5 °C/min sample and then decreased again with increasing the cure heating ramp rate. Higher Tv reflect more effective chain packing, i.e., lower free volume, in a hypothetical equilibrium-like state arrived at by quasi-static cooling. In general, the broadband dielectric spectroscopy measurements suggest different local environments around the chains within the network although the Tg and sub-Tg related chain motions appear to be the same for the samples cured at variable heating ramp rates. This difference would have an impact on the mechanical performance, solvent uptake, and free volume characteristics during the operating/testing window of these composites in aerospace applications.
Acknowledgments
The authors gratefully acknowledge Dr. Joycelyn Harrison, AFOSR Award Number FA9550-13-1-0103; and Dr. Gregg Bogucki and Dr. Stephen Heinz from Boeing Research and Technology for their kind financial support and collaboration.
MKH would like to acknowledge the Qatar University’s financial support through the Center for Advanced Materials’ Start-Up grant.
References
- Macromolecules. 2007;40:991-996.
- Polymer. 1998;39:1929-1937.
- Eur. Polym. J.. 2011;47:1936-1948.
- Compos. Sci. Technol.. 2007;67:1892-1899.
- Chem Phys. 1981;63:51.
- Polymer. 2013;54:403-410.
- J. Am. Ceram. Soc.. 1923;8:339.
- Polymer. 1996;37:2195-2200.
- J. Polym. Sci. Polym. Symp.. 1966;14:99.
- Polymer. 1967;8:161.
- Jackson, M., 2011. PhD Thesis, The University of Southern Mississippi.
- Polymer. 2011;52:4528-4535.
- Polym. Test. 2005;24:886-892.
- J. Comput. Phys. Commun.. 1981;23:307.
- Broadband Dielectric Spectroscopy. Berlin: Springer; 2003. p 64
- J. Polym. Sci. Part B Polym. Phys.. 1990;28:71-83.
- Macromolecules. 1989;22:4483.
- Polymer. 1993;34:3620-3627.
- Carbon Fibers and their Composites. Boca Raton: CRC Press; 2005.
- J. Polym. Sci. Part B Polym. Phys.. 1986;24:1271-1282.
- Epoxy-aromatic amine networks in the glassy state: structure and properties. In: Dušek K., ed. Advances in Polymer Science: Epoxy Resins and Composites IV. Vol vol. 80. Verlag Berlin Heidelberg: Springer; 1986. p. :49-99.
- [Google Scholar]
- Olson, B., Lin, J., Nazarenko, S., Jamieson, A., 2003. 36, 7618.
- J. Appl. Polym. Sci.. 1992;46:1863-1873.
- Thermochim. Acta. 2002;383:119-127.
- J. Polym. Sci. Part B Polym. Phys.. 1984;22:1461-1470.
- Z. Anorg. Allgem. Chem.. 1926;156:245.
- Society for the Advancement of Material and Process Engineering. Fort Worth, TX: International Symposium Proceedings; 2011. October
- Tucker, S.J., 2010. PhD Thesis, The University of Southern Mississippi.
- Compos. Sci. Technol.. 2002;62:29-40.
- Phys. Z. 1921;22:645.
- Macromolecules. 1996;29:1867-1873.
- Polymer. 1867;1991:32.
- J. Phys. Chem. B. 2004;108:6295-6302.
- Compos. Sci. Technol.. 2009;69:1172-1179.


