

Translate this page into:
New analysis of clopidogrel bisulfate in plavix tablet and human biological fluids utilizing chemically modified carbon paste sensor
-
Received: ,
Accepted: ,
This article was originally published by Elsevier and was migrated to Scientific Scholar after the change of Publisher.
Peer review under responsibility of King Saud University.
Abstract
The fabrication and the performance response characteristics of a sensitive, selective, simple, and rapid sensor for the determination of clopidogrel bisulfate (CLO-H2SO4) were described. The constructed carbon paste sensor comprised of an ion-pair based on clopidogrel with silicotungstate (CLO-ST) where this study included: composition, usable pH range, response time and temperature. The sensor exhibited a wide linear dynamic concentration ranging from 1.00 × 10⁻⁷ to 1.00 × 10⁻² and the usable pH ranges from 1.2 to 4.8 with the response time ranging from 5 to 8 s which is much faster compared to liquid ISEs with a detection limit equalling 0.34 nM. The selectivity of the sensor (CLO-H2SO4) was applied with respect to many of organic and inorganic cations, amino acids and sugars. The sensor had applications in bulk powder, tablets, humans (serum-urine) and in monitoring Plavix tablets’ dissolution rates. The obtained results were statistically analyzed for both accuracy and precision and were compared using the US pharmacopeial method where no significant difference was observed.
Keywords
Clopidogrel bisulfate (CLO-H2SO4)
Carbon-paste sensor
Potentiometry
Dissolution rate

1 Introduction
Clopidogrel bisulfate is methyl (+)-(S)-α-(2-chlorophenyl)-6,7-dihydrothieno[3,2-c]pyridine-5(4H)-acetate sulfate (1:1) with molecular formula C16H16ClNO2S.H2SO4 and its molecular mass equals 419.9 as shown in Fig. 1 Plavix is a trademark prescription medicine used to treat people who have any of the following: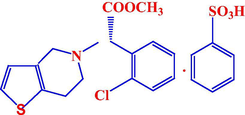
The chemical structure of clopidogrel bisulfate.
Heart attack, Stroke or Recent Stroke, Chest Pain due to Heart problems, Poor circulation in their legs (peripheral arterial disease), Acute Coronary Syndrome (ACS), and Established Peripheral Arterial Disease. Clopidogrel reduces the risk of heart attack and stroke in people who have cardiovascular disorders (Budavari, 2011; Henein, 2006; Gomes et al., 2004; Taubert et al., 2004). Clopidogrel reduces the chance of arterial blockage, by inhibiting platelet aggregation, thus preventing heart attacks and strokes.
The literature survey review refers to a variety of analytical methods such as spectrophotometric methods for the determination of CLO (YogitaShete et al., 2009; Game et al., 2010; Gurav et al., 2011; Cholke et al., 2012; Rujput et al., 2008). Quantitatively kinetic spectrophotometric for CLO, petaxolol and imidril in its dosage form (El Yazbi et al., 2010). Other methods included nonenzymatic and enzymatic chiral inversion of CLO utilizing NMR and the HPLC chiral method (Reist et al., 2000). The analysis by GC–MS for metabolite carboxylic acid of CLO in serum and plasma (Lagorce et al., 1998), reverse phase HPLC with UV detection for estimation of CLO in its dosage form were presented in Shrivastava et al. (2008), Alarfaj (2010), Panda (2010), Londhe et al. (2011), Sultana et al. (2011), HPTLC Petal et al., 2008; Sinha et al., 2009 and HPLC (Saber et al., 2007; Shu-qin et al., 2008; Javed et al., 2011). CLO was determined in the presence of its human fluid by mass spectrometry coupled with LC (Shin and Yoo, 2007; Takahashi et al., 2008), and HPLCMS/MS (Silvestro et al., 2011). Also capillary electrophoretic (Fayed et al., 2009; Karazniewicz et al., 2010; Serra et al., 2010), and voltammetric (Dermis and Aydogan, 2010) methods were reported. No methods are found in the literature for the determination of CLO by chemical modified carbon paste (CMCP).
Applications in electrochemistry and electroanalysis make carbon paste-based sensors one of the most popular sensor materials with almost unlimited applicability in basic research, highly specialized investigations, as well as in practically oriented electroanalysis (Moghaddam et al., 2014; Švancara et al., 2009a,b).
This work describes the fabrication, construction with sensor potentiometric characterization, and application of clopidogrel-chemically modified carbon paste sensors (CLO-CMCPSs), using the following ion-pairs; clopidogrel silicotungstate (CLO-ST), clopidogrel silicomolybdate (CLO-SM), clopidogrel phosphotungstate (CLO-PT), clopidogrel phosphomolybdate (CLO-PM), clopidogrel tetraphenylborate (CLO-TPB) and clopidogrel reineckate (CLO-Rein) with solvent mediator 2-Nitrophenyl phenyl ether (2-NPPE) and compares them with sensors previously reported (Saber et al., 2008; Bin-Ibrahim et al., 2012).
2 Experimental
2.1 Chemicals and materials
All chemicals used for preparation of solutions were of analytical grade. Doubly distilled water was used throughout all the experiments. Clopidogrel bisulfate and its dosage form (Plavix, 75 mg /tablet) were provided by Sanofi Aventis Company Cairo-A.R.E. Tributyl phthalate (TBP), tricresyl phthalate (TCP), graphite powder, dibutyl phthalate (DBP), dioctyl phthalate (DOP), 2-nitrophenyl phenyl ether (2-NPPE), ammonium reineckate (AmmRein), sodium tetraphenylborate (NaTPB), silicotungstic acid (STA), silicomolybdic acid (SMA), phosphomolybdic acid (PMA), and phosphotungstic acid (PTA), were selective products from Aldrich.
0.5 M chloride solutions of each of the following cations: NH4+, K+, Na+, Zn2+, Ni2+, Co2+, Cu2+, Mg2+, Ba2+, Mn2+, Cr3+, and Fe3+solutions (1000 μg ml−1) were obtained from Merck. Glucose anhydrous, lactose monohydrate, maltose, urea, ascorbic acid, aspirin, l-threonine, l-lysine, l-cystine, and l-glycine were obtained from Aldrich. Serum was used within 24 h as provided by VACSERA (Giza, Egypt) while urine samples were obtained from healthy volunteers. Corn oil, sodium hydroxide and hydrochloric acid are from NODCAR.
2.2 The Electrochemical system
The potentiometric measurements were carried out with a Jenway 3515 digital pH/mV meter. A WTW-packed saturated calomel sensor (SCE) was used as an external reference sensor. The electrochemical system was as follows: CMCPS/test solution//SCE. The dissolution profile was studied using the USP XXXII (United States Pharmacopeia, 2009) method with the paddle apparatus II (Liddell et al., 2007). The apparatuses used for this purpose is model “SR8Plus”, CA USA Hanson Research, with number ”73–100-116”) and the spectrophotometer double beam instrument UV-1800–2011 Shimadzu (Japan).
2.3 Sensor preparation
Chemically modified carbon paste sensors were prepared as previously described (Khorshid and Issa, 2014). The sensor was used directly for potentiometric measurements without preconditioning requirements. A fresh surface of the paste was obtained by squeezing more out. The surplus paste was wiped out and the freshly exposed surface was polished on a paper until the surface showed shiny appearance.
2.4 Construction of the calibration graphs
Different compositions covering the ranges of 0.5–5% of CLO were prepared. The measured potential was recorded using the present sensor. Data were plotted as potential versus logarithm of the drug concentration CLO+ activity and the calibration graph was used for subsequent determination of unknown drug concentration.
2.5 Effect of pH
The effect of pH of the test solution on the sensor was investigated by measuring its potential in solutions prepared in the concentration range of 1.0 × 10⁻⁵–1.0 × 10⁻³ M by serial dilution. The sample solution pH was monitored simultaneously with a conventional glass pH sensor. The emf readings were taken after the potential reached a constant value. The mV-readings were plotted against the pH-values for the different concentrations.
2.6 Effect of temperature on the sensor potential
The thermal stability of the sensors with calibration graphs was studied covering the range of 25–50 °C of different test solution-temperatures. The values of E° were plotted versus (t-25) in the estimation of the thermal coefficients of the sensors. The isothermal coefficient (dE°/dt) of the cell represents the slope of this line obtained by plotting of E°cell versus (t-25) and was calculated for each sensor by the following equation (Antropov’s equation):
By subtraction of the standard sensor potential of the calomel sensor (241.2, 234.4, 230.88 and 223.57 mV) at different temperatures (25, 35, 40 and 50 °C) the values of the standard potentials of sensors (E°elec.) were calculated.
2.7 Sensor selectivity
The matched potential method (MPM) (Umezawa et al., 2000, 1995) was applied as the previously reported method (Khorshid and Issa, 2014).
The following equation is used to calculate the selectivity values of : where: is the initial concentration of drug, adrug is the activity of the added drug and aj is the activity of the added interfering ion producing the same increase in potential.
The separate solutions method (SSM) (Guilbault et al., 1976) was applied, to confirm (MPM):
Two potential values were measured for the same concentration of the drug and the interferents. The selectivity values of are calculated using the following equation: where: E1 and E2 are the sensor potentials of 10−3 M solution of each of the CLO drug and interfering cation, Jz+, respectively and S is the slope of the calibration graph.
2.8 Potentiometric determination of CLO
Small portions (0.1 ml) of standard 10−2 M CLO solution were added to 50 ml water-containing different concentrations of drug ranging from 10−6 to 10−4 M or its pharmaceutical dosage form using the following equation: where Cx is the concentration to be determined, Vx is the volume of the original sample solution, Vs and Cs are the volume and concentration of the standard solution added to the sample to be analyzed, respectively, ΔE is the change in potential after addition of certain volume of standard solution, and S is the slope of the calibration graph. Unknown drug concentration was determined from the graph produced by plotting the logarithm of CLO+ activity versus the potential.
In the potentiometric titrations different concentrations that ranged from 2.09 to 41.99 mg of drug were dissolved in 50 ml bi-distilled water. Different volumes of this solution (1.0–5.0 mL) were taken and subjected against 0.0025 M STA, 0.0025 SMA, 0.0033 PTA, 0.0033 PMA, 0.01 M (NaTPB and AmmRein) using the sensor(s). Conventional S-shaped curves with first and second plots were used to determine the end points.
2.9 Determination of CLO in plavix
For sampling of tablets, five plavix tablets (75 mg/tablet) were powdered together to fine powder. An accurately weighed portion was taken from this powder, was added to 50 ml bidistilled water and the solution was completed to the mark with bidistilled water then shaken. The standard addition technique was applied for the potentiometric determination.
2.10 Content uniformity assay of plavix tablets<905> (Liddell et al., 2007)
One tablet of Plavix (75 mg/tablet) was immersed in the measuring flask and adjusted to pH 1; for measuring each sensor it was immediately immersed in the sample solution three times and then washed between each individual measurement with distilled water to reach steady potential. The content uniformity was evaluated from the calibration graph by using the mean potential. For the spectrophotometric measurements by employing UV absorbance λ max 240 nm with the standard solution.
2.11 Determination of CLO in biological fluids
2.11.1 In serum
One mL of standard drug solution with 1 × 10⁻³, 1 × 10⁻⁴ and 1 × 10⁻⁵ M was added into three centrifugation 20-ml stoppered shaking tubes (Bin-Ibrahim et al., 2012). Solution in each tube of 9 ml of serum and 0.1 N acetate buffers was added to serum solution dropwise until the suitable pH was obtained. The tubes were shaken well for 1 min and 10.0 mL of diethyl ether was added to each tube and centrifuged for 2 min at 1500 rpm. Then, the deproteinated layer was transferred to a 100-mL measuring flask and completed to the mark using bidistilled water. The modified sensor was immersed in conjunction with the reference sensor in these solutions and then washed with water between measurements. The emf produced for each solution was measured by the proposed sensor, and the concentration of CLO-H2SO4 was determined from the corresponding sensor calibration and standard addition methods.
2.12 In spiked urine
For urine analysis, different quantities of the drug and 5 ml urine were transferred to a 100 ml volumetric flask and left stirred for 5 min, completed to the mark with doubly bidistilled water and a small volume of (0.1–2.0 ml) 0.01 M HCl was added to give solutions of pH ranging from 4 to 5 and concentrations from 1.0 × 10⁻⁶ to 5.0 × 10⁻⁴ M drug. These solutions were subjected to the standard addition method for drug determination.
2.13 Dissolution <711> (Liddell et al., 2007)
One tablet of Plavix (75 mg/tablet) was placed in the vessel of instrument apparatus II. In vitro release study the dissolution medium (900 ml of 0.01 M HCl) pH 1.2 was maintained at 37 ± 0.5 °C for 2 h. The clopidogrel was kept in a hard gelatin capsule so the vessel was rotated at 50 rpm. At appropriate time intervals, the potential values were recorded using the clopidogrel sensor in conjunction with saturated calomel sensor (SCE) reference sensor and the amount of clopidogrel released was calculated from the calibration graph. For the spectrophotometric measurements, 5.0 ml aliquots of the dissolution solution were withdrawn, filtered, diluted with 0.01 M HCl and the concentration of samples was analyzed using a UV spectrophotometer (1800, Shimadzu, Japan) and the absorbencies were measured at λ max 240 nm. A calibration graph was used for drug release calculation.
3 Result and discussion
3.1 Composition and performance characteristics of CLO sensors
The paste with no exchangers displayed no measurable response toward clopidogrel (CLO+) ion. For this purpose, the ion-associates of CLO4ST, CLO4SM, CLO3PT, CLO3PM, CLO-TPB and CLO-Rein were prepared. The chemical composition of the precipitates was identified and confirmed by elemental analysis (C, H, and N) at the Microanalysis Center, Cairo University, Egypt. The results are shown in Table 1.
Ion-associate
Color
Tentative formulae
C%
H%
N%
CLO4-ST
(Off-white)
[C16H16 ClNO2S]4 [SiW12O40]
Found
23.25
1.96
1.66
(Calc.)
23.28
1.94
1.69
CLO4-SM
(Buff)
[C16H16 ClNO2S]4 [SiMo12O40]
Found
34.25
2.80
2.41
(Calc.)
34.28
2.86
2.39
CLO3-PT
(Y. white)
[C16H16 ClNO2S]3 [PW12O40]
Found
17.40
1.44
1.25
(Calc.)
17.45
1.45
1.27
CLO3-PM
(Faint yellow)
[C16H16 ClNO2S]3 [PMo12O40]
Found
25.66
2.16
1.86
(Calc.)
25.68
2.14
1.87
CLO-TPB
(White)
[C16H16 ClNO2S] [C24H20B]
Found
64.93
4.80
1.87
(Calc.)
64.94
4.87
1.89
CLO-Rein
(Faint pink)
[C16H16 ClNO2S] [Cr(NH3)2(SCN)4]
Found
26.11
2.97
13.24
(Calc.)
26.00
2.98
13.27
While the investigated as modifiers for carbon paste sensors selective to clopidogrel as shown in Table 2. The influence of the binder type and concentration on the characteristics of the studied sensors was investigated by using six binders with different polarities including 2-NPPE, TCP, DOP DBP, TBP and Corn Oil.
Composition% w/w
Ion-exchanger
Graphite
2-NPPE
Slope (mV/decade)
Linear range (M)
CLO4ST
1.0
54.0
45.0
55.5 ± 0.5
1.0 × 10⁻⁵–5.0 × 10⁻³
3.0
54.0
43.0
58.9 ± 1.0
5.0 × 10⁻⁶–1.0 × 10⁻²
5.0
54.0
41.0
60.0 ± 0.5⁎
1.0 × 10⁻⁷–1.0 × 10⁻²
CLO4SM
1.0
54.0
45.0
48.7 ± 1.5
5.0 × 10⁻⁵–5.0 × 10⁻³
3.0
54.0
43.0
57.9 ± 0.5
5.0 × 10⁻⁵–5.0 × 10⁻³
5.0
54.0
41.0
56.3 ± 1.5
8.0 × 10⁻⁵–5.0 × 10⁻³
CLO3PT
1.0
54.0
45.0
56.7 ± 1.0
5.0 × 10⁻⁵–1.0 × 10⁻³
3.0
54.0
43.0
51.5 ± 1.0
5.0 × 10⁻⁶–5.0 × 10⁻³
5.0
54.0
41.0
58.5 ± 0.5
1.0 × 1 0−6–1.0 × 10⁻²
CLO3PM
1.0
54.0
45.0
53.2 ± 1.1
5.0 × 10⁻⁵–1.0 × 10⁻²
3.0
54.0
43.0
56.1 ± 1.2
5.0 × 10⁻⁵–1.0 × 10⁻²
5.0
54.0
41.0
56.0 ± 0.8
5.0 × 10⁻⁵–1.0 × 10⁻²
CLOTPB
1.0
54.0
45.0
56.0 ± 1.7
1.0 × 10⁻⁵–1.0 × 10⁻²
3.0
54.0
43.0
53.3 ± 1.1
3.0 × 10⁻⁵–8.0 × 10⁻³
5.0
54.0
41.0
57.6 ± 1.5
5.0 × 10⁻⁶–1.0 × 10⁻²
CLORein
1.0
54.0
45.0
55.0 ± 1.7
5.0 × 10⁻⁵–1.0 × 10⁻²
3.0
54.0
43.0
52.3 ± 1.1
5.0 × 10⁻⁵–8.0 × 10⁻³
5.0
54.0
41.0
57.5 ± 1.5
7.0 × 10⁻⁶–1.0 × 10⁻²
Binders
2-NPPE+
54.0
41.0
60.0 ± 0.5
1.0 × 10⁻⁷–1.0 × 10⁻²
TCP
54.0
41.0
58.5 ± 0.5
5.0 × 10⁻⁷–1.0 × 10⁻²
DOP
54.0
41.0
56.8 ± 0.5
1.0 × 10⁻⁶–5.0 × 10⁻³
DBP
54.0
41.0
53.2 ± 0.5
5.0 × 10⁻⁶–5.0 × 10⁻³
TBP
54.0
41.0
52.0 ± 0.5
1.0 × 10⁻⁷–5.0 × 10⁻³
Corn Oil (Afia)
54.0
41.0
57.0 ± 0.5
5.0 × 10⁻⁸–1.0 × 10⁻⁴
Different binder/graphite (w/w) ratios were studied. The sensor with 2-NPPE as a solvent mediator produced the best response, as shown in Fig. 2, likely due to better dielectric characteristics of 2-NPPE compared to other solvents, and the ability of 2-NPPE to extract clopidogrel ions from the aqueous solution to the organic paste phase.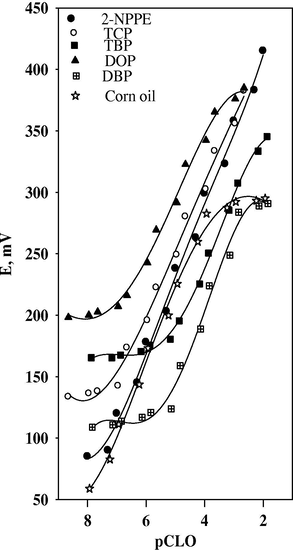
Effect of different plasticizers on the response of 5% CLO-ST.
Among the different compositions studied, a paste containing ion-exchanger complex 5.0 wt% CLO4ST, 54.0 wt% graphite, and 41.0 wt% 2-NPPE exhibited the best response characteristics and also the lowest detection limit. Therefore, this composition was used to study various operation parameters of the sensor and the optimum composition for the best sensor is given in Table 3. This sensor was chosen in this study and its electrochemical performance characteristics were systematically evaluated according to IUPAC recommendation (Guilbault et al., 1976; Linder and Umezawa, 2008).
Sensor-composition (W/W%)
(5% CLO4ST,54% graphite, 41% 2-NPPE)
Slope (mV/decade)
60.0 ± 0.5
Correlation coefficient (r)
0.999
Limit of detection (M)
3.5 × 10⁻⁸
Linear range (M)
1.0 × 10⁻⁷–1.0 × 10⁻²
Working pH range
1.2–4.8
Response time (s)
⩽8
Accuracy (%)
99.87 ± 0.177
Standard deviation (%)
0.326
Robustness
99.79 ± 0.23
Ruggedness
99.83 ± 0.26
3.2 Reproducibility of the sensor
The repeatability of the potential reading of the CLO-ST/CMCP sensor was examined by subsequent measurements in 1.0 × 10⁻³ M CLO-H2SO4 solution immediately after measuring the first set of solutions at 1.0 × 10⁻⁴ M CLO-H2SO4. The standard deviation for 5 replicate measurements of emf was found to be 0.473 in 1 × 10⁻⁴ M solution and 0.816 in 1 × 10⁻³ solution.
It was noticed that the slope of the calibration graph obtained by CLO-ST/CMCPS was nearly constant by polishing for any time taken days and then starts to decrease gradually without polishing so it consider as a new sensor with every one polishing to the sensor. After any period of time a new section from the master paste was found to function properly.
3.3 Dynamic response time
The dynamic response time (Skoog et al., 1997) of sensor was tested by measuring the time required to achieve a steady-state potential (within ± 1 mV) after successive immersions of the sensor in a series of drug solutions, each having a 10-fold increase in concentration from 1.0 × 10⁻⁷ to 1.0 × 10⁻² M. In this study, practical response time was recorded by increasing CLO concentration by up to 10-fold. When the sensor was transferred from one concentration solution to another one, it was stabilized to a value higher than its value (8 s), which may be due to its memory effect. The sensor yielded steady potential within 10–12 s. This is most probably due to the fast exchange kinetics of association–dissociation of clopidogrel ion with the ionophores at the solution–paste interface. The potential–time plot for the response of the sensor CLO-ST is shown in Fig. 3.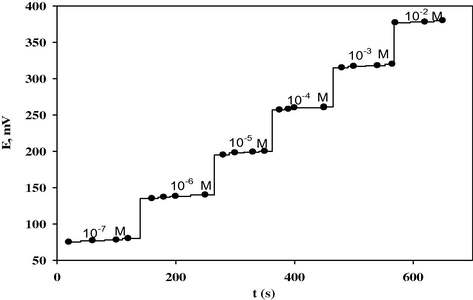
Potential-time plot for response of the CLO-ST/CMCPS.
3.4 Effect of pH
The potential pH profile obtained indicates that the responses of the sensors are fairly constant over the pH range of 1.2–4.8; in this range the sensor can be safely used for CLO determination. For quantitative measurements with ion selective sensors, studies were carried out to reach the optimum experimental conditions. Therefore, the pH range from 1.2 to 4.8 was assumed to be the working pH range of the sensors. It can be seen from Fig. 4 that at pH values lower than the previously mentioned pH ranges, the potential readings increase which can be related to interference of hydronium ion while at pH values higher than pH 4.8, the potential readings decrease gradually due to the formation of free base of the drug and decrease of the protonated species in the test solutions as shown in Fig. 4.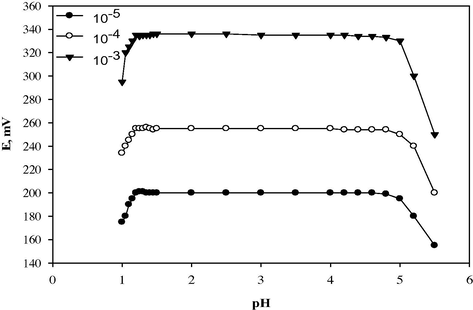
Effect of pH on the response of CLO-ST/CMCPS.
3.5 Effect of temperature
3.5.1 Thermal stability of the sensors
To study the thermal stability of the sensors, calibration graphs (emf, mV vs. pDrug) were constructed at different test solution temperatures covering the range of 25–50 °C. The results indicate that the slopes of the calibration graphs are still in the Nernstian range in spite of the increase of the temperature of the test solutions up to 50 °C as shown in Fig. 5a.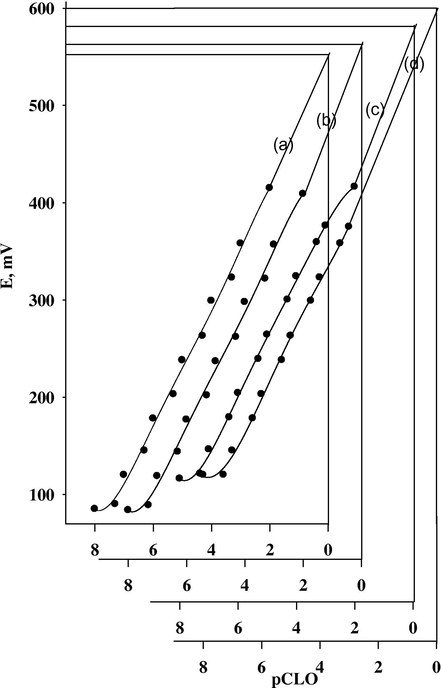
Calibration graphs for CLO-ST/CMCPS at the test solution temperatures 25 °C (a), 35 °C (b), 40 °C (c) and 50 °C (d).
3.5.2 Determination of the thermal coefficient of the sensors
The potential of ion-selective sensors is usually affected by the temperature of the test solution. A thermally stable sensor is characterized by low thermal temperature coefficient. This means the successful applicability of the sensor over a wide range of temperatures. To calculate the thermal coefficient of the cell (dE°/dt)cell, the standard cell potentials, E°cell, were determined at different temperatures from the respective calibration plots as the intercept of these plots at p Drug = 0. Knowing that E°cell is related to (dE°/dt) by (Antropov’s equation):
Plot of E°cell versus (t-25) °C produced a straight line; the slope of this line is taken as the thermal coefficient of the cell, as shown in Fig. 5b. The value of the standard potentials of sensor (E°elec.) was calculated after the subtraction of the standard sensor potential of the calomel sensor at different temperatures (the values are 241.2, 234.4, 230.88 and 223.57 mV at 25, 35, 40 and 50 °C, respectively). Plots of (E°elec.) versus (t-25) °C gave a straight line. The slope of the line was taken as the thermal coefficient of the sensor.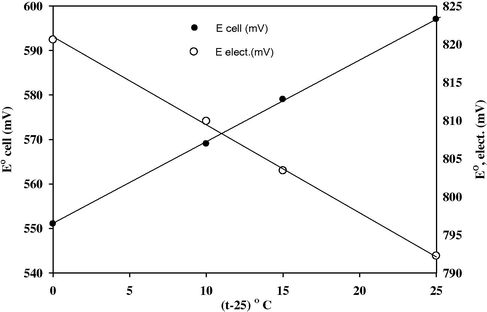
Variation of standard electrode potential and standard potential of the cell containing CLO-ST/CMCPS with changes of test solution temperatures.
The isothermal coefficient (dEelec./dt) of the sensor was calculated and found to be ∼0.0001 V °C−1 and (dEcell/dt) equals ∼0.0005 V °C−1. These values indicate a fairly high thermal stability of the sensor within the temperature range investigated and show no large deviation from the theoretical Nernstian behavior.
3.6 Selectivity of the sensor
The selectivity coefficients presented in Table 4 indicate that, CLO-ST sensor is highly selective to clopidogrel cation. Most inorganic cations do not interfere because of the difference in their mobility and permeability as compared to clopidogrel cation. In the case of sugars and amino acids the high selectivity is related to the difference in polarity and lipophilic nature of their molecules relative to clopidogrel cation.
Interferentb
MPMa
SSM
Interferentb
MPMa
SSM
K+
2.88
3.15
Cr3+
3.33
4.20
Na+
2.95
3.33
Maltose
3.52
---
NH4+
2.65
2.93
Glucose
3.50
---
Ba2+
3.21
3.55
Lactose
3.54
---
Cu2+
3.20
3.62
Urea
3.23
---
Co2+
3.11
3.55
Ascorbic acid
3.30
---
Ni2+
3.19
3.65
Aspirin
1.15
---
Mn2+
2.56
3.11
l-Lysine
3.34
---
Mg2+
2.89
3.36
l-Cystine
3.20
---
Zn2+
2.67
3.28
l-Glycine
3.19
---
Fe3+
3.27
3.76
l-Theronine
3.44
---
3.7 Quantification of CLO
In order to assess the validity of the proposed sensor, the analytical applications involve determination of the drug in its bulk powder, pharmaceutical preparation (Plavix 75 mg) and biological fluids serum & urine was applied. Applying the standard addition method (Guilbault et al., 1976), the percentage recovery for determinations of CLO in pure solution, Plavix Tablets and in spiked urine & human serum ranged from 98.2% to 99.3%, 98.0–99.0, 98.3–99.0 and 97.6–98.3 respectively, (Table 5).
Taken (mg)
Recovery (%)
R.S.D.%
Taken (mg)
Recovery (%)
R.S.D.%
I-Standard addition methoda
Bulk powder
Plavix tablets
2.1
99.1
0.63
2.1
99.0
0.22
4.2
99.3
0.55
4.2
98.9
0.48
6.3
99.0
0.81
6.3
98.0
0.51
8.4
98.2
0.64
II-Calibration curve method
Bulk powder
Plavix tablets
6.3
99.3
2.1
98.4
8.4
98.6
4.2
98.5
12.6
98.0
6.3
98.7
Spiked human seruma
Spiked urinea
2.1
98.3
0.67
2.1
99.0
0.21
4.2
98.0
0.48
4.2
98.6
0.24
6.3
97.6
1.09
6.3
98.3
0.43
III-Potentiometric titrations
Bulk powder
Plavix tablets
STA as titrant
6.3
99.6
0.50
98.5
0.65
8.4
99.1
0.77
98.1
1.41
12.6
99.0
0.89
98.0
1.08
21.0
98.2
0.99
97.3
0.97
PTA as titrant
4.2
99.3
0.77
99.0
1.05
12.6
98.7
0.59
98.6
1.04
21.0
98.0
0.47
98.5
1.18
29.4
98.0
0.68
98.2
0.96
42.0
97.6
0.78
97.0
1.44
SMA as titrant
2.1
99.7
0.44
99.0
0.85
4.2
99.3
0.67
99.4
0.64
6.3
99.0
0.78
98.6
0.84
8.4
98.5
0.51
98.0
0.77
12.6
98.3
0.73
98.2
1.11
29.4
98.0
0.80
97.0
1.23
PMA as titrant
4.2
99.8
0.16
99.5
0.84
6.3
99.4
0.77
99.3
0.26
8.4
99.0
0.78
99.1
0.65
12.6
98.5
0.58
98.5
0.91
29.4
98.0
0.88
98.0
0.38
42.0
98.3
0.30
97.8
0.69
While in the Calibration curve method the percentage recovery for determinations of CLO in pure solution and Plavix Tablets ranged from 98.0 to 99.4 and 98.3 to 98.7, respectively. The potentiometric titration technique usually offers the advantage of high accuracy and precision, a further advantage is that the potential break at the titration end-point must be well defined. The titration process was carried out manually in aqueous solution containing 4.20–42.0 mg CLO with average recoveries of 98.2–99.6% using NaTPB as titrant, 97.3–98.5% in Plavix tablets.
On using PTA as titrant, 97.6–99.3%, 97.0–99.0%, on using SMA as titrant, 98.0–99.7%, 97.0–99.4, and on using PMA as titrant, 98.0–99.8%, 97.8–99.5% for pure solution and Plavix tablets respectively, Fig. 6. The results applying the potentiometric titration method Table 5. The results obtained were compared with those of the official method (United States Pharmacopeia, 2009). No significant difference between two methods was observed with respect to accuracy and precision (Table 6). Method (I): The standard addition method. Method (II): The Calibration curve method. Method (III): The Potentiometric titrations method. X ± S.E.: Recovery ± standard error. F-tabulated is 6.39 at 95.0% confidence limit. t-tabulated at 99.0% confidence limit and 6 degrees of freedom.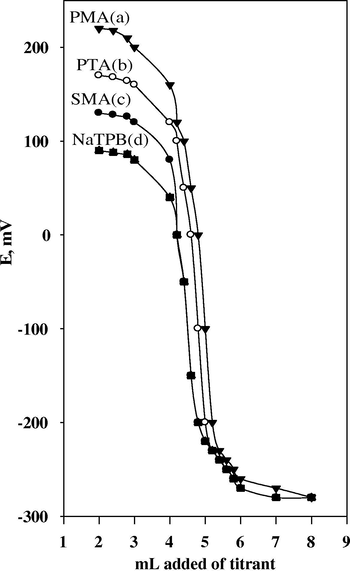
Potentiometric titrations of 21.0 mg CLO-H2SO4 with PMA (a), PTA (b), SMA (c), and STA (d) As titrants using CLO-ST/CMCPS.
Method
X ± S.E.
Relative error (%)
F3.3 value (9.28)
X ± S.E.
Relative error (%)
F3.3 value (9.28)
Bulk powder
Tablet
Official method(35)
98.0 ± 0.50
0.851
97.0 ± 0.6
0.90
Method (I)
99.2 ± 0.11
0.891
0.785
98.6 ± 0.112
0.621
0.566
Method (II)
99.5 ± 0.46
0.624
0.748
98.9 ± 0.013
0.651
0.901
Method (III)
99.7 ± 0.06
0.339
0.806
99.5 ± 0.372
0.917
0.739
Spiked urine
Spiked human serum
Official method(35)
98.0 ± 0.44
0.822
98.1 ± 0.2
0.911
Method (I)
98.7 ± 0.73
0.621
0.625
98.5 ± 0.035
0.481
0.577
3.8 Validation of the proposed method
3.8.1 Linearity and detection limit (LOD)
Under the optimal experimental CMCPS conditions, a linear relationship exists between the sensor potential/mV and the logarithm of corresponding concentration of the investigated drug, the value of LOD was indicating that the proposed method is sensitive for detection of very small concentrations of CLO reaching 0.35 nM. The correlation coefficient (r) and other statistical parameters are listed in Table 3.
3.8.2 Accuracy
The accuracy of the proposed CMCPS method was investigated by the determination of CLO in its pharmaceutical preparations without interfering from the co formulated adjuvant as indicated by the mean recovery value of 99.87 ± 0.177 mV/decade for the investigated sensor.
3.8.3 Precision
The precision of the CMCPS method measured as percentage relative standard deviation (% RDS) was tested by repeating the proposed CMCPS method for analysis of the investigated CLO in intra-day (within the day) and inter-day (consecutive days) to five replicates. The obtained %RSD values were 0.379%, 0.466% for the sensor. The % R.S.D. values are less than 2%, indicating good precision.
3.9 Analytical applications
The standard addition method was proved to be successful for the determination of clopidogrel in its bulk solutions, Plavix tablet (75 mg/tablet) and biological fluids such as human serum/urine using its prepared chemically modified carbon paste sensor.
3.9.1 Determination of Plavix tablet (75 mg/tablet)
In order to assess the validity of the proposed sensor, the standard addition method (Guilbault et al., 1976), calibration curve method and the potentiometric titration method (Table 5, Fig. 6) show the determination of CLO in its bulk solutions and tablet. The results also prove the applicability of the three methods for the determination of CLO in the pharmaceutical formulation.
3.9.2 Determination of CLO in human serum and urine
The proposed CMCPS method was successfully applied to determine CLO in biological fluids and the results obtained are summarized in Table 5. The determination of CLO in spiked human serum shows that a wide concentration range of the drug can be determined by the investigated sensor with high precision and accuracy. In urine samples the standard addition technique was applied to overcome the matrix effects in these samples. Also, the response times of the proposed sensors are instant (within 15 s), so the sensors are rapidly transferred back and forth between the biological samples and the bi-distilled water between measurements to protect the sensing component from adhering to the surface of some matrix components. It is concluded that the proposed sensors can be successfully applied to in vitro studies and for clinical use. This confirms that the sensitivity and limit of quantification (LOQ) are adequate for determination of clopidogrel bisulfate in pharmacokinetic studies.
3.9.3 Potentiometric monitoring of Plavix tablet dissolution Liddell et al., 2007; United States Pharmacopeia, 2009
The dissolution test was operated at 50 rpm in 900 ml 1.0x10⁻² M hydrochloric acid (simulated duodenum fluid), and potentiometric clopidogrel sensor was used. The simulated duodenum fluid was kept at 37.0 ± 0.5 °C. There are no degradation products in the vitro test. The compression recipients do not interfere. Taking into account the S-shape of the dissolution curve obtained Fig. 6. It shows that clopidogrel releases immediately after capsule was ruptured. More than 75% drug was released within 15 min and complete dissolution was achieved in 120 min.
In the potentiometric method, the potential values were continuously recorded at 1-min time intervals and compared with a calibration graph. For the UV spectrophotometric assay, fixed volumes of the dissolution medium were withdrawn, diluted with 0.01 M HCl, measured at λ max 240 nm and compared with a calibration graph. Fig. 7 shows the dissolution profiles of clopidogrel tablet using both measurement techniques. The results obtained by spectrophotometry and potentiometry are almost identical. The use of the potentiometric method sensor, however, has the advantage of in situ monitoring.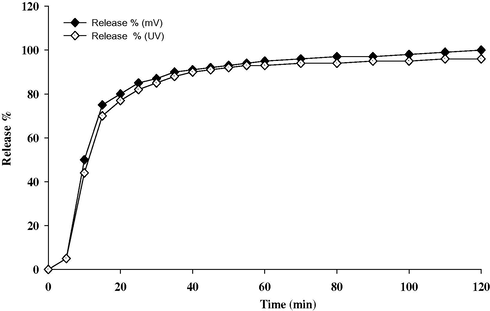
Dissolution profiles of 75 mg clopidogrel bisulfate tablet obtained by potentiometric: 5.0% CLO-CMCPS, and spectrophotometric measurements at 240 nm.
3.9.4 Robustness and ruggedness
The robustness method of the CLO-CMCPS was examined by changed the aqueous solution to acetate buffer pH 4 ± 0.5 and the percentage result was 99.79 ± 0.23 mV/decade for the CLO-ST.
This result was closely in agreement with those obtained from standard drug solution, (Table 1). While the ruggedness or the reproducibility was checked by using another model of pH-meter (Jenway, 3505) was indicated by the results obtained as percentage was 99.83 ± 0.26 mV/decade for the same sensor. (Table 1).
3.9.5 Content uniformity assay of Plavix tablets
The proposed ISE method described good accuracy and precision for the quality control tests, the content uniformity assay showed that accurate and reproducible results so the sensor can be employed for quantification of clopidogrel and the recovery of CLO-H2SO4 is almost quantitative.
3.9.6 Statistical treatment of results
The results obtained from the potentiometric determination of the drug in these real samples are given in Table 5. The results of the recoveries of CLO applying the standard addition method, calibration curve method and the potentiometric titration were evaluated statistically and compared with the values obtained with the pharmacopeia method by applying the F-tests (Miller and Miller, 1994) The values obtained (Table 6) show that the present methods have a precision comparable to that of the pharmacopeia method. However, the proposed methods are more practical regarding time of analysis, consumption of solvents and sample pretreatment requirements for spectrophotometric or chromatographic analysis of clopidogrel bisulfate.
3.9.7 Comparison of the clopidogrel selective sensors
The performance characteristics of the proposed sensor and those of some reported ISE method are presented in Table 7 for comparison. It is clear that the proposed sensor CMCPS is comparable with most of the reported sensors with regard to working concentration range, response time and low detection limit. Overall evaluation indicates this sensor is more useful in such applications. r2: Correlation coefficient; R%: Mean recovery %; C.S.: Current Study.
ISS
Reference Saber et al. (2008)
Ref Bin-Ibrahim et al. (2012)
[C.S.]
TpClPB-(PVC)
(PMA)
(ARS)
(PTA)
CMCPS
(DBP)
(2-NPPE)
Parameter
o-NPOE
DOP
Plastic
Coated-Ag
Coated-graphite
CLO-ST
Slope (mV/decade)
61.7
59.3
55.97
57.57
58.03 ± 0.150
60.0 ± 0.5
Correlation coefficient (r)
0.9874
0.9993
0.9998
0.9999
0.9999
0.9999
Linear range (M)
--
--
1 × 10⁻⁷–1 × 10⁻²
1 × 10⁻⁷–1 × 10⁻²
LOD (M)
1.0 × 10⁻⁵
5.01 × 10⁻⁸
4.1 × 10⁻⁸
5.0 × 10⁻⁸
3.5 × 10⁻⁸
Working pH range
1.5 – 4.0
1.2–4.6
1.2 – 4.8
Response time (s)
20
25
15
⩽8
Life span/days
77
84
25
30
40
Fresh surface
Accuracy (%)
--
--
99.09 ± 0.6
99.72 ± 0.24
99.28 ± 0.857
99.87 ± 0.177
Standard deviation
--
--
0.460
0.227
0.150
0.326
Robustness
99.48 ± 0.537
99.36 ± 0.337
99.51 ± 0.445
99.79 ± 0.23
Ruggedness
99.51 ± 0.430
99.26 ± 0.650
98.77 ± 0.199
99.83 ± 0.26
4 Conclusion
The proposed potentiometric methods based on the construction of different types of selective sensors with ion exchangers might be useful analytical characteristics for the determination of CLO in its bulk solutions, pharmaceutical dosage form and biological human fluids. The good recoveries and low relative standard deviations obtained reflect the high accuracy and precision of the proposed method. Moreover, the CMCPS is simple in construction and fabrication, easy to operate in mechanism, high sensitivity sensor, and reasonable selectivity for variables ions, fast static response dynamic time, long term stability for drug solution and applicability over a wide concentration range with minimal sample pretreatment and inexpensive making it an excellent tool for the routine determination of CLO in quality control laboratories. The sensor developed is superior as compared with the clopidogrel selective sensor described in the literature (Saber et al., 2008; Bin-Ibrahim et al., 2012).
Acknowledgements
I gratefully acknowledge the support of the National Organization for drug control and research (NODCAR) in Giza-Egypt, for chemicals and dissolution equipment and also acknowledge the support of Central Research Lab at Nahda University for providing other equipments for the practical work.
References
- Stability-indicating liquid chromatography for determination of clopidogrel bisulphate in tablets: application to content uniformity testing. J. Saud. Chem. Soc. 2010;16(1):23-30.
- [Google Scholar]
- Determination of clopidogrel bisulphate using ion-selective sensors in bulk, pharmaceutical formulation and in biological fluids. J. Am. Sci.. 2012;8(12):276-283.
- [Google Scholar]
- The Merck Index. Merck & Co. Inc.; 2011. p. :856-859. 13th Ed.
- Development and validation of spectrophotometric method for clopidogrel bisulphate in pure and in film coated tablet dosage form. Arch. Appl. Sci. Res.. 2012;4(1):59-64.
- [Google Scholar]
- Electrochemical study of the antiplatelet agent clopidogrel and its determination using differential pulse voltammetry in bulk form and pharmaceutical preparations with a glassy carbon sensor. Pharmazi. 2010;65(3):175-181.
- [Google Scholar]
- Kinetic spectrophotometric determination of betaxolol, clopidogrel and imidapril in pharmaceutical. Anal. Techn.. 2010;6(3):228-236.
- [Google Scholar]
- Separation and determination of clopidogrel and its impurities by capillary electrophoresis. J. Pharma. Biomed. Anal.. 2009;49(2):193-200.
- [Google Scholar]
- Quantitative analysis of clopidogrel bisulphate and aspirin by first derivative spectrophotometric method in tablets. Ind. J. Phama. Sci.. 2010;72(6):825-828.
- [Google Scholar]
- Analysis of purity in 19 drug product tablets containing clopidogrel: 18 copies versus the original brand. J. Pharma. Biomed. Anal.. 2004;34:341-348.
- [Google Scholar]
- Recommendations for nomenclature of ion-selective sensors. Pure Appl. Chem.. 1976;48:127-129.
- [Google Scholar]
- Spectrophotometric determination of clopidogrel bisulphate in pharmaceutical formulations. J. Pharma. Tech. Res.. 2011;1(4):258-263.
- [Google Scholar]
- ATLAS 2 everything about drugs from A to Z. Nobar publisher; 2006. p. :282-288.
- Development and validation of HPLC-UV method for the determination of clopidogrel in pharmaceutical dosage form and human plasma. J. Liq. Chromatogr. Related Technol.. 2011;34(18):2118-2129.
- [Google Scholar]
- Capillary zone electrophoresis method for determination of (+)-S clopidogrel carboxylic acid metabolite in human plasma and urine designed for biopharmaceutic studies. J. Chromatogr. B Anal. Technol. Biomed. Life Sci.. 2010;878(13–14):1013-1018.
- [Google Scholar]
- Modified carbon paste sensor for the potentiometric determination of neostigmine bromide in pharmaceutical formulations, human plasma and urine. Biosens. Bioelectron.. 2014;51:143-149.
- [Google Scholar]
- Assay method for the carboxylic acid in human plasma by gas chromatography mass spectrometry. J. Chromatogr. B Biomed. Sci. Appl.. 1998;720(1–2):107-117.
- [Google Scholar]
- Dissolution Technol.. 2007;14(1):28.
- Performance evaluation criteria for preparation and measurement of macro- and micro fabricated ion-selective sensors. Pure Appl. Chem.. 2008;80(1):85-104.
- [Google Scholar]
- Development and validation of a reversed-phase HPLC method for simultaneous determination of aspirin, atorvastatin calcium and clopidogrel bisulphate in capsules. Ind. Pharma. Sci.. 2011;73(1):23-29.
- [Google Scholar]
- Statistics for Analytical Chemistry. Chichester, England: Ellis Horwood; 1994.
- Int. J. Electrochem. Sci.. 2014;9:327-341.
- Ion-pairing RP-HPLC method for simultaneous determination of aspirin and clopidogrel bisulphate in tablet and capsule dosage form. Int. J. Pharma. Tech. Res. (1):269-273. 2 2
- [Google Scholar]
- Simultaneous estimation of acetylsalicylic and clopidogrel bisulphate in pure powder and tablet formulations by high performance column liquid chromatography and high-performance thin-layer chromatography. J. AOAC. Int.. 2008;91(4):750-755.
- [Google Scholar]
- Very slow chiral inversion of clopidogrel in rats: a pharmaceutical and mechanistic investigation. Drug Metab. Dispos.. 2000;28(12):1405-1410.
- [Google Scholar]
- Chemometric simultaneous estimation of clopidogrel bisulphate and aspirin from combined dosage. Ind. J. Pharma. Sci.. 2008;70(4):450-454.
- [Google Scholar]
- Liquid chromatographic and potentiometric methods for determination of clopidogrel. J. Food Drug Anal.. 2007;16(2):11-18.
- [Google Scholar]
- Liquid chromatographic and potentiometric methods for determinations of clopidogrel. J. Food Drug Anal.. 2008;16(2):11-18.
- [Google Scholar]
- Simultaneous determination of clopidogrel and its carboxylic acid metabolite by capillary electrophoresis. J. Chromtogr. B Anal. Technol. Biomed. Life Sci. 2010;878(19):1480-1486.
- [Google Scholar]
- Determination of clopidogrel in human plasma by liquid chromatography/tandem mass spectrometry: application to clinical pharmacokinetic study. Biomed. Chromatogr.. 2007;21(9):883-889.
- [Google Scholar]
- Concurrent estimation of clopidogrel bisulphate and aspirin in tablets by validated RP-HPLC method. Ind. Pharma. Sci.. 2008;70(5):667-669.
- [Google Scholar]
- Determination of the content of the compound clopidogrel bisulphate tablets by HPLC. J. Shen. Pharma. Univ.. 2008;25(12):983-986.
- [Google Scholar]
- Development and validation of an HPLC-MS/MS method to quantify clopidogrel acyl glucuronide, clopidogrel acid metabolite, and clopidogrel in plasma samples avoiding analyte back-conversion. Anal. Bional. Chem. 2011;401(3):1023-1034.
- [Google Scholar]
- A validated stability indicating HPTLC method for determination of aspirin and clopidogrel bisulphate in combined dosage form. J. Anal. Chem.. 2009;4(2):152-160.
- [Google Scholar]
- Principles of Instrumental Analysis (5th ed.). London: Harcourt Brace College Publishers; 1997.
- Simultaneous determination of clopidogrel and aspirin by RP-HPLC from bulk material and dosage formulations using multivariate calibration technique. J. Chromatogr. Sci. 2011;49(2):165-169.
- [Google Scholar]
- Review, carbon paste sensors in facts, numbers, and notes: a review on the occasion of the 50-years jubilee of carbon paste in electrochemistry and electroanalysis. Electroanal. J.. 2009;21(1):7-28.
- [Google Scholar]
- Carbon paste sensors in the new millennium (Invited Review) Cent. Eur. J. Chem.. 2009;7(4):598-656.
- [Google Scholar]
- Quantitative determination of clopidogrel active metabolite in human plasma by LC–MS/MS. J. Pharm. Biomed. Anal.. 2008;48(4):1219-1224.
- [Google Scholar]
- Pharmacokinetics of clopidogrel after administration of a high loading dose. Thromb. Haemost.. 2004;92(2):311-316.
- [Google Scholar]
- Selectivity coefficients for ion-selective sensors: recommended methods for reporting KA, B pot values (technical report) Pure Appl. Chem.. 1995;67:507-511.
- [Google Scholar]
- Potentiometric selectivity coefficients of ion-selective sensors. Part I. Inorganic cations (technical report) Pure Appl. Chem.. 2000;72:1851-1855.
- [Google Scholar]
- United States Pharmacopeia, 2009. National Formulary USP 32–NF 27 Convention Inc: Rockville, MD.
- Spectrophotometric estimation of clopidogrel bisulphate in pharmaceutical. Int. J. Chem. Sci.. 2009;7(1):216-218.
- [Google Scholar]


