

Translate this page into:
New route for removal of Cu(II) using fabricated nanocomposite based on cationic surfactant/Ag-nanoparticles/silica gel
⁎Corresponding author. eazzamep@yahoo.com (Eid.M.S. Azzam)
-
Received: ,
Accepted: ,
This article was originally published by Elsevier and was migrated to Scientific Scholar after the change of Publisher.
Peer review under responsibility of King Saud University.
Abstract
Generally, the treated wastewater must at least achieve the minimum safety standards for the purpose of the treatment process. The main target of this work is the combination of the features of surfactants, nanoparticles, and silica gel in one system for Cu(II) removal from the aqueous solution. To achieve this goal, the attempt would be made by the fabrication of nanocomposite based on 4-amino-N-tetradecyl pyridinium bromide (C14) coated silver nanoparticles and silica gel. The fabricated nanocomposite (C14-Ag-SG) was characterized using different techniques such as FTIR, XRD, XRF, SEM, and TEM. We examined the adsorption of Cu(II) ions onto the fabricated nanocomposite using batch adsorption. The effect of the contact time, pH of the solution, and mass of the adsorbent on the efficiency of adsorption was evaluated. The adsorption capacity of Cu(II) increased by increasing of the contact time with a neutral pH. The maximum removal of Cu(II) ions (98.57 %) was found using 0.4 g of the (C14-Ag-SG) nanocomposite. The fabricated nanocomposite showed high adsorption efficiency which clarifies the effect of the surfactant compound (C14) and silver nanoparticles in improving the adsorption efficiency. The results in this work suggest that the fabricated nanocomposite has high efficiency in the removal of Cu(II).
Keywords
Cationic surfactant
Silica gel
Nanocomposites
Wastewater
Cu(II)

- C14
-
Cationic surfactant
- SG
-
Silica gel
- AgNPs
-
Silver nanoparticles
Abbreviations
1 Introduction
The main reason for the shortage in aquatic resources happened due to drought and the misuse and production of large volumes of wastewater. The large number of effluent streams containing a mixture of toxic heavy metals such as copper (Cu) is due to technological advancement and rapid industrialization (Guo et al., 2018). The removal of these heavy metals in polluted water is a major problem for the industry and it accounts for a sort of real threat to the environment (M'barek et al., 2022). Water pollution caused by heavy metals has negative effects on nature, especially on human health. The most common inorganic pollutants in wastewater are nickel, zinc, silver, lead, iron, chromium, copper, arsenic, cadmium, and uranium, which are investigated for persistence and toxicity. As known, heavy metals such as copper are not biodegradable and tend to accumulate in living organisms, which led to various diseases and disorders. Copper is an essential element for life in mammals and plants due to its important role in carbohydrate and lipid metabolism. Despite the essential role of copper, the increase in its concentration has a side effect of toxicity. The different industrial activities led to the increases in copper concentration in waters. According to the World Health Organization (WHO), the maximum acceptable concentration of copper in drinking water is 2.0 mg/L (Kendüzler and Türker, 2003; Kumar et al., 2012). There are different techniques used for the removal of heavy metals from water for example ion exchange, reverse osmosis, nanofiltration, precipitation, coagulation/co-precipitation, electrodialysis, flotation, extraction, electrolysis, and sorption. (Maynard et al., 2006; Azzam et al., 2014a; Reddy and Lee, 2013). One of the most popular, simple, and low-cost techniques is the sorption technique as well as reversibility which can remove even trace quantities of metal ions from water (Balintova et al., 2016; Yushin, 2017). For this purpose, different functional groups can be grafted or incorporated on the surface of mesoporous channels to prepare highly effective adsorbents. One of the solid materials used for heavy metal sorption is silica material which gained attention due to its unique properties such as defined pore geometry, large BET surface area, high porosity, narrowly distributed pore sizes, and often an ordered pore arrangement (O’Connell et al., 2008). In addition, silica has good mechanical strength, high thermal stability, does not swell, and has stability in a wide range of pH (Witek-Krowiak, and Reddy, 2013). The modified mesoporous adsorbents use some ligands that have appropriate functional groups such as an amino group for heavy metal ions removal have become more interested (Pontoni and Fabbricino, 2012). Beauvais and Alexandratos (Beauvais and Alexandratos, 1998) have provided an excellent overview of silica for the selective complexation of metal ions. Different inorganic ion-exchangers and adsorbents based on silica have been investigated as potential sorbents for heavy metals (Bostick et al., 1997; Mimura et al., 1995; Dyer et al., 1999; Marmier et al., 1999; Walker et al., 1999; Ramaswamy, 1999; Sylvester et al., 1999; Paajanen et al., 1997; Apak et al., 1996; Apak et al., 1995). Modified silica gels usually have a higher adsorption capacity than other organic and inorganic supports (Bilgiç and Çimen, 2019). Recently, nanomaterials have received increasing attention. Among these nanomaterials, silver nanomaterials have significant differences from the macroscopic and small-molecular species because of their particle sizes. They have extensive applications in the chemical industry, medicine, biological, superconductivity, and other aspects (Mathew et al., 2011). In our previous work, we investigated the removal of Cu(II) using chitosan-clay nanocomposites. The study suggested that this nanocomposite as an efficient adsorbent for the removal of Cu(II) ions from an aqueous solution (Azzam et al., 2016). In the present work, we investigated the sorption of Cu(II) ions from an aqueous solution onto a fabricated nanocomposite (C14-Ag-SG) based on cationic surfactant/Ag-nanoparticles/silica gel. The preparation of the adsorbent is simple and can be applied to remove copper ions. The sorption process was studied using various techniques and different experimental parameters, such as contact time, the mass of the adsorbent, and solution pH.
2 Fabrication of samples
2.1 Synthesis of 4-amino-N-tetradecyl pyridinium bromide (C14)
A solution of 4-aminopyridine (CAS Number 504-24-5, Sigma-Aldrich) (20 mmol, 1.88 g) in 50 ml DMF was prepared at room temperature. Then 1-bromotetradecane (CAS Number 112-71-0, Sigma-Aldrich) (20 mmol, 5.54 g) was added to this solution. The mixture was heated to 100 °C for 10 h. After cooling and addition of ethyl ether to the mixture the product was precipitated. The crude precipitate was recrystallized twice from ethanol to give the quaternary amino pyridinium bromide (C14). A white powder of 4-amino-N-tetradecyl pyridinium bromide (C14) compound was obtained by dried under vacuum for 24 h. The net product was 85% yield and measured melting point was 138 °C (see scheme 1) (Azzam et al., 2011)..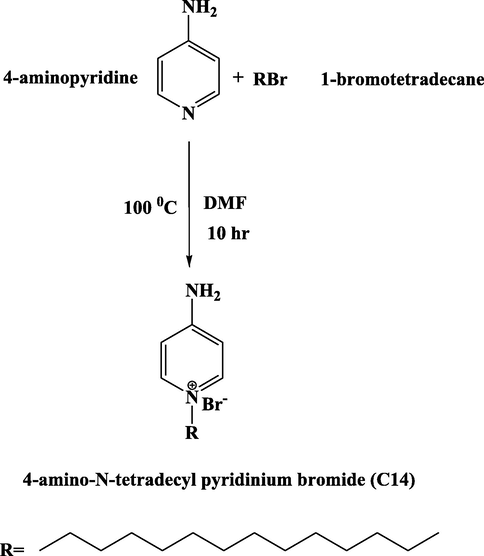
Synthesis of 4-amino-N-tetradecyl pyridinium bromide (C14).

Removal of Cu(II) Using Fabricated Nanocomposite based on Cationic Surfactant/Ag-nanoparticles/Silica Gel.
2.2 Capping of Ag-nanoparticles with 4-amino-N-tetradecyl pyridinium bromide (C14)
The Ag-nanoparticles solution was prepared from AgNO3 (CAS Number 7761-88-8, Sigma-Aldrich) as mentioned in previous publication (Azzam et al., 2021). After heating the AgNO3 solution (50 ml of (1 × 10⁻³M)) 5 ml of 1% trisodium citrate as reducing agent was added drop by drop. Then the solution was mixed vigorously and heated until the color convert to pale yellow. The nanostructure of the 4-amino-N-tetradecyl pyridinium bromide (C14) with Ag-nanoparticles was fabricated as follow: 4-amino-N-tetradecyl pyridinium bromide (C14) solution (100 ml, 2.0 wt%) were prepared by dissolving 4-amino-N-tetradecyl pyridinium bromide (C14) in 1.0 wt% of ethanol solution under constant stirring for 1 h. Then 20 ml of Ag-nanoparticles aqueous solution was mixed with 5 ml of 4-amino-N-tetradecyl pyridinium bromide (C14). After that, the mixed solution was stirred until the color of changed to colorless (Ilangovan et al., 2012). The characterization of the prepared 4-amino-N-Tetradecyl pyridinium bromide (C14) capped Ag-nanoparticles and their nanocomposite with silica gel (C14-Ag-SG) was carried out by the following techniques: The UV measurements for the solution of the individual Ag-nanoparticles solution and Ag-nanoparticles with (C14) were carried out by UV-VIS double beam PC scanning spectrophotometer (LABOMED, INC., UV-2950, USA). In addition, Thermo Nicolet 6700 FT-IR optical spectrometer (Mundelein, Illinois 60060 USA) was used for the FTIR measurements of the prepared C14 compound and the fabricated nanocomposite using C14 capped Ag-nanoparticles with silica gel. The measured sample (2 mg) was mixed with 100 mg of KBr and grinded well. Then the sample were pressed into pills with a compressor and prepared pellets were used for studies. All spectra were recorded in the range of 4000–400 cm−1 with resolution of 4.0 cm−1 at an angle of incidence 80° relative to the surface normal.
2.3 Fabrication of the nanocomposite (C14-Ag-SG)
The nanocomposite was prepared based on silica gel 60 (CAS Number 112926-00-8, Sigma-Aldrich) and Ag-nanoparticles capped by 4-amino-N-tetradecyl pyridinium bromide (C14) according to the previous publication (Azzam et al., 2016). The dispersion solution of 1 g of silica gel in 250 ml of water was used for 48 h to reach swelling. The silica gel solution was poured into a 50 ml solution of Ag-nanoparticles capped by C14 and stirred for 24 h. The centrifuge was used for yield separation. The yield was washed with water and then dried under vacuum overnight to give pure and dry (C14-Ag-SG) nanocomposite. In this work, different techniques are used to study the morphology and composition of the fabricated nanocomposite (C14-Ag-SG). The morphology structure was measured by scanning electron microscopy (SEM), transmission electron microscope (TEM) for morphology and energy-dispersive X-ray (EDX) spectroscopy, X-ray diffraction (XRD), and X-ray fluorescence (XRF) for composition. Scanning electron microscopy (SEM) images and Energy-dispersive X-ray spectroscopy were obtained using a SEM-EDX (JEOL JSM7600F, Japan) system operating at 20 kV. The TEM images were measured by TEM model (JEOL 2010 FasTEM & Digital Micrograph User's Guide, Japan). The composition of the fabricated nanocomposite was characterized by The energy-dispersive X-ray (XRD) spectroscopy was recorded with an EDX detector (JEOL JSM7600F, Japan), XRD (D8 Discovery-Bruker Company, UK) at the condition of 40 KV and 40 AM (1600 W) at speed scan 0.01 with 2(θ) range from 10° to 80° and XRF (X-Met 8000 Oxford Instruments Company, UK) Scheme 2.
3 Sorption of Cu(II) onto the fabricated nanocomposite (C14-Ag-SG)
The sorption of Cu(II) using the fabricated nanocomposite was carried out as follows: Cu(II) solution (100 mg/L), was prepared by dissolving 100 mg of copper (II) sulfate pentahydrate (CuSO4·.5H2O) (CAS Number 209198, Sigma-Aldrich) in 1 L of distilled water (Azzam et al., 2016). The effect of time on the removal of copper ions was evaluated using Cu(II) solution (100 mg/L) and 0.1 g of adsorbent fabricated nanocomposite (C14-Ag-SG) at different period times (20, 40, 60, and 80 min) and pH 7 at ambient temperature. A continuous stirring was carried out over a magnetic stirrer at 160 rpm for a time range between 15 and 90 min for the dispersion of the adsorbent and the metal ions can reach to the equilibrium conditions. The solid part was separated by filtration in each then the residual Cu(II) concentrations were analyzed by UV-VIS double beam PC scanning spectrophotometer (LABOMED, INC., UV-2950, USA). The effect of pH on the removal of Cu(II) by making a series of 100 mg/L Cu(II) solutions with an adsorbent (C14-Ag-SG) dosage of 0.1 g, the starting solution pH was adjusted to the designed values (3, 4, 10 and 12). The pH adjustments at pH (3, 4, 10, and 12) using standard acid (0.01 M HSO4) and alkaline solutions (0.125 M NaOH). The calibration process of the pH meter was done with buffers of pH 4.0 and 7.0 before any measurement. The pH meter (Mettler-Toledo AG 8603 Schwerzen Bach, made by Mettler-Toledo Group) was used for pH measurement. After filtration of the solid part, the residual Cu(II) concentrations were analyzed by UV-VIS double beam PC scanning spectrophotometer (LABOMED, INC., UV-2950, USA). The effect of mass was studied by addition of different amounts (0.2, 0.3, and 0.4 g) of fabricated nanocomposite (C14-Ag-SG) to a series of 100 ml of copper solutions with the initial concentration of 100 mg/L at pH 7.0, and shaken rate 160 rpm for different contact time (15–90 min) to reach the equilibrium. After filtration of the solution, the residual Cu(II) concentrations were analyzed by UV-VIS double beam PC scanning spectrophotometer (LABOMED, INC., UV-2950, USA). The following equations were used as mentioned in the previous publication (Azzam et al., 2016) for the calculation of the amount of adsorption qe (mg/g) and the percentage of removal (% removal).
Where C0 and Ce are the initial Cu(II) concentration and the concentration at equilibrium in mg/L, m is the mass of the adsorbent and V is the volume of solution. The following techniques were used to determine the removal of Cu(II) from the prepared solution (100 mg/l) using 0.1 g of the fabricated nanocomposite (C14-Ag-SG). The inductively coupled plasma (ProdigyPlus ICP-OES, Teledyne Leeman Labs, USA) was used to determine the amount of Cu(II) remaining in Cu(II) solution (100 mg/l) after removal of Cu ions using the fabricated nanocomposite (C14-Ag-SG). A Perkin Elmer Analyst AA400 model flame atomic absorption spectrometer (FAAS) (PerkinElmer Co., Norwalk, CT, USA) was used for the measurement of the Cu(II) ions absorbed by the fabricated nanocomposite (C14-Ag-SG). The X-ray spectroscopy (XRD) and X-ray fluorescence (XRF) techniques were also used to determine the sorption of Cu(II) by the fabricated nanocomposite (C14-Ag-SG).
4 Results and discussion
4.1 Chemical structure of C14 compound
The chemical structure of 4-amino-N-tetradecyl pyridinium bromide (C14) in Scheme 1 was confirmed using FTIR and 1HNMR and 13CNMR spectra. The FTIR spectrum in Fig. 1 shows the following bands: 2932 cm−1 and 2856 cm−1 for asymmetric and symmetric stretching (CH), respectively, 1468 cm-1related to symmetric bending (CH2). The C = C ring stretching exhibited an absorption band at 1678 cm−1. Also, bands appear at 3041 cm−1 for the stretching absorption band of C-H ring, 3312 cm−1 for the stretching of the NH2 group, at 1193 cm−1 for C-N band, and para substituted benzene ring bands are observed at 832 cm−1 and 717 cm−1. The 1HNMR spectrum of C14 compound confirms the presence of CH3 (t) group at the chemical shift (δ) 0.81–0.84 ppm and CH2 (m) groups of the tetradecyl are observed at δ 1.2 ppm and 1.67–1.74 ppm. The CH2 (m) group which attached directly to the quaternized pyridinium nitrogen appeared at δ 4.09 ppm. The protons of the NH2 group and the aromatic ring appeared at δ 6.82–6.8, and 8.1–8.2 ppm, respectively (Ilangovan et al., 2012). The 13C NMR spectrum of C14 compound was also carried out to confirm the quaternization of the pyridinium nitrogen using 1-bromotetradecane. The appearance of the peaks at δ 158.52 (=C-NH2), 142.8 (+N = CH), 109.27 (+N = CH-CH = ), 56.87 (+N-CH2), from 22.08 to 31.28 (–CH2) and 13.92 (–CH3) confirm the chemical structure of C14.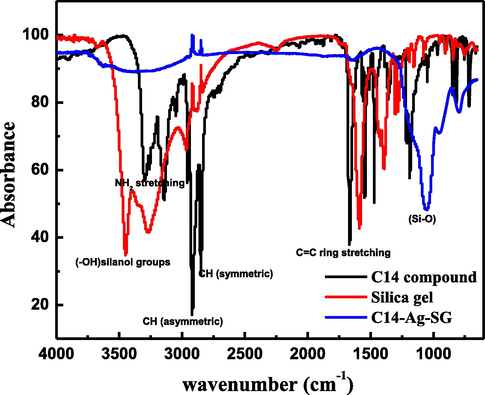
FTIR of C14 compound, Silica gel and fabricated nanocomposite (C14-Ag-SG).
4.2 Capping of C14 compound on Ag-nanoparticles
The capping of C14 compound on Ag-nanoparticles was confirmed using the UV absorbance spectrum as observed in Fig. 2. Which shows the absorbance spectra of Ag-nanoparticles individual and capping by C14 compound. It is clear from Fig. 2 that the absorbance peak for Ag-nanoparticles at 443 nm is a result of the surface plasmon absorption of silver nanoparticles. The capping of C14 compound on Ag-nanoparticles led to the disappearance of the peak at 443 nm. This is can be related to the displacement of silver ions from Ag-nanoparticles and reducing the plasmon charge on Ag-nanoparticles (Azzam et al., 2014b).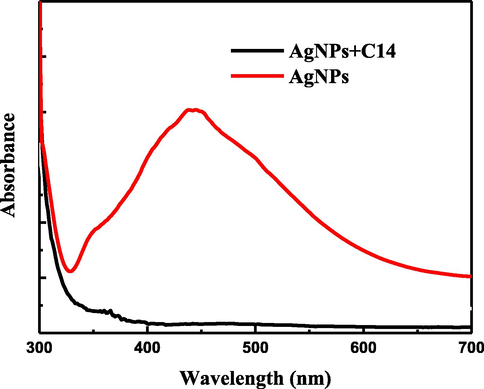
UV spectroscopy of Ag-nanoparticles and Ag-nanoparticles with C14 compound.
4.3 Characterization of the fabricated nanocomposite
The FTIR spectra of silica gel and fabricated nanocomposite (C14-Ag-SG) were confirmed by determining the vibration frequency changes in their functional groups within the range of 4000–400 cm−1 as shown in Fig. 1. The FTIR of silica gel individuals showed absorption peaks of υ (–OH) at 3470 and 1602 cm−1 related to the presence of silanol groups and adsorption water, respectively. The bands around 1400 and 1300 cm−1 resulted from υ (Si-O) vibrations (Ahmed and Soliman, 2013). After modification of silica gel with Ag-nanoparticles capped by C14 the following spectral data appear with some shift in the absorbance bands as follows: at 2925 and 2870 cm−1 for asymmetric and symmetric stretching (CH), respectively, 3322 cm−1 for stretching of NH2 group, 1061 cm−1 for C-N band and para substituted benzene ring bands at 950 and 802 cm−1. A scanning electron microscope (SEM) was used to study the surface morphology of the fabricated nanocomposite (C14-Ag-SG). It can be noticed from the SEM image in Fig. 3 that, the surface of the fabricated nanocomposite has dark gray color with some smoothly and wide thickness between layers, it is clear that, some imperfections on the modified silica gel surface can be treated by using of Ag-nanoparticles capped by C14 compound. The TEM image of the fabricated nanocomposite in Fig. 3 shows nanoparticles with the uniform size distribution of particles of silica with Ag-nanoparticles capped by C14 compound. The nanoparticles have aggregated into an agglomerate-like structure. In addition, the dark particles which appear in the TEM image may be related to the presence of Ag-nanoparticles capped by C14 compound. The EDX chart in Fig. 3 shows the Si peak with other peaks of oxygen, nitrogen, and carbon moieties on silica. XRD was used for more study of the morphology of the fabricated nanocomposite as clear in Fig. 3. The XRD peaks at 2θ = 38.12° (1 1 1), 44.31° (2 0 0), 64.46° (2 2 0), and 77.42° (3 1 1) in Fig. 3 are related to the planes of cubic Ag crystals. The appearance of these peaks revealed the formation of the fabricated nanocomposite depending on silica with Ag-nanoparticles capped by C14 compound.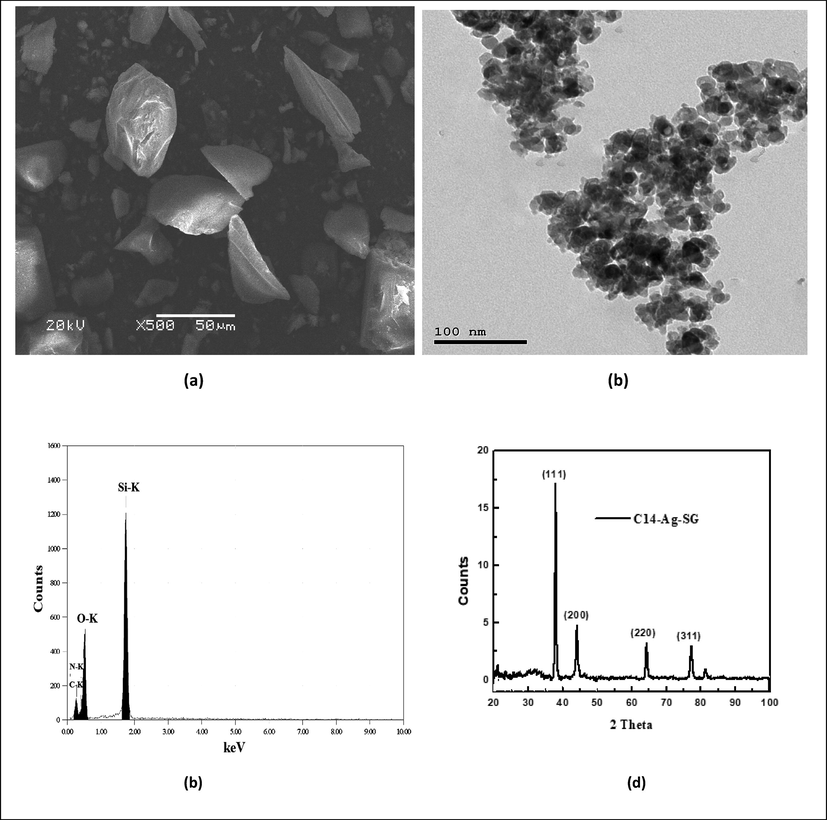
SEM, TEM, EDX and XRD of the fabricated nanocomposite (C14-Ag-SG).
4.4 Sorption and removal of Cu(II) using the fabricated nanocomposite
Herein, different techniques were used to confirm the sorption of Cu(II) onto the fabricated nanocomposite as follows: The SEM image in Fig. 4 shows the surface of the fabricated nanocomposite. After the sorption of Cu(II) the micrographs of the surface of nanocomposite in Fig. 3 is dramatically changed which is related to the presence of a surface containing ramifications with some dark gray spots and narrow thickness. This change may be due to the sorption of Cu(II) using the fabricated nanocomposite which discusses in detail in section 4.5 of this work. The Cu peak at approximately 1.0 keV presences with the other peaks in EDX chart (see Fig. 4) indicate the sorption of Cu(II) by the fabricated nanocomposite. In addition, XRD and XRF were carried out to confirm the sorption of Cu(II) onto the fabricated nanocomposite as shown in Fig. 5. The XRD diagram shows peaks at 2θ = 43.71°, 50.93°, and 74.89° for the planes of cubic Cu crystals (2 0 0), (2 2 0), and (3 1 1) respectively. The other peaks at 2θ = 38.26° (1 1 1), 44.47° (2 0 0), 64.71° (2 2 0), and 77.73° (3 1 1) are related to the planes (2 0 0), (2 2 0), and (3 1 1) of cubic Ag crystals. X-ray fluorescence (XRF) was carried out to determine the elemental composition of the fabricated nanocomposite after sorption of Cu(II). The spectrum in Fig. 5 shows two peaks CuKα and CuKβ characteristic of copper. There are other peaks for AgLα and Si elements that confirm the composition of the (C14-Ag-SG) nanocomposite. The removal of Cu(II) by 0.1 g of the nanocomposite (C14-Ag-SG) was studied using ICP and atomic adsorption as shown in Table 1. The atomic adsorption result shows that 60.40 ppm of Cu(II) was adsorbed by the nanocomposite from a 100 mg/l Cu(II) solution. While the ICP data indicate that the remaining Cu(II) in the solution is 39.60 ppm. The results in Table 1 confirm the removal of Cu(II) using the nanocomposite. In addition, these result was more established using the UV-VIS techniques using a variation of the contact time, pH of Cu(II) solution, and mass of adsorbent (C14-Ag-SG) nanocomposite as follow. Fig. 6 illustrates the effect of the contact time on the percentages of Cu(II) removal and adsorption capacities (mg/g) for the fabricated nanocomposite (C14-Ag-SG). The effect contact time was studied in the range of 20–120 min, and the initial metal concentration was fixed at 100 mg/L. All experiments were repeated three times to avoid errors. As clear from Fig. 6 the adsorption rate increases from 25.64 % removal of Cu(II) with an adsorption capacity of 130 mg of Cu(II) per gram (C14-Ag-SG) at 40 min and reached 61.64 % with an adsorption capacity of 300 mg of Cu(II) per gram (C14-Ag-SG) at 120 min. The adsorption of Cu(II) using the fabricated nanocomposite may be attributed to different factors such as the chelation between the NH2 group in compound C14 and the Cu ions. In addition, The fast rate of Cu(II) removal from 29.32 % removal of Cu(II) with an adsorption capacity of 145 mg/g at 80 min to 61.64 % with an adsorption capacity of 300 mg/g at 120 min. This is may be related to the rapid diffusion of Cu(II) from the solution to the outer surfaces of the fabricated nanocomposite (Azzam et al., 2016). The effect of the change in pH of the metal ion solution plays an important role in the adsorption process of the metal ions as well as on the adsorption capacity (Azzam et al., 2016). Fig. 6 shows the effect of initial solution pH on the percentages of Cu(II) removal and adsorption capacity of the fabricated nanocomposite (C14-Ag-SG). It is clear from Fig. 6 that the amount of Cu2+ adsorbed by (C14-Ag-SG) nanocomposite fast increased from pH 3 to 10, the optimum adsorption pH being located at 10. At low pH, most of the NH2 groups of C14 compound in the fabricated nanocomposite (C14-Ag-SG) were ionized to –NH3+ cation which effects the chelation between the NH2 group and Cu2+ ions. This ionization process of the NH2 group led to electrostatic repulsion between Cu2+ and –NH3+ cation and prevent the adsorption of Cu2+ ions onto the (C14-Ag-SG) nanocomposite (Azzam et al., 2016). When the pH of the Cu2+ solution becomes more than 10, the Cu2+ started to deposit as Cu (OH)2, the retention of Cu2+ decreases and the removal and adsorption capacity become stable from pH 10–12 as seen in Fig. 6 (Azzam et al., 2016). The variation of removal % of Cu(II) and adsorption capacity with the change in the mass of (C14-Ag-SG) nanocomposite from 0.2 g to 0.4 g, was investigated at constant pH and contact time. It was noticed from the data in Fig. 6 that the removal % of Cu(II) and the adsorption capacity slightly changed from 0.1 to 0.2 g and no change from 0.2 to 0.3 g of absorbent and then increase rapidly from 0.3 to 0.4 g. This may be related to the large surface area in turn number of adsorption sites in the fabricated nanocomposite (Azzam et al., 2016). It is clear from the data in Fig. 6 that the maximum removal of Cu(II) ion reach 98.57 %. This data shows that the maximum uptake of Cu ions using the fabricated nanocomposite in this work was 493 mg/g which is better than the other composites as shown in the previous publications (Azzam et al., 2016; Gandhi and Meenakshi, 2012).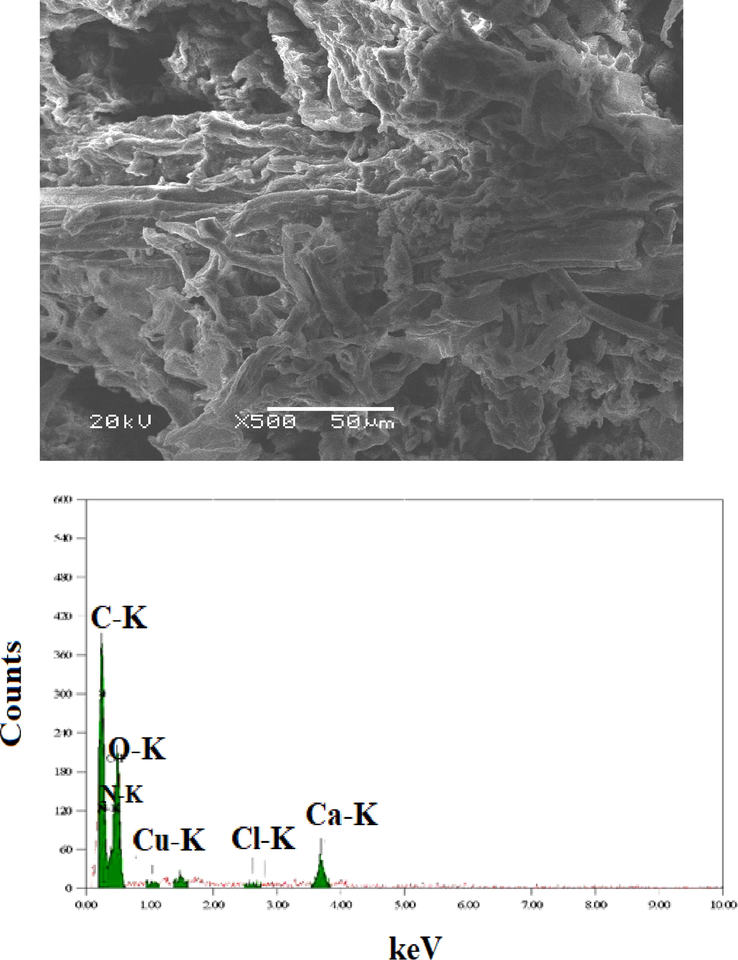
SEM and EDX of the fabricated nanocomposite (C14-Ag-SG) (0.1 g) after sorption of Cu(II) for 1 hr at pH = 7 and ambient temperature.
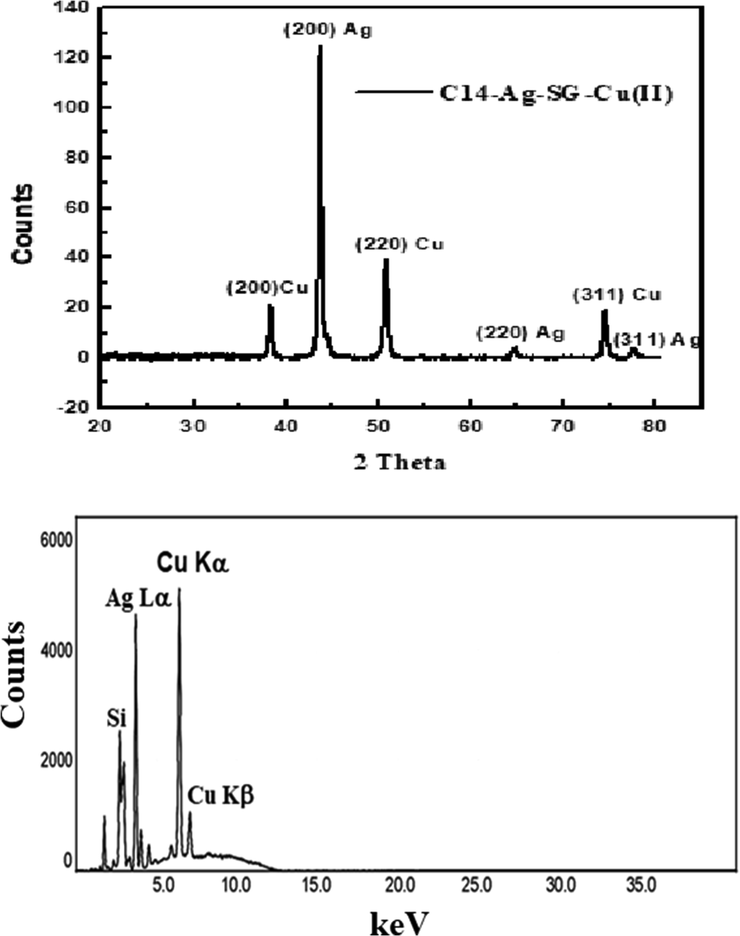
XRD and XRF of the fabricated nanocomposite (C14-Ag-SG) (0.1 g) after sorption of Cu(II) for 1 hr at pH = 7 and ambient temperature.
Measurements
Cu(II) concentration
Atomic absorption
60.40 ppm (Cu(II) removed by nanocomposite)
ICP
39.60 ppm (remaining Cu(II) after sorption by nanocomposite)
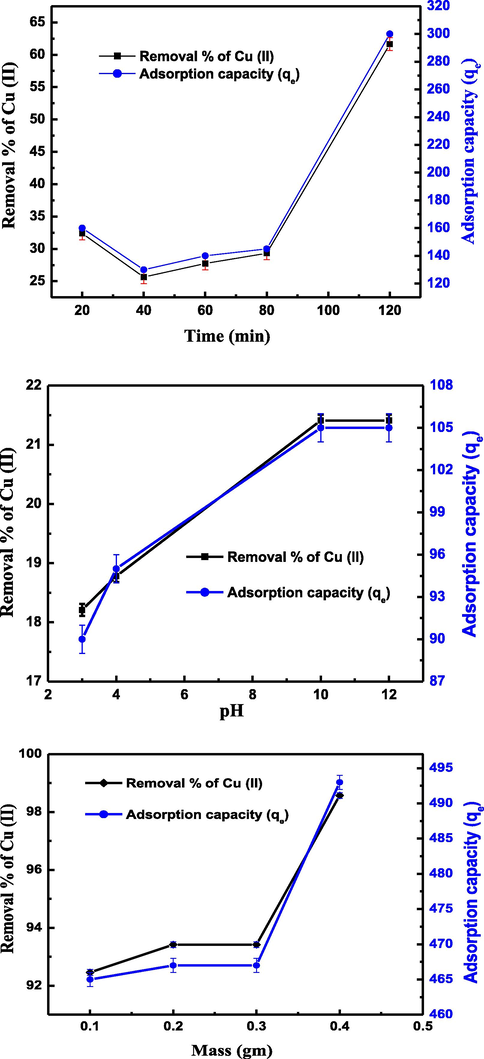
Removal % of Cu(II) and adsorption capacity (qe) at different time, pH and mass of (C14-Ag-SG) nanocomposite.
4.5 Mechanism of Cu(II) adsorption
The mechanism of Cu(II) using amino compounds and silica gel was reported in different publications (Azzam et al., 2016; Gandhi and Meenakshi, 2012). The chelation of metal is carried out through the coordination of the hydrated metal cation and the amino group present in the chemical structure of the compound such as the C14 compound in this work (Gandhi and Meenakshi, 2012). The Cu(II) ions act as a Lewis acid that can accept electron pairs from the amino groups of the C14 compound which can consider a Lewis base (Azzam et al., 2016). In the present work, the Cu(II) ions were removed using the fabricated nanocomposite by the ion-exchange mechanism with Si and the chelation as it contains both exchangeable silicon dioxide and metal chelating amino group in C14 compounds (Gandhi and Meenakshi, 2012). It is noticed from the data in Table 2 that the proposed absorbent in this work (C14-Ag-SG) has more efficiency of maximum adsorption (493 mg/g) than the other absorbents in the previous works of literature (Azzam et al., 2016; Zhang et al., 2009; Tran et al., 1999; Gao et al., 2010; Ngah et al., 2013; Wang et al., 2013; Zhu et al., 2012; Liu et al., 2014).
Absorbent
Maximum adsorption capacity (mg/g)
References
Silica-gel supported diethylenetriamine chelating resin (SGDETA-4)
208.3
Zhang et al., 2009
Silica gel
0.52
Tran et al., 1999
Poly(amidoxime)/SiO2
100
Gao et al., 2010
Chitosan–zeolite composites
14.75–51.32
Ngah et al., 2013
Semi-IPN hydrogel based on chitosan and gelatin
153.9
Wang et al., 2013
Xanthate-modified magnetic chitosan
34.5
Zhu et al., 2012
Chitosan nanofibrils
186,6
Liu et al., 2014
Chitosan (Ch)/clay, chitosan (Ch)/AgNPs/clay and chitosan (Ch)/AuNPs/clay
181.5
Azzam et al., 2016
C14-Ag-SG
493
Present work
5 Conclusions
The improvements of the composites as adsorbents for heavy metal ions using silver nanoparticles as well as compounds containing active groups such as amino groups are considered more interested recently. In this work, the fabricated nanocomposite (C14-Ag-SG) was used for the removal of Cu(II) with a variation of contact time, pH of the solution, and mass of adsorbent. The results indicated that the maximum removal of Cu(II) was found at a time of 120 min, pH = 7, and the 0.4 g mass of the fabricated nanocomposite. The maximum uptake of Cu ions using the fabricated nanocomposite in this work was 493 mg/g. The fabricated nanocomposite revealed high efficiency and suitability for the removal of copper ions in wastewater treatment compared with other adsorbents.
Acknowledgement
This research has been funded by scientific research deanship at University of Ha’il – Saudi Arabia through project number RG-21125.
Declaration of Competing Interest
The authors declare that they have no known competing financial interests or personal relationships that could have appeared to influence the work reported in this paper.
References
- Novel route for silylation of silica gel and aliphatic amines immobilization based on microwave-assisted solvent free synthesis and their applications for Cu(II) and Fe (III) removal from natural water samples. J. Environ. Sci. Health, A. 2013;48(7):817-828.
- [Google Scholar]
- Sorptive Removal of Cesium-137 and Strontium-90 from Water by Unconventional Sorbents: II. Usage of Coal Fly Ash. J. Nucl. Sci. Technol.. 1996;33(5):396-402.
- [Google Scholar]
- Sorptive removal of cesium-137 and strontium-90 from water by unconventional sorbents. I. Usage of bauxite wastes (red muds) J. Nucl. Sci. Technol.. 1995;32(10):1008-1017.
- [Google Scholar]
- Influence in the surface activity for some cationic thiol surfactants using their nanostructures. J. Dispersion Sci. Technol.. 2011;32(9):1325-1331.
- [Google Scholar]
- Detection of heavy metal ions using synthesized amino thiol surfactants assembled on gold nanoparticles. J. Dispersion Sci. Technol.. 2014;35(2):175-184.
- [Google Scholar]
- Enhancement the detection of Ni2+ and Zn2+ ions using nanostructure of synthesized dithiol surfactants with gold nanoparticles. J. Ind. Eng. Chem.. 2014;20(5):3905-3912.
- [Google Scholar]
- Preparation and characterization of chitosan-clay nanocomposites for the removal of Cu(II) from aqueous solution. Int. J. Biol. Macromol.. 2016;89:507-517.
- [Google Scholar]
- Inhibition of Sulfate-Reducing Bacteria by Para-amino-N-((1-Alkylpyridin-1-Ium Bromide)-4-Yl) Benzamide Surfactants and Surfactant-Coated Silver Nanoparticles. J. Surfactants Deterg.. 2021;25(1):125-131.
- [Google Scholar]
- A study of sorption heavy metals by natural organic sorbents. Environments. 2016;2(11):189-194.
- [Google Scholar]
- Polymer-supported reagents for the selective complexation of metal ions: an overview. React. Funct. Polym.. 1998;36(2):113-123.
- [Google Scholar]
- Removal of chromium (VI) from polluted wastewater by chemical modification of silica gel with 4-acetyl-3-hydroxyaniline. RSC Adv.. 2019;9(64):37403-37414.
- [Google Scholar]
- The evaluation of sodium-modified chabazite zeolite and resorcinol-formaldehyde resin for the treatment of contaminated process wastewater. Sep. Sci. Technol.. 1997;32(1–4):793-811.
- [Google Scholar]
- Ion exchange of caesium and strontium on a titanosilicate analogue of the mineral pharmacosiderite. J. Mater. Chem.. 1999;9(10):2481-2487.
- [Google Scholar]
- Preparation and characterization of silica gel/chitosan composite for the removal of Cu(II) and Pb (II) Int. J. Biol. Macromol.. 2012;50(3):650-657.
- [Google Scholar]
- Preparation and chelation adsorption property of composite chelating material poly (amidoxime)/SiO2 towards heavy metal ions. Chem. Eng. J.. 2010;158(3):542-549.
- [Google Scholar]
- Zn (II), Pb (II), and Cd (II) adsorption from aqueous solution by magnetic silica gel: preparation, characterization, and adsorption. Environ. Sci. Pollut. Res.. 2018;25(31):30938-30948.
- [Google Scholar]
- Synthesis, characterization and antimicrobial activity of 4-amino-1-alkyl pyridinium salts. Med. Chem. Res.. 2012;21(6):694-702.
- [Google Scholar]
- Atomic absorption spectrophotometric determination of trace copper in waters, aluminium foil and tea samples after preconcentration with 1-nitroso-2-naphthol-3, 6-disulfonic acid on Ambersorb 572. Anal. Chim. Acta. 2003;480(2):259-266.
- [Google Scholar]
- Potential application of dodecylamine modified sodium montmorillonite as an effective adsorbent for hexavalent chromium. Chem. Eng. J.. 2012;211:396-405.
- [Google Scholar]
- Recycled chitosan nanofibril as an effective Cu(II), Pb (II) and Cd (II) ionic chelating agent: adsorption and desorption performance. Carbohydr. Polym.. 2014;111:469-476.
- [Google Scholar]
- Surface complexation modeling of Yb (III) and Cs (I) sorption on silica. J. Colloid Interface Sci.. 1999;212(2):228-233.
- [Google Scholar]
- A fifteen atom silver cluster confined in bovine serum albumin. J. Mater. Chem.. 2011;21(30):11205-11212.
- [Google Scholar]
- Cellulose from Tamarix aphylla’s stem via acetocell for cadmium adsorption. Arab. J. Chem. 2022:103679-103688.
- [Google Scholar]
- Chromatographic separation of strontium and cesium with mixed zeolite, column. J. Nucl. Sci. Technol.. 1995;32(1):60-67.
- [Google Scholar]
- Comparative study on adsorption and desorption of Cu(II) ions by three types of chitosan–zeolite composites. Chem. Eng. J.. 2013;223:231-238.
- [Google Scholar]
- Heavy metal adsorbents prepared from the modification of cellulose: A review. Bioresour. Technol.. 2008;99(15):6709-6724.
- [Google Scholar]
- Sorption of cobalt on activated carbons from aqueous solutions. Sep. Sci. Technol.. 1997;32(1–4):813-826.
- [Google Scholar]
- Use of chitosan and chitosan-derivatives to remove arsenic from aqueous solutions—a mini review. Carbohydr. Res.. 2012;356:86-92.
- [Google Scholar]
- Synthesis, sorption and kinetic characteristics of silica-hexacyanoferrate composites. Solvent Extr. Ion Exch.. 1999;17(6):1603-1618.
- [Google Scholar]
- Application of magnetic chitosan composites for the removal of toxic metal and dyes from aqueous solutions. Adv. Colloid Interface Sci.. 2013;201:68-93.
- [Google Scholar]
- An assessment of inorganic ion-exchange materials for the removal of strontium from simulated Hanford tank wastes. Sep. Sci. Technol.. 1999;34(10):1981-1992.
- [Google Scholar]
- Comparison of chromatography and desiccant silica gels for the adsorption of metal ions—I. adsorption and kinetics. Water Res.. 1999;33(13):2992-3000.
- [Google Scholar]
- Cesium removal from high-pH, high-salt wastewater using crystalline silicotitanate sorbent. Sep. Sci. Technol.. 1999;34(6–7):1167-1181.
- [Google Scholar]
- One-step in situ fabrication of a granular semi-IPN hydrogel based on chitosan and gelatin for fast and efficient adsorption of Cu2+ ion. Colloids Surf., B. 2013;106:51-59.
- [Google Scholar]
- Removal of microelemental Cr (III) and Cu(II) by using soybean meal waste–unusual isotherms and insights of binding mechanism. Bioresour. Technol.. 2013;127:350-357.
- [Google Scholar]
- Utilization of poplar wood sawdust for heavy metals removal from model solutions. Nova Biotechnol. Chim.. 2017;16(1):26-31.
- [Google Scholar]
- Comparison of synthesis of chelating resin silica-gel-supported diethylenetriamine and its removal properties for transition metal ions. J. Hazard. Mater.. 2009;163(1):127-135.
- [Google Scholar]
- Competitive adsorption of Pb (II), Cu(II) and Zn (II) onto xanthate-modified magnetic chitosan. J. Hazard. Mater.. 2012;221:155-161.
- [Google Scholar]
Appendix A
Supplementary data
Supplementary data to this article can be found online at https://doi.org/10.1016/j.arabjc.2022.103897.
Appendix A
Supplementary data
The following are the Supplementary data to this article:Supplementary data 1
Supplementary data 1


