

Translate this page into:
Nitrogen-doped carbon dots for doxorubicin-targeted delivery and two-photon cell imaging
⁎Corresponding authors. genglina0102@126.com (Lina Geng) genglina1@hebtu.edu.cn (Lina Geng)
-
Received: ,
Accepted: ,
This article was originally published by Elsevier and was migrated to Scientific Scholar after the change of Publisher.
Abstract
N-doped CDs (N-CDs) were prepared and characterized, and the doping mechanism and drug loading properties were studied. N-CDs had both down- and up-conversion fluorescence characteristics and could deliver a type of drug with —C⚌O group. The N-CDs-drug system had sustained-release and pH-targeted properties.
Abstract
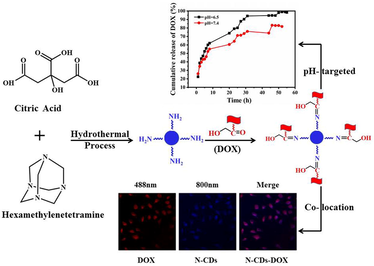
Nitrogen (N) doped CDs (N-CDs) were prepared using citric acid and hexamethylenetetramine by a one-step hydrothermal method, characterized by transmission electron microscopy (TEM), Powder X-ray Diffractometer (PXRD), Nuclear Magnetic Resonance (13C NMR), X-ray photoelectron spectroscopy (XPS), Fourier transform infrared (FT-IR), and ultraviolet–visible (UV–vis) absorption spectra. The doping mechanism and drug-loading characteristics of N-CDs were also studied. The results showed that N-CDs had both down- and up-conversion fluorescence properties and the average particle size was about 4.28 nm. N-CDs could be used as a drug carrier for doxorubicin (DOX) (N-CDs-DOX) via the formation of the —N⚌C— bond, and the drug-loading rate of N-CDs-DOX was 35.88%. The N-CDs-DOX had pH-targeted properties and low cytotoxicity. In vitro release of N-CDs-DOX belonged to the Weibull model and Fick diffusion. The results showed that N-CDs could deliver DOX successfully, and collocate with DOX in the SH-SY5Y cells through two-photon imaging. The N-CDs-DOX system had sustained-release and pH-targeted properties. N-CDs were expected to deliver a type of drugs containing —C⚌O group and be used in cancer treatment.
Keywords
Carbon dots
In vitro release
Up-conversion
Two-photon imaging

1 Introduction
With the continuous maturation and development of nanotechnology, researchers have developed a variety of nanomaterials with a wide range of applications (Magesa et al., 2020, Zhou et al., 2019, He et al., 2018). Among them, Carbon dots (CDs) are promising stars of the carbon-based nanomaterial family. They were discovered in 2004 and named Carbon dots in 2006. CDs are quasi-spherical nanoparticles with sizes smaller than 10 nm. CDs exhibit many unique advantages, such as outstanding biocompatibility, low toxicity, good cell permeability, high aqueous solubility, sensitive surface modification, excellent photoluminescent properties, luxuriant source of raw materials, etc. (Chung et al., 2020, Ghosal and Ghosh 2019). At present, the applications of CDs was reported in the field of biomedicine, bio-sensing (Ji et al., 2020), cell imaging (Myint et al., 2018), drug delivery (Ridha et al., 2020), and biotherapy (Pandey et al., 2017). However, there is still much space for improvement in the CDs’ performance, such as drug-loading and optical properties.
It reported that the fluorescence of CDs originated from the quantum confinement of the sp2 carbon constructed core (Li et al., 2019). And the heteroatom doping could produce the sp2 hybridization sites, so it was an effective method to adjust the fluorescence characteristics of CDs (Kou et al., 2020). For example, photoluminescence (PL) with up-conversion performance was one of the optical characteristics of CDs after adjustment or doping. Up-conversion fluorescence is a kind of tuneable photoluminescence, and the emission wavelength is shorter than the excitation wavelength due to the absorption of two or more photons. Up-conversion fluorescence has many advantages: intense penetration for deep tissue, dark-field imaging, and avoiding fluorescence bleaching, phototoxicity, and autofluorescence interference. Therefore, the CDs with up-conversion performance have advantages over the UV-excited CDs.
It reported that heteroatom doping could cause CDs to form more surface defects and reduce the energy between the band gaps, that improved the quantum yield, fluorescence intensity, and endowed the up-conversion property to CDs (Liu et al., 2023, Park et al., 2020, Manioudakis et al., 2019). Some non-metallic atoms could successfully be doped into CDs, including nitrogen (N), sulphur (S), phosphorus (P), boron (B), silicon (Si), and so on. Among these elements, nitrogen was considered to be the most commonly used doping atom due to its similar size to carbon, strong electronegativity, and a pair of lone electrons (Pang et al., 2020, Xu et al., 2016). Yan group reported that N-CDs exhibited adjustable emission colours from blue to green under the excitation wavelength from 230 to 520 nm. N-CDs could be used not only for cell imaging but also for tracking, detecting, and distinguishing liver cancer cells and HeLa cells (Yan et al., 2019). Konar et al. used tartaric acid and urea as raw materials to prepare N-CDs for detecting cysteamine quantitatively. The doping of nitrogen enhanced the fluorescence intensity of CDs (Konar et al., 2019). Bu et al. used dried chrysanthemum buds and ethylenediamine to synthesize N-CDs with triple applications: detection of curcumin, as fluorescent inks, and for bio-imaging (Bu et al., 2019). Although N-CDs have been extensively studied in biosensing, cell imaging, and sensors, the targeted drug delivery and release mechanism of N-CDs are rarely studied.
Generally, anti-cancer drugs were poorly targeted and had side effects on the patient's whole body. As a common and effective anti-cancer drug, doxorubicin (DOX) has been widely used to treat malignant tumours, such as colon cancer, lung cancer, and breast cancer (van der Zanden et al., 2021). However, DOX can damage the human immune system, cause adverse gastrointestinal reactions, form irreversible cardiotoxicity, etc. (Zhang et al., 2020). A carrier with excellent performance could alleviate the above situations and has a high drug-loading capacity. CDs are small in size and have excellent biocompatibility, so they are one of the first delivery systems superior to other nanoparticles and liposomes (Ghosal and Ghosh 2019). In addition, the surface of CDs could be modified by abundant functional groups, such as amino and carboxyl groups, to be used as an available platform for drug delivery (Shi et al., 2021).
The efficacy of the drug delivery system could be evaluated by in vitro release model and mechanism, which were helpful in understanding the drug’s possible performance in vivo and the potential transformation in the clinic (Regenold et al., 2020). In the previous study, we reported that CDs with down-conversion fluorescence properties, including hollow CDs (HCDs) (Zhang et al., 2019) and amino-modified CDs (Shi et al., 2021), were used as carriers for the intracellular delivery of DOX. And the in vitro release studies had shown that DOX had pH-targeted properties and lowered cytotoxicity after being carried by CDs. In the subsequent work, we expected to prepare N-doping CDs (N-CDs) with up-conversion fluorescence properties and study the delivery performance of N-CDs.
In this paper, N-CDs were prepared using citric acid as a carbon source and hexamethylenetetramine as a nitrogen source through the hydrothermal method. N-CDs were characterized by transmission electron microscopy (TEM), powder X-ray diffraction (PXRD), nuclear magnetic resonance (13C NMR), X-ray photoelectron spectroscopy (XPS), Fourier transform infrared (FT-IR) spectrum, ultraviolet–visible (UV–vis) absorption, and fluorescence spectroscopy. The drug-loading properties of N-CDs were studied using DOX as a model drug and SH-SY5Y as a model cell. The colocation of N-CDs and DOX by single-photon and two-photon images in SH-SY5Y cells was carried out. The luminescence and drug loading mechanism of N-CDs and the drug release mechanism of N-CDs-DOX were also discussed.
2 Experimental
2.1 Materials and reagents
Disodium hydrogen phosphate (Na2HPO4·12H2O), Potassium dihydrogen phosphate (KH2PO4), Sodium bicarbonate (NaHCO3), and EDTA were purchased from Bodi Chemicals (Tianjin, China). Citric acid was supplied by Tianjin Guangfu Technology Co. Ltd. Hexamethylenetetramine was purchased from Beijing Chemical Plant (Beijing, China). Quinine sulfate was procured from Sinopharm Chemical Reagent (Shijiazhuang, China). Boric acid (H3BO3) was purchased from Tianjin Third Chemical Reagent Factory (Tianjin, China). Phosphoric acid (H3PO4) was obtained from Tianjin Standard Technology Co., Ltd. Doxorubicin (DOX) was obtained from Shanghai Yuanye Biotechnology (Shanghai, China). Glioma cells SH-SY5Y came from the Cell Bank of Peking Union Medical College (Beijing, China).
2.2 Preparation of N-CDs
N-CDs were prepared by a one-step hydrothermal method with citric acid as the carbon source and hexamethylenetetramine as the nitrogen source. In brief, citric acid and hexamethylenetetramine (the mass of citric acid was 0.4000 g, the molar ratio of citric acid and hexamethylenetetramine was 1: 0.1, 1: 0.3, 1: 0.5, 1: 0.7, 1: 1, or 1: 2) were dissolved in 8 mL redistilled water, then stirred for 10 min until all dissolved. The mixture was transferred to a 25 mL Teflon autoclave and heated at 200 °C for 10 h. The obtained black-brown solution was centrifuged, and the supernatant was dialyzed. The purified product was N-CDs.
The fluorescence quantum yield (QY) of N-CDs was calculated by the reference method according to our previous reports (Shi et al., 2021, Zhang et al., 2019).
2.3 Characterization of N-CDs
N-CDs were characterized by transmission electron microscopy (TEM) using a JEM 100SX (Hitachi, Japan). N-CDs (5 µL) was dropped onto amorphous carbon-coated copper grids; the excess solution was removed with filter paper. And then TEM images were obtained. Fourier transform infrared (FT-IR) spectra were carried out using KBr pressed disk technique on an FT-IR-8900 spectrophotometer (Shimadzu, Japan) ranging from 500 to 4000 cm−1. The powder of N-CDs was ground and pressed, and then PXRD of the product was performed on a D8 Advance X-ray Diffractometer (Cu Ka radiation, l = 1.54178 Å) (Bruker, Karlsruhe, Germany). N-CDs was put into a nuclear magnetic tube and dissolved in D2O, and then 13C NMR was performed in D2O NMR on a Bruker DMX-500 spectrometer (500.13 MHz, Germany). The concentration of N-CDs was 0.0500 mg/mL and UV–Vis spectra were recorded from 200 nm to 800 nm using a UV–Vis spectrophotometer (Cary 60, Agilent Technologies, US). The Photoluminescence (PL) spectra were measured by the fluorescence spectrophotometer (F-4600, Hitachi) and the concentration of N-CDs was 0.0050 mg/mL. N-CDs was pasted on the sample table by conductive glue and XPS measurements were undertaken on an ESCALAB 250Xi X-ray Photoelectron Spectrometer microprobe using a monochromatic Al-K X-ray source (h = 1486.68 eV) (Thermo Fisher, Waltham, MA, USA).
2.4 Preparation of N-CDs-DOX
N-CDs and DOX were mixed at different mass ratios (mN-CDs: mDOX = 1: 0.5, 1: 1, 1: 1.2, 1: 1.5, 1: 2, 1: 2.5, or 1:3) in redistilled water and stirred continuously for 12 h under the dark. The mixed solution was placed in redistilled water and dialyzed, then N-CDs-DOX solution was obtained. The product was stored at 4 °C.
The drug loading ratio (LR) was calculated according to the following formula:
mDOX and mN-CDs were calculated by examining the absorbance of DOX and N-CDs of N-CDs-DOX at 488 nm and 320 nm, respectively (Zhang et al., 2019).
2.5 Methyl thiazolyl tetrazolium (MTT) assay
The cell viability of different samples was studied by methyl thiazolyl tetrazolium (MTT) assay. SH-SY5Y cells (human neuroblastoma cell line SY5Y) were seeded in a 96-well plate at a density of 1 × 10⁵ cells/well (set as six replicate wells), and cultivated for 24 h at 37 °C under 5% CO2. Then the cells were incubated with different concentrations (0.625, 1.25, 2.5, 5 µg/mL) of free DOX or N-CDs-DOX compared with N-CDs for 24 h, respectively. After washing, MTT solution (5 mg/mL) was added and incubated for 4 h. Then, the medium was removed, and 150 µL of dimethyl sulfoxide (DMSO) solution was added to each well. The consequence was analyzed quantitatively by recording the absorbance at 488 nm on the Microplate Reader.
2.6 Single/two-photon images
SH-SY5Y cells were seeded in a 28.2 mm cell culture dish, 12.5 μg/mL N-CDs, DOX, or N-CDs-DOX were added to the petri dish, respectively, and incubated for 3 h at 37 °C in 5% CO2. Then cells were washed three times with PBS, and the images were taken with an Olympus (Japan)-based point scanning FV1000 confocal fluorescence microscope. At the excitation wavelengths of 488 nm (to excite DOX) and 800 nm (to excite N-CDs), respectively, one-photon and two-photon fluorescence images of N-CDs-DOX in cells were detected.
2.7 In vitro release of N-CDs-DOX
The release behaviour of N-CDs-DOX was measured at different pH conditions. 2 mL N-CDs-DOX solution was put into a dialysis bag (MWCO 1000 Da) against 80 mL PBS buffer (pH = 7.4 or pH = 6.5) to purify. In vitro release systems were protected from light and stirred slowly in an incubator shaker (60 rpm, 37 °C; ZHWY-200B, Zhicheng, China). At a certain time interval, a special volume (1 mL) of dialysate was taken out, and the same volume (1 mL) of PBS buffer was added simultaneously. Then the cumulative release of DOX from N-CDs-DOX was calculated.
3 Results and discussion
3.1 Characterization of N-CDs
The fluorescence quantum yield (QY) of N-CDs was 16.29 % according to the reference method (reference to quinine sulfate, QY = 0.55) when the molar ratio of citric acid to hexamethylenetetramine was 1:0.5 (Fig. S1).
The TEM image showed that the N-CDs were spherical particles with an average size of 4.28 nm and exhibited good dispersion (Fig. 1A). The FT-IR spectrum of N-CDs displayed characteristic absorption bands. The tensile vibration of O–H/N–H could be seen at 3420 cm−1. The peaks near 1771 cm−1 and 1697 cm−1 in the spectrum belonged to C⚌O stretching vibration. The peaks at 1439 cm-1and 1388 cm−1 were assigned to the bending vibration of C⚌N and C—H, respectively, and 1286 cm−1 was the stretching vibration of C—N (Fig. 1B). In addition, the asymmetric stretching and bending vibration of O—C—O were observed at 1132 cm−1 and 669 cm−1, respectively. 2362 cm−1 and 1439 cm−1 were the absorbance of C—H and N—H respectively. These results indicated that the N element was incorporated into CDs successfully and the surface of N-CDs was rich in functional groups such as —NH2, —COOH, and —OH.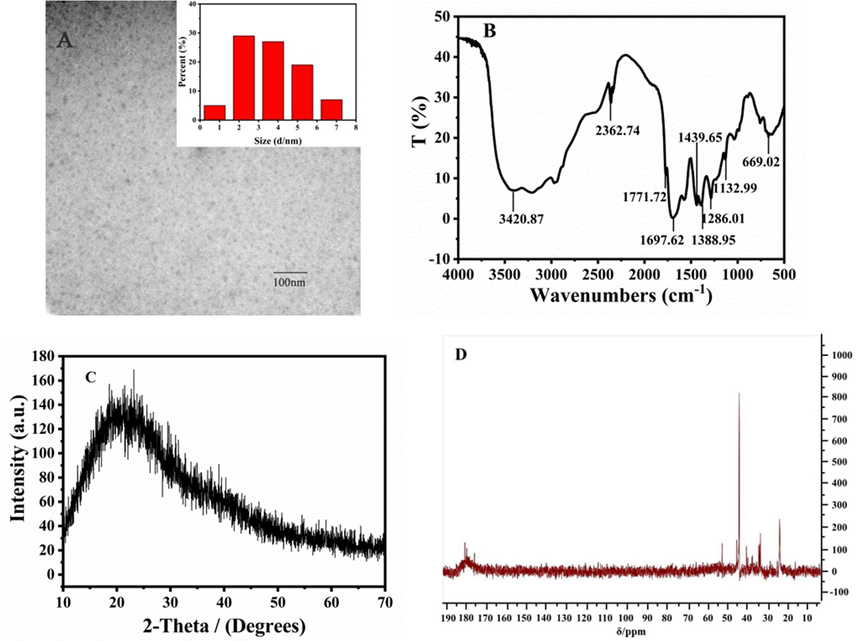
Characterization of N-CDs: (A) TEM image (inset of particle size histograms of the N-CDs); (B) FT-IR; (C) PXRD pattern, and (D) 13C NMR spectrum.
The PXRD pattern of N-CDs showed a broad peak at around 2θ = 23° (Fig. 1C), which corresponded to the amorphous carbon phase (Liu et al., 2014). 13C NMR spectra could distinguish the aliphatic sp3-hybridized and sp2-hybridized carbon atoms (Fig. 1D). It showed that the signals in the range of 20–60 ppm related to C—O with sp3 hybridization, and peaks of 170–185 ppm were attributed to carboxyl/amide groups of sp2-hybridized carbon atoms (Shi et al., 2021).
XPS research was a powerful method to analyze the surface functional groups and chemical composition of N-CDs. As shown in Fig. 2A, the full survey spectrum of N-CDs exhibited three typical peaks at 285 eV, 400 eV, and 531 eV, which belonged to C 1s, N 1s, and O 1s, respectively. The high-resolution of the C1s spectrum (Fig. 2B) was fitted into three peaks represented C—C/C⚌C (284.7 eV), —COOH (285.66 eV), and C—N (288.05 eV), respectively (Lesani et al., 2020). The N1s spectrum (Fig. 2C) was fitted into two peaks at 399.94 eV and 401.83 eV, representing C—N—C and N—C3, respectively (Gong et al., 2015). The O1s spectrum (Fig. 2D) was fitted into two peaks at C—O/C⚌O (531.56 eV) and C—O (533.24 eV) groups, respectively (Ye et al., 2019).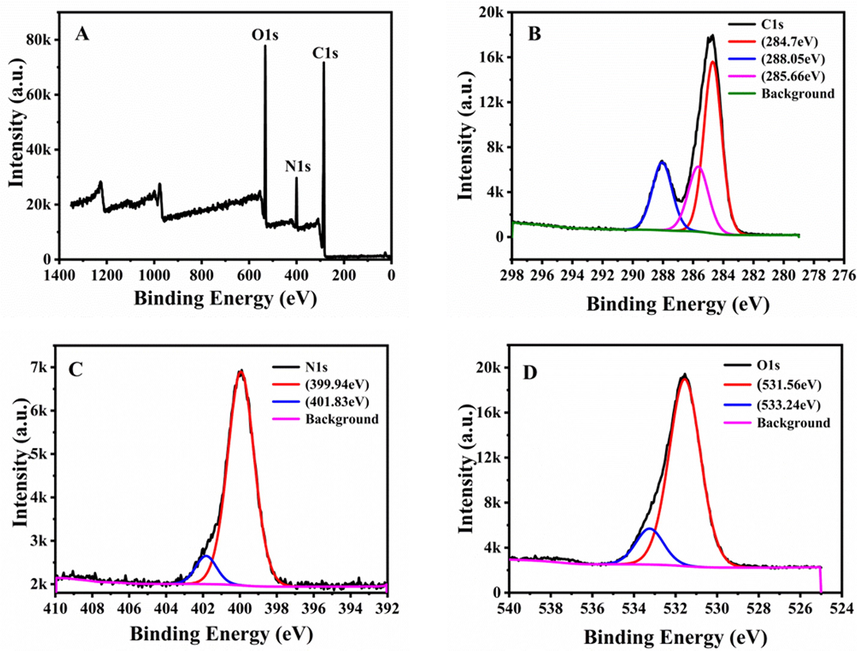
XPS of the N-CDs: (A) full-survey, (B) C 1s, (C) N 1s, and (D) O 1s spectra.
The XPS and the FT-IR spectra showed that the surface of N-CDs was rich in various functional groups: hydroxyl, amino, and carboxyl groups, which provided favourable conditions for the connecting of inorganic, organic, polymer, or biological materials on the surface of N-CDs (Liu et al., 2016).
3.2 Optical properties of N-CDs
The UV–vis absorption spectrum of N-CDs showed a typical absorption peak at 320 nm, which was attributed to the n-π* electronic transition of C⚌O (Zhang et al., 2018) (Fig. 3A). The optimal excitation and emission peaks of N-CDs were symmetrical and located at 315 nm and 420 nm, respectively (Fig. 3B). The emission spectrum of N-CDs was depended on the excitation wavelength, and the emission peaks were red-shifted when the excitation wavelength changed from 300 nm to 400 nm (Fig. 3C).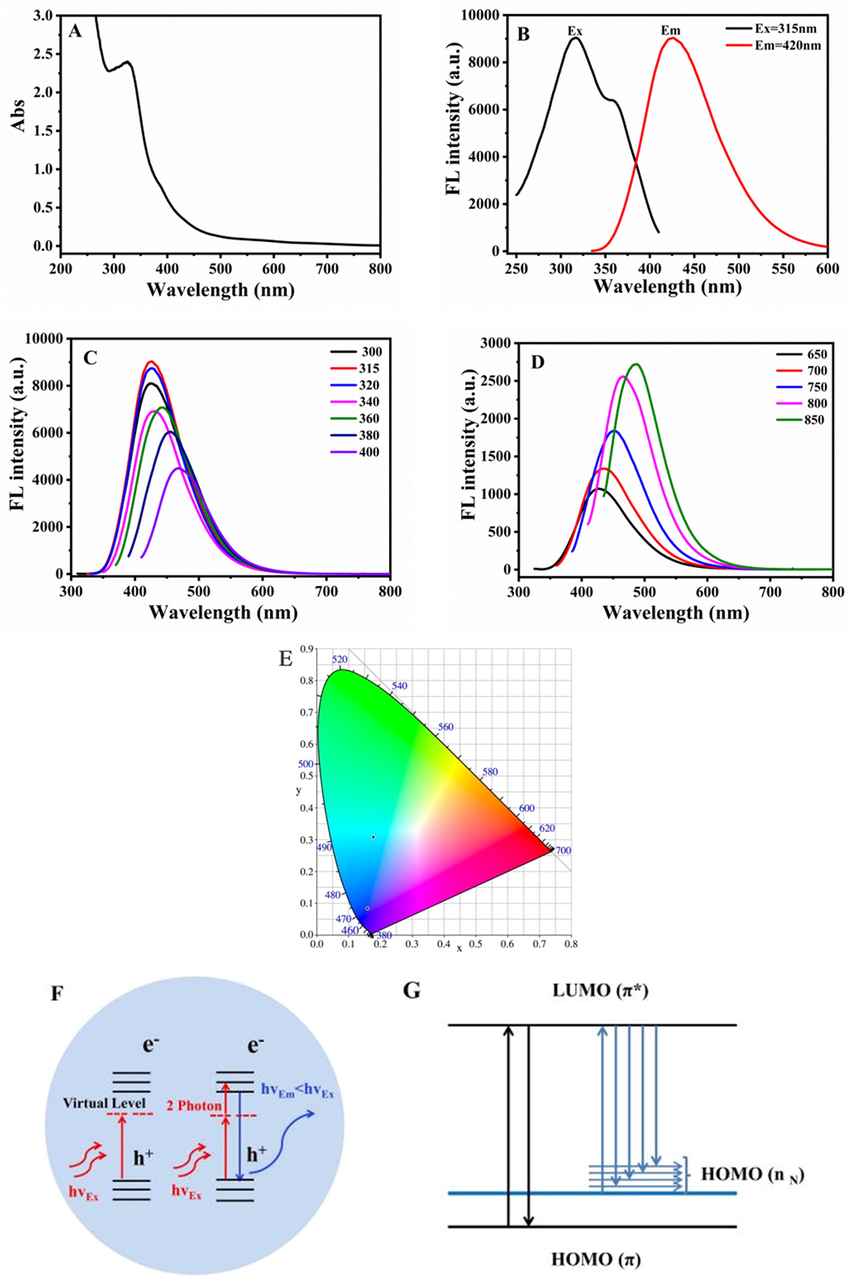
Optical properties and fluorescence mechanism of N-CDs: (A) The UV–Vis absorption spectra, (B) excitation and emission spectra, (C) Down-conversion fluorescence emission spectra, (D) Up-conversion fluorescence spectra, (E) Colour coordinates, (F) Up-conversion mechanism, and (G) Orbital energy of N-CDs.
To our excitement, the obtained N-CDs had up-conversion properties, which could avoid UV damage in cell experiments. When the excitation wavelength increased from 650 nm to 850 nm, the emission intensity of N-CDs gradually increased, and the position of emission peaks was red-shifted from 420 nm to 500 nm (Fig. 3D). The colour coordinate diagram showed that N-CDs had down- and up-conversion properties, that was, N-CDs emitting blue light under ultraviolet light and blue-green light under long-wavelength excitation (Fig. 3E).
We speculated the up-conversion and emission red-shift of N-CDs were associated with the N-doping. The incorporation of N atoms could change the electron distribution and surface structure of CDs, which generated intermediate energy levels. It facilitated the direct or continuous absorption of CDs for lower-energy photons and led to the up-conversion phenomenon (Zhao et al., 2021, Zhang et al., 2022) (Fig. 3F). In addition, the N doping could introduce new energy levels between the band gaps of CDs, namely the highest occupied molecular orbital HOMO-N. Due to the non-fixation of N in N-CDs, the orbital energy changes, resulting in multiple HOMO (nN) energy levels, which was the reason for the red-shift of the emission peaks (Li et al., 2021) (Fig. 3G).
Moreover, we explored the fluorescence stability of N-CDs under different ionic strengths and pH conditions. As shown in Fig. S2, to varying concentrations of sodium chloride solution, the fluorescence intensity change could be ignored, and the fluorescence intensity of N-CDs was also stable under the pH condition of the physiological environment. So N-CDs had potential applications in biological systems.
3.3 Formation of N-CDs-DOX
The optimal drug loading of N-CDs was 35.88% when m N-CDs: m DOX at 1:2 (Fig. S3). The drug-loading capacity of N-CDs was higher than reported (Yang et al., 2019, Zhang et al., 2017). The successful combination of N-CDs and DOX could be demonstrated by the UV–Vis spectra (Fig. 4A). The absorption peaks of N-CDs and DOX were located at 320 nm and 488 nm, respectively, which all appeared in N-CDs-DOX with slight blue-shift. It proved the interaction and covalent structure in N-CDs-DOX. It was speculated the formation of Schiff base between the functional groups of –NH2 (N-CDs surface) and –COOH (DOX surface), and the characteristic absorption of —N⚌C— appeared at about 1643 cm−1 (Li et al., 2017) (Fig. 4B and Fig. S4).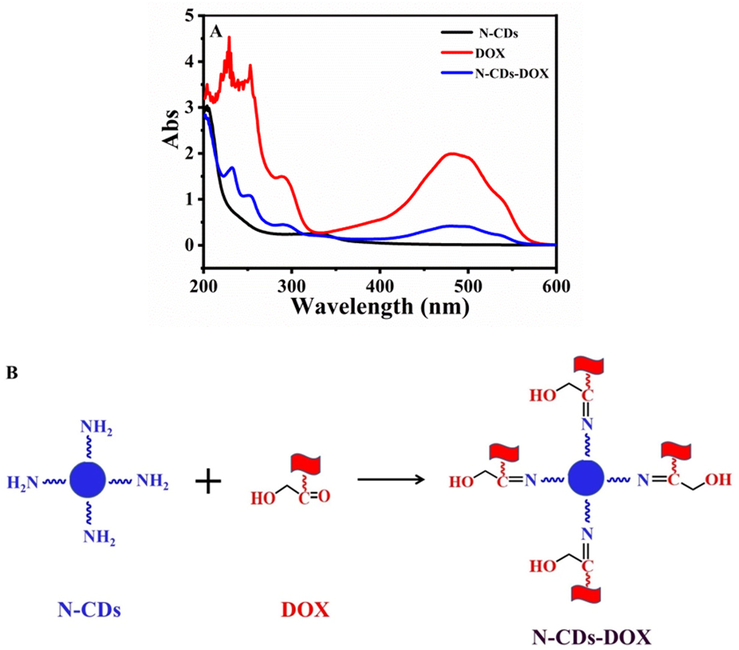
The formation of N-CDs-DOX. (A) UV–vis absorption; (B) Schematic illustration of N-CDs-DOX.
3.4 Cytotoxicity assay
The cell viability of SH-SY5Y cells was detected via the MTT assay (Fig. 5). SH-SY5Y cells were cultured with N-CDs-DOX, N-CDs, or DOX at different concentrations of 0.625–5 μg/mL for 24 h, respectively. It showed that N-CDs had almost no effect on cell viability, but N-CDs-DOX and DOX decreased the cell viability with the concentration increase from 0.625 to 5 μg/mL gradually. And comparing with free DOX, N-CDs-DOX showed lower cytotoxicity, which indicated N-CDs had the potential use for drug delivery.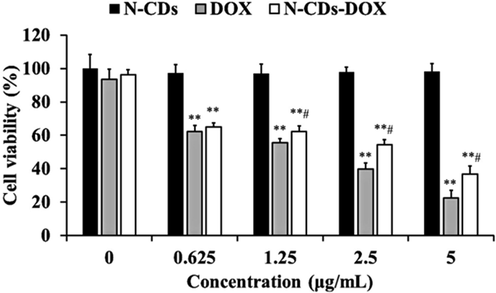
The cell viability of SH-SY5Y cells by the MTT assay. Data are the mean ± standard deviation (SD; n = 6), **P < 0.01 compared with non-treated controls, #P < 0.05 compared with DOX only.
3.5 Colocation of N-CDs and DOX
The colocation of N-CDs and DOX was carried out to observe the N-CDs-DOX in SH-SY5Y cells. Our experiment was different from previous experiments of single-photo images (Wang et al., 2020, Gong et al., 2016), it showed the single/two-photon fluorescence images of DOX, N-CDs, and N-CDs-DOX in SH-SY5Y cells (Fig. 6). It showed that N-CDs had up-conversion property and emitted visible blue fluorescence in the cells under the excitation of 800 nm (Fig. 6A3, A4). And DOX showed bright red fluorescence at the excitation wavelength 488 nm (Fig. 6B2, B4). In the N-CDs-DOX drug carrier system, N-CDs and DOX emitted blue and red fluorescence, respectively, and the merged image showed purple. It suggested that N-CDs delivered DOX into SH-SY5Y cells successfully.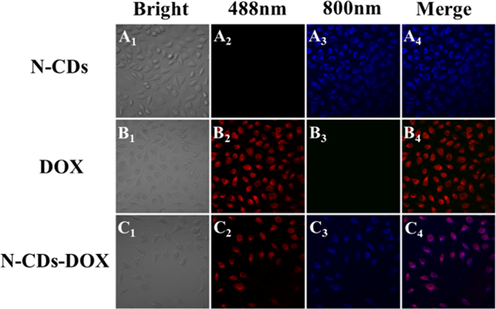
Colocation of N-CDs and DOX in SH-SY5Y cells.
3.6 pH targeted release in vitro
It is known that the pH of normal human tissues and blood is near 7.4, while the pH of the external cell microenvironment tumours is about 6.5 (Song et al., 2007). In our experiment, the PBS buffers (pH = 7.4 or 6.5) simulated the normal tissues or the tumour microenvironment, respectively. The in vitro release curve showed that N-CDs-DOX had sustained release and pH-dependent properties (Fig. 7). The cumulative release ratio was 97% at pH = 6.5, whereas 82% at pH = 7.4 after release for 46 h. This result indicated that the release ability of DOX in an acidic environment was stronger than that in a neutral background. In an acidic environment, the hydrophilic of DOX increased with the protonation of its surface amino groups, which made the —C⚌N— bonds connecting DOX and N-CDs unstable and tended to hydrolysis and breakage (Bao et al., 2019). The pH response property of the N-CDs-DOX system had the potential to improve the effectiveness of cancer treatments.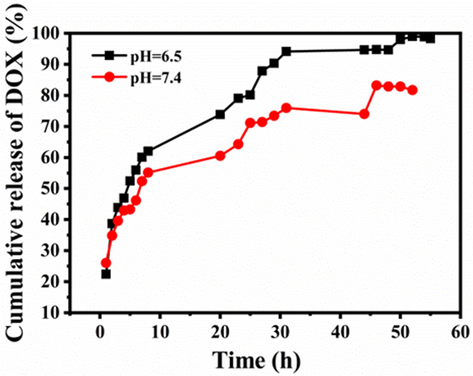
In vitro release of N-CDs-DOX in PBS (pH = 7.4 and 6.5).
3.7 The release mechanism of N-CDs-DOX
To study the release mechanisms of N-CDs-DOX, the release data of N-CDs-DOX at pH 7.4 and 6.5 were fitted by Zero-order, First-order, Weibull, Ritger-Peppas, and Higuchi equations, respectively. The fitting results showed in Fig. 8 and Table S1. According to the fitting coefficient (R2), the most consistent model was determined to be the Weibull model, when N-CDs-DOX were released at pH = 6.5 (R2 = 0.987) and pH = 7.4 (R2 = 0.976). The drug release mechanism was determined by the n of the Ritger-Peppas fitting equation (F = Kptn). Where F represents the amount of drug released, KP represents the release rate constant, and n represents the release index. When n < 0.45, the release mechanism is called Fick diffusion; when the range of n is 0.45 ≤ n ≤ 0.89, it is non-Fick diffusion, and when n > 0.89, it is called skeleton dissolution. The results showed that release exponent n < 0.45 in pH 6.5 (n = 0.284) and 7.4 (n = 0.264) of PBS, therefore, the release mechanism of N-CDs-DOX in the above two release media were all Fick diffusion.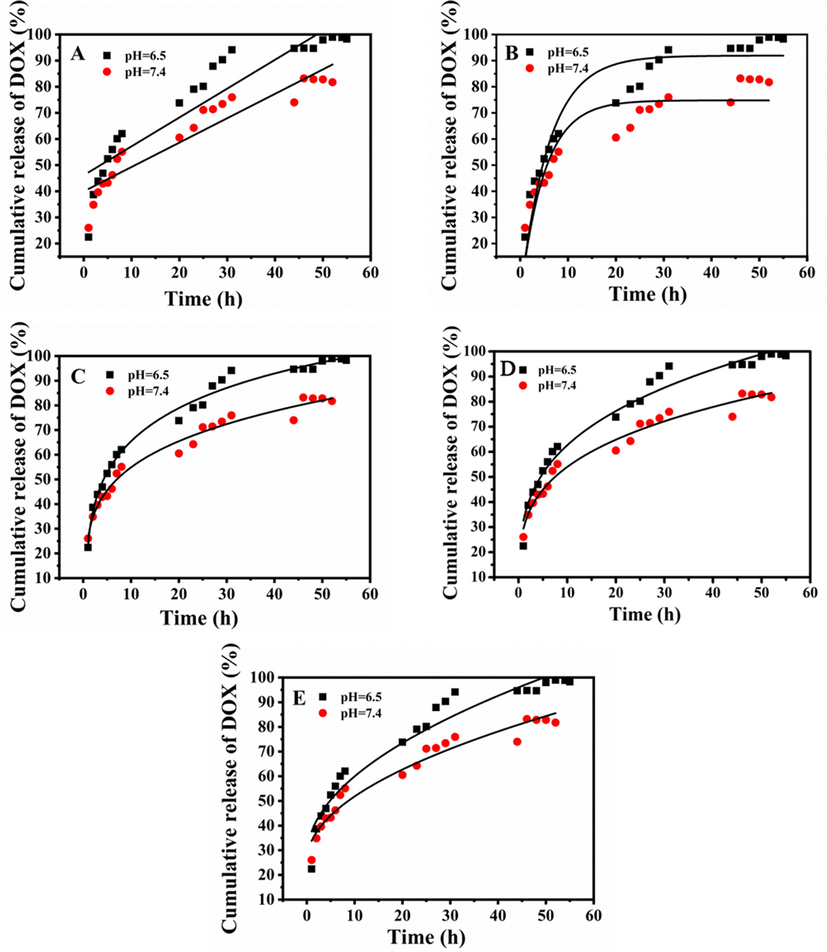
Profiles of N-CDs-DOX release: (A) zero-order, (B) first-order, (C) Weibull, (D) Ritger–Peppas, and (E) Higuchi models.
4 Conclusions
In summary, N-CDs with up-conversion properties are prepared by the hydrothermal method. The prepared N-CDs could carry doxorubicin (N-CDs-DOX drug-carrying system) with a high loading capacity (35.88%). N-CDs-DOX had pH-targeted and sustained release properties. In vitro release experiments showed that the release models of N-CDs-DOX in PBS buffer (pH = 6.5 and 7.4) conformed to the Weibull model, and the release mechanism belonged to Fick diffusion. In addition, using single-photon and two-photon images, N-CDs and DOX could be monitored inside the SH-SY5Y cells in real-time. The significance of the work was that N-CDs could deliver a type of drugs with —C⚌O group for cancer-targeted treatment and be capable of two-photon imaging.
Acknowledgments
This work is supported by grants from the National Natural ScienceFoundation of China (31201305), the Natural Science Foundation of Hebei Province (B2019205054), the Teaching Reform Project of Hebei Normal University (2021XJJG047), and The Project Supported by Science Foundation of Hebei Normal University (L2023J01). We thank Xuerui Fu (Hebei Medical University) for the help of two-photon cell imaging.
Declaration of Competing Interest
The authors declare that they have no known competing financial interests or personal relationships that could have appeared to influence the work reported in this paper.
References
- pH-sensitive carbon quantum dots-doxorubicin nanoparticles for tumor cellular targeted drug delivery. Polym. Adv. Technol.. 2019;30:2664-2673.
- [CrossRef] [Google Scholar]
- One-step synthesis of N-doped carbon dots, and their applications in curcumin sensing, fluorescent inks, and super-resolution nanoscopy. Microchim. Acta. 2019;186
- [CrossRef] [Google Scholar]
- Photonic carbon dots as an emerging nanoagent for biomedical and healthcare applications. ACS Nano. 2020;14:6470-6497.
- [CrossRef] [Google Scholar]
- Carbon dots: the next generation platform for biomedical applications. Mater. Sci. Eng. C-Mater. Biol. Appl.. 2019;96:887-903.
- [CrossRef] [Google Scholar]
- Facile synthesis of nitrogen-doped carbon dots for Fe3+ sensing and cellular imaging. Anal. Chim. Acta. 2015;861:74-84.
- [CrossRef] [Google Scholar]
- Phosphorus and nitrogen dual-doped hollow carbon dot as a nanocarrier for doxorubicin delivery and biological imaging. ACS Appl. Mater. Interfaces. 2016;8:11288-11297.
- [CrossRef] [Google Scholar]
- Novel electrochemical sensors based on cuprous oxide-electrochemically reduced graphene oxide nanocomposites modified electrode toward sensitive detection of sunset yellow. Molecules. 2018;23
- [CrossRef] [Google Scholar]
- Recent developments of carbon dots in biosensing: a review. ACS Sensors. 2020;5:2724-2741.
- [CrossRef] [Google Scholar]
- N-doped carbon dot as fluorescent probe for detection of cysteamine and multicolor cell imaging. Sens. Actuators B-Chemical.. 2019;286:77-85.
- [CrossRef] [Google Scholar]
- A review: recent advances in preparations and applications of heteroatom-doped carbon quantum dots. Dalton Trans.. 2020;49:6915-6938.
- [CrossRef] [Google Scholar]
- Two-Photon dual-emissive carbon dot-based probe: deep-tissue imaging and ultrasensitive sensing of intracellular ferric ions. ACS Appl. Mater. Interfaces. 2020;12:18395-18406.
- [CrossRef] [Google Scholar]
- Highly N, P-doped carbon dots: Rational design, photoluminescence and cellular imaging. Microchim. Acta. 2017;184:2933-2940.
- [CrossRef] [Google Scholar]
- One-step synthesis of N, P Co-doped orange carbon quantum dots with novel optical properties for bio-imaging. Opt. Mater.. 2021;111
- [CrossRef] [Google Scholar]
- Non-Metal-Heteroatom-Doped carbon dots: synthesis and properties. Chemistry. 2019;25:1165-1176.
- [CrossRef] [Google Scholar]
- Carbon dots: surface engineering and applications. J. Mater. Chem. B. 2016;4:5772-5788.
- [CrossRef] [Google Scholar]
- Dual functions of nitrogen and phosphorus co-doped carbon dots for drug-targeted delivery and two- photon cell imaging. Arab. J. Chem.. 2023;16
- [CrossRef] [Google Scholar]
- One-step microwave-assisted polyol synthesis of green luminescent carbon dots as optical nanoprobes. Carbon. 2014;68:258-264.
- [CrossRef] [Google Scholar]
- Electrochemical sensing fabricated with Ta2O5 nanoparticle-electrochemically reduced graphene oxide nanocomposite for the detection of oxytetracycline. Biomolecules. 2020;10
- [CrossRef] [Google Scholar]
- Effects of nitrogen-doping on the photophysical properties of carbon dots. J. Mater. Chem. C. 2019;7:853-862.
- [CrossRef] [Google Scholar]
- Water-soluble, lignin-derived carbon dots with high fluorescent emissions and their applications in bioimaging. J. Ind. Eng. Chem.. 2018;66:387-395.
- [CrossRef] [Google Scholar]
- Theranostic carbon dots 'clathrate-like' nanostructures for targeted photo-chemotherapy and bioimaging of cancer. J. Ind. Eng. Chem.. 2017;56:62-73.
- [CrossRef] [Google Scholar]
- Nucleolus-Targeted photodynamic anticancer therapy using renal-clearable carbon dots. Adv. Healthc. Mater.. 2020;9
- [CrossRef] [Google Scholar]
- Biocompatible nitrogen-doped carbon dots: synthesis, characterization, and application. J. Mater. Chem. B. 2020;8:CP7-8951.
- [CrossRef] [Google Scholar]
- Determining critical parameters that influence in vitro performance characteristics of a thermosensitive liposome formulation of vinorelbine. J. Control. Release. 2020;328:551-561.
- [CrossRef] [Google Scholar]
- Carbon dots; the smallest photoresponsive structure of carbon in advanced drug targeting. J. Drug Delivery Sci. Technol.. 2020;55
- [CrossRef] [Google Scholar]
- Amino-modified carbon dots as a functional platform for drug delivery: load-release mechanism and cytotoxicity. J. Ind. Eng. Chem.. 2021;101:372-378.
- [CrossRef] [Google Scholar]
- Thermographic assessment of tumor growth in mouse xenografts. Int. J. Cancer. 2007;121:1055-1058.
- [CrossRef] [Google Scholar]
- New insights into the activities and toxicities of the old anticancer drug doxorubicin. FEBS J.. 2021;288:6095-6111.
- [CrossRef] [Google Scholar]
- Enhanced-fluorescent imaging and targeted therapy of liver cancer using highly luminescent carbon dots-conjugated foliate. Mater. Sci. Eng. C-Mater. Biol. Appl.. 2020;116:13.
- [CrossRef] [Google Scholar]
- Heteroatom-doped carbon dots: synthesis, characterization, properties, photoluminescence mechanism and biological applications. J. Mater. Chem. B. 2016;4:7204-7219.
- [CrossRef] [Google Scholar]
- Nitrogen-doped fluorescent carbon dots used for the imaging and tracing of different cancer cells. RSC Adv.. 2019;9:24852-24857.
- [CrossRef] [Google Scholar]
- beta-Cyclodextrin-Decorated carbon dots serve as nanocarriers for targeted drug delivery and controlled release. ChemNanoMat. 2019;5:479-487.
- [CrossRef] [Google Scholar]
- A red emissive two-photon fluorescence probe based on carbon dots for intracellular pH detection. Small. 2019;15
- [CrossRef] [Google Scholar]
- Au-Decorated N-Rich carbon dots as peroxidase mimics for the detection of acetylcholinesterase activity. Acs Appl. Nano Mater.. 2022;5:1958-1965.
- [CrossRef] [Google Scholar]
- High drug-loading system of hollow carbon dots-doxorubicin: preparation, in vitro release and pH-targeted research. J. Mater. Chem. B. 2019;7:2130-2137.
- [CrossRef] [Google Scholar]
- pH-Sensitive N-doped carbon dots-heparin and doxorubicin drug delivery system: preparation and anticancer research. RSC Adv.. 2017;7:9347-9356.
- [CrossRef] [Google Scholar]
- Doxorubicin-Loaded carbon dots lipid-coated calcium phosphate nanoparticles for visual targeted delivery and therapy of tumor. Int. J. Nanomed.. 2020;15:433-444.
- [CrossRef] [Google Scholar]
- Folic acid-conjugated green luminescent carbon dots as a nanoprobe for identifying folate receptor-positive cancer cells. Talanta. 2018;183:39-47.
- [CrossRef] [Google Scholar]
- Au/N-Doped carbon dot nanozymes as light-controlled anti- and pro-oxidants. Acs Appl. Nano Mater.. 2021;4:7253-7263.
- [CrossRef] [Google Scholar]
- Ta2O5/rGO nanocomposite modified electrodes for detection of tryptophan through electrochemical route. Nanomaterials. 2019;9
- [CrossRef] [Google Scholar]
Appendix A
Supplementary material
Supplementary data to this article can be found online at https://doi.org/10.1016/j.arabjc.2023.105067.
Appendix A
Supplementary material
The following are the Supplementary data to this article:Supplementary data 1
Supplementary data 1


