Optimization and validation of stability indicating RP-HPLC method for the quantification of gefitinib in bulk drug and nanoformulations: An application towards in vitro and ex vivo performance evaluation
⁎Corresponding author at: Department of Pharmaceutics, Delhi Pharmaceutical Sciences & Research University, New Delhi 110017, India. prof.geetaaggarwal@gmail.com (Geeta Aggarwal)
-
Received: ,
Accepted: ,
This article was originally published by Elsevier and was migrated to Scientific Scholar after the change of Publisher.
Peer review under responsibility of King Saud University.
Abstract
Gefitinib (GFB) is an epidermal growth factor receptor (EGFR) tyrosine kinase inhibitor used primarily to treat non-small cell lung cancer (NSCLC), but it also works by lowering AKT and MAPK phosphorylation, which makes it effective against the breast cancer cells. A high-performance liquid chromatography (HPLC) method was developed for detecting gefitinib by C18 analytical column with mobile phase containing acetonitrile and 1 % w/v ammonium acetate in water with ratio of 60:40. Box-Behnken design was used to optimize the chromatographic conditions, and method was validated for accuracy, precision, linearity, robustness, ruggedness, limit of detection, and limit of quantification. The developed method was found to be useful in estimating gefitinib in conventional marketed tablet dosage forms and nanoformulations such as SLNs and liposomes. With a calibration curve, linearity was attained in the drug concentration range of 8–56 µg/mL (r2 = 0.9996), and sensitivity was found to be 1.3 and 3.9 µg/mLas LOD and LOQ, respectively. All the validation criteria for the method were within the acceptable limits. The drug content in the conventional tablet formulation was found to be 99.99 %. The HPLC analysis indicated that gefitinib was highly soluble in Precirol ATO5 as solid lipid and tween 80 as surfactant. Drug entrapment efficiency was found to be 83.1 % and 80.5 % for SLNs and liposomes respectively. In vitro release data revealed that 30 % of drug was released from plain suspension and more than 77 % released from both nanoformulations after 24 h at pH 7.4 respectively. By applying kinetic fit, data was most appropriately fitted into first order as compared to other. The apparent permeability of gefitinib from plain suspension, SLNs and Liposomes was found to be 3.98 × 10⁻⁴ cm/min, 1.35 × 10⁻⁴ cm/min and 1.79 × 10⁻⁴ cm/min.
Keywords
Gefitinib
Breast cancer
Experimental design
Method validation
Marketed tablet
Permeationstudy
1 Introduction
Gefitinib (GFB), a first generation EGFR tyrosine kinase inhibitor,approvedby USFDA for the treatment of advanced Non-small cell lung cancer (NSCLC).It inhibits EGFR autophosphorylation by binding to competitive ATP sites thus reducing tumour cell proliferation (Zhang et al., 2020). Chemically, GFB is N-(3-chloro-4-fluorophenyl)-7-methoxy-6-(3-morpholin-4-ylpropoxy) quinazolin-4-amine hydrochloride with molecular weight of 446.902 g/mol (Fig. 1) (Tanaka et al., 2004).Apart from being used in NSCLC and mitophagy, it is also used in the treatment of breast cancer. In one study, it was proved that GFB was well tolerated with recurrent endometrial /ovarian or primary peritoneal carcinoma (Leslie et al., 2013).It also stimulates PINK1/Parkin-mediated mitophagy via OPTN which is useful in the treatment of neurodegenerative diseases associated with impaired mitophagy (Li et al., 2022).
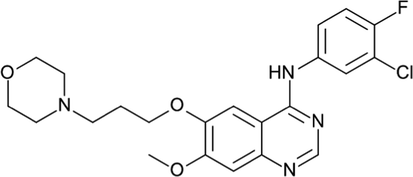
- Chemical structure of drug gefitinib (C22H24ClFN4O3).
There are various analytical methods like HPLC,liquid chromatography-mass spectroscopy (LC/MS), ultra-performance liquid chromatography (UPLC), gas chromatography (GC), high performance thin layer chromatography (HPTLC), vierordt’s method etc.have been developed in literature for quantification of GFB(Alam et al., 2022, Venkataramanna et., al 2011; Zhao et., al 2005; Kotte et.,al 2012).Among these methods, HPLC is a highly reproducible and easily available method for determining the purity and uniformity of API and their dosage forms. It provides a substantial contribution to the advancement of analytical research work in a variety of disciplines, including food, clinical medicine, polymers, plastics, and environmental area. The rapid speed, high sensitivity, simultaneous detection, and automated operation are some unique benefits that increasing HPLC technological sophistication (Sharma et al., 2018).
Literature investigations revealed that only few analytical methods of GFB are available for quantitative in bulk as well as inpharmaceutical formulations as mentioned in table S1 (Chandrashekara et al., 2014; Ks et al., 2017; Vijetha and Reddy, 2020; Zheng et., al 2016). Majority of the research reports on GFB were found to be in the non-referred journals and were practically difficult to reproduced. Besides, there are only few authenticated research papers that quantify GFB in bulk form through analytical HPLC method. Besides, none of the reportedliterature havediscussed on the implementation of analytical Quality by Design (QbD)approach for GFBquantification. QbD conceptemployed in analytical method development aid to improve method performance and quality consistency as compared to the standard method development techniques. To improve analytic techniques and reduce the number of tests required, Design of Experiments (DOE) approach helps identifying the critical method variables that influencesthe method performance. Many analytical approaches have been published in earlier studies, using Box-Behnken design (BBD) for the optimization of chromatographic conditions but no one have utilized for the quantification of GFB HPLC parameters.
In the submitted research work, however, the method development was performed with the column and mobile phase composition which are not reported in any of the existing literature reports on gefitinib. The current work intends to develop and optimize the reverse phase HPLC method for the quantification of GFBby quality-by-design approach (QbD) approach using Box-Behnken design (BBD). The application of QbD concepts in the analytical method provides a means for dealing with complex interaction of different variables to overcome optimization challenges and develop a control strategy for routine use of the analytical method. This newly developed RP-HPLC method using QbD approach has a lower risk of failure and high consistency to obtain the reproducible outcomes that are characterised by high levels of robustness, ruggedness, accuracy, and precision. Moreover, the developed assay method was applied for the estimation of the drug content in the marketed tablet dosage form and developed nanoformulations. Further, we employed the developed method for solubility analysis of drug in lipids and surfactants, drug entrapment efficiency calculation, estimation of the in vitro release and ex vivo permeation of the drug from the nanoformulations.
2 Material methods
Gefitinib (GFB) was purchased from TCI chemicals, Tokyo, Japan. All solvents like methanol, ammonium acetate and acetonitrile of HPLC grade were purchased from Fisher Scientific, New Delhi, India. Dialysis membrane were acquired from Himedia, Mumbai, India. Precirol ATO 5 were obtained as gift sample from Gattefose, India. Tween 80 was purchased from SD Fine Chemicals, Mumbai, India. Cholesterol and phospholipid were procured from Sigma Aldrich, USAand Lipoid, Germany.
2.1 Chromatographic conditions
Shimadzu-10ATVP binary pump system were used for the development of HPLC method that was attached to UV detector. The separation of analyte was done using specific reverse phase analytical column, i.e., octadecysilane, C18 column with 4.6 × 250 mm i.d. and 5 µm particle size. Acetonitrile (ACN): ammonium acetate (1 %) with ratio 60:40 and 1.0 mL/min was selected as the mobile phase and flow rate. The total run time was less than 20 min. before analysis all solvents were degassed and filtered with 0.22 µm nylon filter. In order to determine the UVabsorption maxima, UV spectraof GFBwas recorded using Shimadzu 2000 spectrophotometer.
2.2 Preparation of standard and working solutions
The analyte standard solution was prepared in methanol by adding 10 mg of drug in 10 mL of solvent and labelled as 1000 µg/mLstandard solution. Then transferred 1 mL into 10 mL of volumetric flask and labelled it as 100 µg/mL stock solution. Afterwards, working solutions was prepared in the concentration range of 8 to 56 µg/mL using serial dilution method. Moreover, quality control (QC) samples were prepared to obtained reproducible and specific results. Quality control samples i.e. LQC, MQC, HQCalong with LLOQ were prepared at the concentration of 5 µg/mL, 25 µg/mL, 50 µg/mL and 75 µg/mL.After preparation, all samples were filtered to protect the column and prevent from the clogging of particulates.
2.3 Optimization of HPLC method
Box-Behnken design was used to optimise the independent factors i.e. %ACN concentration (A), the flow rate (B) and %ammonium acetate (C). During optimization, low (-1), medium (0) and high level (+) were selected for each factor. For ACN (%) it was selected as 40, 60 and 80 regarded as low, medium and high whereas for ammonium acetate (%) it was selected as 0.5, 1.0 and 1.5 respectively. Flow rate were fixed in the range of 0.7 to 1.3 mL/min. A total 15 runs were constructed with the assistance of four dependent variables (peak area, RT, theoretical plates and tailing factor) and three independent variables, and the experiment was carried out in triplicate with concentration of 100 µg/mL as shown in table S2. This design generated three centre points. The optimized data was analysed using mathematical model in order to obtained polynomial equation (1). Various parameters like ANOVA, lack of fit, p value, surface mapping, predicted and surface r2 were ascertained using 3 dimensions response surface plots. The research surface methodology was used to obtained the relationship between dependent and independent variables.
Where, β0 = intercepts; β1,β2,β3; β12,β13,β23; β11,β22,β33, and AB,AC,BC,A2,B2,C2were called as liner; interaction and coefficients.
2.4 Method validation
The developed method was validated using various parameters like linearity, accuracy, precision, system suitability, sensitivity, robustness, ruggedness, etc. Stability studies were performed at different temperatures for 30 days.
2.4.1 System suitability test
This test is crucial during the development of liquid chromatographic processes as it ensures that the overall testing apparatus is appropriate for the intended purposes of the procedure being developed. Test was performed at all quality control samples i.e. 5, 25, 50, 75 µg/mLby injecting six replicates.The theoretical plates, RT, peak area, and tailing factor of analyte were investigated. According to the US-FDA guidelines, the relative standard deviation (%RSD) for RT should be less than 2, and tailing factor should not exceed by two, and theoretical plates should be greater than 2000 (Jagdale et al., 2021).
2.4.2 Linearity
Linearity is defined as a method's capacity to give test findings that are proportionate to the analyte concentrations present in the sample.Calibration curve was used to test linearity, and the results were displayed against the concentration (x-axis) and peak area (y-axis). This parameter was measured by injecting six different analyte concentrations ranging from 8 to 56 µg/mL (70 % to 130 %) with triplicates. The regression coefficient was computed using the calibration curve and response factor was calculated by dividing the peak area with analyte concentration (Ravisankar et al., 2021).
2.4.3 Robustness
This test measures the applicability of a method by modifying the minor alterations in the experimental parameters like wavelength of analyte (250 to 258 nm), column temperature (20 to 30 °C) and the injection volume (15 to 25 µL). The influence of these variations was investigated at MQC sample with three replicates. The robustness of the system was determined by calculating the % RSD of the mean peak area, tailing factor, number of theoretical plate and RT of analyte. Their limits should not be exceeded as mentioned in previous study (Mangla et al., 2020a).
2.4.4 Accuracy
Accuracy means closeness between expected and obtained value. Three replicates of all QC samples were injected and calculate the accuracy in terms of %RSD and standard error (SE) that should be within accepted range. % Recovery was calculated by dividing recovered concentration to injected concentration which should be in between 90 and 110 % and SE should be within 2 % of the mean value (Ramaswamy and Dhas, 2018).
2.4.5 Ruggedness
Ruggedness is described as the tendency to reproduce a test result. In this study,two different analysts were performed the optimized method on all QC samples. Moreover, studywas performed on two different instruments with same environment and chromatographic conditions. Results were calculated in terms of recovery with n = 3 and it should be within the acceptable range (Mangla et al., 2020a).
2.4.6 Precision
The precision was calculated in terms of intra and inter day analysis using all QC samples. Samples were analysed at same inter day and at different three intra days. % RSD of peak area were calculated for precision study (Kavathia, et al., 2017).
2.4.7 Sensitivity
LOD and LOQ was calculated for sensitivity measurement by dividing K*standard deviation of peak response area with slope (calculated from calibration curve); where K = 3.3 and 10 for LOD and LOQ. Sensitivity means single to noise ratio i.e., 3:1 and 10:1 and calculated in terms of % RSD (n = 3) which should not more than 10 % (Ranjan et al., 2019).
2.4.8 Stability studies
Shortterm, long-term and freeze–thaw stability was conducted at different time intervals on all QC samples according to the ICH Q1A (R2). Short term stability study was conducted for 4 hrs and 12 hrs at room temperature whereas long-term stability was performed for two weeks at − 20℃. In freeze, samples were freeze at − 20℃ and then thaw at room temperature for 24 hrs. Samples were analysed in terms of % recovery with triplicate (Mangla 2020b).
2.5 Preparation of nanoformulation
The optimized HPLC validated method was utilized for the quantification of analyte which was loaded in nanoformulation. In this study, two nanoformulations were prepared i.e. SLNs and Liposomes. The proposed method was used to calculate the entrapment efficiency and in vitro release of analyte in both nano formulations.
2.5.1 Preparation of analyte loaded solid lipid nanocarrier system (SLNs)
SLNs containing analyte was prepared by using ultrasonication technique using solid lipid as. Precirol ATO 5 and surfactant as tween 80. SLNs was prepared by adding lipid phase having analyte in aqueous phase that was made up of tween 80 and water. This whole mixing undergoes continues stirring for 45 min at 800 rpm. Primary emulsion was formed and then sonicate it with the help of probesonicater and finally obtained SLNs nanocarrier system containing analyte.
2.5.2 Preparation of analyte loaded liposomes
Liposomes was prepared by using previous reported thin film hydration method. In this method, phospholipid and cholesterol were dissolved in the ratio of 70:30using methanolin round bottom flask for 10 min and then analyte was added. Afterwards, solvent wasevaporatedusing rota evaporator under reduced pressure and obtained thin lipid film. The traces of Organic solvent were removed by putting the RBF in desiccator for 10 hrs. Film was hydrated using milli-Q water by rotating RBF for 40 min at 150 rpm. Dispersion was then probe sonicated for 2 min and finally obtained liposomes loaded analyte nanocarrier system (Singh et al., 2020).
2.6 Analysis of a GFB in conventional formulation
The content of GFB in conventional tablet was determined with the label the claim of 250 mg/tablet. AstraZeneca Pharma India ltd manufactured GFB tablet with the brand name of Iressa®. In this study, 20 tablets were weighed and powdered. GFBequivalent to 250 mg was transferred into a 250 mL volumetric flask containing 100 mL methanol. Then sample was sonicated and diluted up to 250 mg with methanol. Centrifugation was done and quantified the supernatant using above proposed HPLC method.
2.7 Application of the developed HPLC method
2.7.1 Selection of solid lipid
Selection of solid lipid was done on the basis of maximum solubility of drug in it. Solid lipid includesGelucire 43/01, Glyceryl caprylate, Precirol ATO5,Apifil, Tefose-63. This study is based on the capacity of solid lipid to solubilize the drug. Accurately weighed quantity of drug, i.e., 10 mg and solid lipid (250 mg) were placed in a beaker and heated above the melting point of solid lipid. The excess amount of solid lipid was then gradually added until it produced a clear solution. The amount of solid lipid was quantified to solubilize 10 mg of drug. Quantification was carried out through developed HPLC method.
2.7.2 Selection of surfactants
Saturation solubility approach was employed to check the solubility of drug in various surfactant solution (1 %). Surfactants includes sodium deoxycholate, tween 80, labrasol, tween 20. Specific quantity of surfactant, i.e., 2 mL was taken in glass vials and excess amount of drug was added until saturation solubility was attained. The aforementioned HPLC method was then used to determine the amount of drug solubilize in surfactant.
2.7.3 Entrapment efficiency
Entrapment efficiency of analyte was measured by separating the unencapsulated drug from the prepared nanoformulations. The specific quantity of sample was centrifuged at 12,000 rpm for 30 min and then obtained supernatant was dissolved in methanol for further calculation. Entrapment efficiency of analyte was measured using equation (2).
2.7.4 In vitro drug release
The in vitro release study of was conducted by USP XXIV method in a dialysis bag. Three groups were used to calculate the in vitro release i.e. analyte plain suspension, analyte loaded SLNs and liposomes. In this study, phosphate buffer saline pH 7.4 was used as dissolution medium and dialysis bag (molecular weight cut off 10 kDa) was soaked overnight in it. All samples were placed in separate dialysis bags, with both ends tied. The bags were immersed in 50-mL dissolution media containing 0.5 % v/v tween 80 for 24 hrs at 37 °C. After specific interval of time i.e. 0.25, 0.5, 1, 2, 4, 8, 12, 18, and 24 hrs, the sample was withdrawn through a side tube and replaced with an equal amount of fresh dissolution medium. The amount of analyte was determined using this developed HPLC method. The cumulative release data were entered into the zero-order, first-order, Hixson-Crowell, Higuchi, and Korsmeyer-Peppas release kinetics models, and the model with highest correlation coefficient (r2) was chosen as the best fitted.
2.8 Animal study
2.8.1 Intestinal permeability study of GFB
Female Wistar rats were used for the intestinal permeation study. 150–200 g weight and 2–3 months rats was used. Rats were approved in DPSRU through IAEC with protocol number IAEC/2022/I-R05. Before starting the experiments, rats were fasted overnight and supplied with water. Intestinal permeation study of GFB was performed by noneverted sac gut model. In this study, intestine of rat was removed and washed with saline. Then GFB suspension was loaded into it and secure tightly with threads. GFBloaded intestine was submerge in Tyrode solution and kept for 2hrs. At specific interval of time i.e. 30, 60, 90 and 120 min, sample was withdrawn and amount of GFBpermeated into intestine was quantified through above proposed HPLC method. The graph was plotted between the cumulative amount of drug permeated (μg) versus time (min). After that, apparent permeation of GFBwas calculated through the following equation (3).
Apparent permeation of GFB (cm/min);
F = Permeation flux (mg/cm2/min).
Co = Initial concentration of the drug in theintestine (μg/ml).
A = Total surface area of the tissue.
3 Results and discussion
3.1 Preliminary method development
In the preliminary method development exercise, UV absorption of the drug was evaluated and the spectrum observed is shown in Fig. 2. It showed two peaks i.e. 254, 331 nm but λmax of GFB was found to be at 254 nm. Further, a range of mobile phase mixtures i.e. %ACN:Ammonium acetate(40:60, 60:40 and 80:20)were investigated where 60:40 with ammonium acetate (1 %) revealed good chromatographic separation.
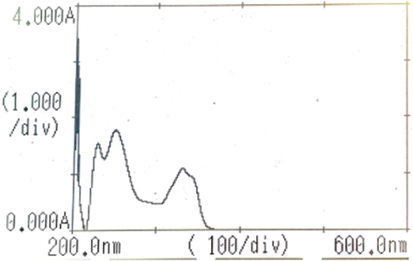
- U.V. spectra of gefitinib (showed two peaks i.e. 254, 331 nm but λmax of gefitinib was at 254 nm).
3.2 Optimization of chromatographic conditions
BBD was successfully applied for the optimization of the experimental conditions, resulting in three-dimensional graphs that depict the relationship between independent and dependent variables as shown in Figs. 3 & 4. To analyse the data, a quadratic polynomial model was used. Data analysis revealed that predicted and adjusted r2 values were in close agreement with each other. A response surface analysis was carried out using 3D plots, which revealed a curvilinear effect as a result of interactions between the variables as shown in Figs. 3 and 4. The effect of independent variables i.e.,ACN concentration (A), flow rate (B), ammonium acetate concentration (C) on dependent responses such as retention time (Y1), peak area (Y2), theoretical plates (Y3), tailing factor (Y4)was predicted by polynomial equations (3–6). The polynomial equation has been employed in addition to determining the significant relationship between the variables and their respective responses.
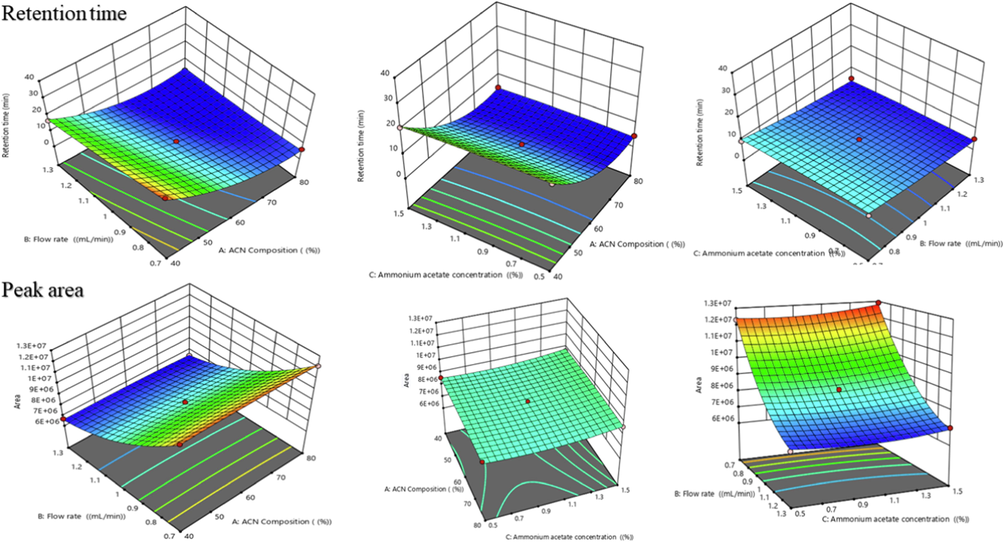
- Three-dimensional surface plots showing the influence of different process variables i.e. ACN %, flow rate, Ammonium acetate % on responses such as retention time and peak area of plain gefitinib.
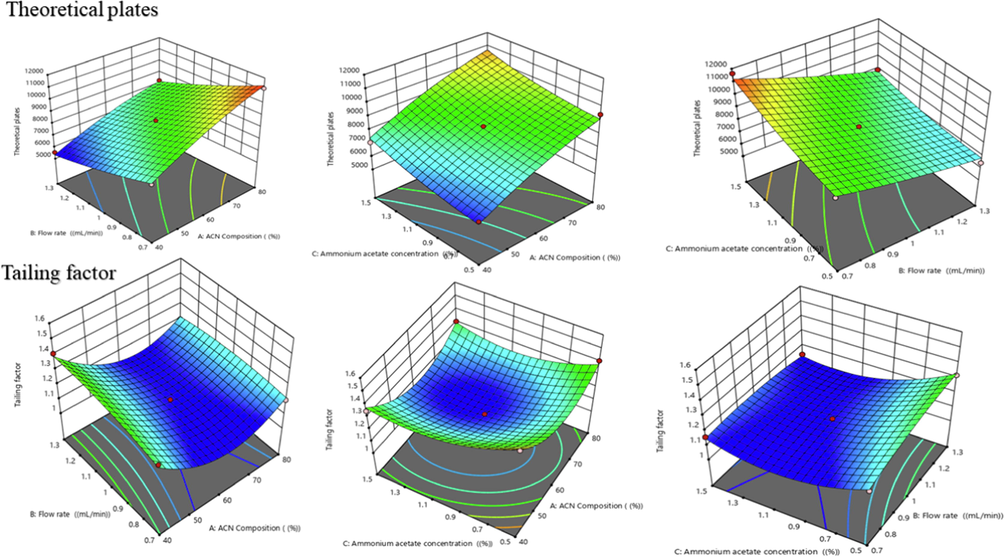
- Three-dimensional response surface graphs showing the influence of different process variables i.e., ACN %, flow rate, Ammonium acetate % on responses such as theoretical plates and tailing factor of plain gefitinib.
3.2.1 Effect of independent variables (A,B,C) on retention time (Y1)
The retention time of drug was observed to be varying in the range of 3.4 to 30.5 min as shown in table S2 and Fig. 3 showed their 3D plots. The effect of ACN Concentration (%), flow rate (mL/min)and ammonium acetate concentration (%) on retention time is shown in equation (4). It was found to be statistically significant with predicted and adjusted r2 value was less than one, i.e., 0.8414 and 0.9705. The correlation coefficient(r2) was found to be 0.9895 which indicated excellent model fitness with the observed data. Retention time showed positive relationship with the amount of ACN (A) and inverse relationship with the flow rate (B) and amount of ammonium acetate (C). Moreover, ACN concentration showed prominent effect on retention time.
3.2.2 Effect of independent variables (A, B, C) on peak area (Y2)
The peak area (Y2) response was found in a range of 6,402,250 to12916000 as summarized in table S2. The influence of the independent variables on the peak area is presented in Eq. (5) and it was statistically significant and model fitting with quadratic polynomial equation was observed. The predictedand adjusted r2values were found in reasonable agreement with each other.From response surface diagrams Fig. 3, it was observed that peak area was significantly increases by increasing the flow rate and ammonium acetate concentration. However, it decreases by increases the concentration of ACN.
3.2.3 Effect of independent variables (A,B,C) on theoretical plates (Y3)
The theoretical plates of proposed method were found in the range of 5541to 11,648 as brief in table S2 and Fig. 4. The effect of ACN Composition (%), flow rate (mL/min) and ammonium acetate concentration (%) on retention is given in Eq.5. It was found to be statistically significant with predicted and adjusted r2 values whereas r2was found to be0.9821. According to the Eq. (6), it was ascertained that theoretical plates have positive relationship with the amount of ACN (A) and ammonium acetate (C). It showed negative effect with flow rate, and with increase in flow rate, number of theoretical plates decreases. All three independent variables showed prominent effect on theoretical plates.
3.2.4 Effect of independent variables (A,B,C) on tailing factor (Y4)
The tailing factor (Y4) response was found in a range of 1.1 to 1.5 as summarized in table S2 and Fig. 4. The influence of the independent variables on the peak area is represented in Eq. (7) and it was statistically significant and fitted to quadratic model. The predicted and adjusted r2 was found in reasonable agreement with each other. From the response surface diagrams, it was observed that peak area was significantly increases by increasing the flow rate and decreases by increasing the concentration of ACN and ammonium acetate.
3.3 Method validation
3.3.1 System suitability test
After six replicate injections of all QC samples, the % RSD of tailing factor and peak area was found to be in the range of 0.65 to 1.66 % and 0.12 to 0.35 respectively as shown in table S3. The number of theoretical plates of the column was found in their limits with RT6.554is shown in Fig. 5. The findings were computed and found to be within accepted limits, confirming that the system is capable of producing data of acceptable quality.
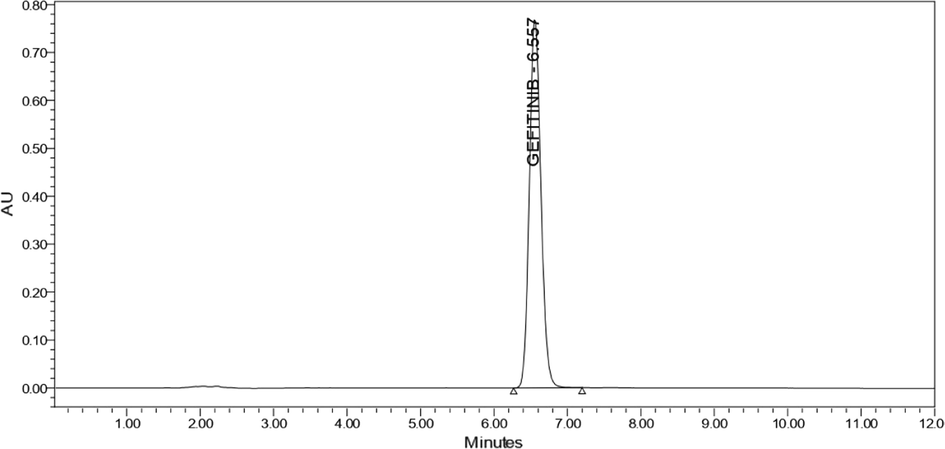
- Typical chromatogram of gefitinib at optimized chromatographic conditions.
3.3.2 Linearity
Linearity curve was plotted against the peak area and concentration of analyte over the concentration range of 8–56 µg/mL as shown in Fig. 6. The results were found to be linear with r2valueof 0.9996 (y = 93976x-76400). These findings demonstrated a linear connection between the mean peak area and the analyte concentration. The response factor analysis of linearity is shown in Fig. 7.
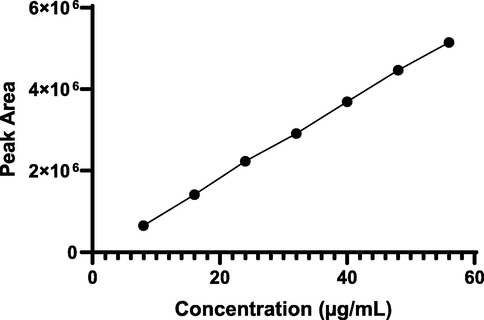
- Linear calibration curve of analyte.
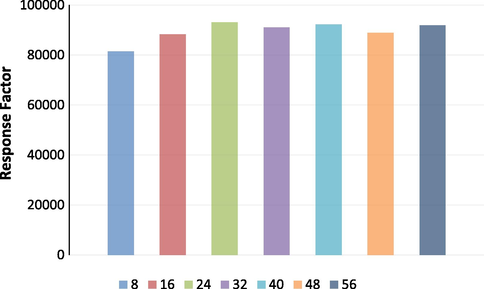
- Response factor of analyte.
3.3.3 Accuracy
The results of accuracy showed percentage recovery at all three QC levels ranged from 98.5 to 101.2 % with % RSD of 1.09–1.56 %. The results were within the accepted limits indicated that the method could be used for regular drug analysis.
3.3.4 Precision
All QC levels were found to have % RSD of peak area in the range of 0.12 to 1.56, and 0.23 to 1.22 for inter and intra-day precision, respectively. In accordance with the results, the developed method demonstrated high accuracy as well as reproducibility, with less than 2 % of %RSD.
3.3.5 Sensitivity
For the LOD and LOQ, the signal-to-noise ratios were found to be 3:1 and 10:1, respectively. The LOD and LOQ were determined to be 1.3 and 3.9 µg/mL, respectively, which demonstrated that the developed method was quite sensitive for analysis.
3.3.6 Robustness
Table S4 summarises the robustness results at MQC levels, demonstrating that minor changes in method parameters had no significant impact on theoretical plates, RT, and tailing factor of analyte. As a result, the developed system found to be durable and robust.
3.3.7 Ruggedness
The results of ruggedness are shown in Table S5. The results revealed that the mean % recovery values of analyte at LLOQ, LQC, MQC, and HQC did not differ substantially when the test were performed in two separate instruments with two different analysts.
3.3.8 Stability studies
QC levels were used to assess analyte stability under various storage temperature.The accuracy of all QC samples was found to be more than 98 % which was within acceptable limits as shown in table S6. It indicates that analyte samples were stable at all temperatures, including freeze–thaw cycles, short–term storage, and long–term storage conditions.
3.4 Analysis of GFB in conventional tablet formulation
The drug content evaluationin the conventional tablet formulation was found to be 99.99 %. The results were in accordance to the label claimed and indicated that there was no excipient effect in the estimation of drug which can be clearly evident from the chromatogram shown in Fig. 8.
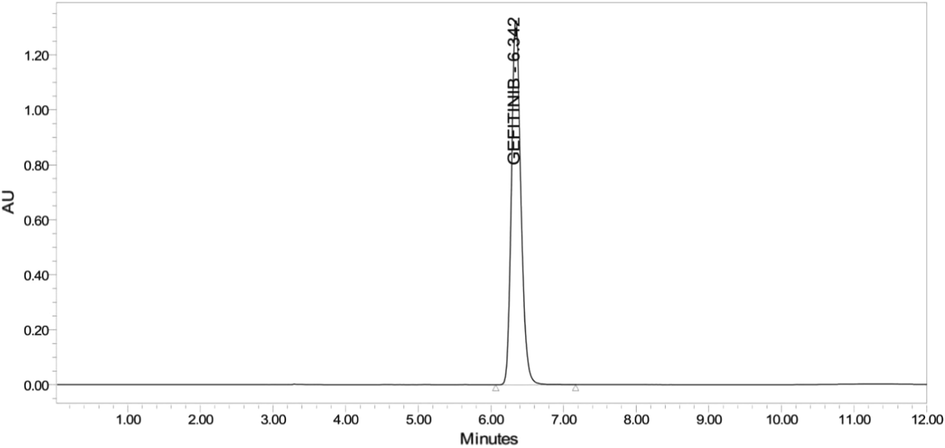
- Chromatogram of gefitinib in conventional tablet.
3.5 Application of developed method in nanoformulation development
3.5.1 Selection of solid lipid
GFB quantification in solid lipids was carried out with the developed HPLC method. It was found that 590 ± 8.33 mg of Precriol ATO5 required todissolve 10 mg of gefitinib, thus selected for the preparation of SLNs. Other solid lipids required high amount to solubilize the 10 mg of GFBas shown in Fig. 9.
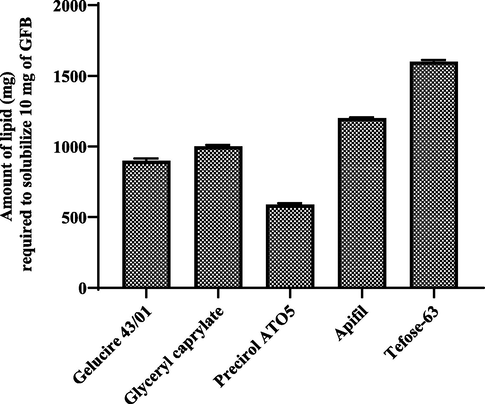
- Solubility study of gefitinib in different solid lipids (mean ± S.D.).
3.5.2 Selection of surfactants
The results of solubility data of GFB in surfactants are shown in Fig. 10. The HPLC analysis indicated that GFB was highly soluble in tween 80 as compared to other surfactant like sodium deoxycholate, labrasol, and tween 20.
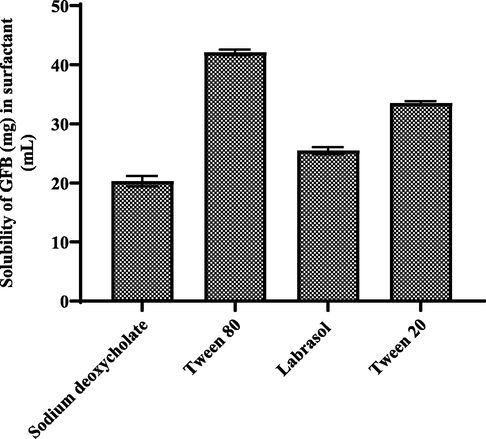
- Solubility study of gefitinib in different surfactants (mean ± S.D.).
3.5.3 Entrapment efficiency
Drug entrapment efficiency was found to be 83.1 % and 80.5 % for SLNs and liposomes, respectively. The findings demonstrated that analyte were successfully entrapped in both formulations. Moreover, SLNs exhibited superior entrapment efficiency as compare to other due to the presence of solid lipid which has more voids to entrap the analyte. Furthermore, the drug's RT in both formulations was found to be unchanged and chromatograms are shown in Fig. 11.

- Chromatogram of gefitinib in nanoformulation (A) SLNs and (B), Liposomes.
3.5.4 In vitro release
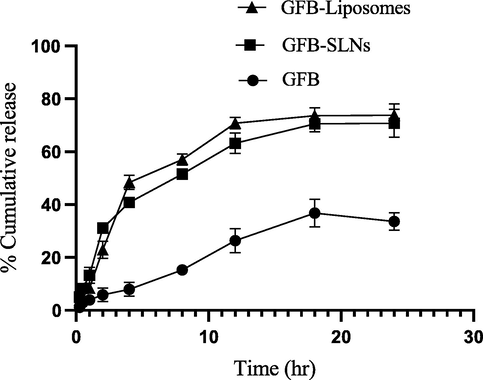
In vitro release data at pH 7.4 are shown in Fig. 12.It was observed that 30 % of drug was released from plain suspension and more than 77 % released from both nanoformulations after 24 h respectively. To analyse the drug release mechanism, the release pattern is fitted into several kinetic models. By applying kinetic fit, datawas most appropriately fitted into first order as the highest value of the r2 was observed in this model as compared to other i.e., Korsmeyer–Peppas model, zero-order kinetics, Higuchi model and Hixson–Crowell model. The observed findings revealed that there was no significant change in the in vitro release of analyte from both nanoformulations.
-
In vitro release of analyte from plain suspension, SLNs and liposomes (mean ± S.D.).
3.6 Intestinal permeation study
The intestinal permeation of GFB was quantified through above proposed HPLC method. The graph between the cumulative amount of drug permeated (μg) versus time (min) are shown in Fig. 13. The apparent permeability of GFB from plain suspension, SLNs and Liposomes was found to be 3.98 × 10⁻⁴ cm/min, 1.35 × 10⁻⁴ cm/min and 1.79 × 10⁻⁴ cm/min. The apparent permeability coefficient (Papp) of GFB from liposomes and SLNs was significantly higher (p less than 0.05) than that of plain suspension. These outcomes could be due to enhanced GFB dissolution as well as improved intestinal permeability after incorporation of GFB in nanocarriers.
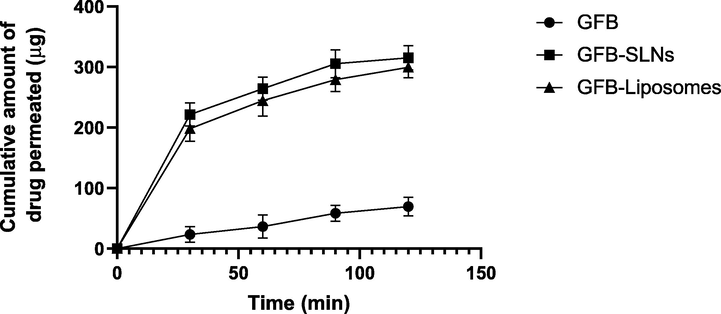
- Intestinal permeation study of gefitinib from plain suspension, SLNs and Liposomes (Cumulative amount of drug permeated (μg) vs time) (min); (mean ± S.D.).
4 Conclusions
The HPLC method is relatively simple, fast, accurate, and precise for the separation of impurities and quantitative determination of gefitinib in API, as well as in pharmaceutical nano formulations. The method was optimised using a design of expert optimization technique with three independent and four dependent variables. The development of a sensitive and analytical QbD-based HPLC method for drug quantification was facilitated by this strategy, which assisted in scouting critical method parameters such as mobile phase composition, flow rate. The gefitinib RP-HPLC method was validated in accordance with ICH guidelines, and the implementation of an analytical approach improved robustness and performance significantly. Furthermore, to our knowledge, this is the first time a gefitinib HPLC method was established using QbD and their application in nanotechnology for the detection of entrapment efficiency and in vitro release. In this study, gefitinib loaded SLNs and liposomes was prepared. Entrapment efficiency and in vitro release of gefitinib from nanoformulations were calculated using proposed method. Finally, it was concluded that the proposed RP-HPLC method was might be employed for the bioanalytical estimation of gefitinib in clinical pharmacokinetic studies.
Acknowledgement
The authors extend their appreciation to the Deputyship for Research and Innovation, Ministry of Education in Saudi Arabia, for funding this research work through project number 20-UQU-IF-P1-001. The authors would like to thank the Deanship of Scientific Research at Umm Al-Qura University for supporting this work by Grant code (22UQU4310387DSR25). The authors also extend their appreciation to the Deanship of Scientific Research at King Khalid University for funding this work through small group project under grant number RGP.1/173/43.
Declaration of Competing Interest
The authors declare that they have no known competing financial interests or personal relationships that could have appeared to influence the work reported in this paper.
References
- Determination of gefitinib using routine and greener stability-indicating HPTLC methods: a comparative evaluation of validation parameters. Processes. 2022;10:762.
- [Google Scholar]
- Separation and estimation of process-related impurities of gefitinib by reverse-phase high-performance liquid chromatography. J. Chromatogr. Sci.. 2014;52:799-805.
- [Google Scholar]
- Development and validation of RP-HPLC method for estimation of brexpiprazole in its bulk and tablet dosage form using quality by design approach future. J. Pharm. Sci.. 2021;7:1-12.
- [Google Scholar]
- Development and validation of RP-HPLC and UV-spectrophotometric methods for rapid simultaneous estimation of amlodipine and benazepril in pure and fixed dose combination. Arab. J. Chem.. 2017;10:S3021-S3028.
- [Google Scholar]
- Kotte et al., 2012 S.C.B. Kotte, R.R. Ch, V.K. Tulam, S. Raghavan, D. PK, M. PM, M Qualitative analysis of Gefitinib by Quadrupole–Time of Flight (LCMS) Coupled with PDA and ELSD Detectors, using dual Electrospray Ionization Int. J. Res. Pharm., 3 (2012), pp. 113-119
- Validation of HPLC method for quantitative determination of gefitinib in polymeric nanoformulation. Pharm. Chem. J.. 2017;51:159-163.
- [Google Scholar]
- A Phase II evaluation of Gefitinib in the treatment of persistent or recurrent endometrial cancer: a gynecologic oncology group study. Gynecol. Oncol.. 2013;129:486.
- [CrossRef] [Google Scholar]
- Gefitinib facilitates PINK1/Parkin-mediated mitophagy by enhancing mitochondrial recruitment of OPTN. Fundam. Res. 2022
- [CrossRef] [Google Scholar]
- Systematic development and validation of RP-HPLC method for simultaneous estimation of tamoxifen and sulphoraphane with specific application for nanolipidic formulations. Arab. J. Chem.. 2020;13:7909-7920.
- [Google Scholar]
- Validation of forced degradation and stability indicating studies of Tamoxifen in nanoformulation using spectroscopic technique. Mater. Today: Proc.. 2020;26:3265-3270.
- [Google Scholar]
- Development and validation of analytical method for quantitation of Emtricitabine, Tenofovir, Efavirenz based on HPLC. Arab. J. Chem. 2018;11:275-281.
- [Google Scholar]
- Method development and validation of exemestane and stress degradation studies using UV spectrophotometry. Lat. Am. J. Pharm.. 2019;38:414-423.
- [Google Scholar]
- Development and validation of RP-HPLC method for the determination of Ticagrelor (an antiplatelet agent) in pharmaceutical dosage form. Futur. J. Pharm. Sci.. 2021;7:142.
- [CrossRef] [Google Scholar]
- Development of a validated liquid chromatographic method for quantification of sorafenib tosylate in the presence of stress-induced degradation products and in biological matrix employing analytical quality by design approach. Biomed. Chromatogr.. 2018;32
- [CrossRef] [Google Scholar]
- PEGylated liposomes as an emerging therapeutic platform for oral nanomedicine in cancer therapy: In vitro and in vivo assessment. J. Mol. Liq.. 2020;303
- [Google Scholar]
- Qualitative analysis of gefitinib by quadrupole -time of flight (LCMS) coupled with PDA and ELSD detectors, using dual electrospray ionization. Anal. Sci.: X-Ray Struct. Anal. Online. 2012;20(2004)
- [CrossRef] [Google Scholar]
- Identification of degradant impurity in Gefitinib by using validated RRLC method. Am. J. Anal. Chem.. 2011;02:75-83.
- [CrossRef] [Google Scholar]
- Solubility studies of gefitinib by validated high pressure liquid chromatographic method. J. Sci. Res.. 2020;64:44-49.
- [CrossRef] [Google Scholar]
- Comparative study of intratracheal and oral gefitinib for the treatment of primary lung cancer. Eur. J. Pharm. Sci.. 2020;2020:1-38.
- [CrossRef] [Google Scholar]
- Specific method for determination of gefitinib in human plasma, mouse plasma and tissues using high performance liquid chromatography coupled to tandem mass spectrometry. J. Chromatogr. B. Analyt. Technol. Biomed. Life. Sci.. 2005;819:73-80.
- [CrossRef] [Google Scholar]
- Simultaneous determination of gefitinib and its major metabolites in mouse plasma by HPLC-MS/MS and its application to a pharmacokinetics study. J. Chromatogr. B. Analyt. Technol. Biomed. Life. Sci.. 2016;1011:215-222.
- [CrossRef] [Google Scholar]
Appendix A
Supplementary material
Supplementary data to this article can be found online at https://doi.org/10.1016/j.arabjc.2022.104333.
Appendix A
Supplementary material
The following are the Supplementary data to this article:


